-
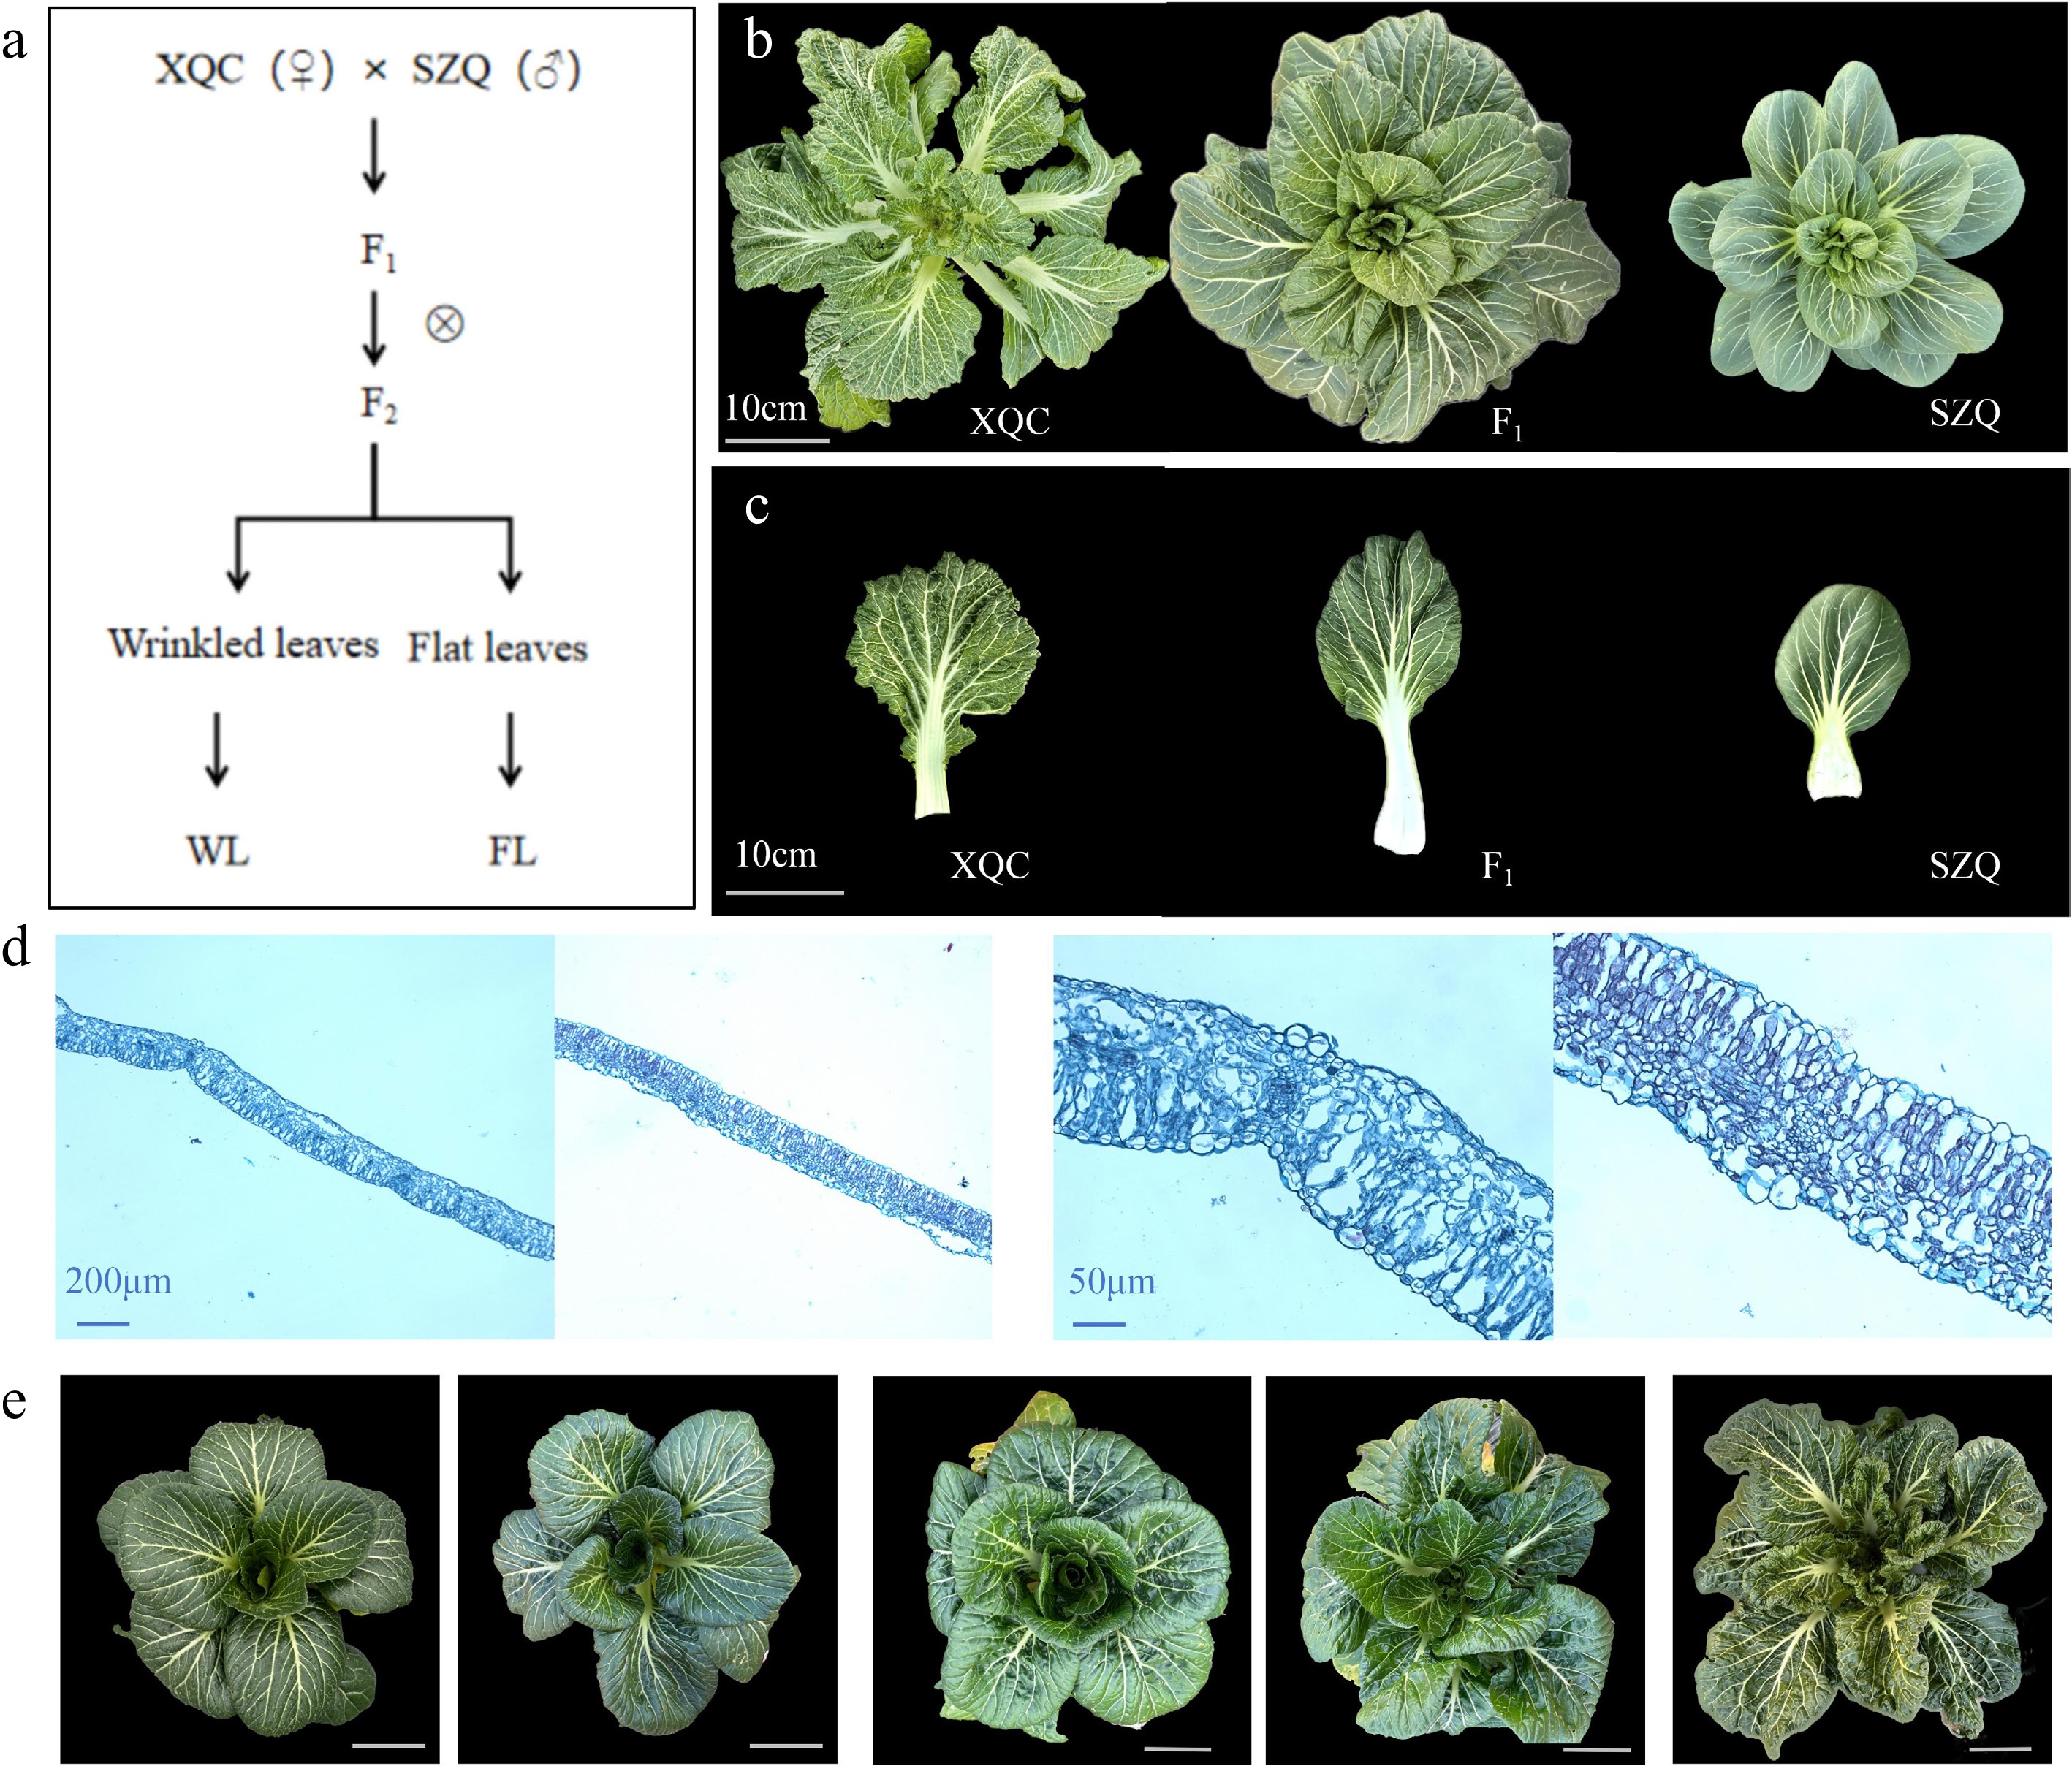
Figure 1.
Segregating population construction and related phenotypes. (a) Population construction scheme. (b) Plants (left to right): 'XQC' (♀), F1 'SZQ' (♂); scale bar = 10 cm. (c) Leaf comparison of parents and F1; scale bar = 10 cm. (d) Longitudinal sections of parental leaves (left: 'XQC'; right: 'SZQ'); scale bars = 200 μm (left), 50 μm (right). (e) F2 population phenotypic grading (Grades 1–5, left to right); scale bar = 10 cm.
-
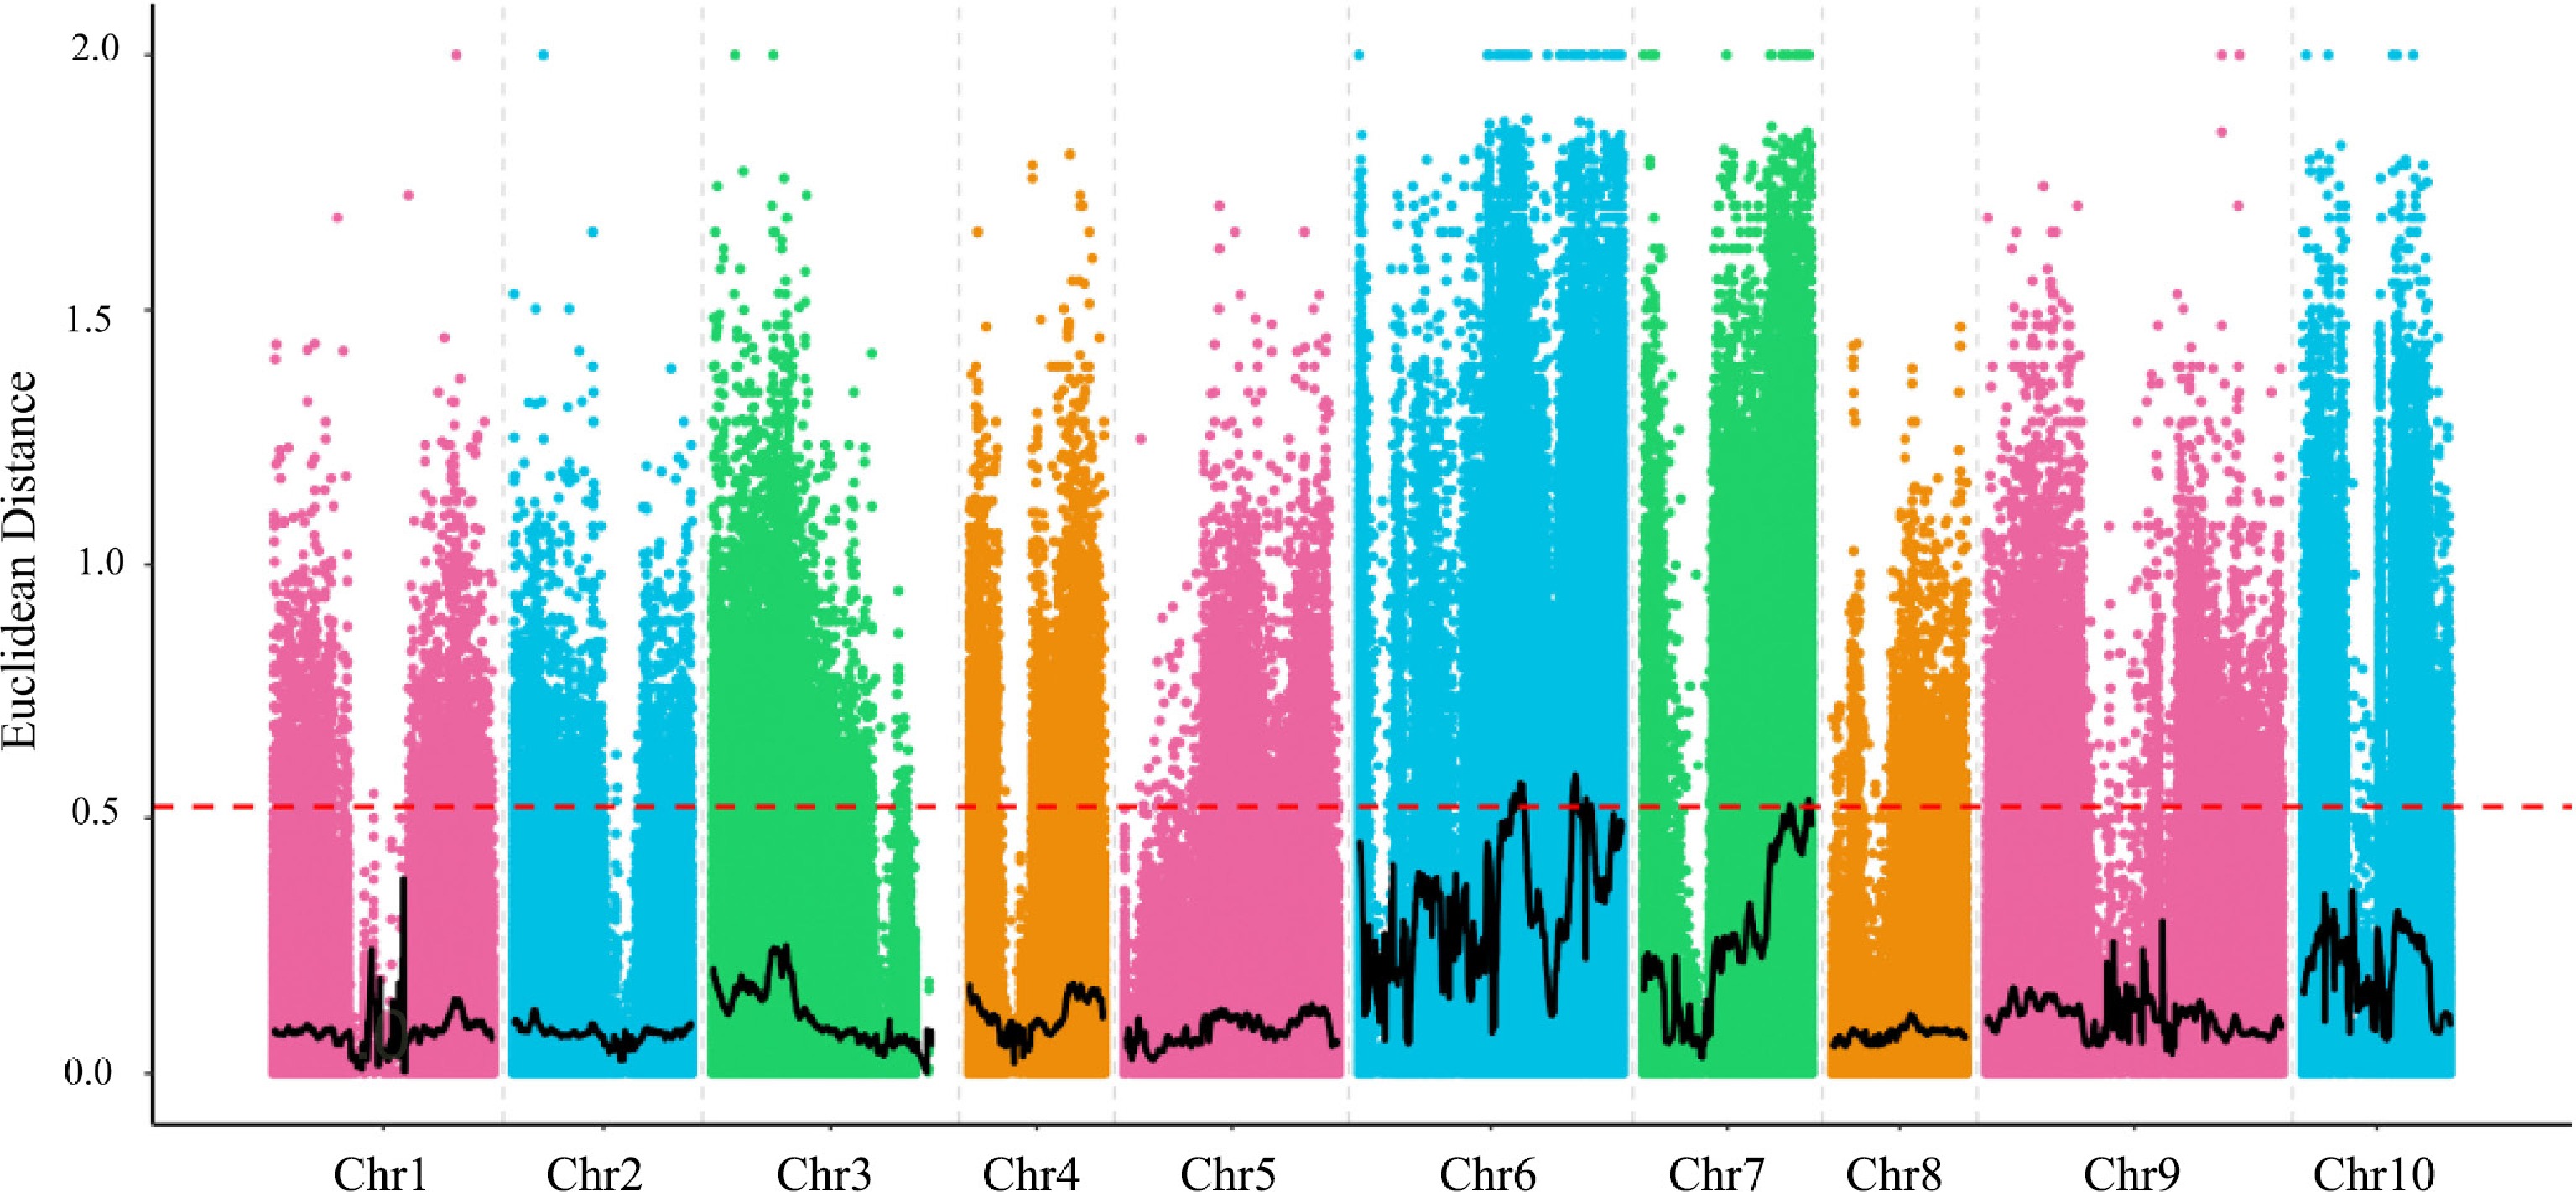
Figure 2.
Distribution of ED association values on chromosomes. The abscissa represents the chromosome names. The colored dots represent the ED values of each SNP locus. The black line represents the fitted ED values, and the red dashed line represents the significant association threshold.
-
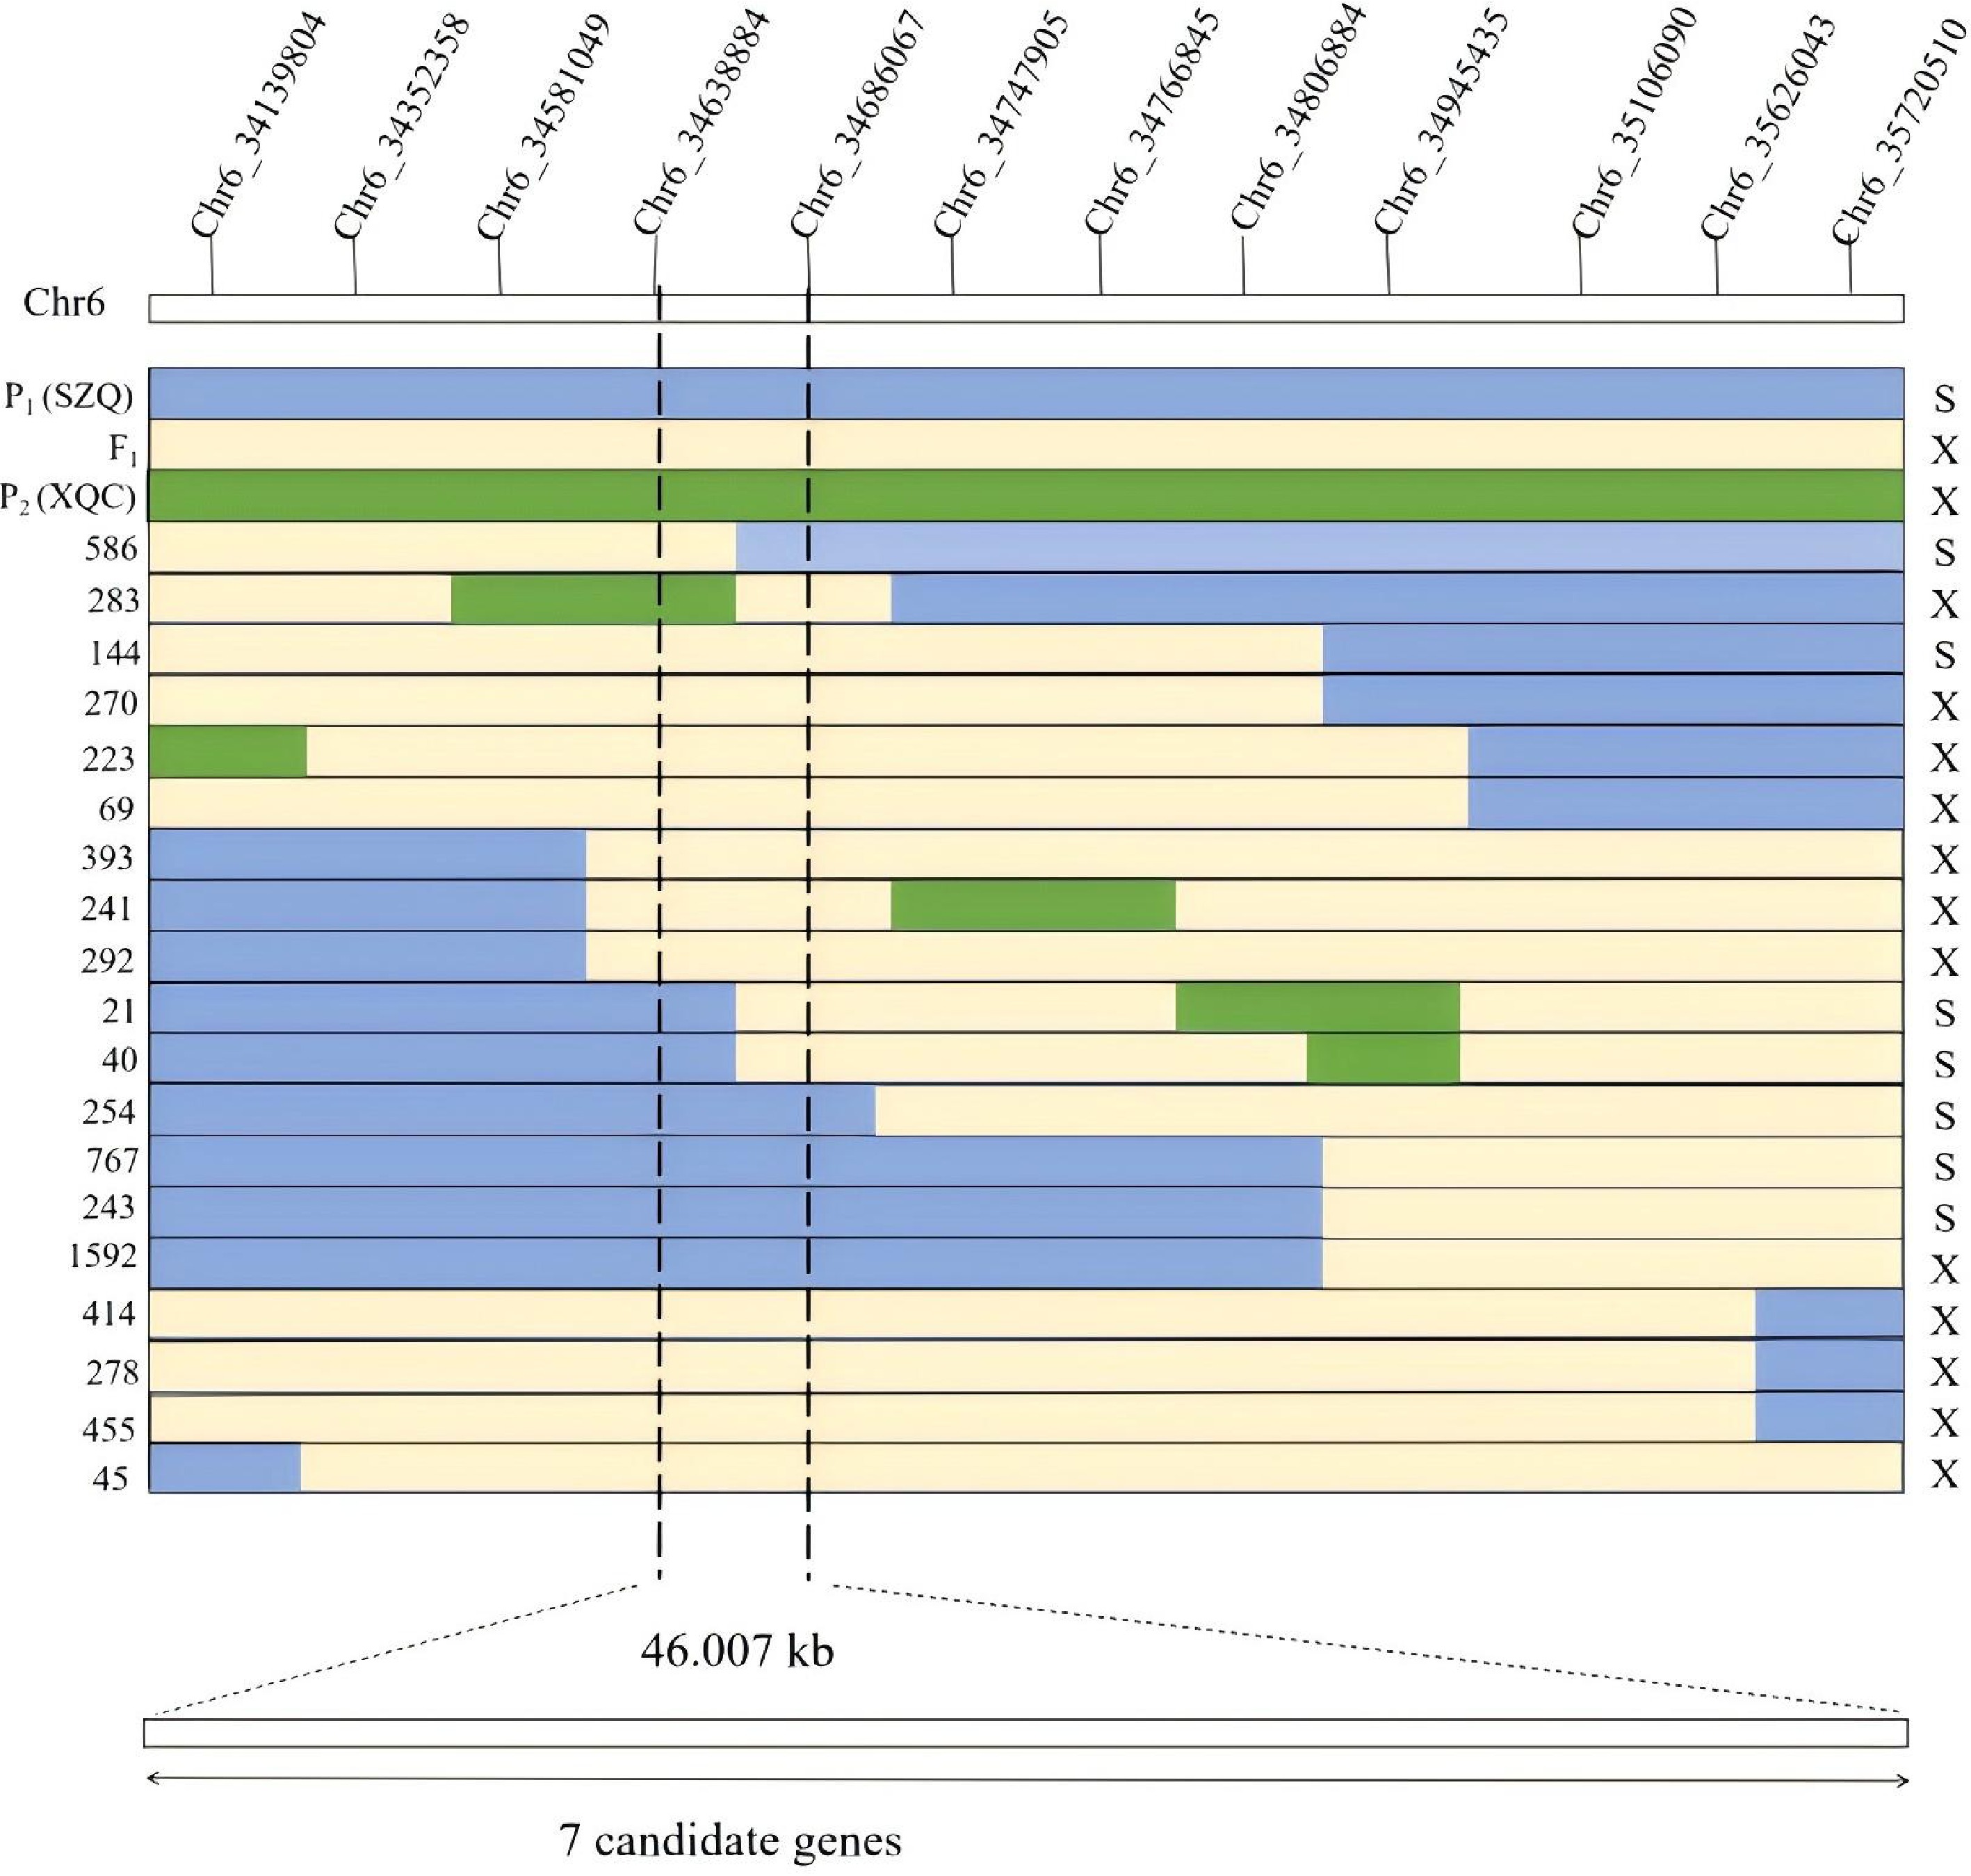
Figure 3.
Results of fine mapping. Lines of different colors represent different genotypes; blue represents 'SZQ', yellow represents F1, and green represents 'XQC'. The annotation on the left end indicates the parents, F1, and the serial numbers of F2 recombinant individuals. The annotation on the right end represents the phenotypes: S is the phenotype of 'SZQ', X is the phenotype of 'XQC'; the black dashed line is the final candidate region.
-
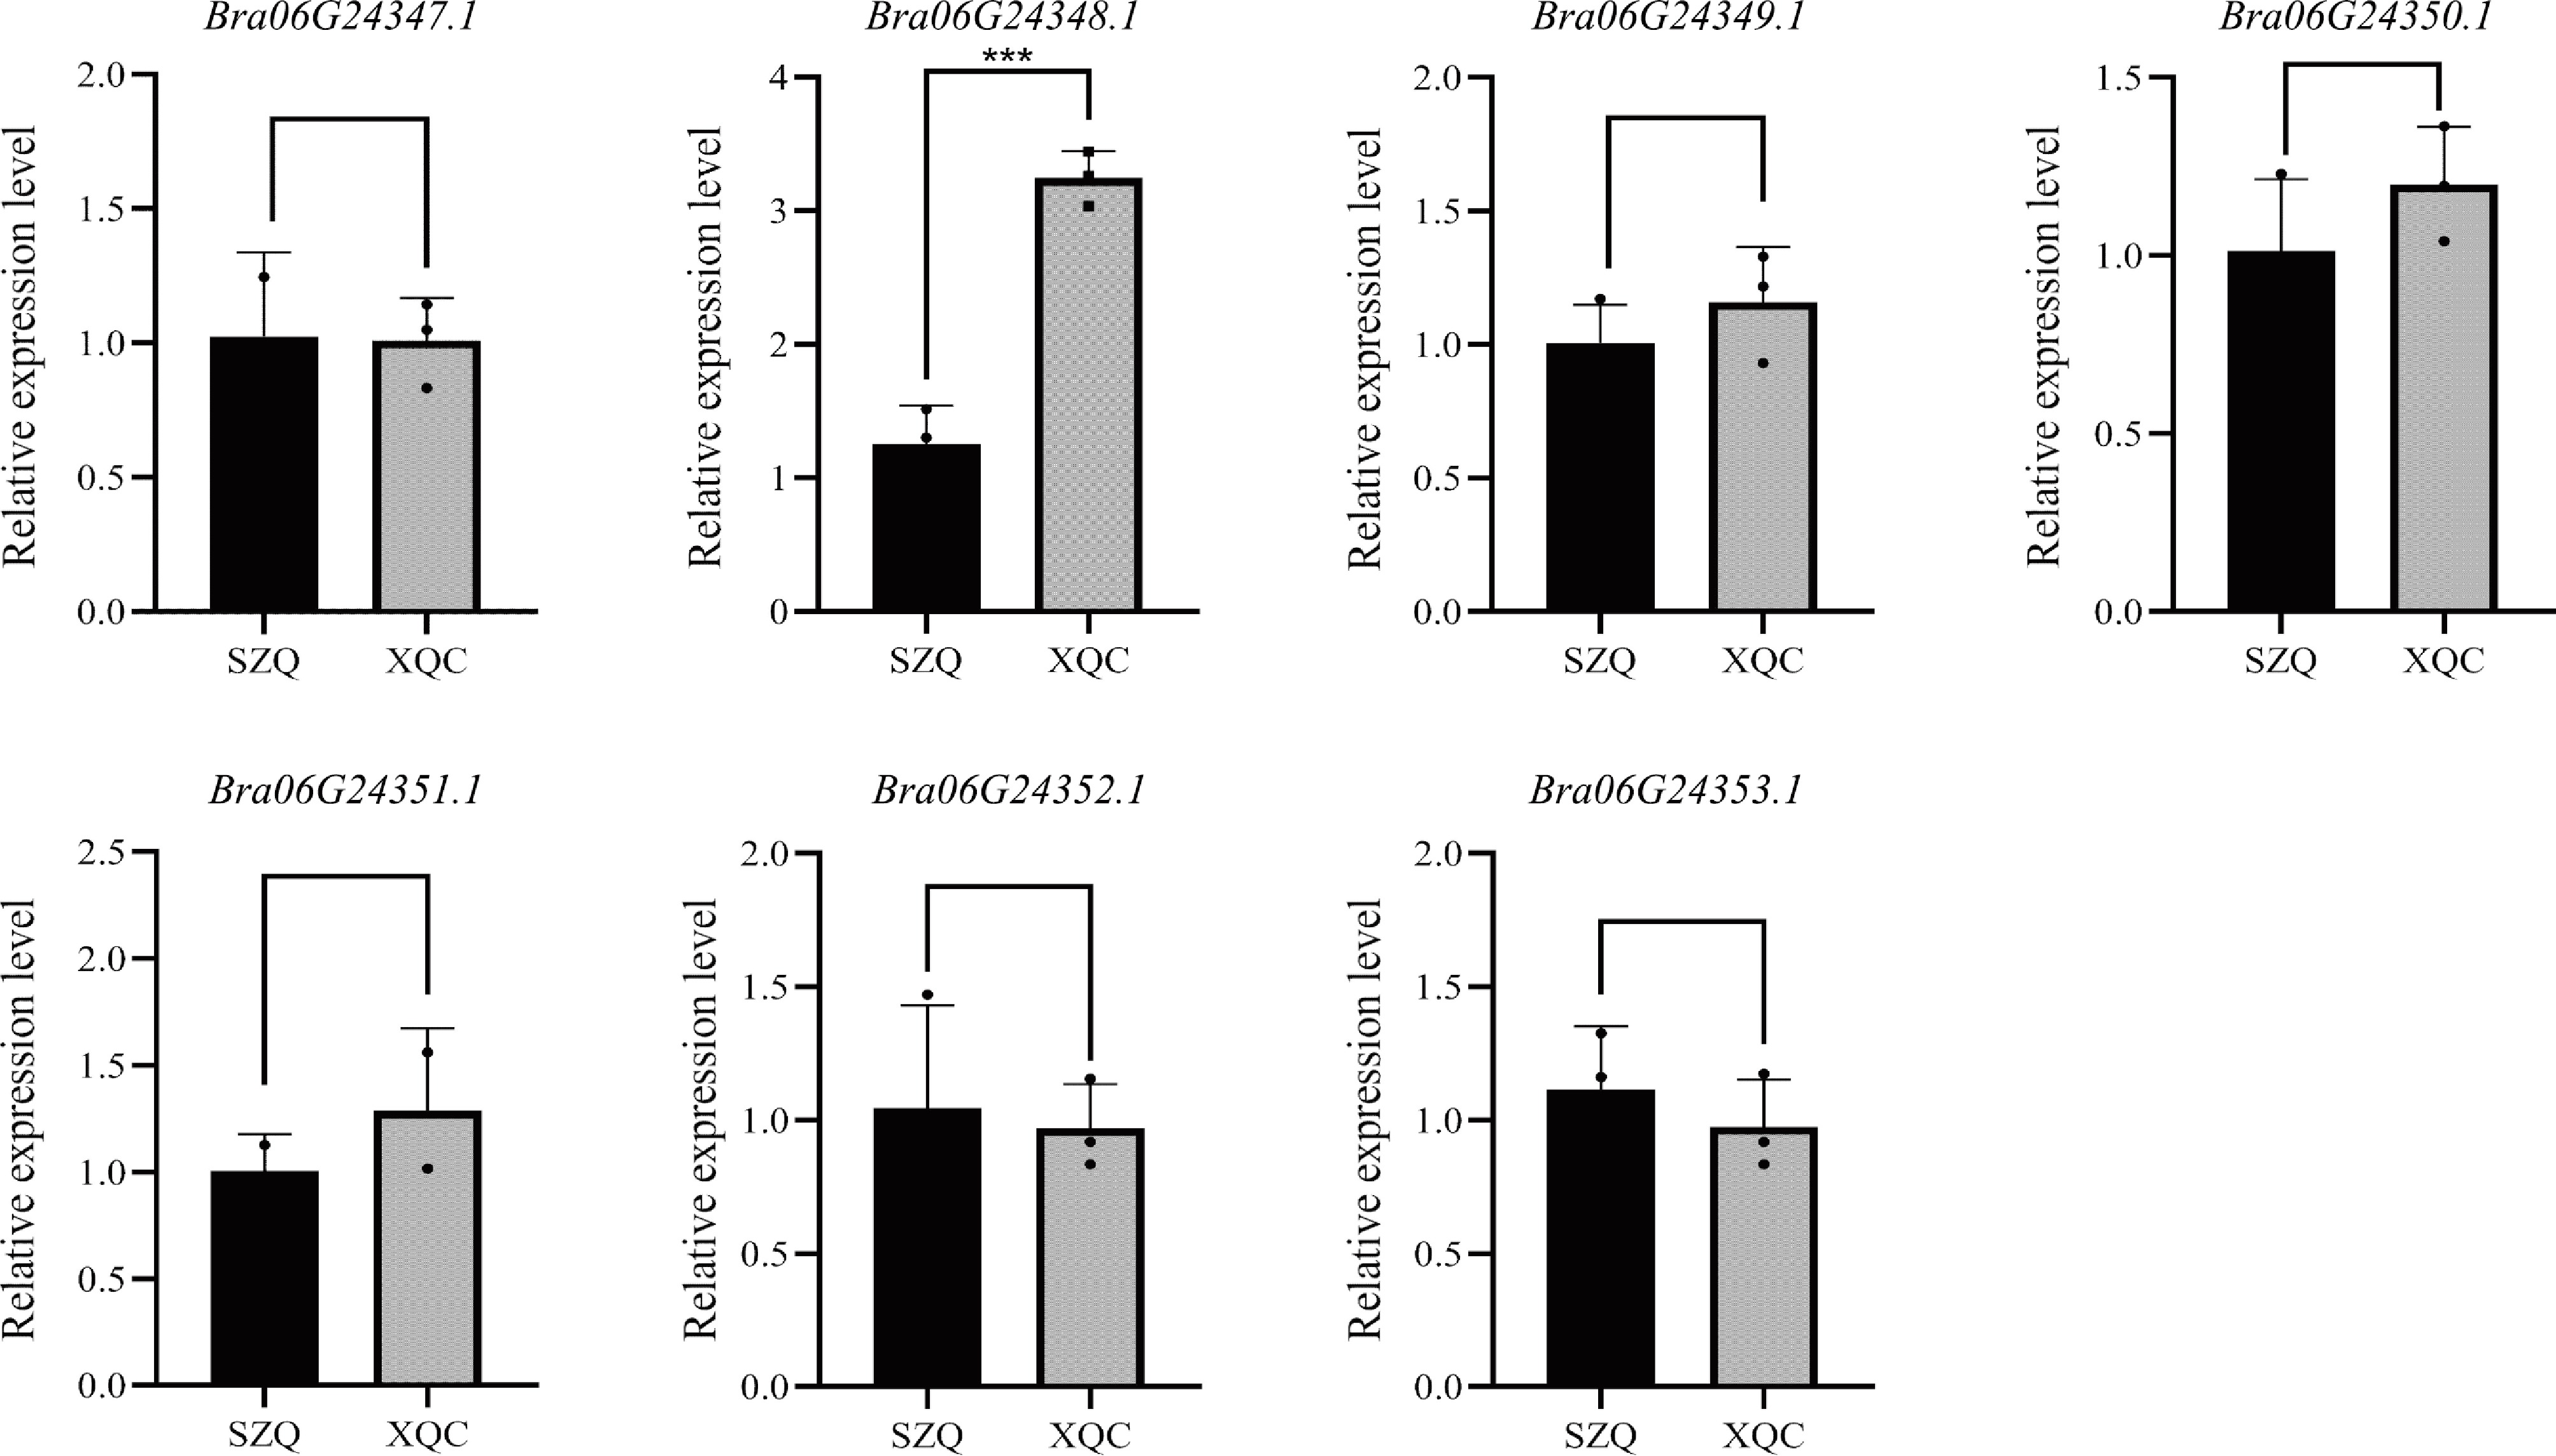
Figure 4.
Analysis of gene expression levels within candidate intervals. Values represent the mean ± SD of three biological replicates. *** p < 0.001 (Student's t-test).
-
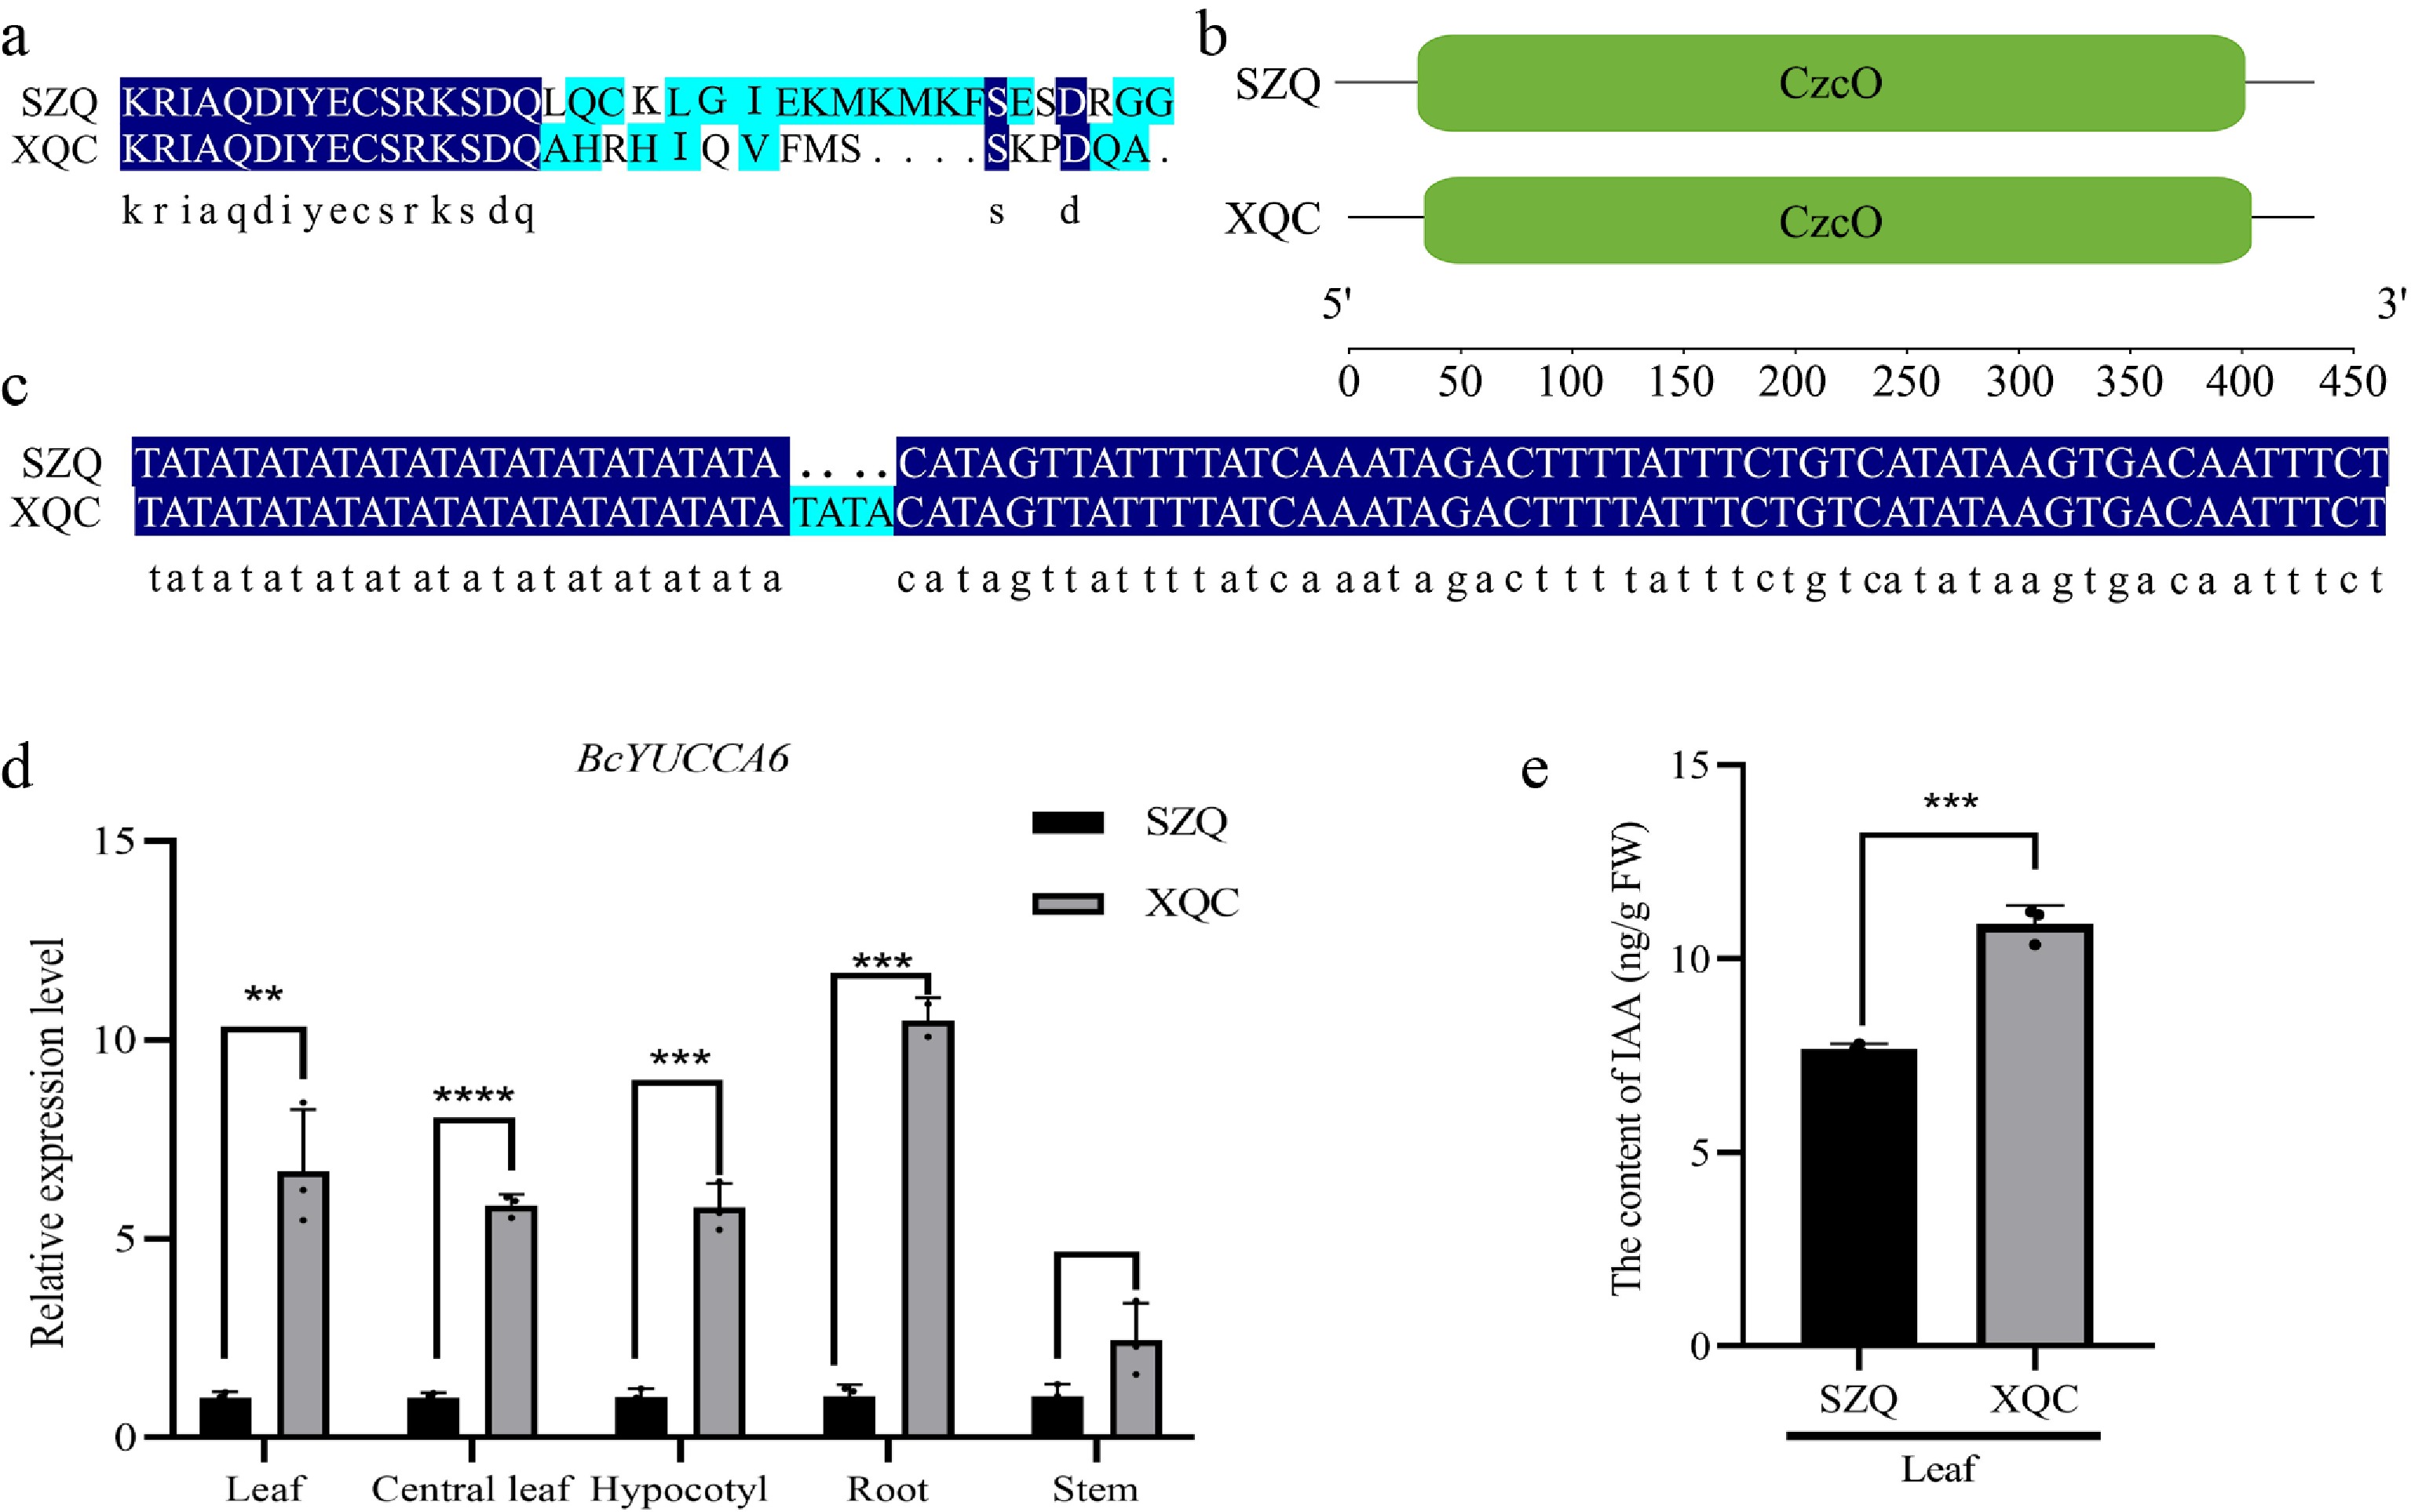
Figure 5.
Sequence analysis and organ-specific expression of BcYUCCA6 and leaf endogenous IAA content in two parents of NHCC. (a) Amino acid sequence analysis. (b) Conserved domain analysis. (c) Promoter sequence analysis. (d) Relative expression levels of BcYUCCA6 in different organs. (e) Comparative analysis of endogenous IAA content in leaves. Values represent the mean ± SD of three biological replicates. * p < 0.05, ** p < 0.01, *** p < 0.001, **** p < 0.0001 (Student's t-test).
-
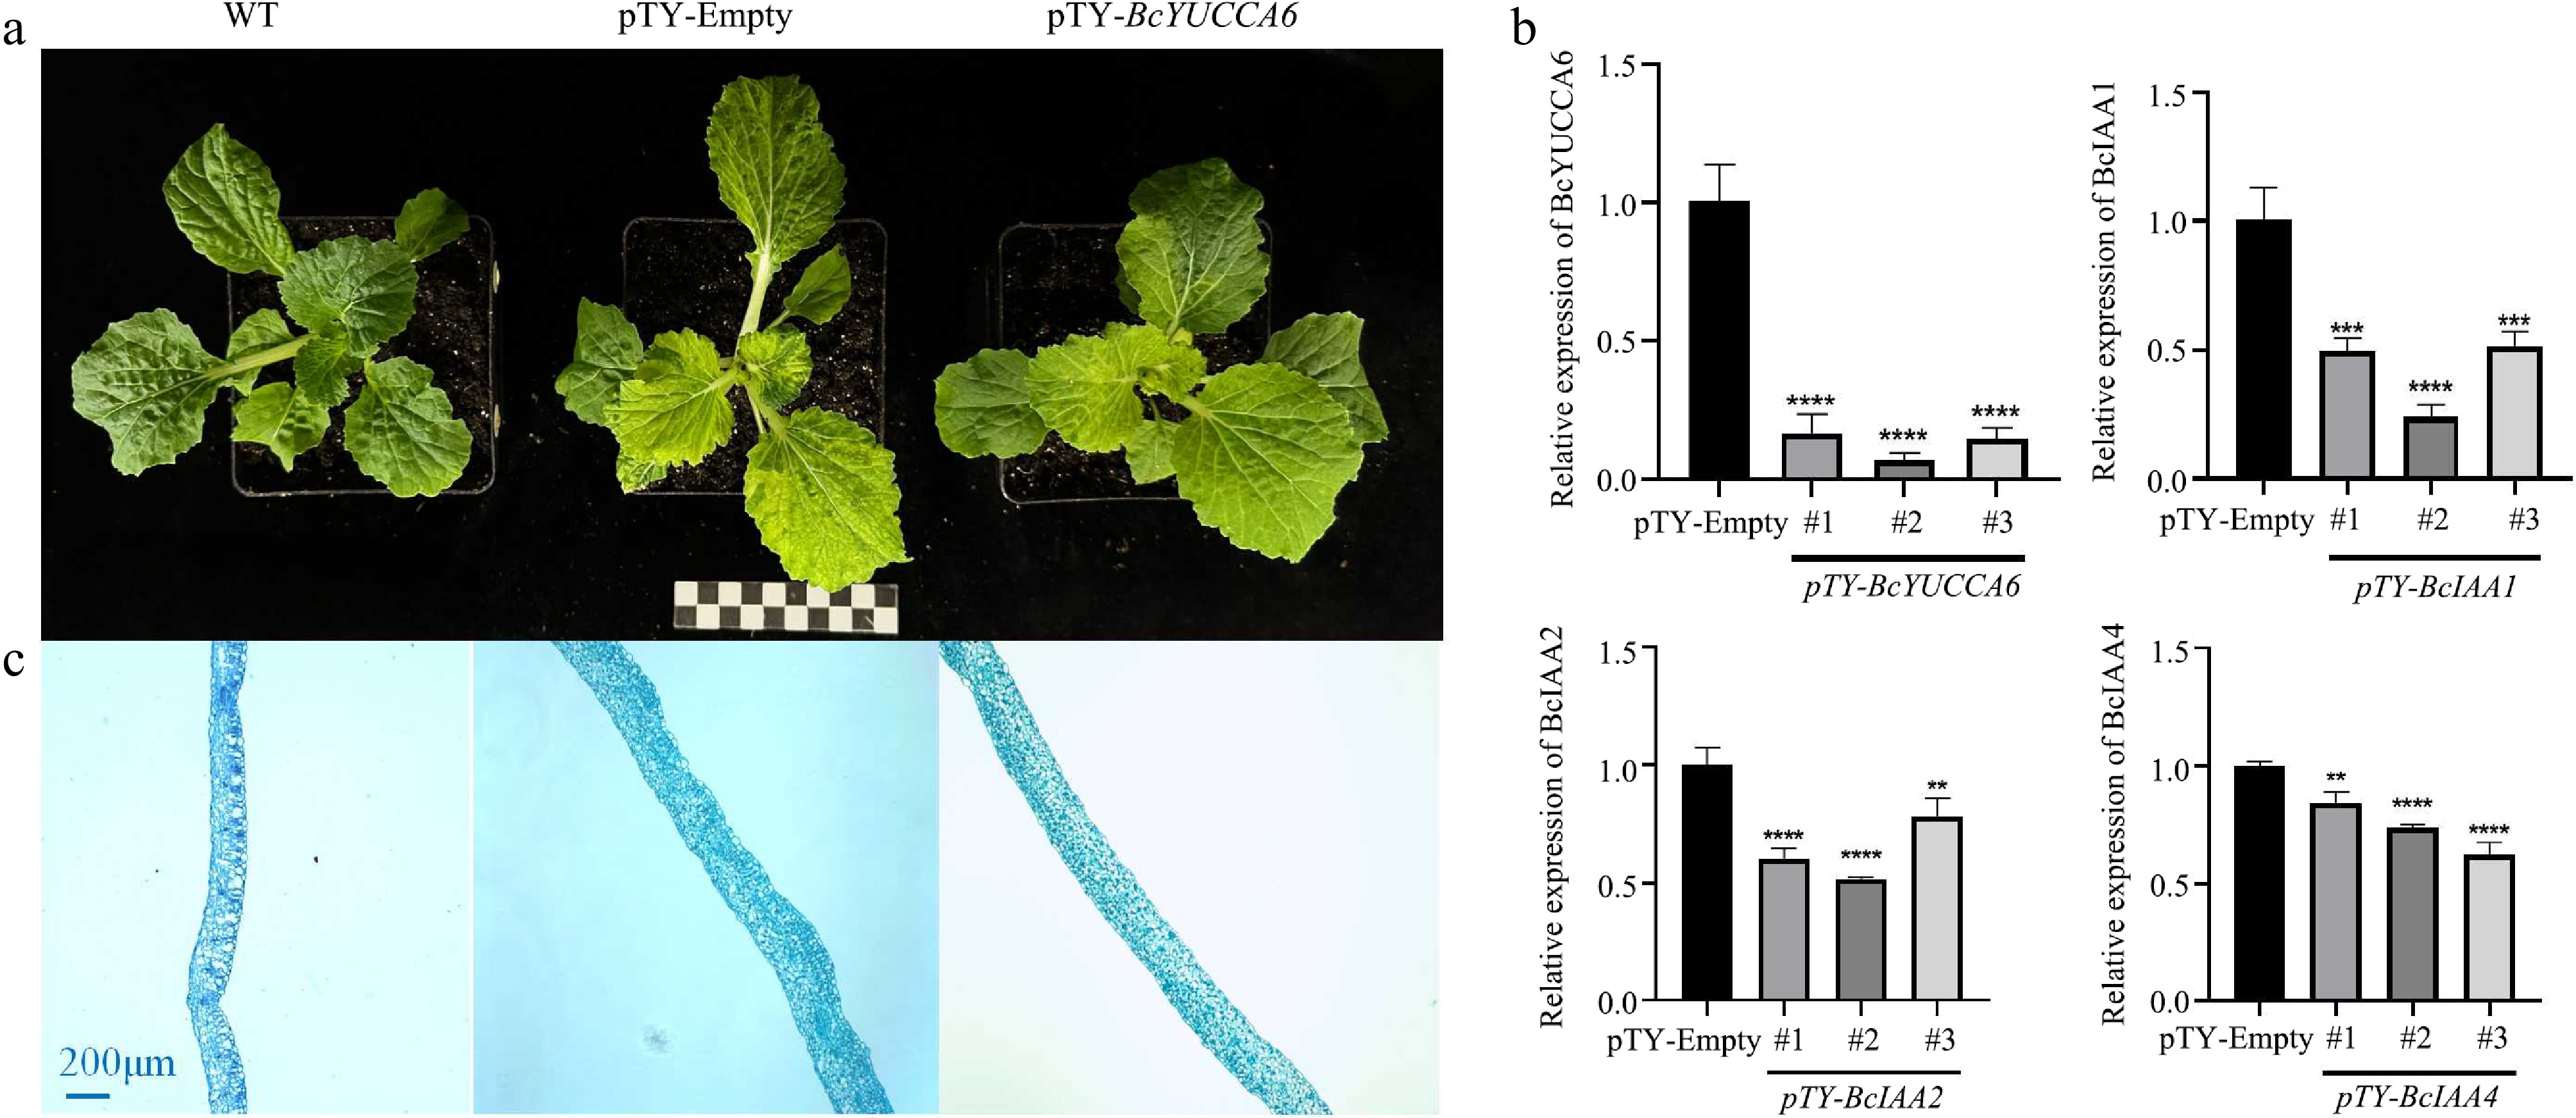
Figure 6.
(a) VIGS silencing of BcYUCCA6 affects leaf development. WT represents wild type, pTY-Empty represents the pTY-Empty plasmid control, and pTY-BcYUCCA6 shows the phenotype of the silenced plants. The scale is 10 cm. (b) Relative expression levels of genes related to auxin biosynthesis in control plants and BcYUCCA6-silenced plants. (c) Leaf sections of wild type, pTY-Empty, and pTY-BcYUCCA6. The scale is 200 μm. Values represent the mean ± SD of three biological replicates. * p < 0.05, ** p < 0.01, *** p < 0.001, **** p < 0.0001 (Student's t-test).
-
Grade Wrinkling degree Degree description 1 None Leaves are completely flat, with smooth surface, and veins are flat without protrusion. 2 Extremely weak Leaves are slightly undulating, occasionally with shallow wrinkles (≤ 3 wrinkles per leaf), generally nearly flat, and veins slightly protrude. 3 Weak Leaves are moderately wrinkled with obviously undulating surface, wrinkles are evenly distributed (4–6 wrinkles per leaf), and veins clearly protrude. 4 Moderate Leaves are obviously shrunken, with dense and relatively deep wrinkles (7–8 wrinkles per leaf), and veins prominently protrude. 5 Strong Leaves are extremely shrunken, surface showing honeycomb-like concaves and convexes, dense and interlaced wrinkles on the whole plant (> 8 wrinkles per leaf), and veins and mesophyll form a three-dimensional structure. Table 1.
Grading criteria for leaf shrinkage degree in NHCC.
-
Gene ID Homologous genes in A. thaliana The name of A. thaliana gene Functional annotation Ref. Bra06G24353 AT5G25550 − Leucine-rich repeat (LRR) family protein [20] Bra06G24352 AT5G25570 − Polyamine-modulated factor 1-binding protein − Bra06G24351 AT5G25580 DDR5 Hypothetical protein [21] Bra06G24350 AT5G25590 − DNA ligase [22] Bra06G24349 AT5G25610 RD22 Responsive to dehydration 22 (RD22) mediated by ABA [23] Bra06G24348 AT5G25620 YUCCA6 Encodes a member of a family of flavin monooxygenases biosynthesis [24] Bra06G24347 AT3G52580 US11X Ribosomal protein S11 family protein [25] Table 2.
Gene annotation of the candidate interval.
Figures
(6)
Tables
(2)