-
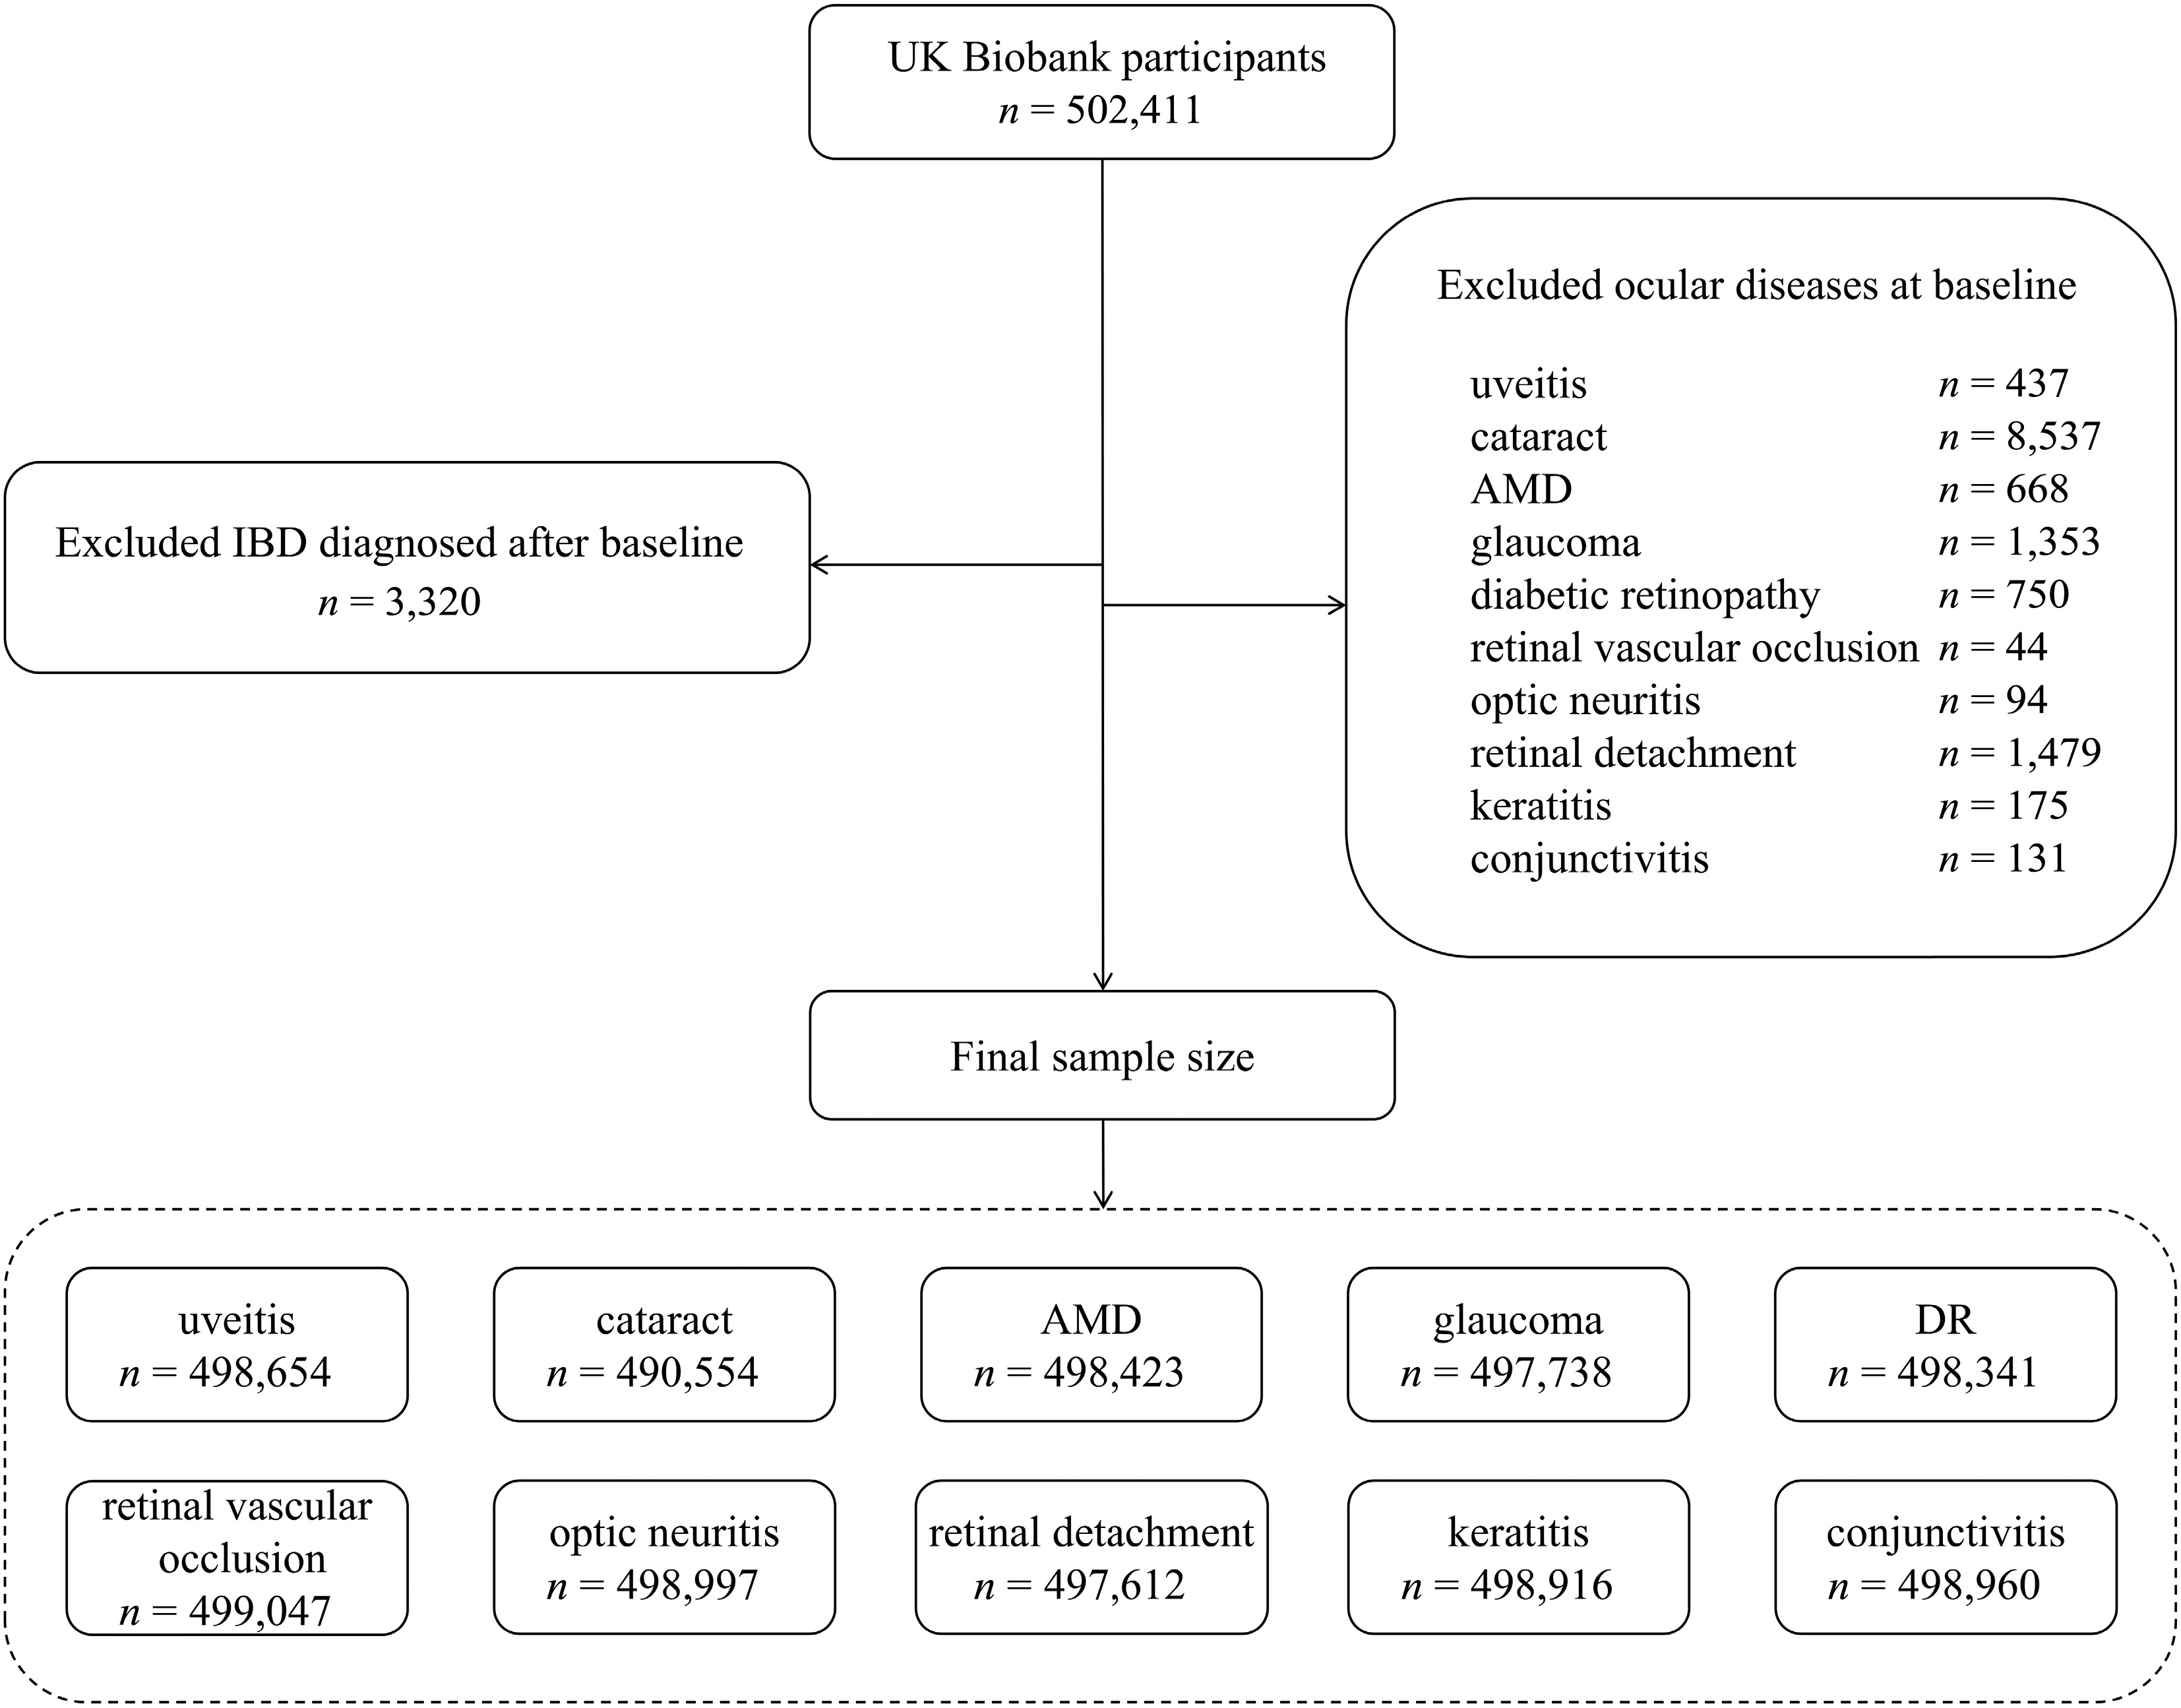
Figure 1.
Study flow charts of the UK Biobank cohort study. IBD, inflammatory bowel disease; AMD, age-related macular degeneration; DR, diabetic retinopathy.
-
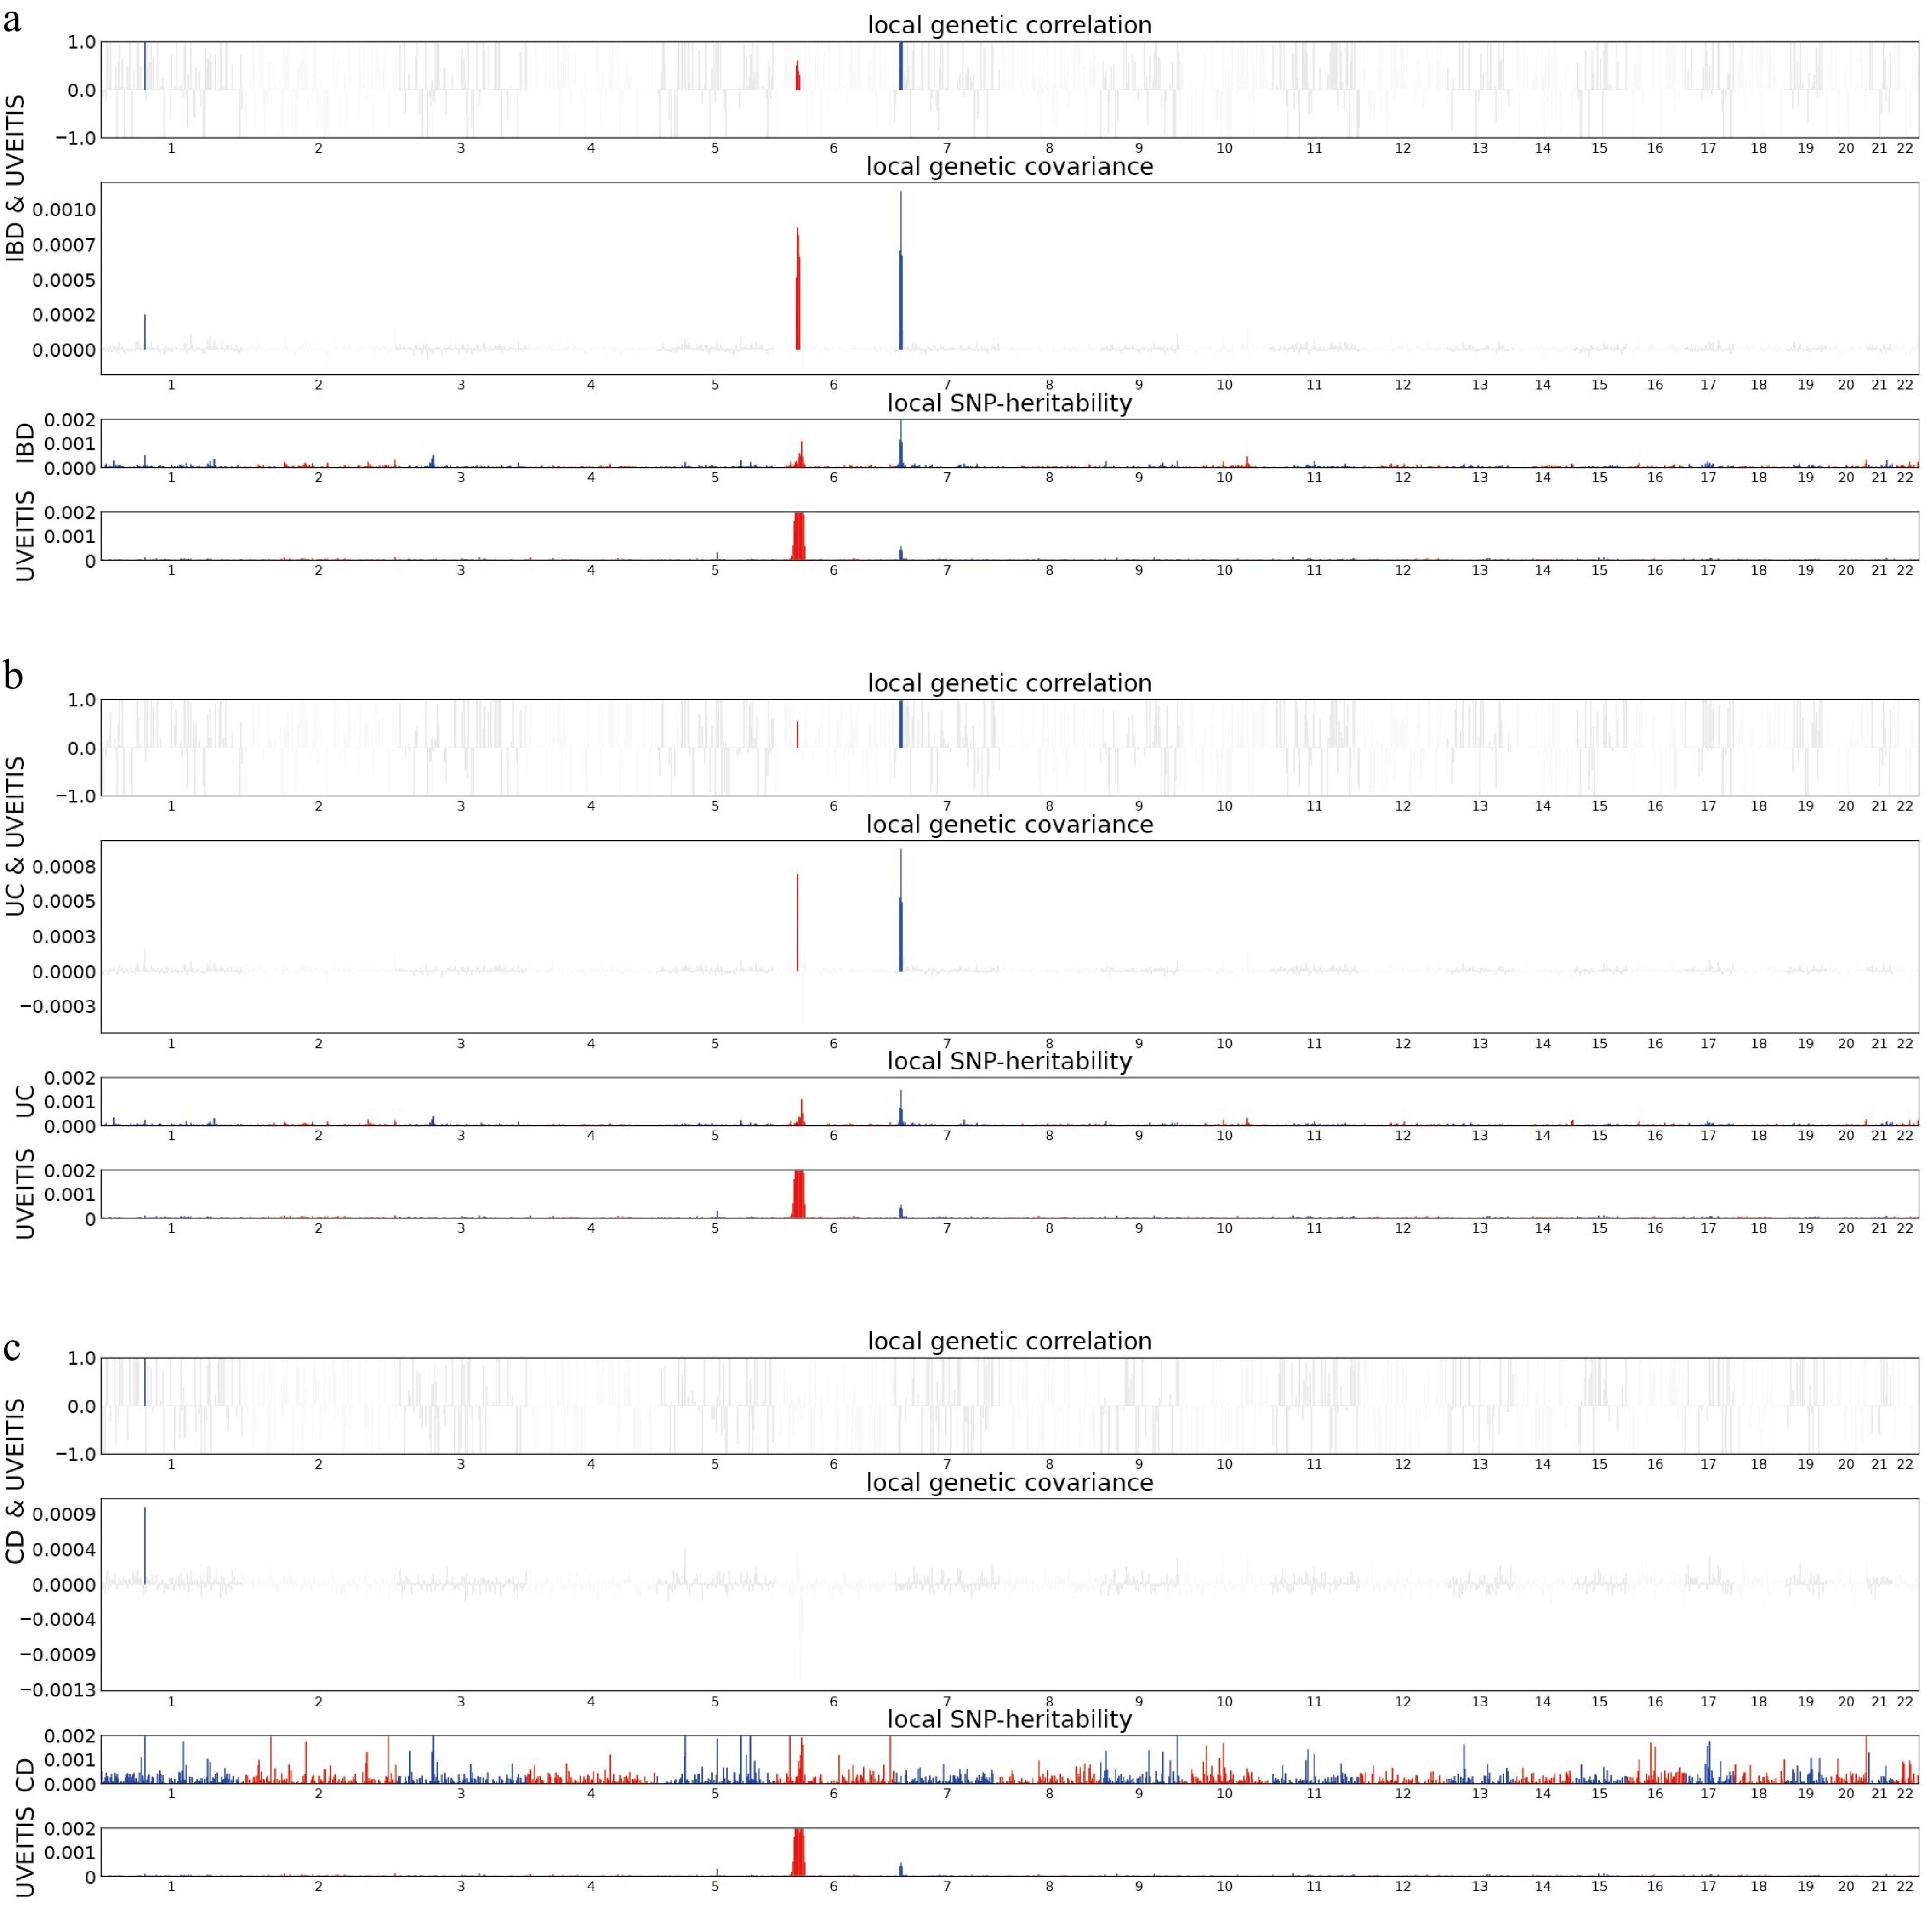
Figure 2.
Local genetic architecture between IBD (including subtypes) and uveitis. Manhattan plots illustrate the distribution of local genetic correlation, local genetic covariance, and trait-specific local SNP heritability across the genome for (a) IBD–uveitis, (b) UC–uveitis, and (c) CD–uveitis. In each subpanel, the top and middle sections display the estimates of local genetic correlation and covariance, respectively. Colored bars (red or blue) highlight specific genomic regions exhibiting significant local genetic overlap after multiple adjustment (p < 5E−08 in both local SNP heritability test, and p < 0.05/1702 in local genetic covariance test). The bottom section represents the regional SNP-based heritability for each individual trait, with colored bars indicating loci reaching statistical significance. IBD, inflammatory bowel disease; UC, ulcerative colitis; CD, Crohn's disease.
-
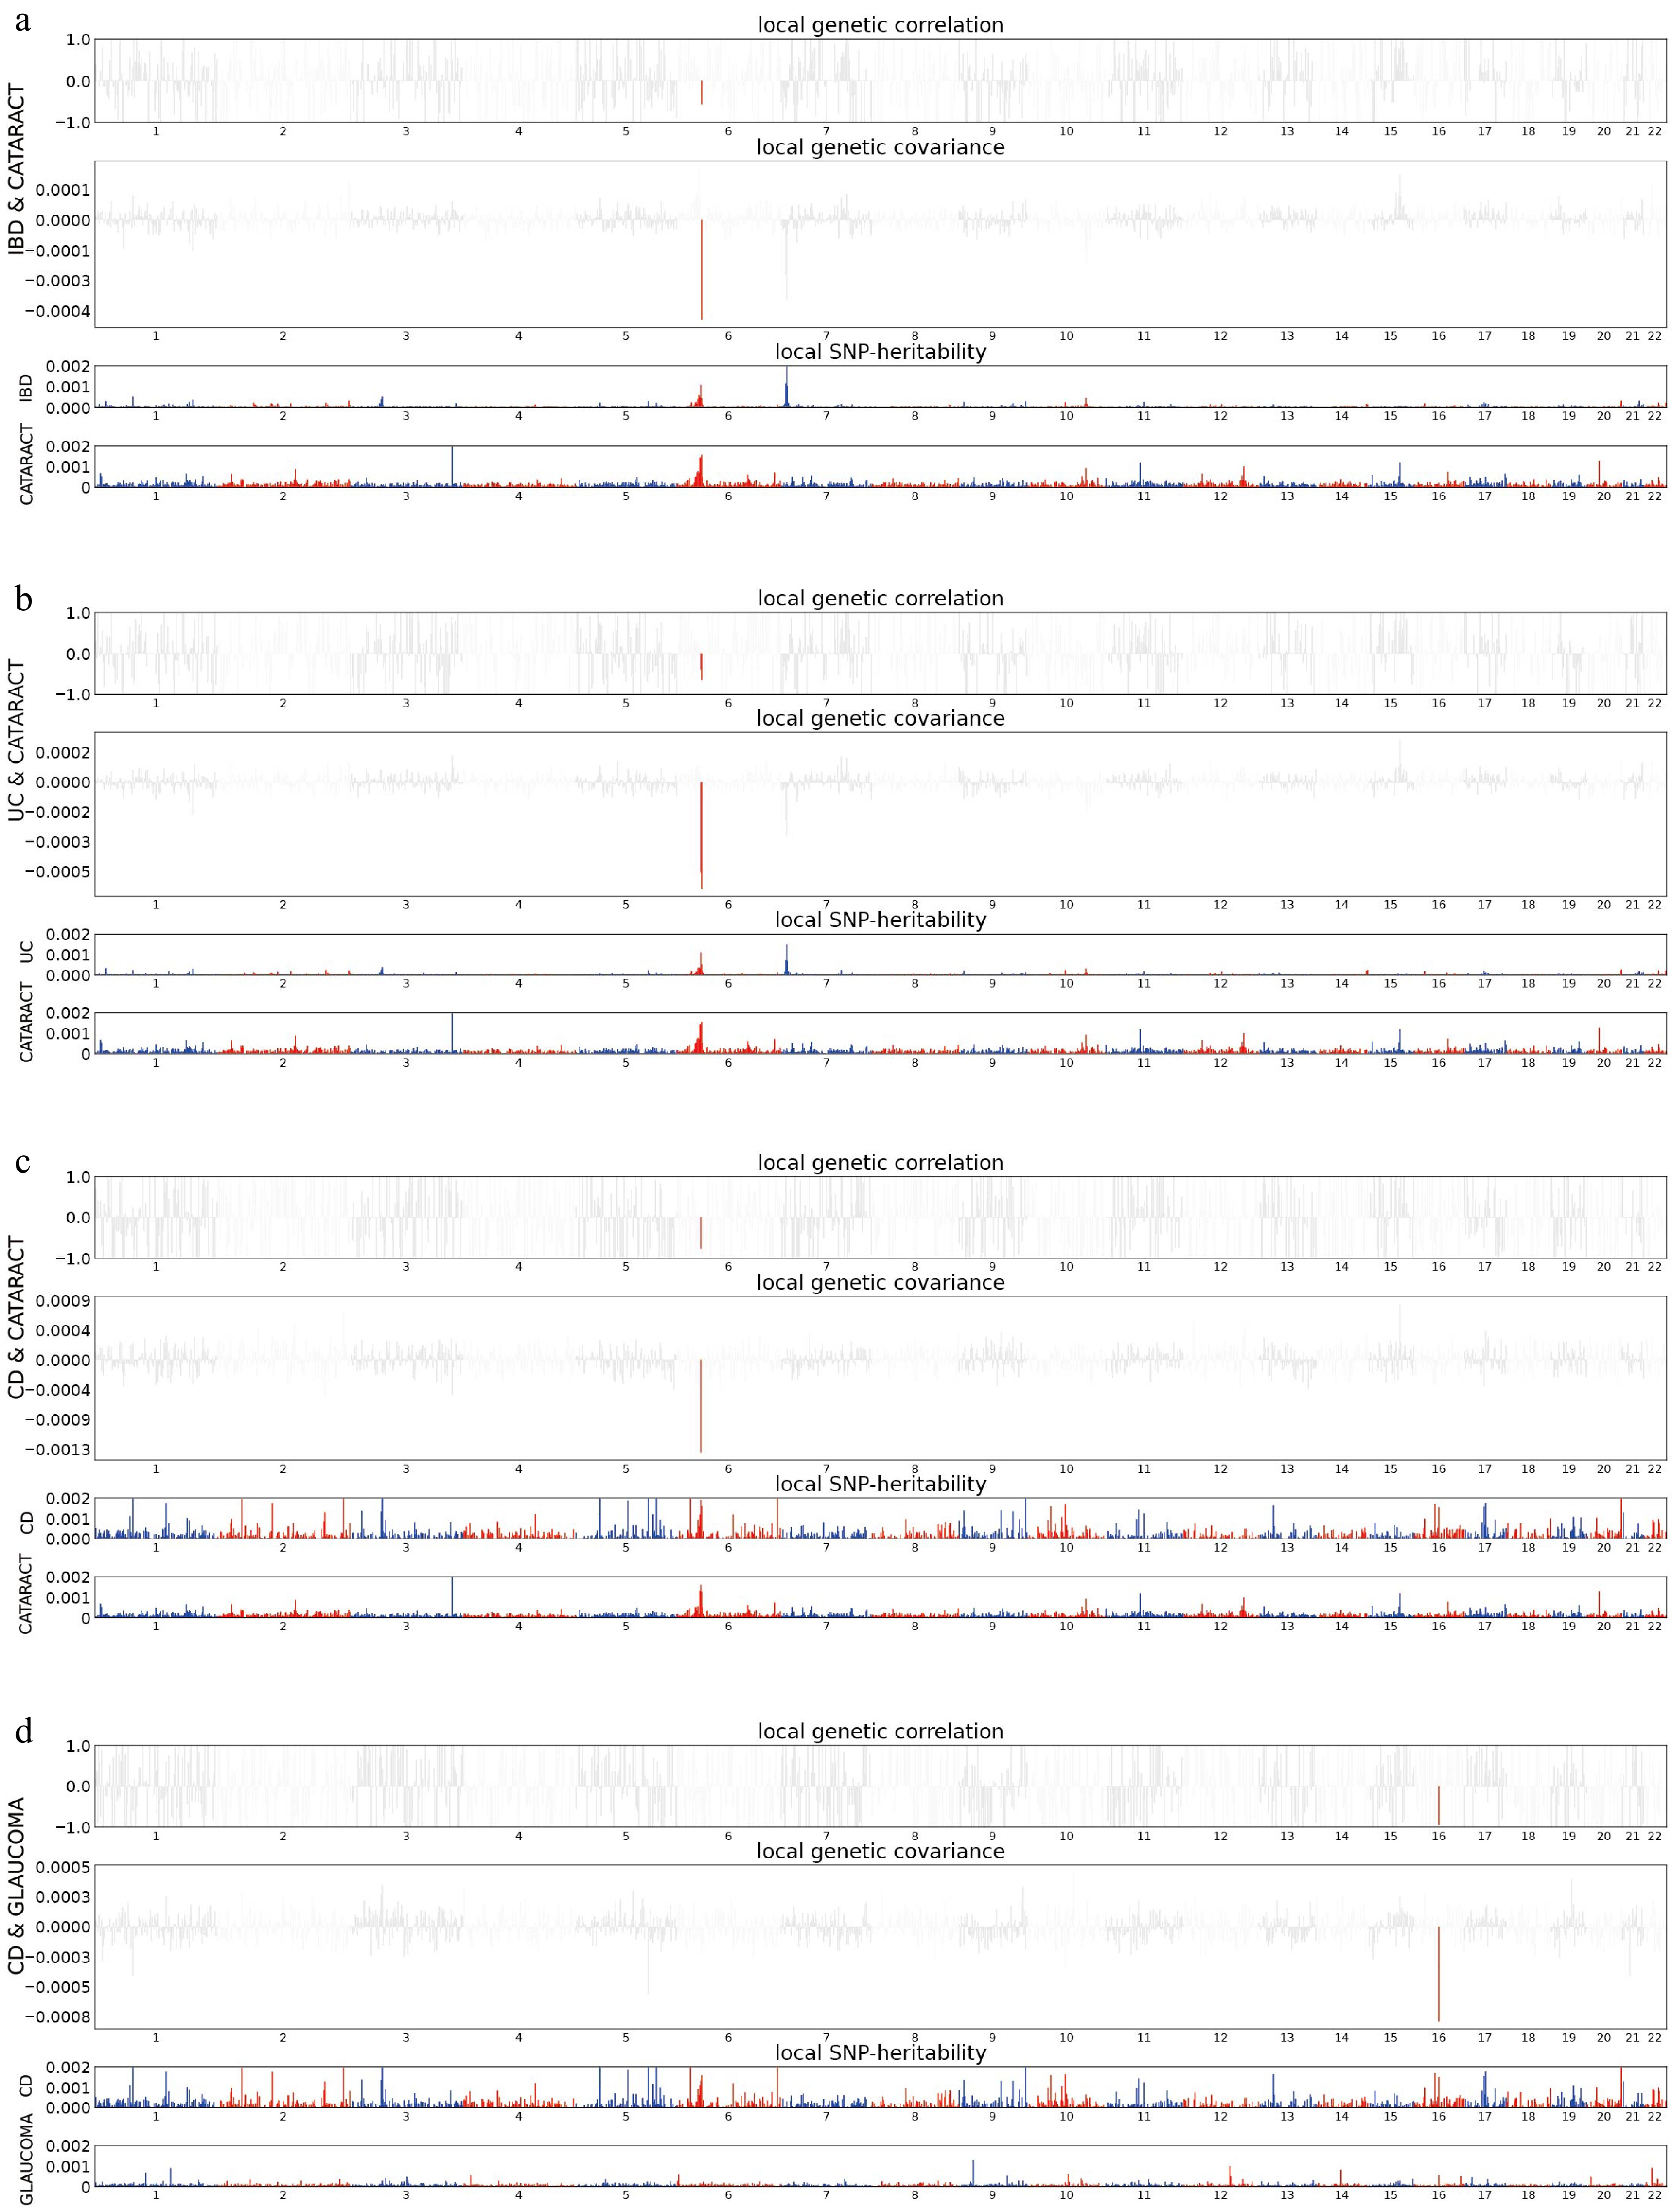
Figure 3.
Local genetic architecture between IBD (including subtypes) and cataract, CD and glaucoma. Manhattan plots illustrate the distribution of local genetic correlation, local genetic covariance, and trait-specific local SNP heritability across the genome for (a) IBD–cataract, (b) UC–cataract, (c) CD–cataract, and (d) CD–glaucoma. In each subpanel, the top and middle sections display the estimates of local genetic correlation and covariance, respectively. Colored bars (red or blue) highlight specific genomic regions exhibiting significant local genetic overlap after multiple adjustment (p < 5E−08 in both local SNP heritability test, and p < 0.05/1702 in local genetic covariance test). The bottom section represents the regional SNP-based heritability for each individual trait, with colored bars indicating loci reaching statistical significance. IBD, inflammatory bowel disease; UC, ulcerative colitis; CD, Crohn's disease.
-
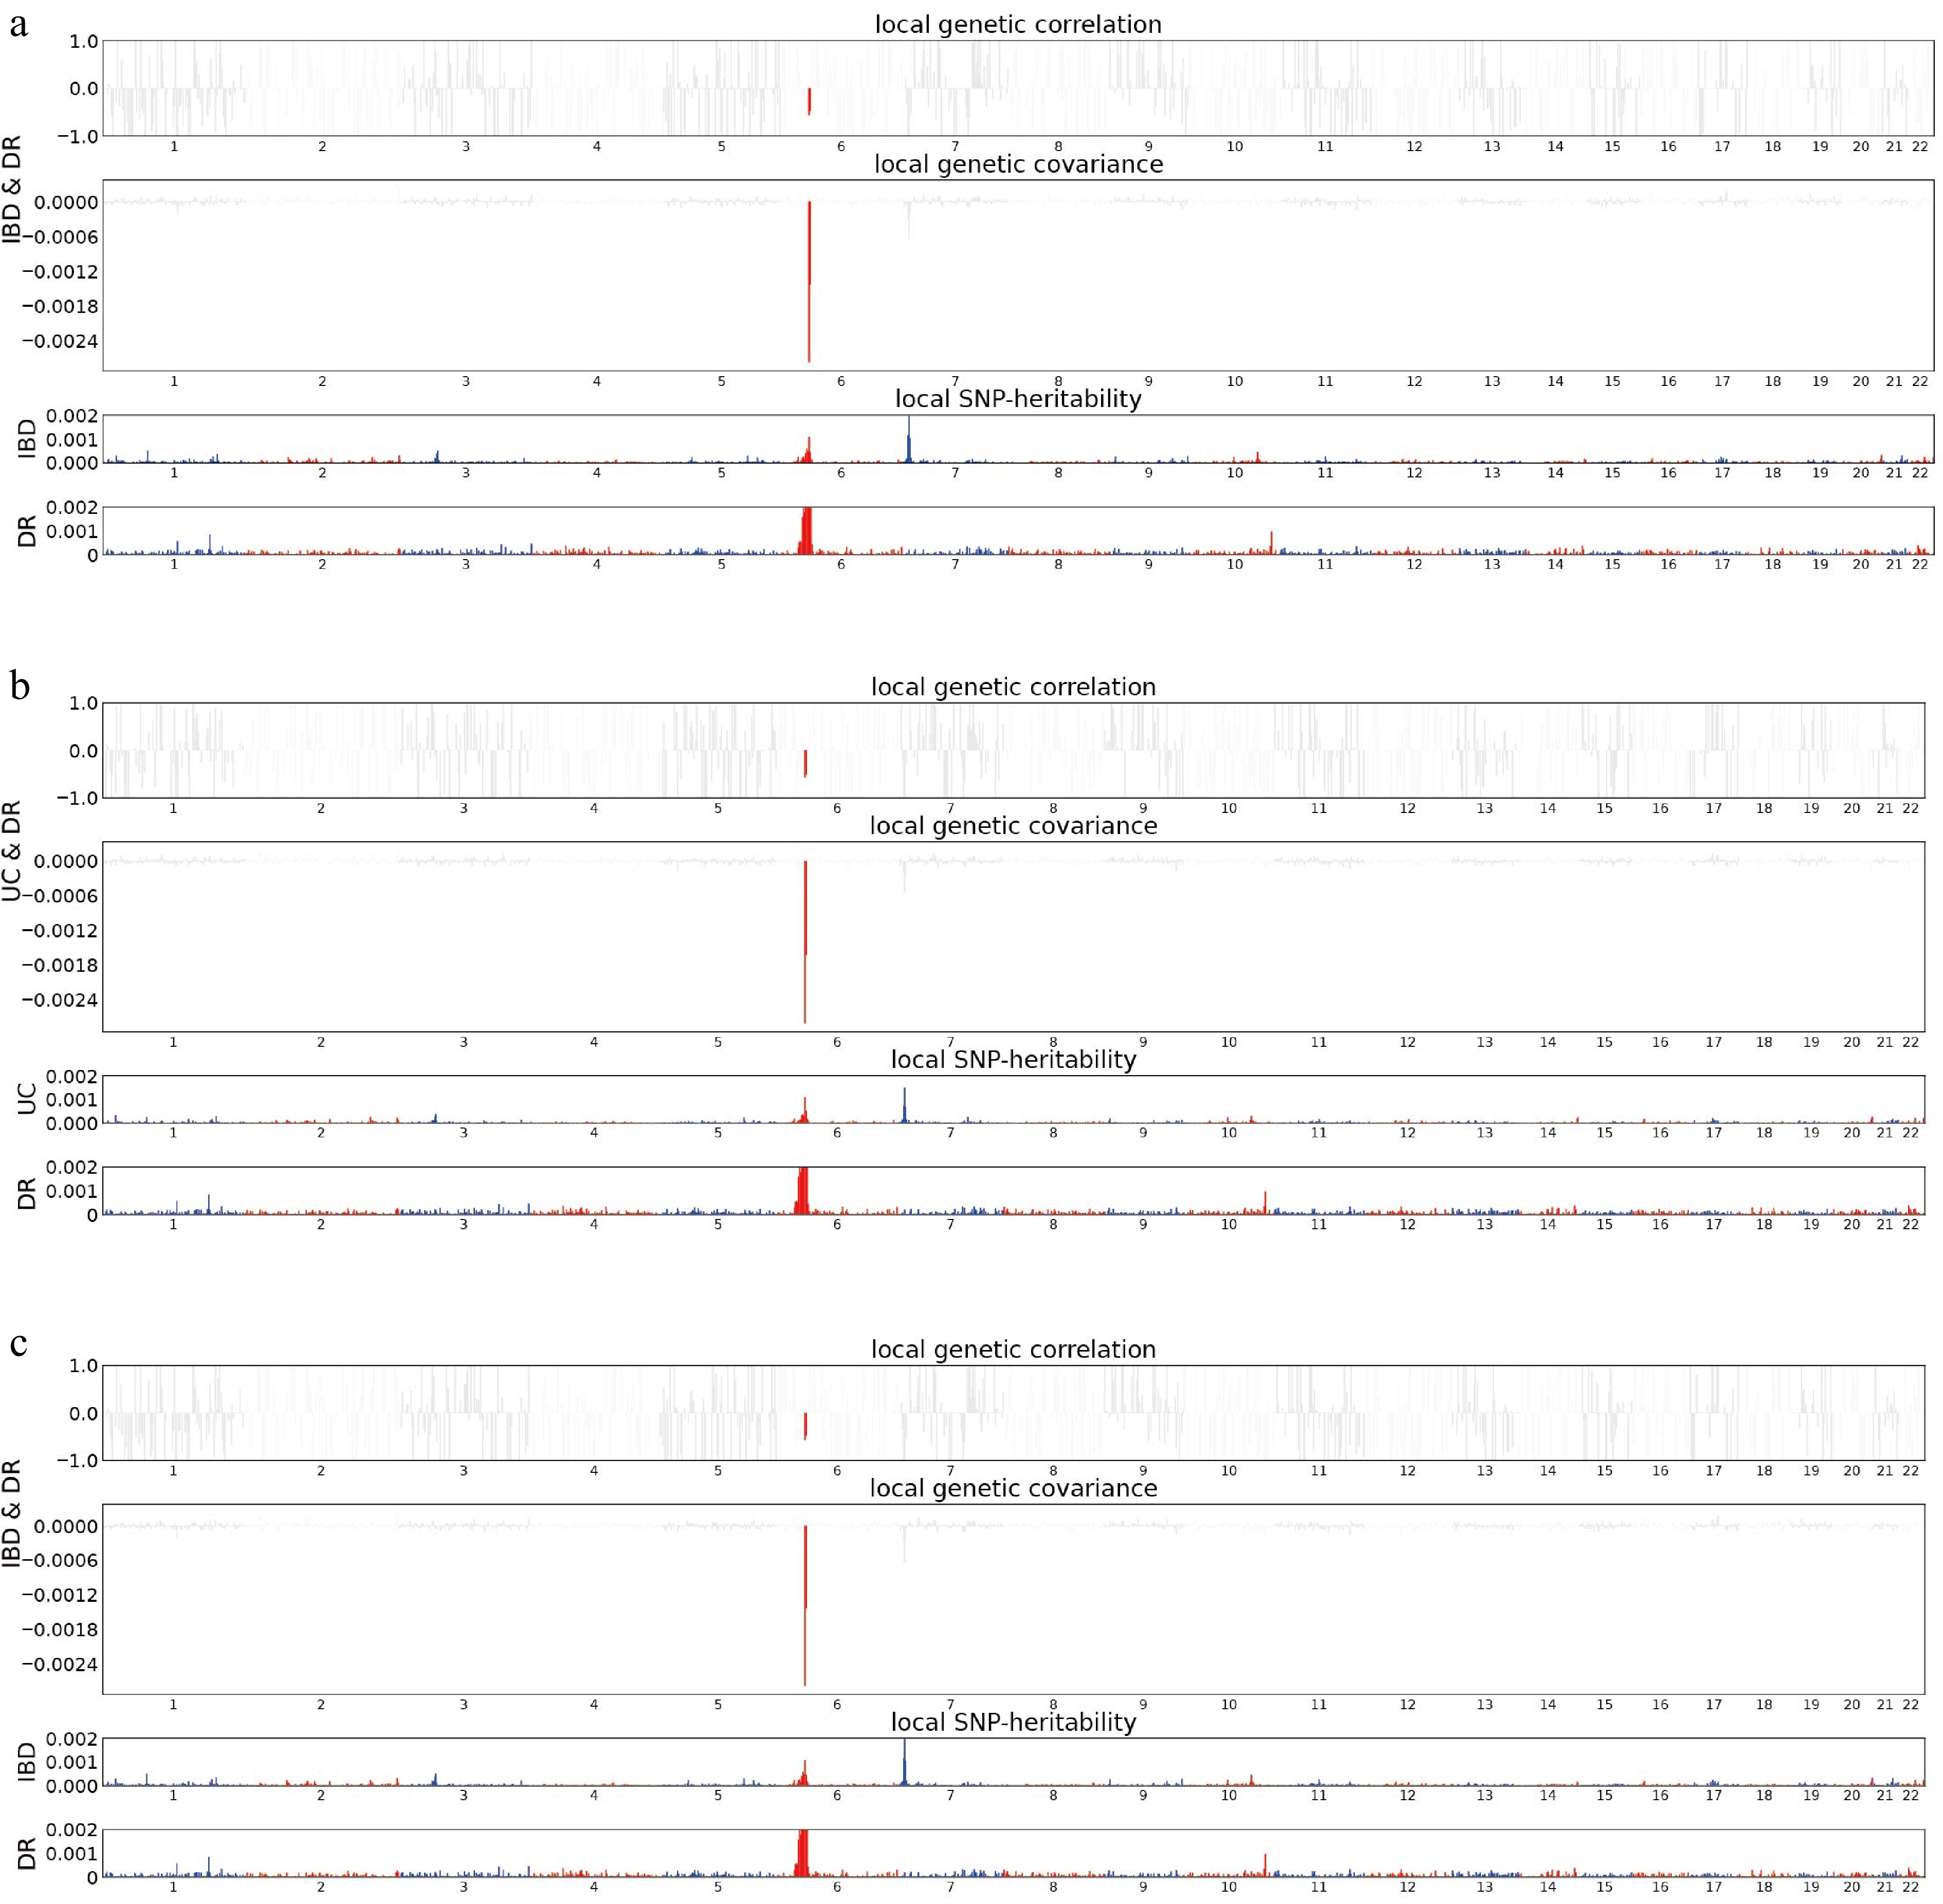
Figure 4.
Local genetic architecture between IBD (including subtypes) and DR. Manhattan plots illustrate the distribution of local genetic correlation, local genetic covariance, and trait-specific local SNP heritability across the genome for (a) IBD–DR, (b) UC–DR, and (c) CD–DR. In each subpanel, the top and middle sections display the estimates of local genetic correlation and covariance, respectively. Colored bars (red or blue) highlight specific genomic regions exhibiting significant local genetic overlap after multiple adjustment (p < 5E−08 in both local SNP heritability test, and p < 0.05/1702 in local genetic covariance test). The bottom section represents the regional SNP-based heritability for each individual trait, with colored bars indicating loci reaching statistical significance. IBD, inflammatory bowel disease; UC, ulcerative colitis; CD, Crohn's disease.
-
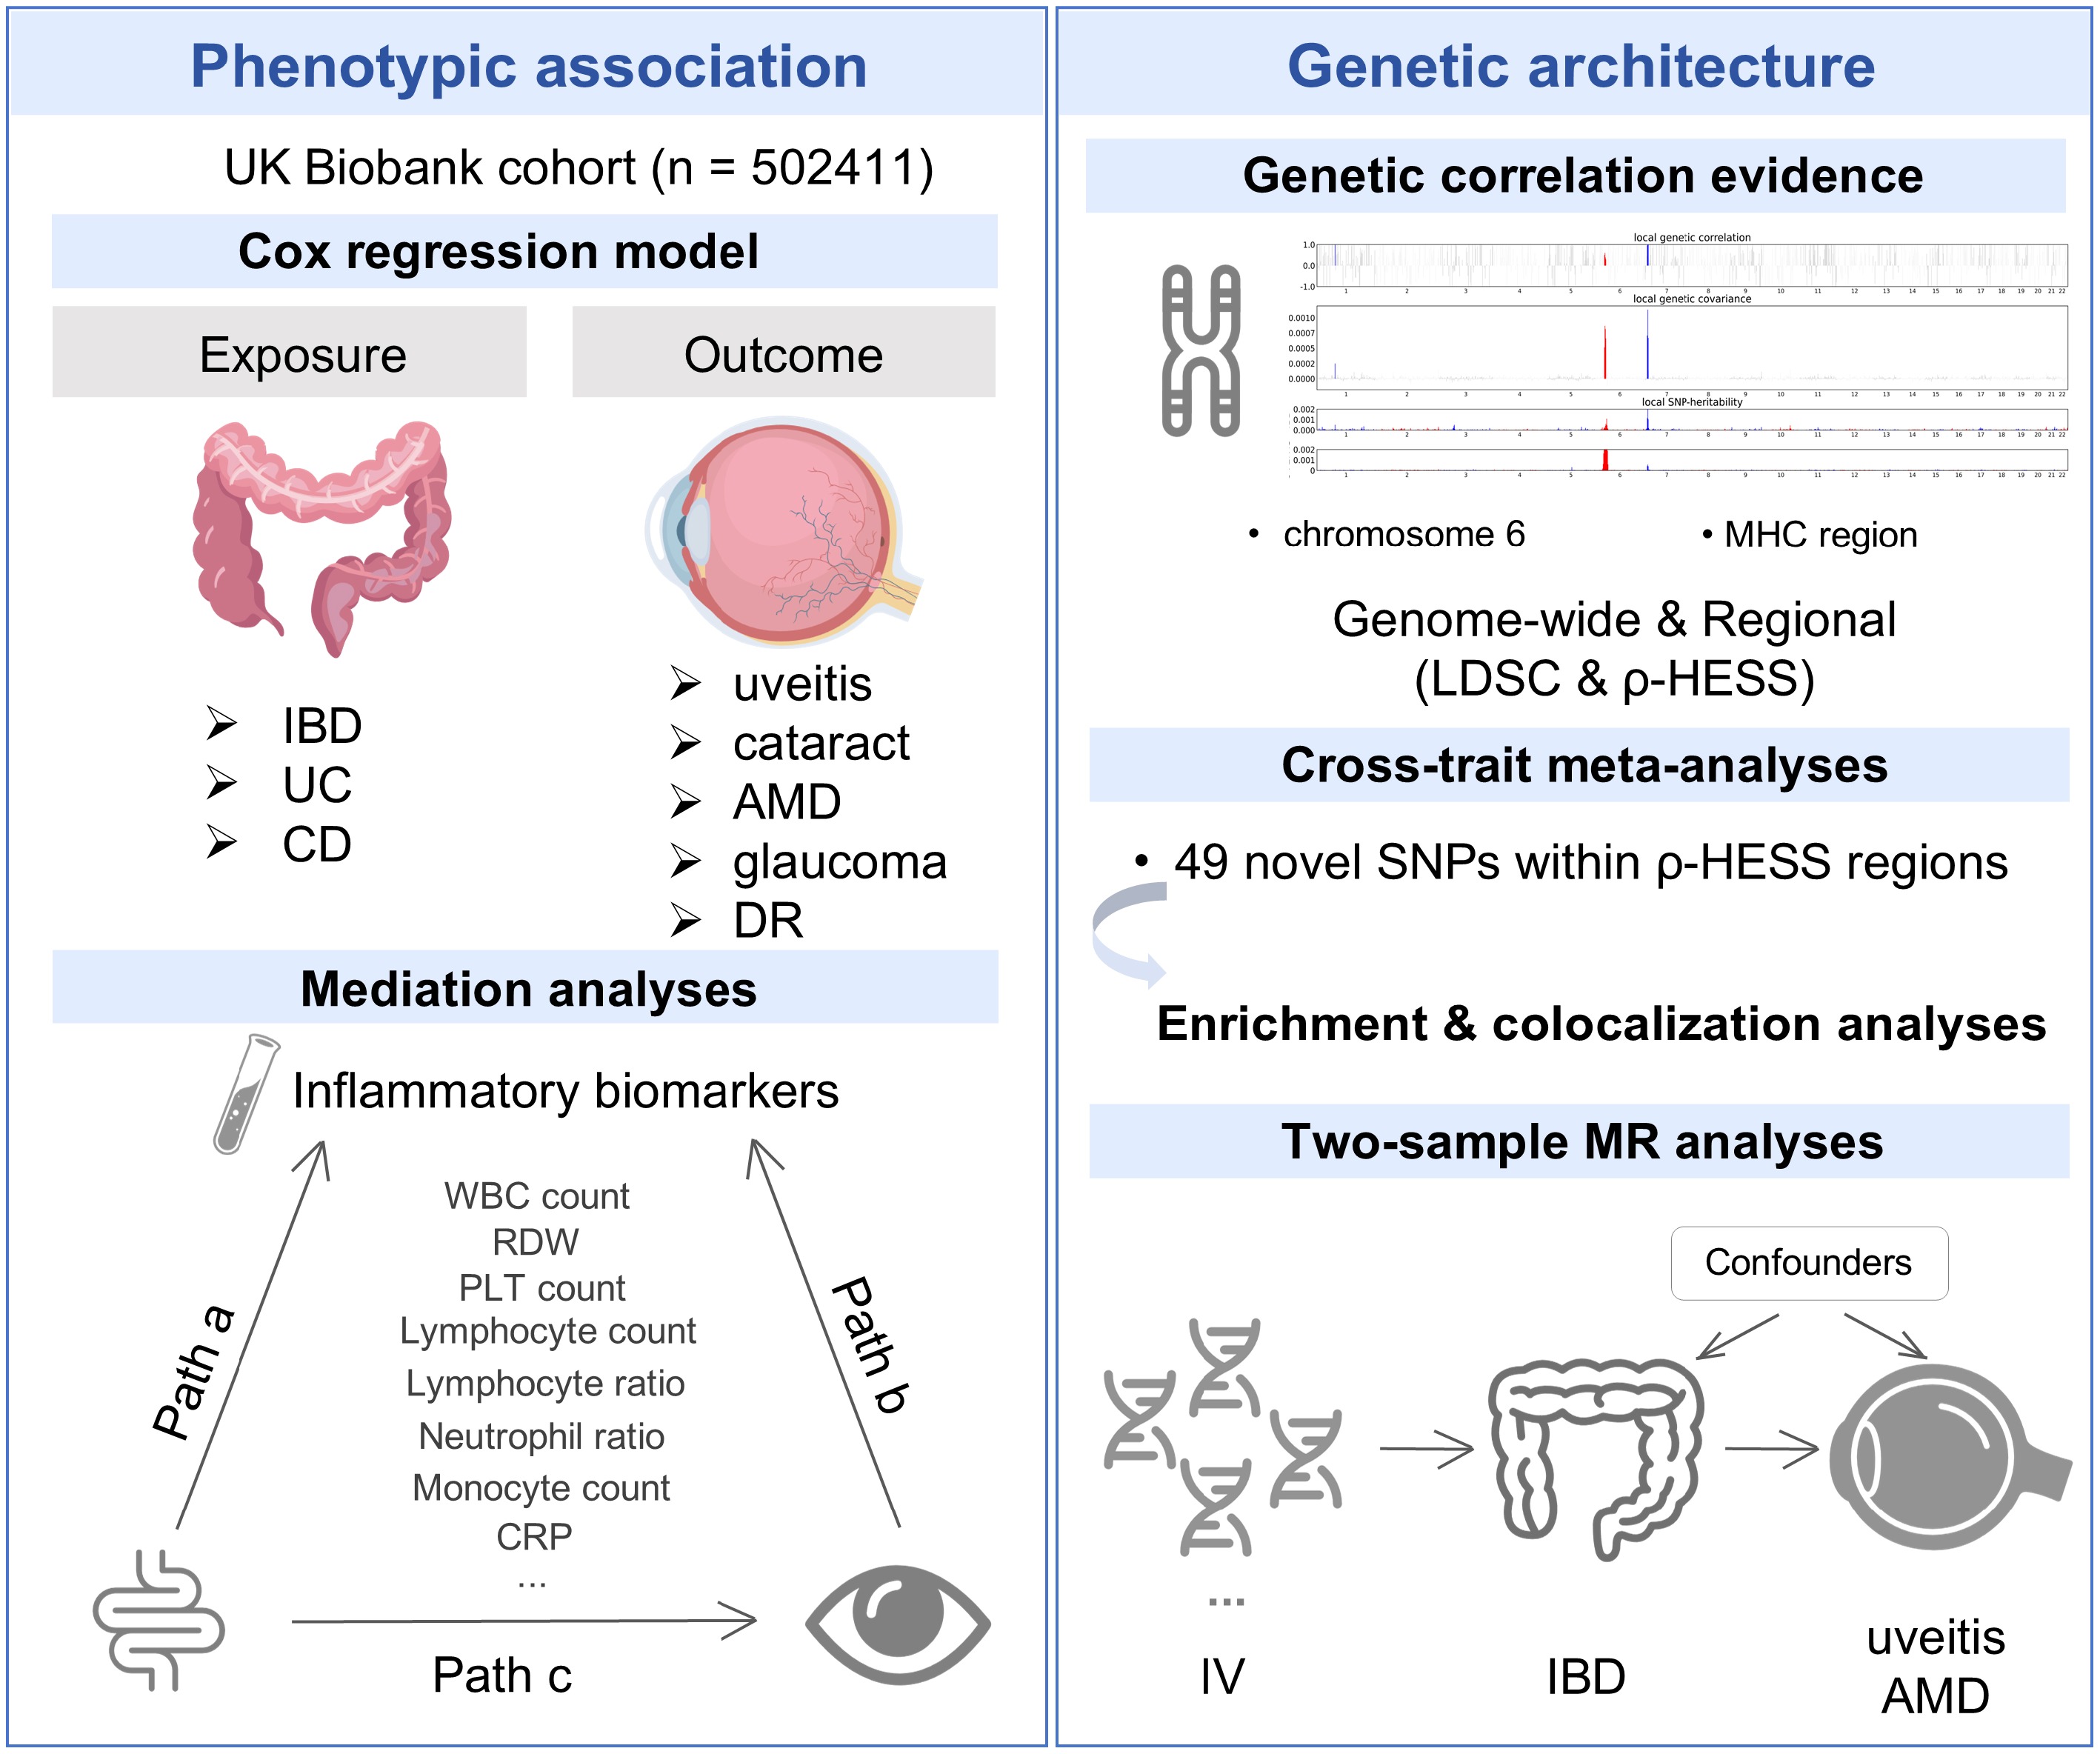
Figure 5.
Graphical summary of the study. IBD, inflammatory bowel disease; UC, ulcerative colitis; CD, Crohn's disease; AMD, age-related macular degeneration; DR, diabetic retinopathy; WBC, white blood cell; RDW, red cell distribution width; PLT, platelet; CRP, C-reactive protein; MHC, major histocompatibility complex; LDSC, linkage disequilibrium score regression; IV, instrumental variable; MR, Mendelian randomization.
-
Overall (n = 499,089) non-IBD (n = 493,099) IBD (n = 5,990) p-value Age, mean (SD), years 56.53 (8.10) 56.52 (8.10) 57.25 (7.91) < 0.001 Sex (%) 0.008 Female 271,661 (54.4) 268,502 (54.5) 3,159 (52.7) Male 227,428 (45.6) 224,597 (45.5) 2,831 (47.3) Ethnicity (%) < 0.001 White 472,255 (94.6) 466,487 (94.6) 5,768 (96.3) Non-White 26,834 (5.4) 26,612 (5.4) 222 (3.7) Education (%) < 0.001 Below college 338,785 (67.9) 334,470 (67.8) 4,315 (72.0) College 160,304 (32.1) 158,629 (32.2) 1,675 (28.0) TDI level (%) 0.258 Low 166,381 (33.3) 164,435 (33.3) 1,946 (32.5) Medium 166,352 (33.3) 164,357 (33.3) 1,995 (33.3) High 166,356 (33.3) 164,307 (33.3) 2,049 (34.2) PA (%) < 0.001 Inadequate 105,225 (21.1) 103,777 (21.0) 1,448 (24.2) Adequate 393,864 (78.9) 389,322 (79.0) 4,542 (75.8) Smoking status (%) < 0.001 Never 274,996 (55.1) 272,131 (55.2) 2,865 (47.8) Previous 171,627 (34.4) 169,085 (34.3) 2,542 (42.4) Current 52,466 (10.5) 51,883 (10.5) 583 (9.7) Alcohol consumption(%) < 0.001 Never 22,197 (4.4) 21,892 (4.4) 305 (5.1) Previous 17,928 (3.6) 17,615 (3.6) 313 (5.2) Current 458,964 (92.0) 453,592 (92.0) 5,372 (89.7) BMI, median (IQR) 26.74 (24.16, 29.88) 26.74 (24.16, 29.88) 26.61 (23.97, 29.57) < 0.001 IBD, inflammatory bowel disease; TDI, townsend deprivation index; BMI, body mass index; SD, standard deviation; PA, physical activity; IQR, interquartile range. Table 1.
Baseline characteristics of participants with and without IBD.
-
Ocular outcomes Person-
yearsCases IBD UC CD Model 1 Model 2 Model 1 Model 2 Model 1 Model 2 HR
(95% CI)p-value HR
(95% CI)p-value HR
(95% CI)p-value HR
(95% CI)p-value HR
(95% CI)p-value HR
(95% CI)p-value Uveitis 7,554,323 1,374 2.48
(1.82–3.39)< 0.001 1.91
(1.37–2.66)< 0.001 2.33
(1.58–3.43)< 0.001 1.74
(1.15–2.62)< 0.001 3.01
(1.81–5.00)< 0.001 2.23
(1.33–3.74)< 0.01 Cataract 7,051,549 59,260 1.16
(1.08–1.24)< 0.001 1.09
(1.02–1.18)0.01 1.16
(1.07–1.26)< 0.001 1.1
(1.01–1.20)0.03 1.17
(1.03–1.32)0.02 1.09
(0.96–1.23)0.19 AMD 7,501,978 10,003 1.28
(1.1–1.5)< 0.01 1.22
(1.04–1.44)0.02 1.22
(1.01–1.48)0.04 1.15
(0.94–1.41)0.17 1.49
(1.14–1.95)< 0.01 1.40
(1.07–1.84)0.01 Glaucoma 7,474,110 11,164 1.31
(1.14–1.52)< 0.001 1.22
(1.05–1.42)0.01 1.3
(1.09–1.56)< 0.01 1.2
(1.00–1.45)0.05 1.25
(0.95–1.65)0.12 1.15
(0.87–1.52)0.33 DR 7,534,485 3,734 1.49
(1.18–1.9)< 0.001 1.39
(1.08–1.79)0.01 1.52
(1.14–2.02)< 0.01 1.39
(1.03–1.88)0.03 1.4
(0.89–2.2)0.14 1.3
(0.83–2.05)0.25 Retinal vascular
occlusion7,559,147 2,653 1.05
(0.75–1.47)0.77 0.92
(0.64–1.32)0.66 1.05
(0.71–1.58)0.79 0.91
(0.48–4.93)0.47 1.04
(0.56–1.93)0.91 0.95
(0.51–1.87)0.87 Optic neuritis 7,567,282 184 2.31
(0.95–5.61)0.07 1.62
(0.64–4.08)0.3 2.08
(0.67–6.53)0.21 1.54
(0.63–6.2)0.24 2.96
(0.73–11.91)0.13 1.81
(0.43–7.54)0.41 Retinal
detachment7,522,582 3,099 1.09
(0.8–1.49)0.57 1.14
(0.83–1.58)0.42 1.12
(0.77–1.62)0.56 1.16
(0.78–1.71)0.45 1.14
(0.66–1.96)0.64 1.2
(0.69–2.08)0.52 Keratitis 7,564,144 473 1.74
(0.93–3.26)0.08 1.05
(0.53–2.06)0.89 1.56
(0.7–3.49)0.28 0.91
(0.39–2.15)0.83 2.3
(0.86–6.15)0.1 1.41
(0.52–3.82)0.51 Conjunctivitis 7,563,762 636 1.27
(0.68–2.37)0.46 1.19
(0.62–2.27)0.6 1.31
(0.62–2.76)0.48 1.26
(0.58–2.71)0.56 0.86
(0.21–3.44)0.83 0.77
(0.19–3.09)0.71 IBD, inflammatory bowel disease; UC, ulcerative colitis; CD, Crohn's disease; AMD, age-related macular degeneration; DR, diabetic retinopathy. Model 1: Adjusted for age and sex; Model 2: adjusted for age, sex, ethnicity, educational level, TDI, physical activity, smoking status, alcohol consumption, BMI, IBD-related medications, diabetes (except for diabetic retinopathy), and hypertension. Table 2.
Observational associations between IBD and ocular diseases.
-
Trait 1 Trait 2 rg SE p-value for LDSC Intercept (SE) IBD Uveitis 0.4218 0.1192 0.0004 0.0584 (0.0106) UC 0.5101 0.1221 2.96 × 10⁻⁵ 0.0373 (0.009) CD 0.2271 0.0909 0.0125 0.0078 (0.0047) IBD Cataracts 0.0217 0.048 0.6514 0.0208 (0.0067) UC 0.0239 0.0515 0.6417 0.0137 (0.0061) CD 0.0676 0.0436 0.1213 −0.0019 (0.0054) IBD AMD 0.032 0.0424 0.45 −0.0019 (0.0058) UC 0.0239 0.0412 0.5615 −0.0023 (0.0057) CD 0.0967 0.0399 0.0152 −0.0055 (0.0052) IBD Glaucoma −0.0276 0.0335 0.4111 0.0021 (0.0067) UC −0.0546 0.0317 0.085 0.0136 (0.007) CD −0.0626 0.036 0.0823 0.0129 (0.0067) IBD DR 0.0264 0.0899 0.7694 0.0029 (0.0062) UC 0.048 0.0994 0.6294 0.0029 (0.0061) CD −0.0638 0.0918 0.4869 −0.0007 (0.0054) rg, genetic correlation; IBD, inflammatory bowel disease; UC, ulcerative colitis; CD, Crohn's disease; AMD, age-related macular degeneration; DR, diabetic retinopathy. Bonferroni-adjusted significance threshold was set at p < 3.33 × 10⁻³ (0.05/15). Table 3.
Genomewide genetic correlations between IBD and ocular diseases.
Figures
(5)
Tables
(3)