-
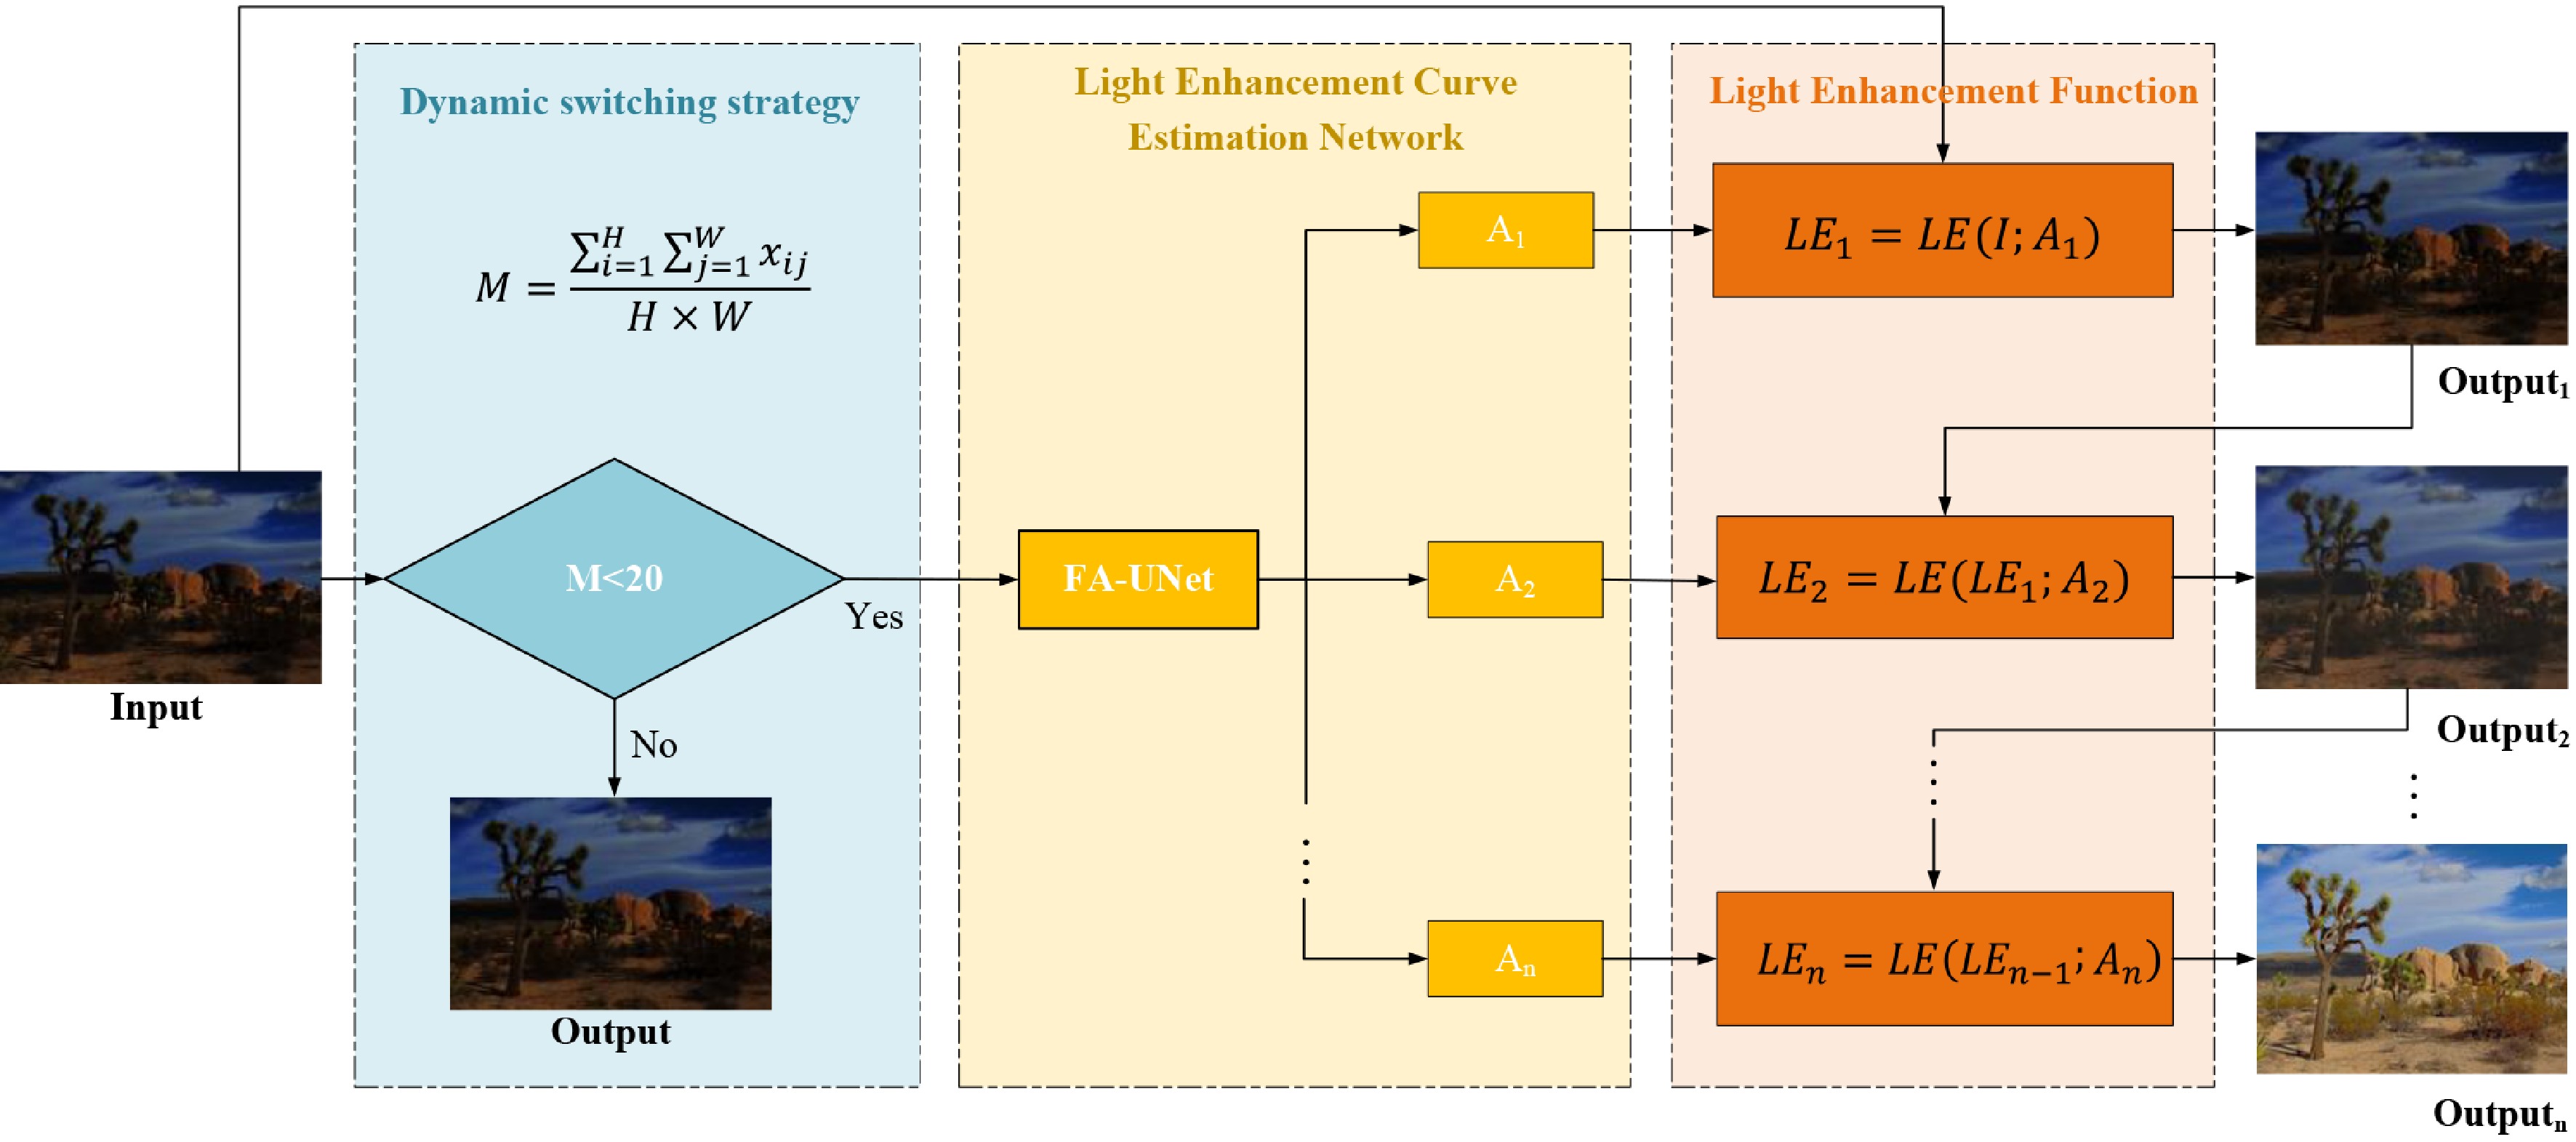
Figure 1.
The LLIE framework.
-
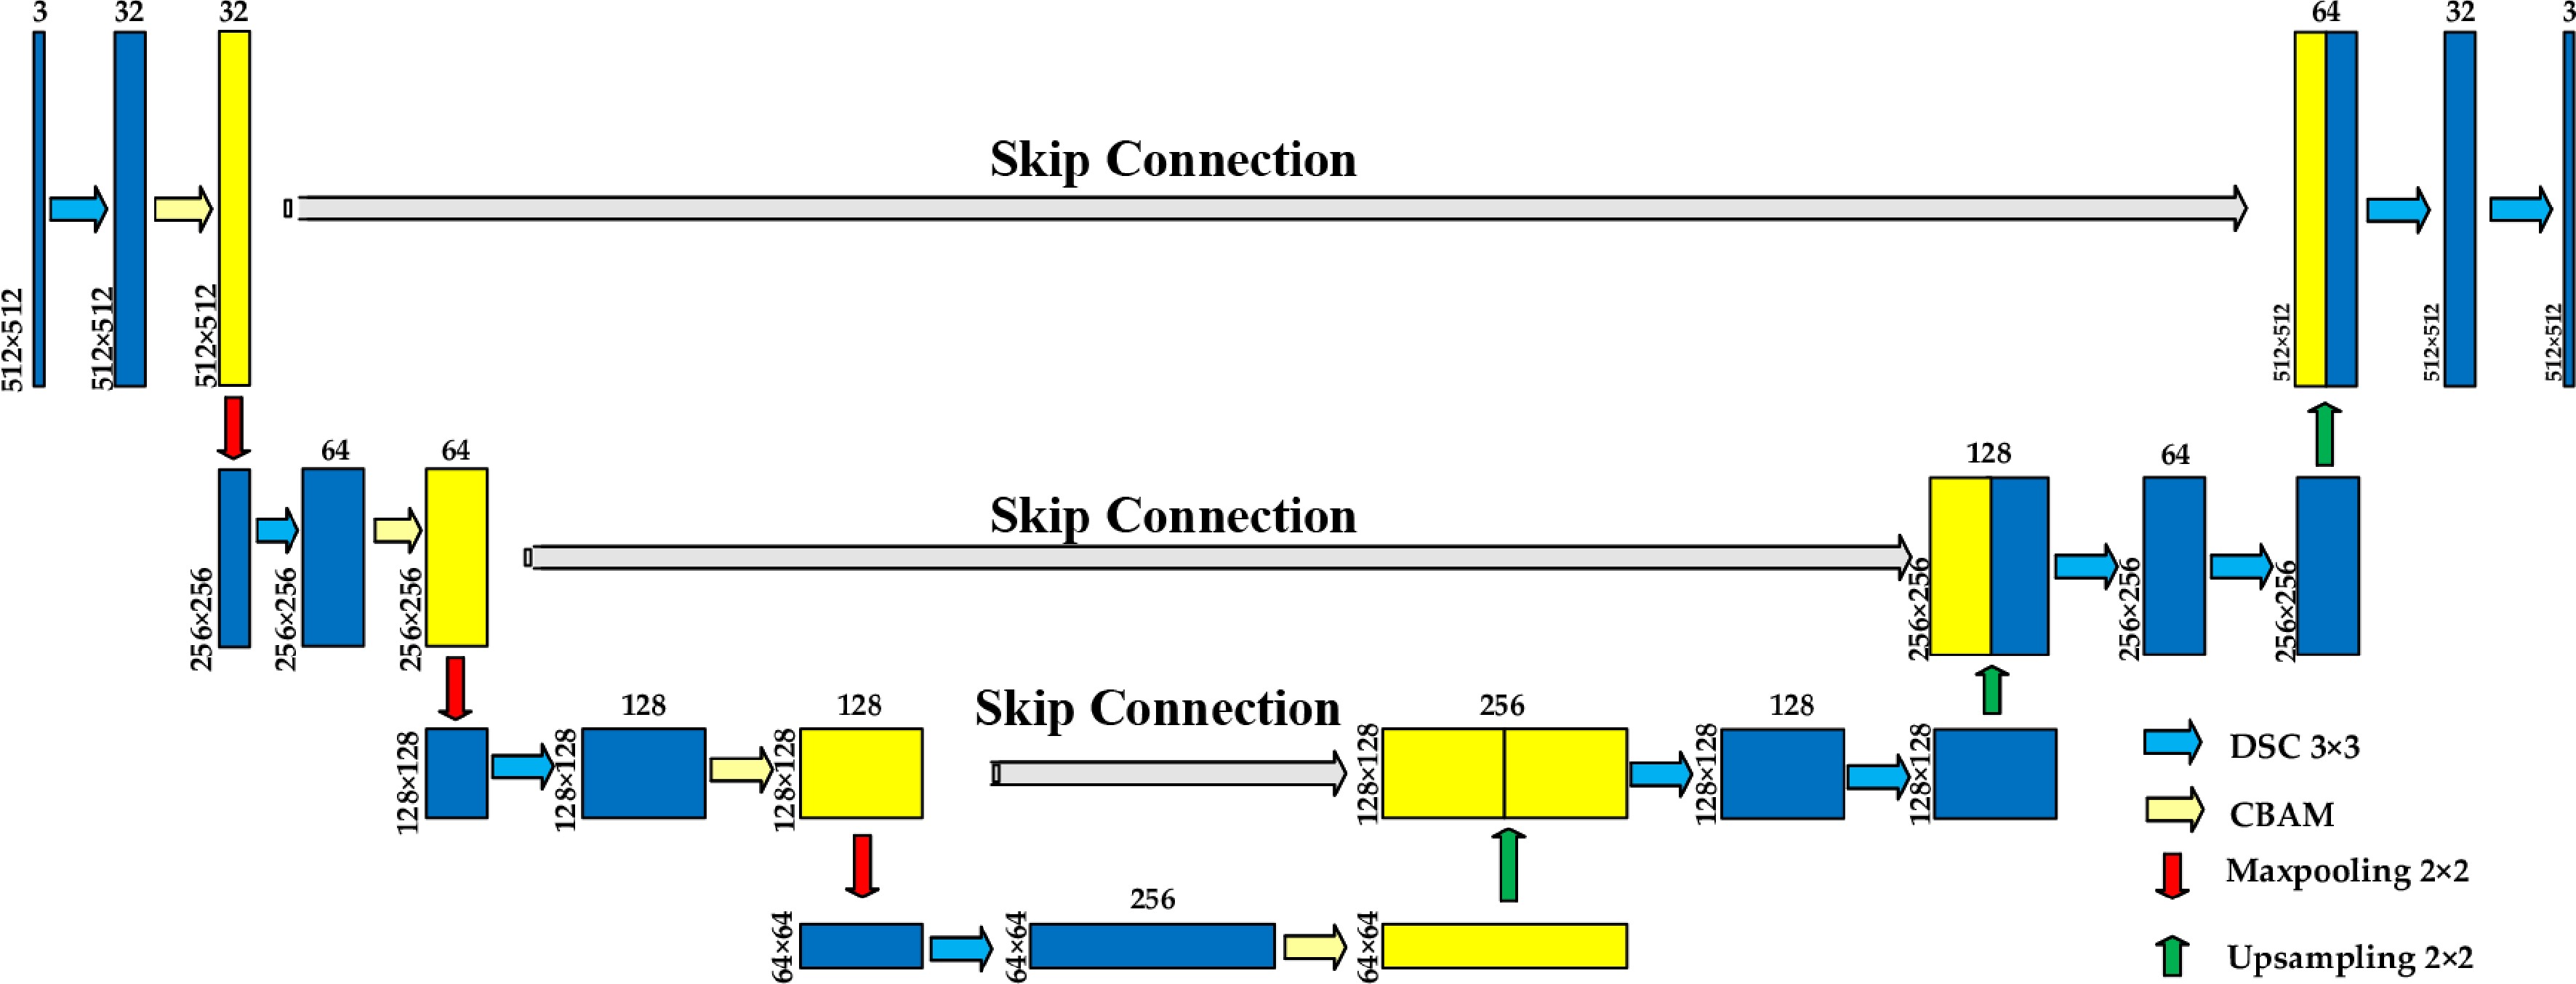
Figure 2.
FA-UNet.
-
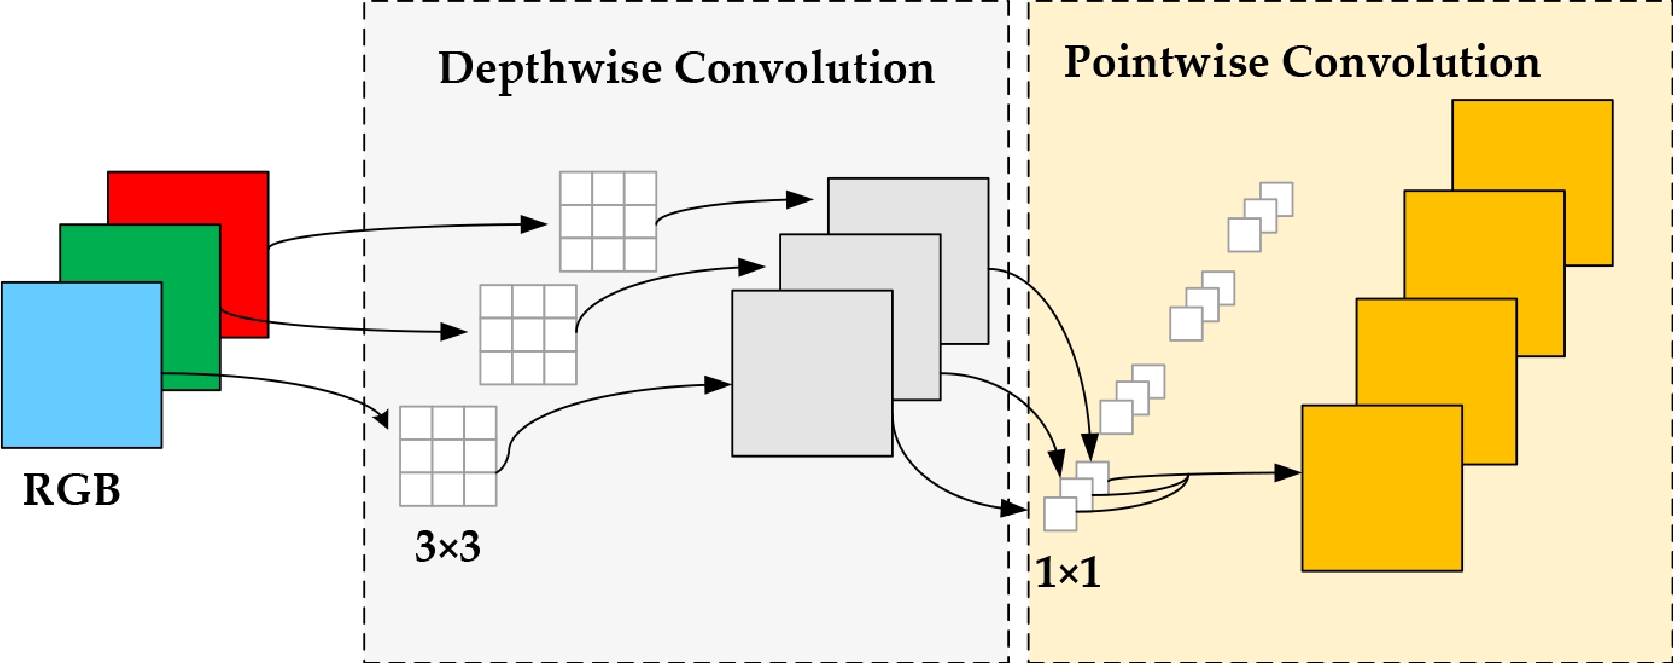
Figure 3.
Depthwise separable convolution network.
-
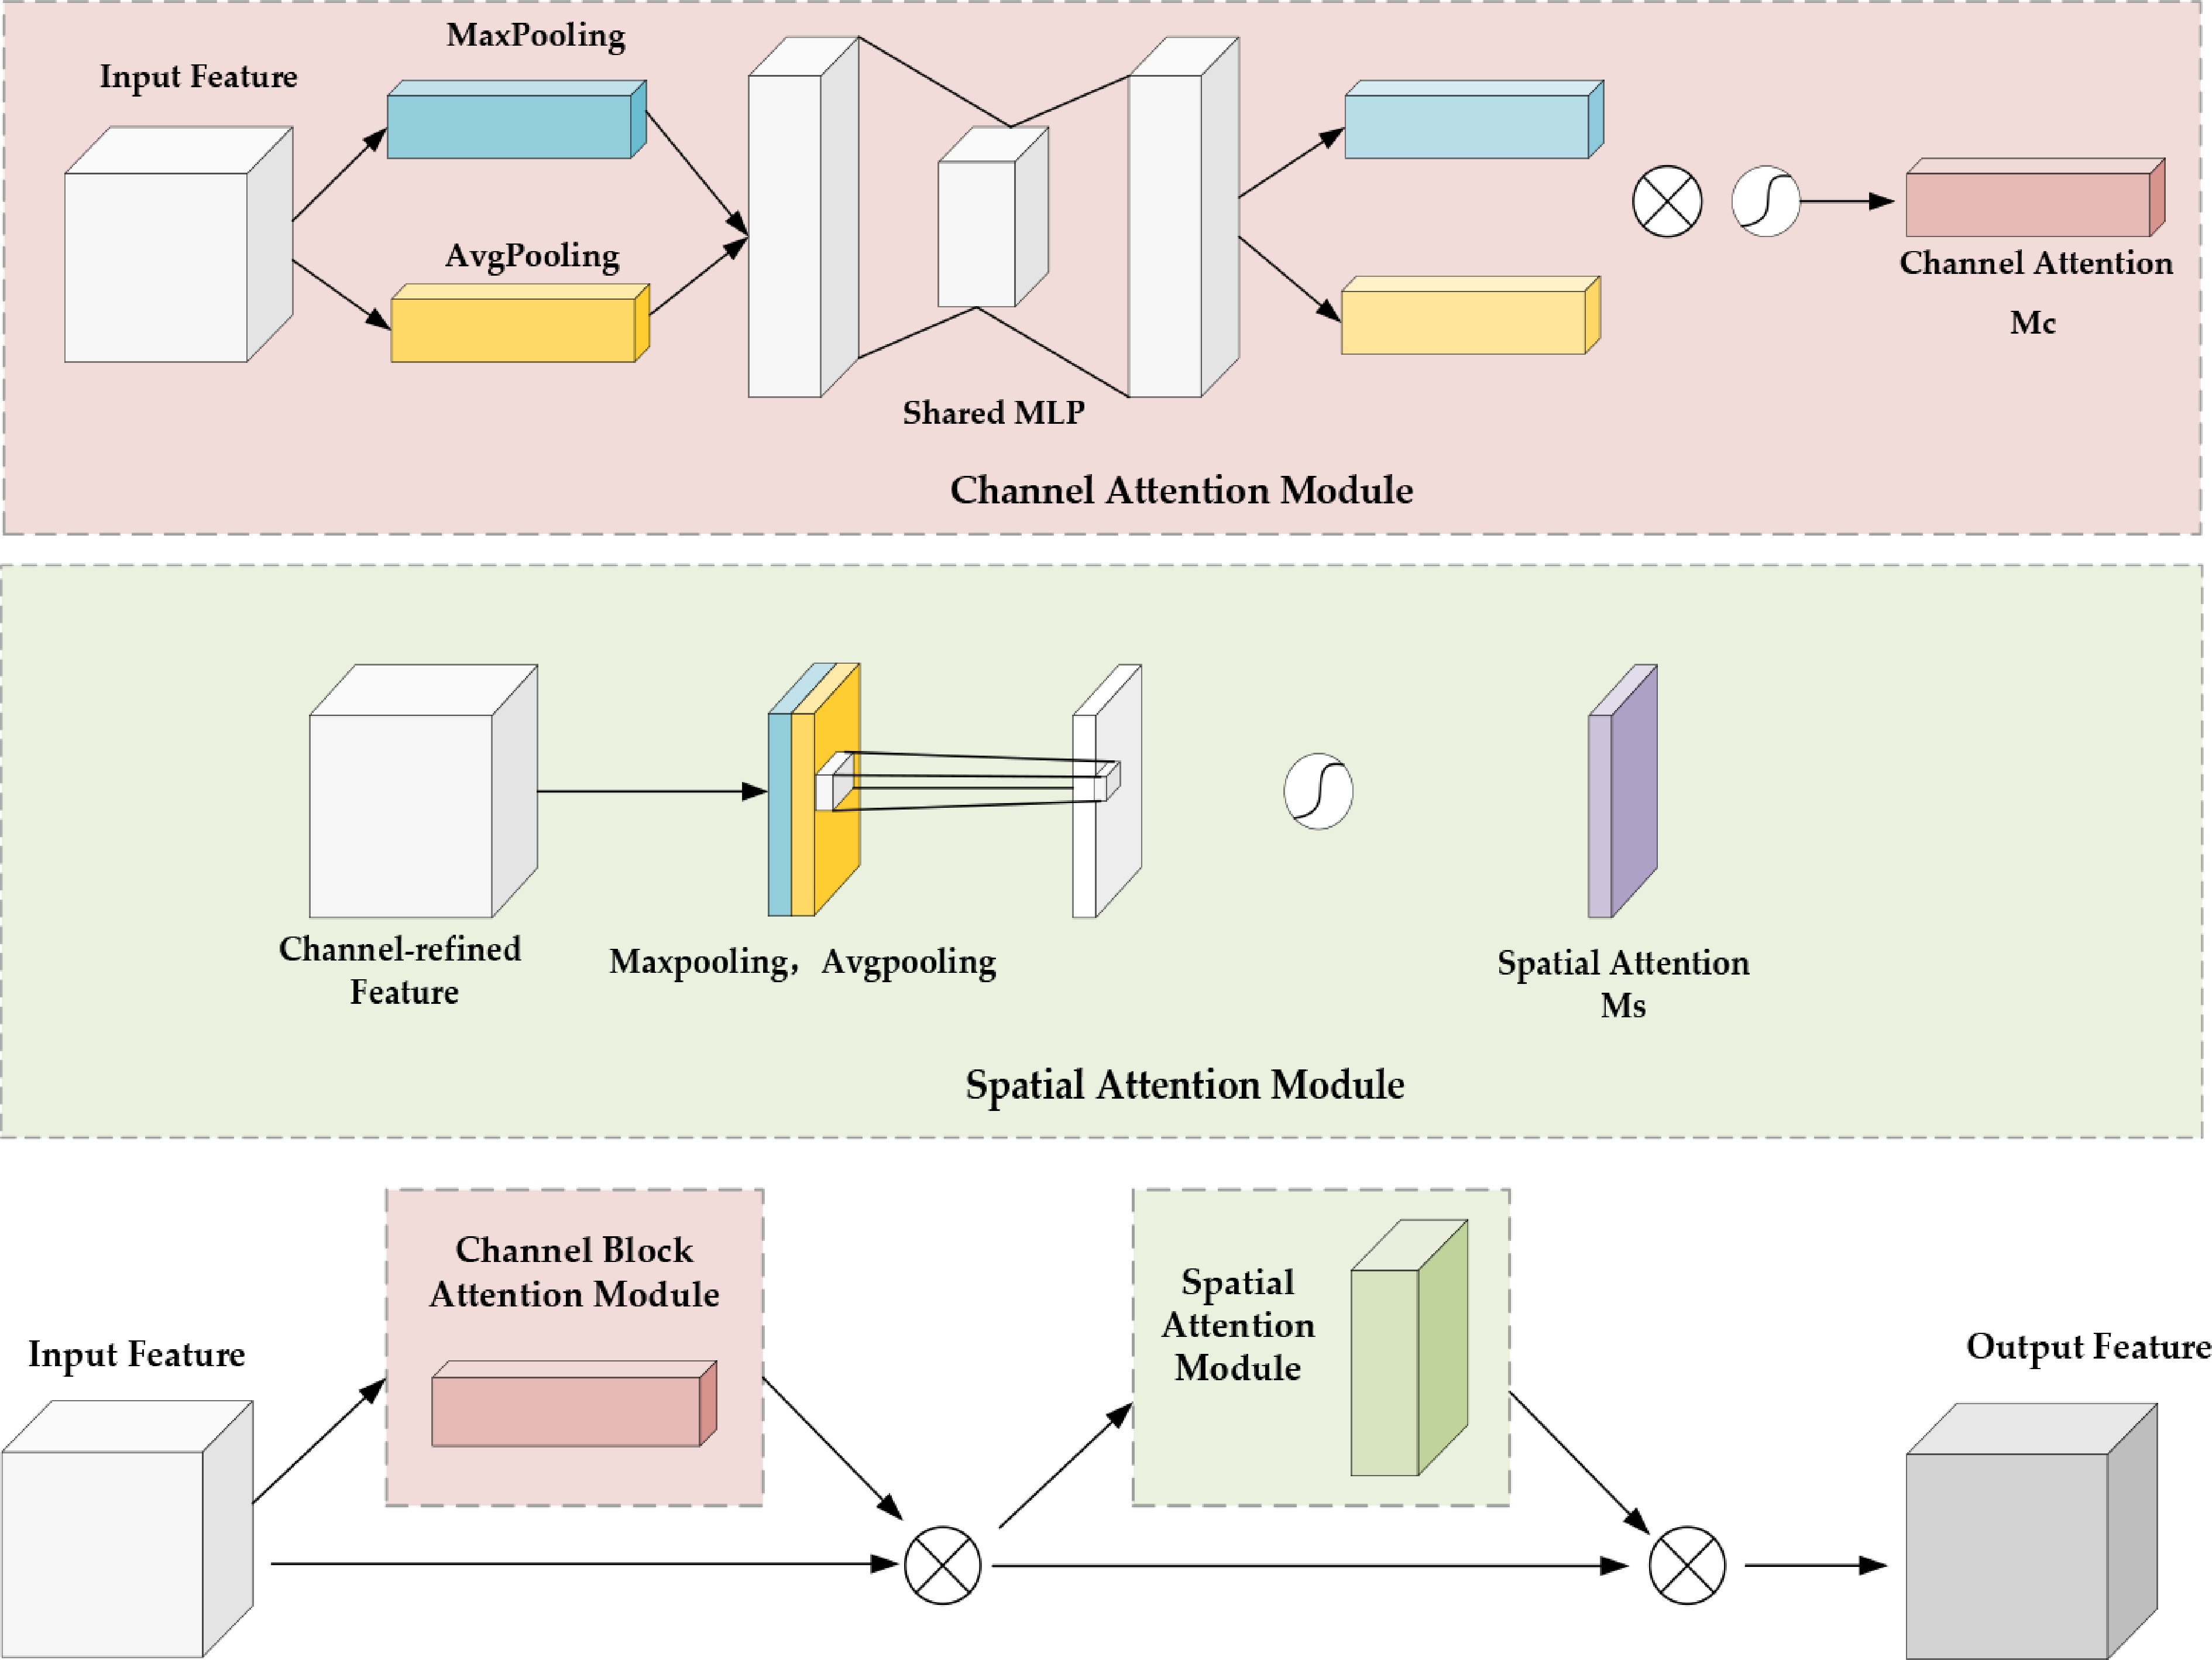
Figure 4.
Convolutional block attention module.
-
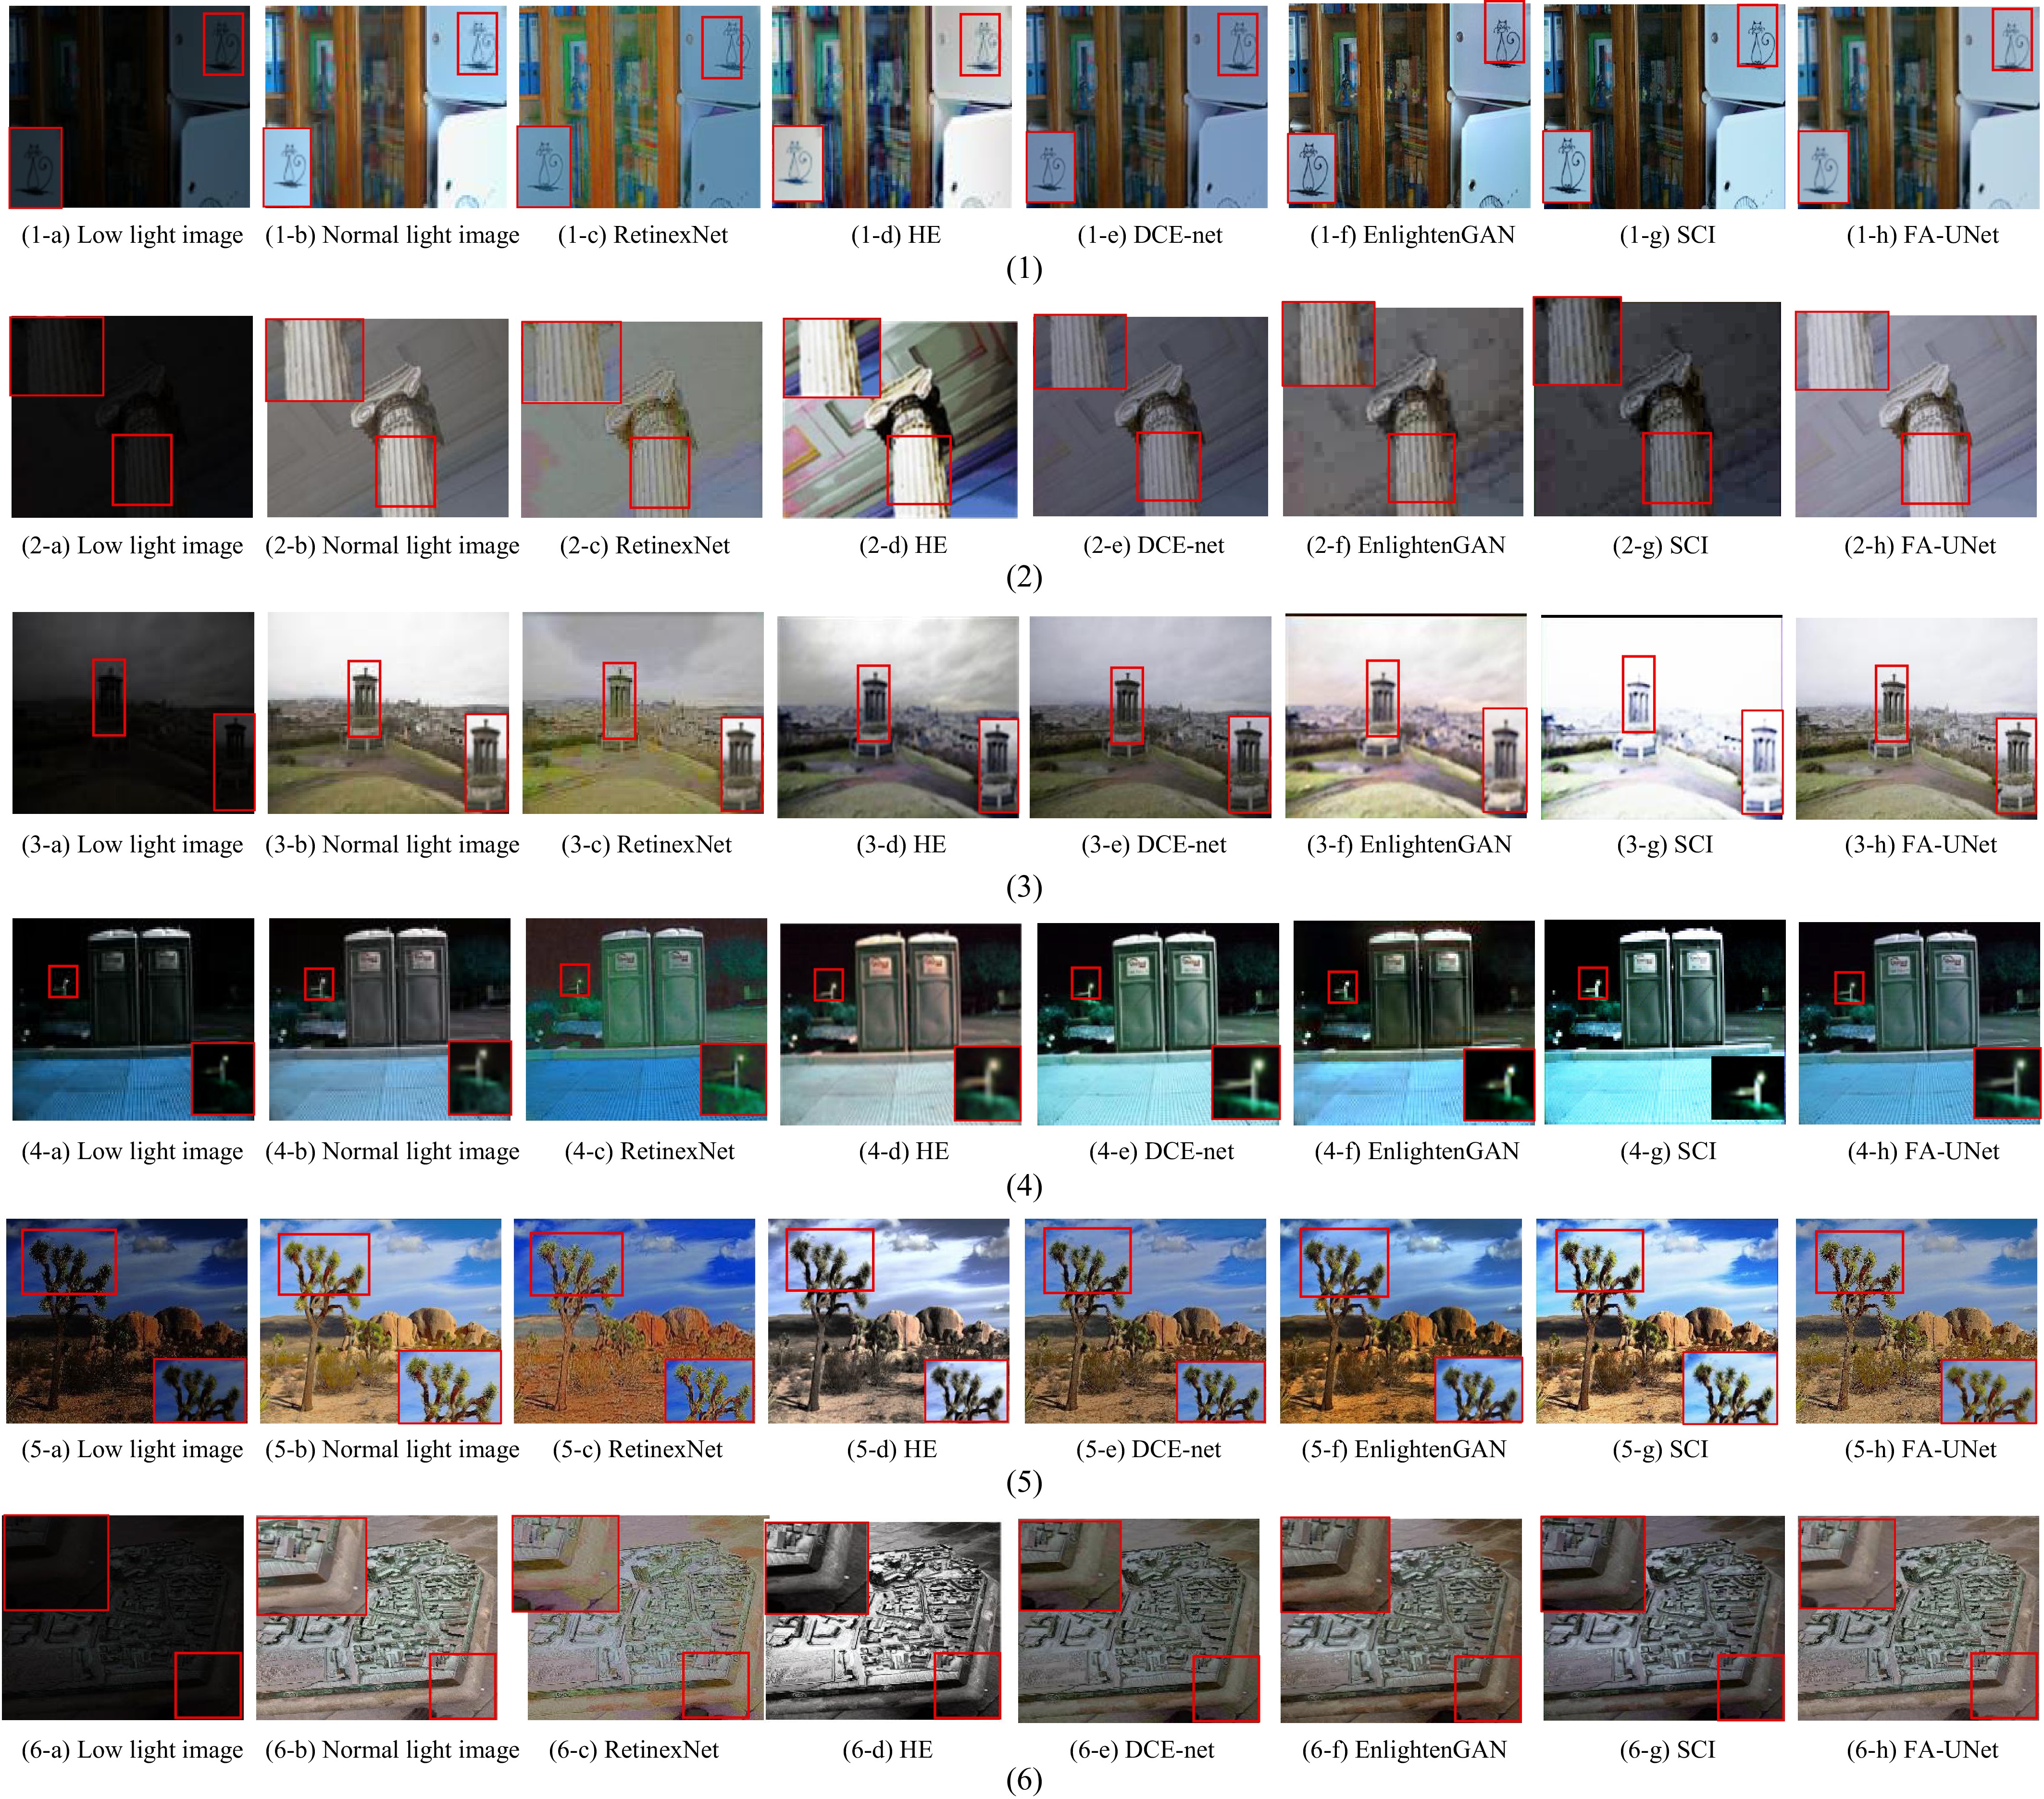
Figure 5.
Visual comparison between dark light and enhanced image.
-
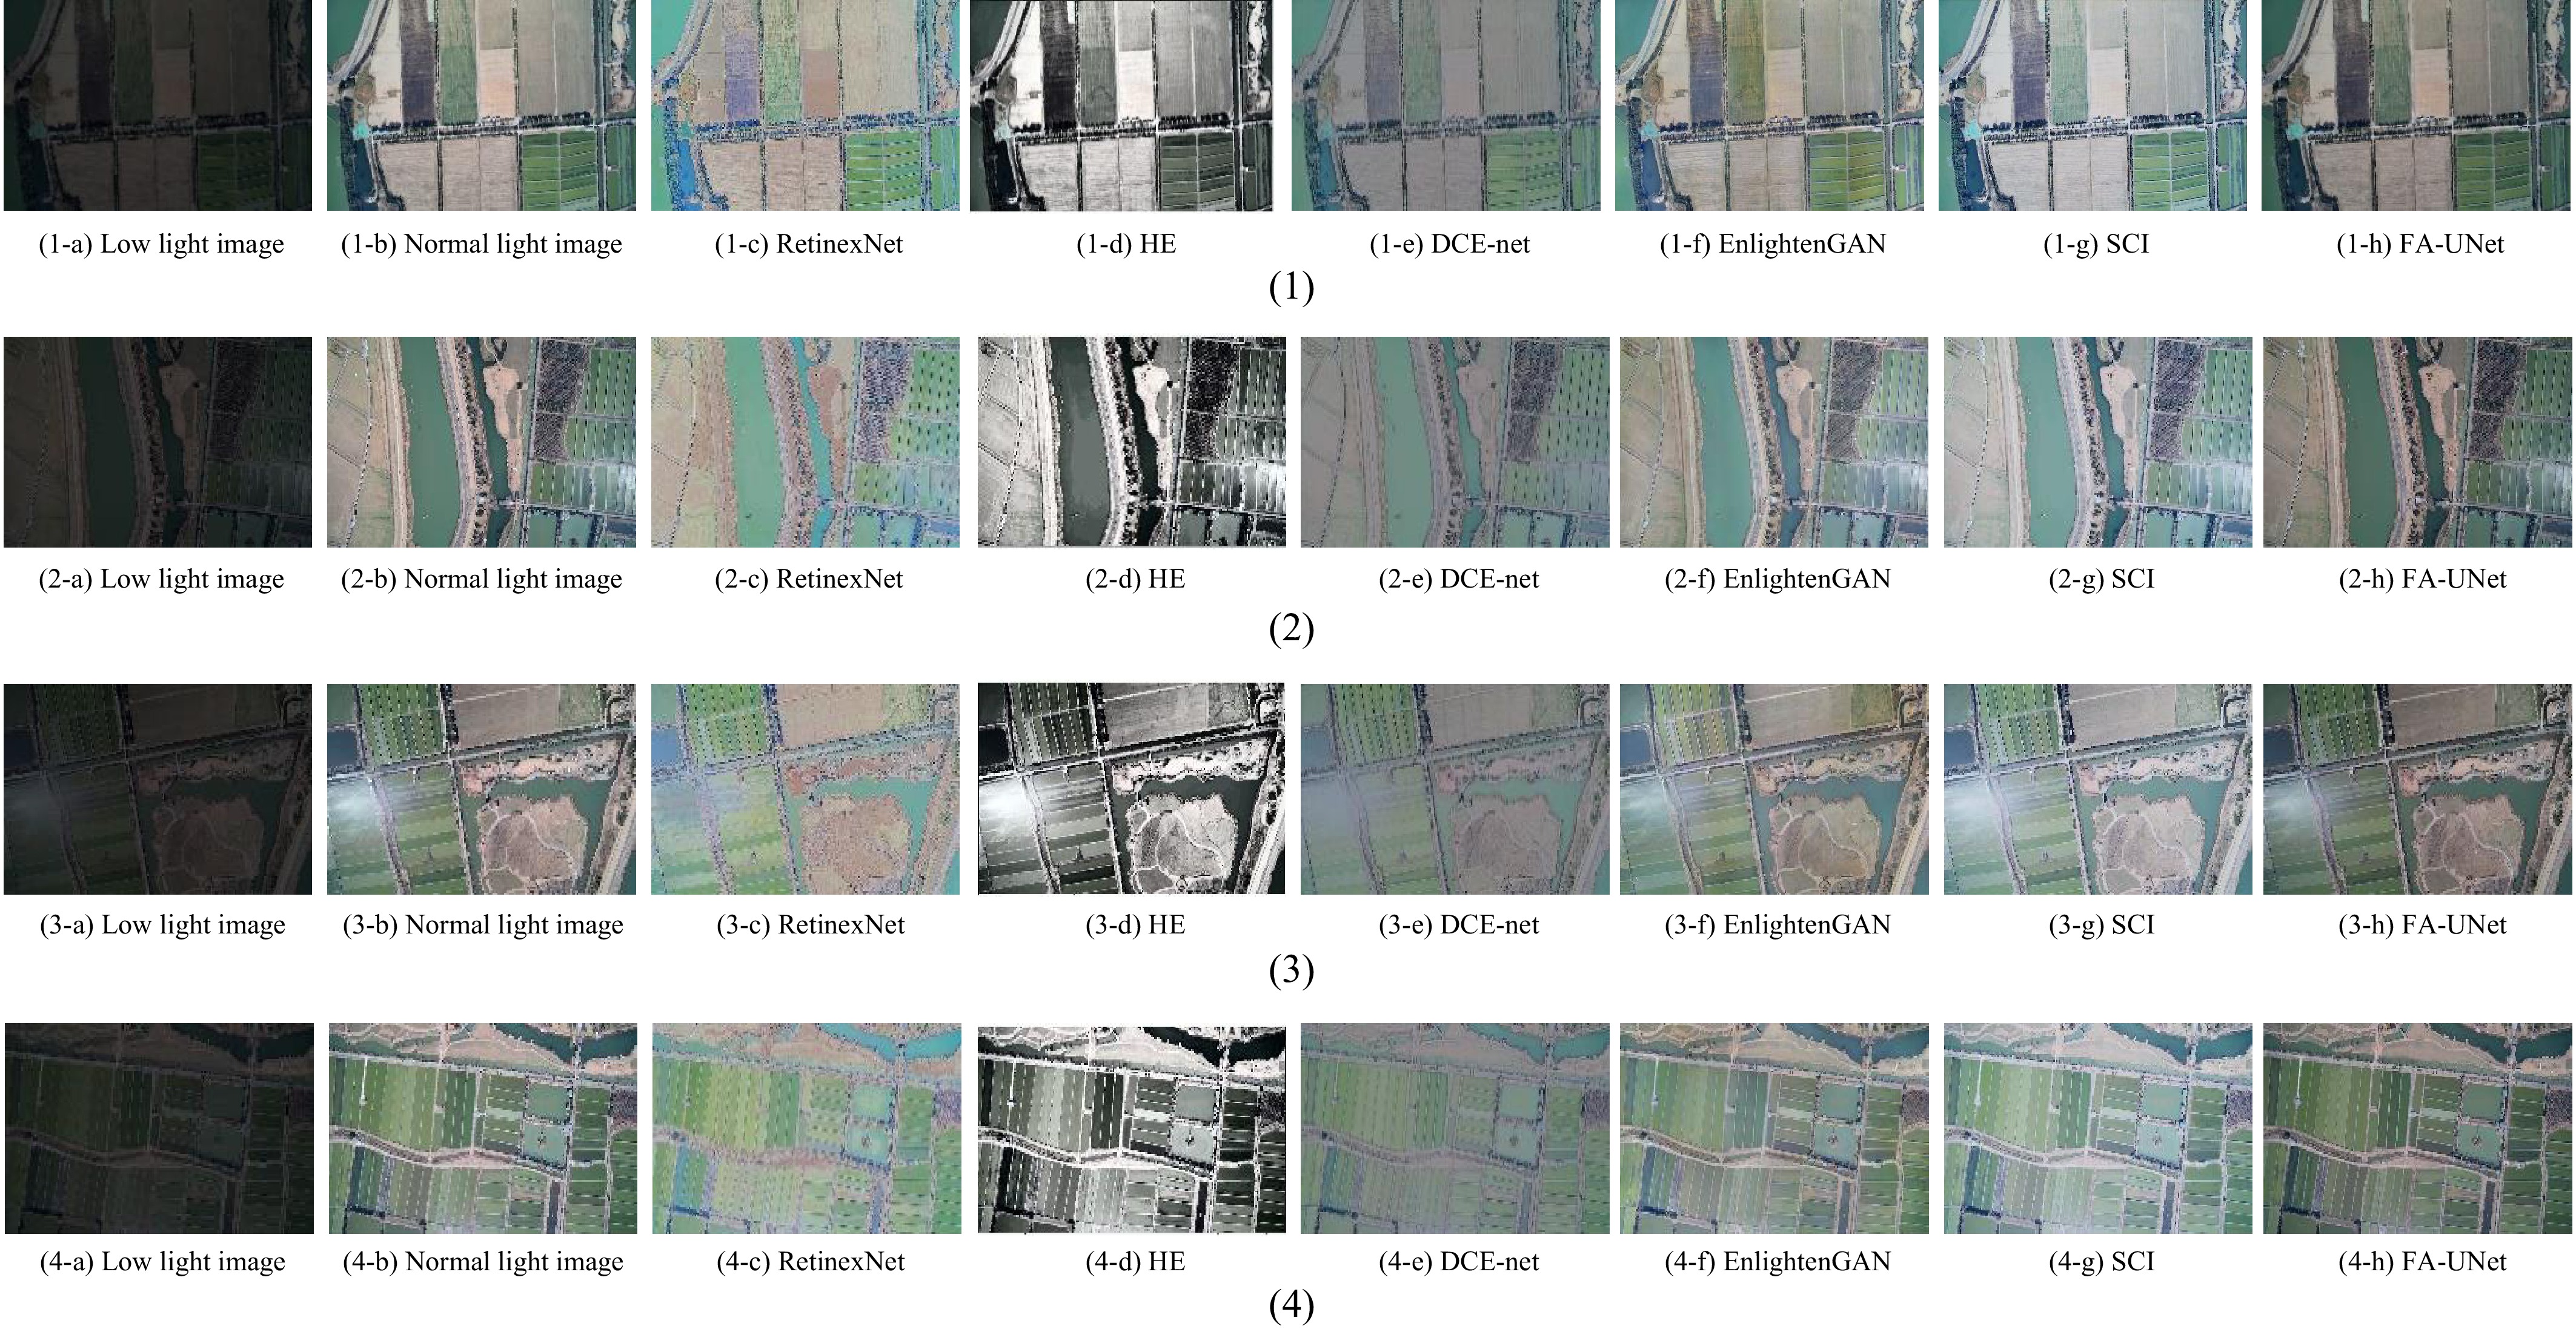
Figure 6.
Visual comparison on real-world image.
-
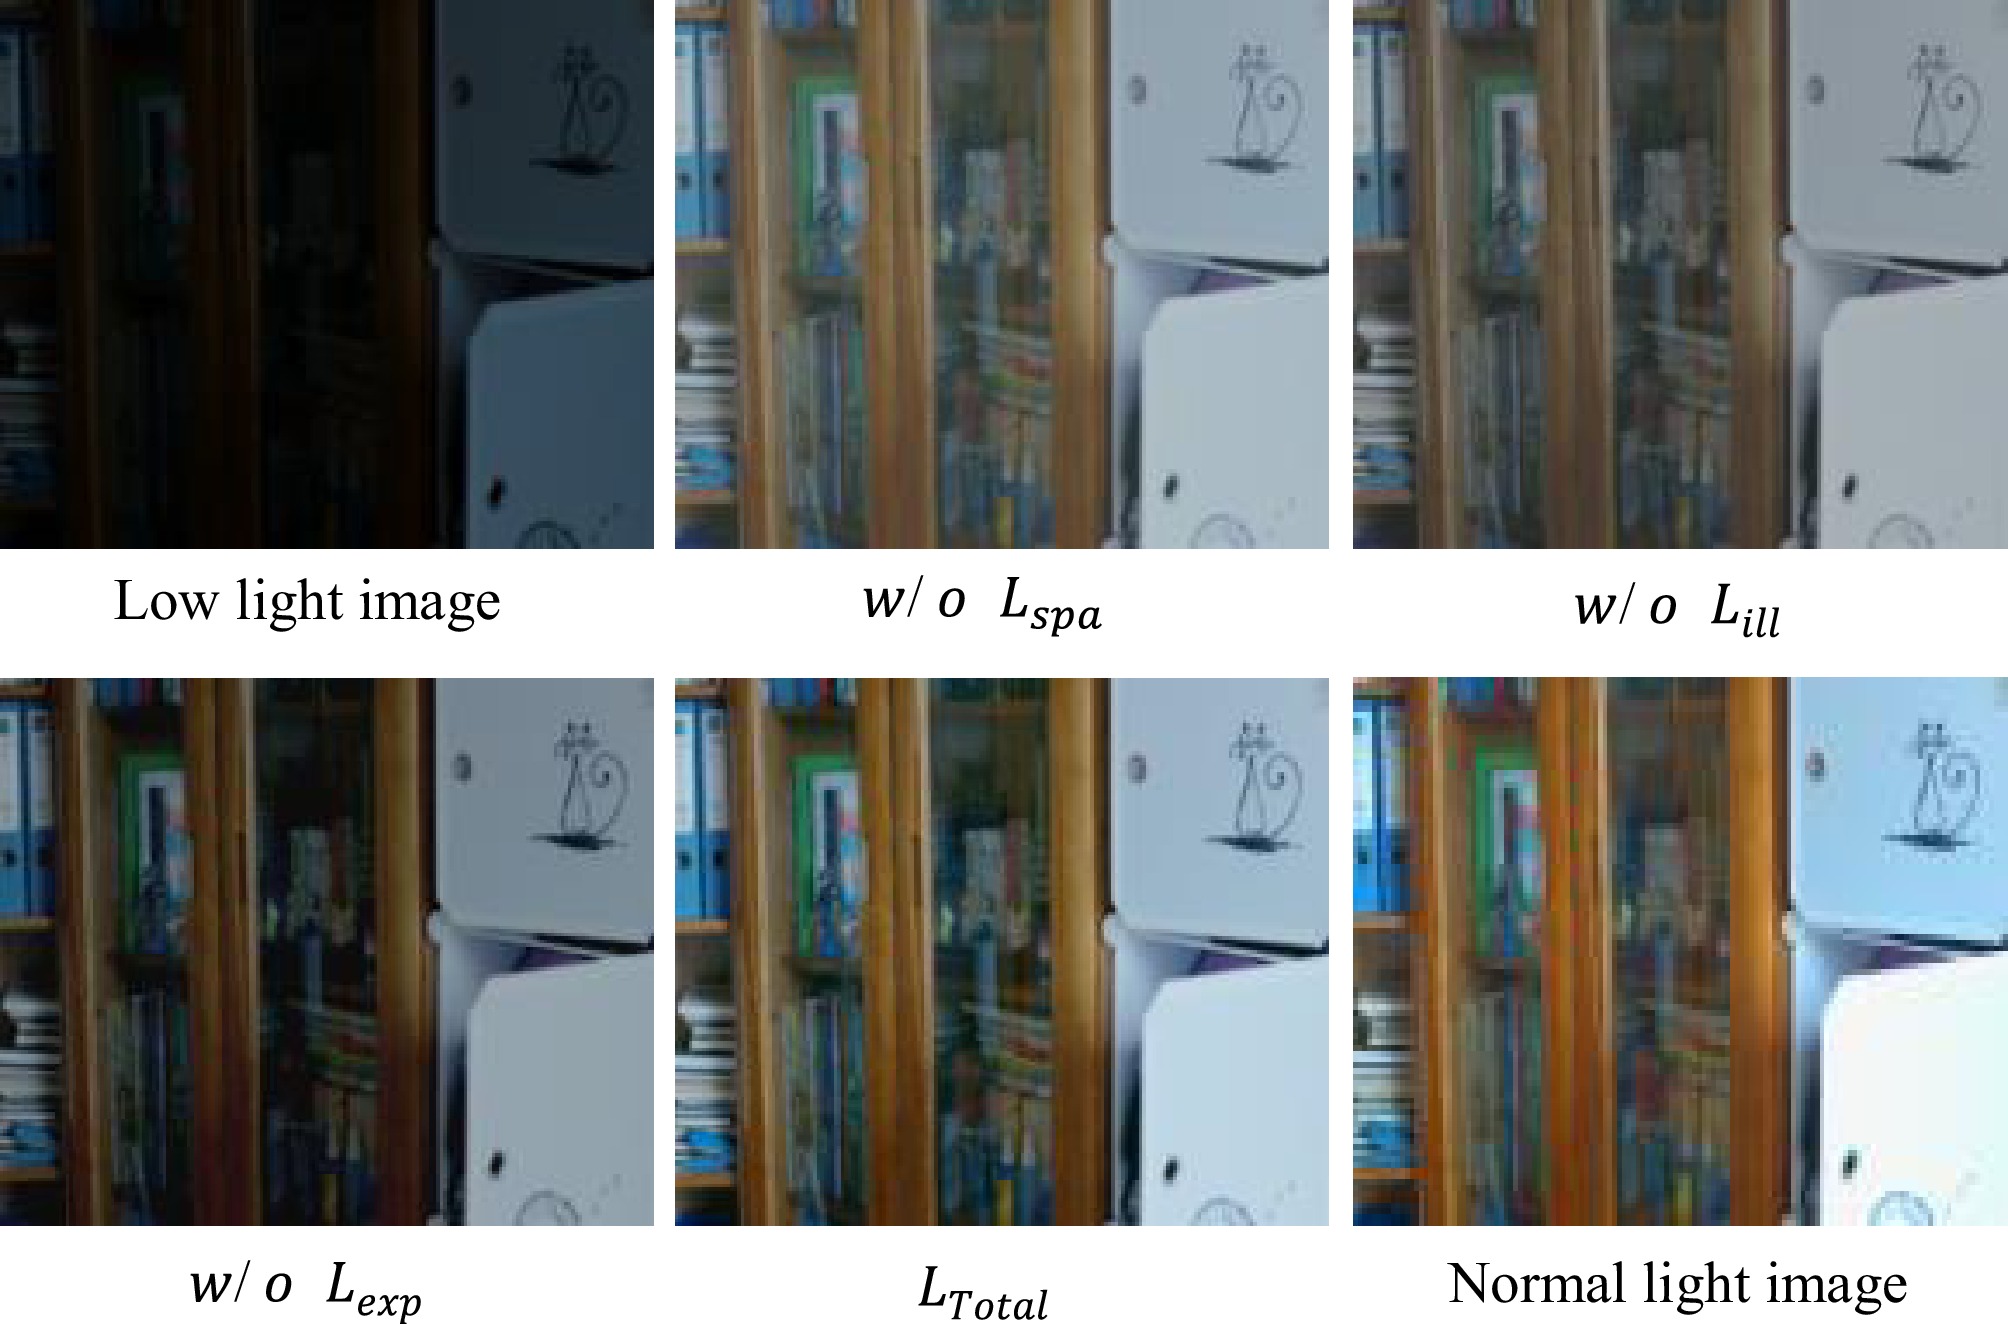
Figure 7.
Visual comparison of different loss functions
-
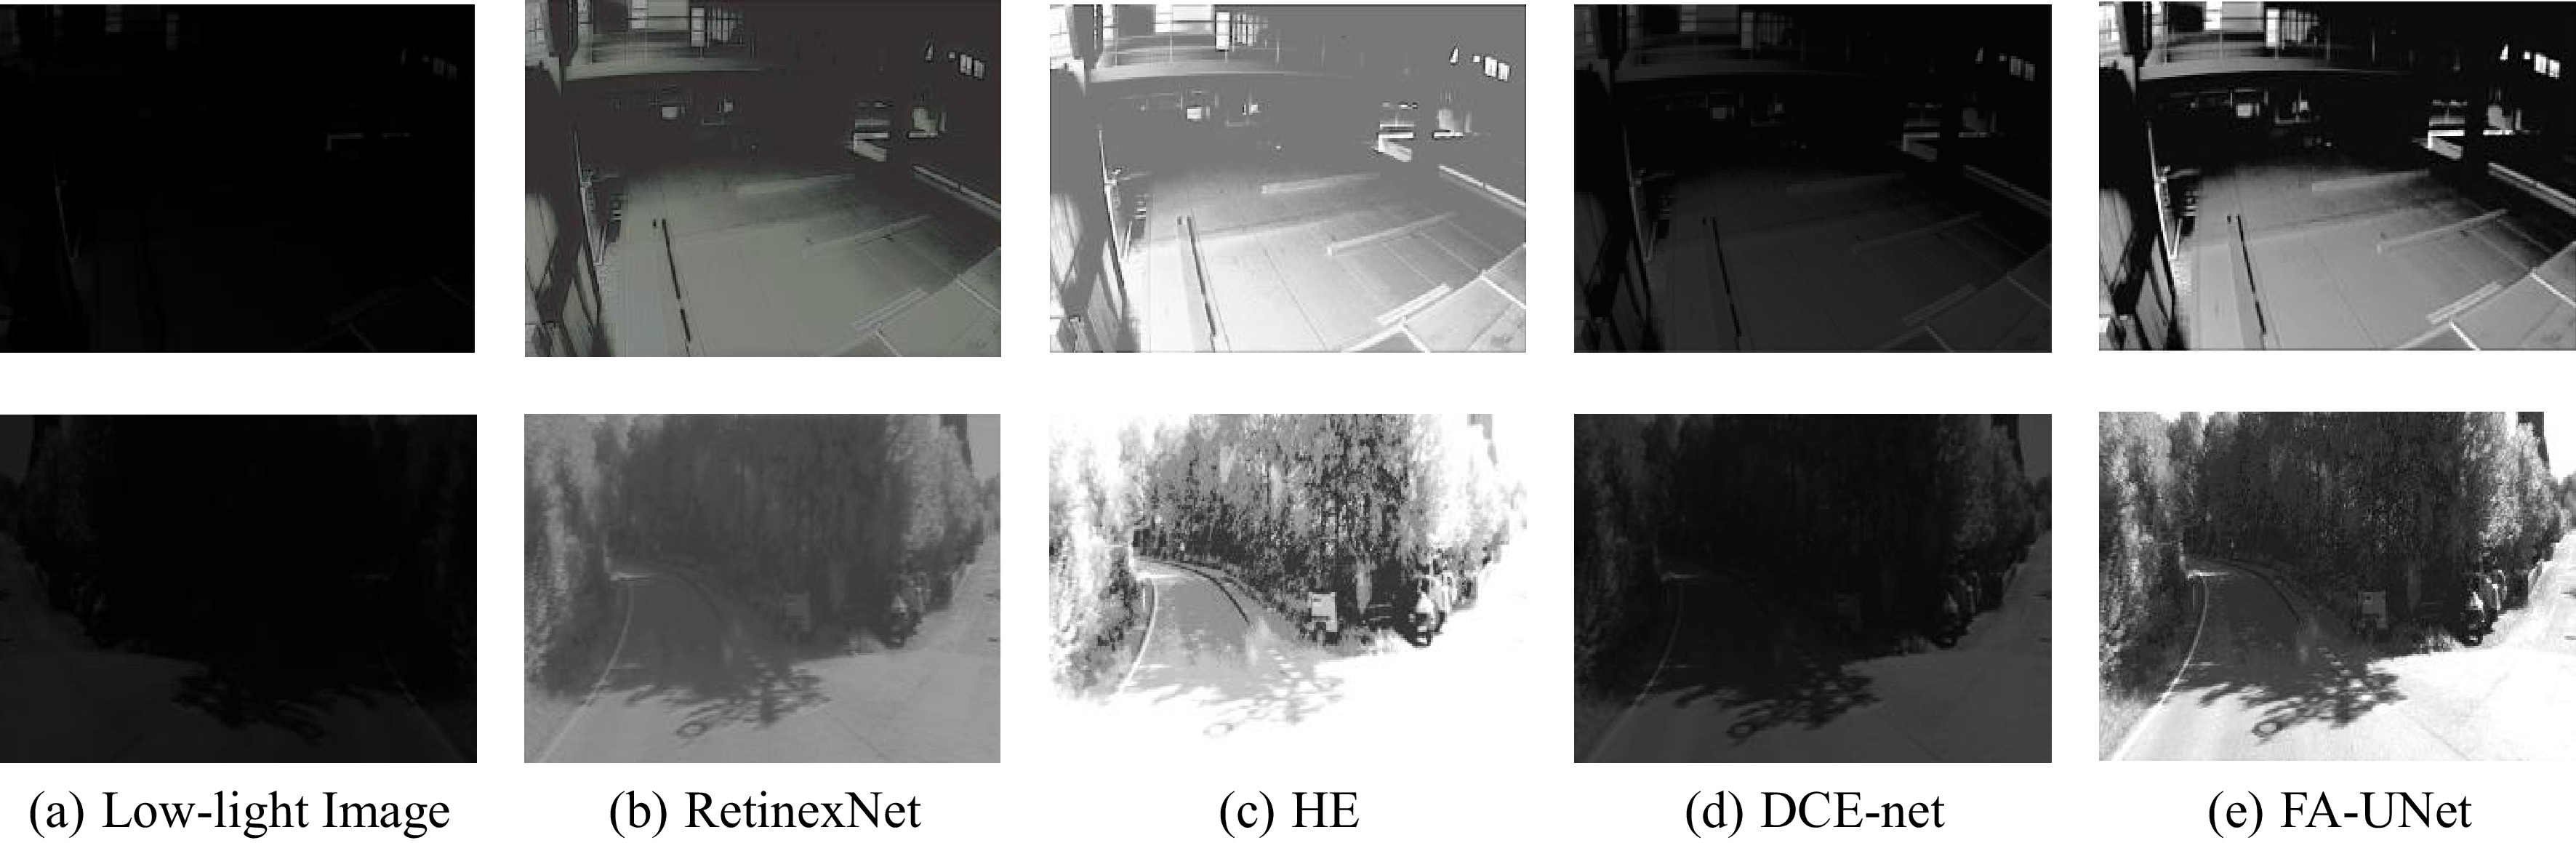
Figure 8.
Visual effects of LLIE methods.
-
Methods PSNR SSIM NIQE LPIPS LOL-v1 RetinexNet 16.77 0.43 8.734 0.381 DCE-net 15.14 0.70 7.755 0.330 EnlightenGAN 18.63 0.812 6.869 0.412 SCI 14.77 0.679 6.646 0.335 FA-UNet 17.22 0.71 5.879 0.318 SICE RetinexNet 15.84 0.73 4.368 0.407 DCE-net 16.12 0.87 3.987 0.362 EnlightenGAN 13.94 0.605 2.683 0.253 SCI 13.15 0.523 3.360 0.317 FA-UNet 19.88 0.89 3.175 0.308 Table 1.
Image quality evaluation table.
-
Loss function combination PSNR SSIM $ w/o{L}_{spa} $ 17.04 0.68 $ w/o $ $ {L}_{ill} $ 15.79 0.59 $ w/o $ $ {L}_{exp} $ 16.31 0.65 $ {L}_{Total} $ 17.22 0.71 Table 2.
PSNR/SSIM of different combinations of loss functions
-
Image sequence Length Low-light RetinexNet HE DCE-net FA-UNet MH_04_difficult 91.747 Fail 0.216 0.114 0.125 0.070 MH_05_difficult 97.593 Fail 0.198 0.829 0.100 0.042 V1_03_difficult 78.982 Fail 0.098 0.100 0.122 0.087 Syn_KITTI_Seq00 3,724.187 16.012 4.403 5.135 4.809 3.009 Syn_KITTI_Seq02 5,067.223 Fail 16.109 8.885 9.136 6.891 Syn_KITTI_Seq03 560.888 0.668 0.462 0.272 0.357 0.195 Syn_KITTI_Seq09 1,705.051 Fail 5.207 4.902 3.667 3.017 Table 3.
Comparison results of the root mean square error of the absolute trajectory error (m).
-
Methods RetinexNet DCE-net FA-UNet KITTI Euroc KITTI Euroc KITTI Euroc FLOPs (109) 13.721 10.623 0.059 0.046 0.034 0.022 Test time (ms) 72.42 56.05 35.24 30.54 15.86 12.72 Table 4.
Model efficiency evaluation indices
Figures
(8)
Tables
(4)