-
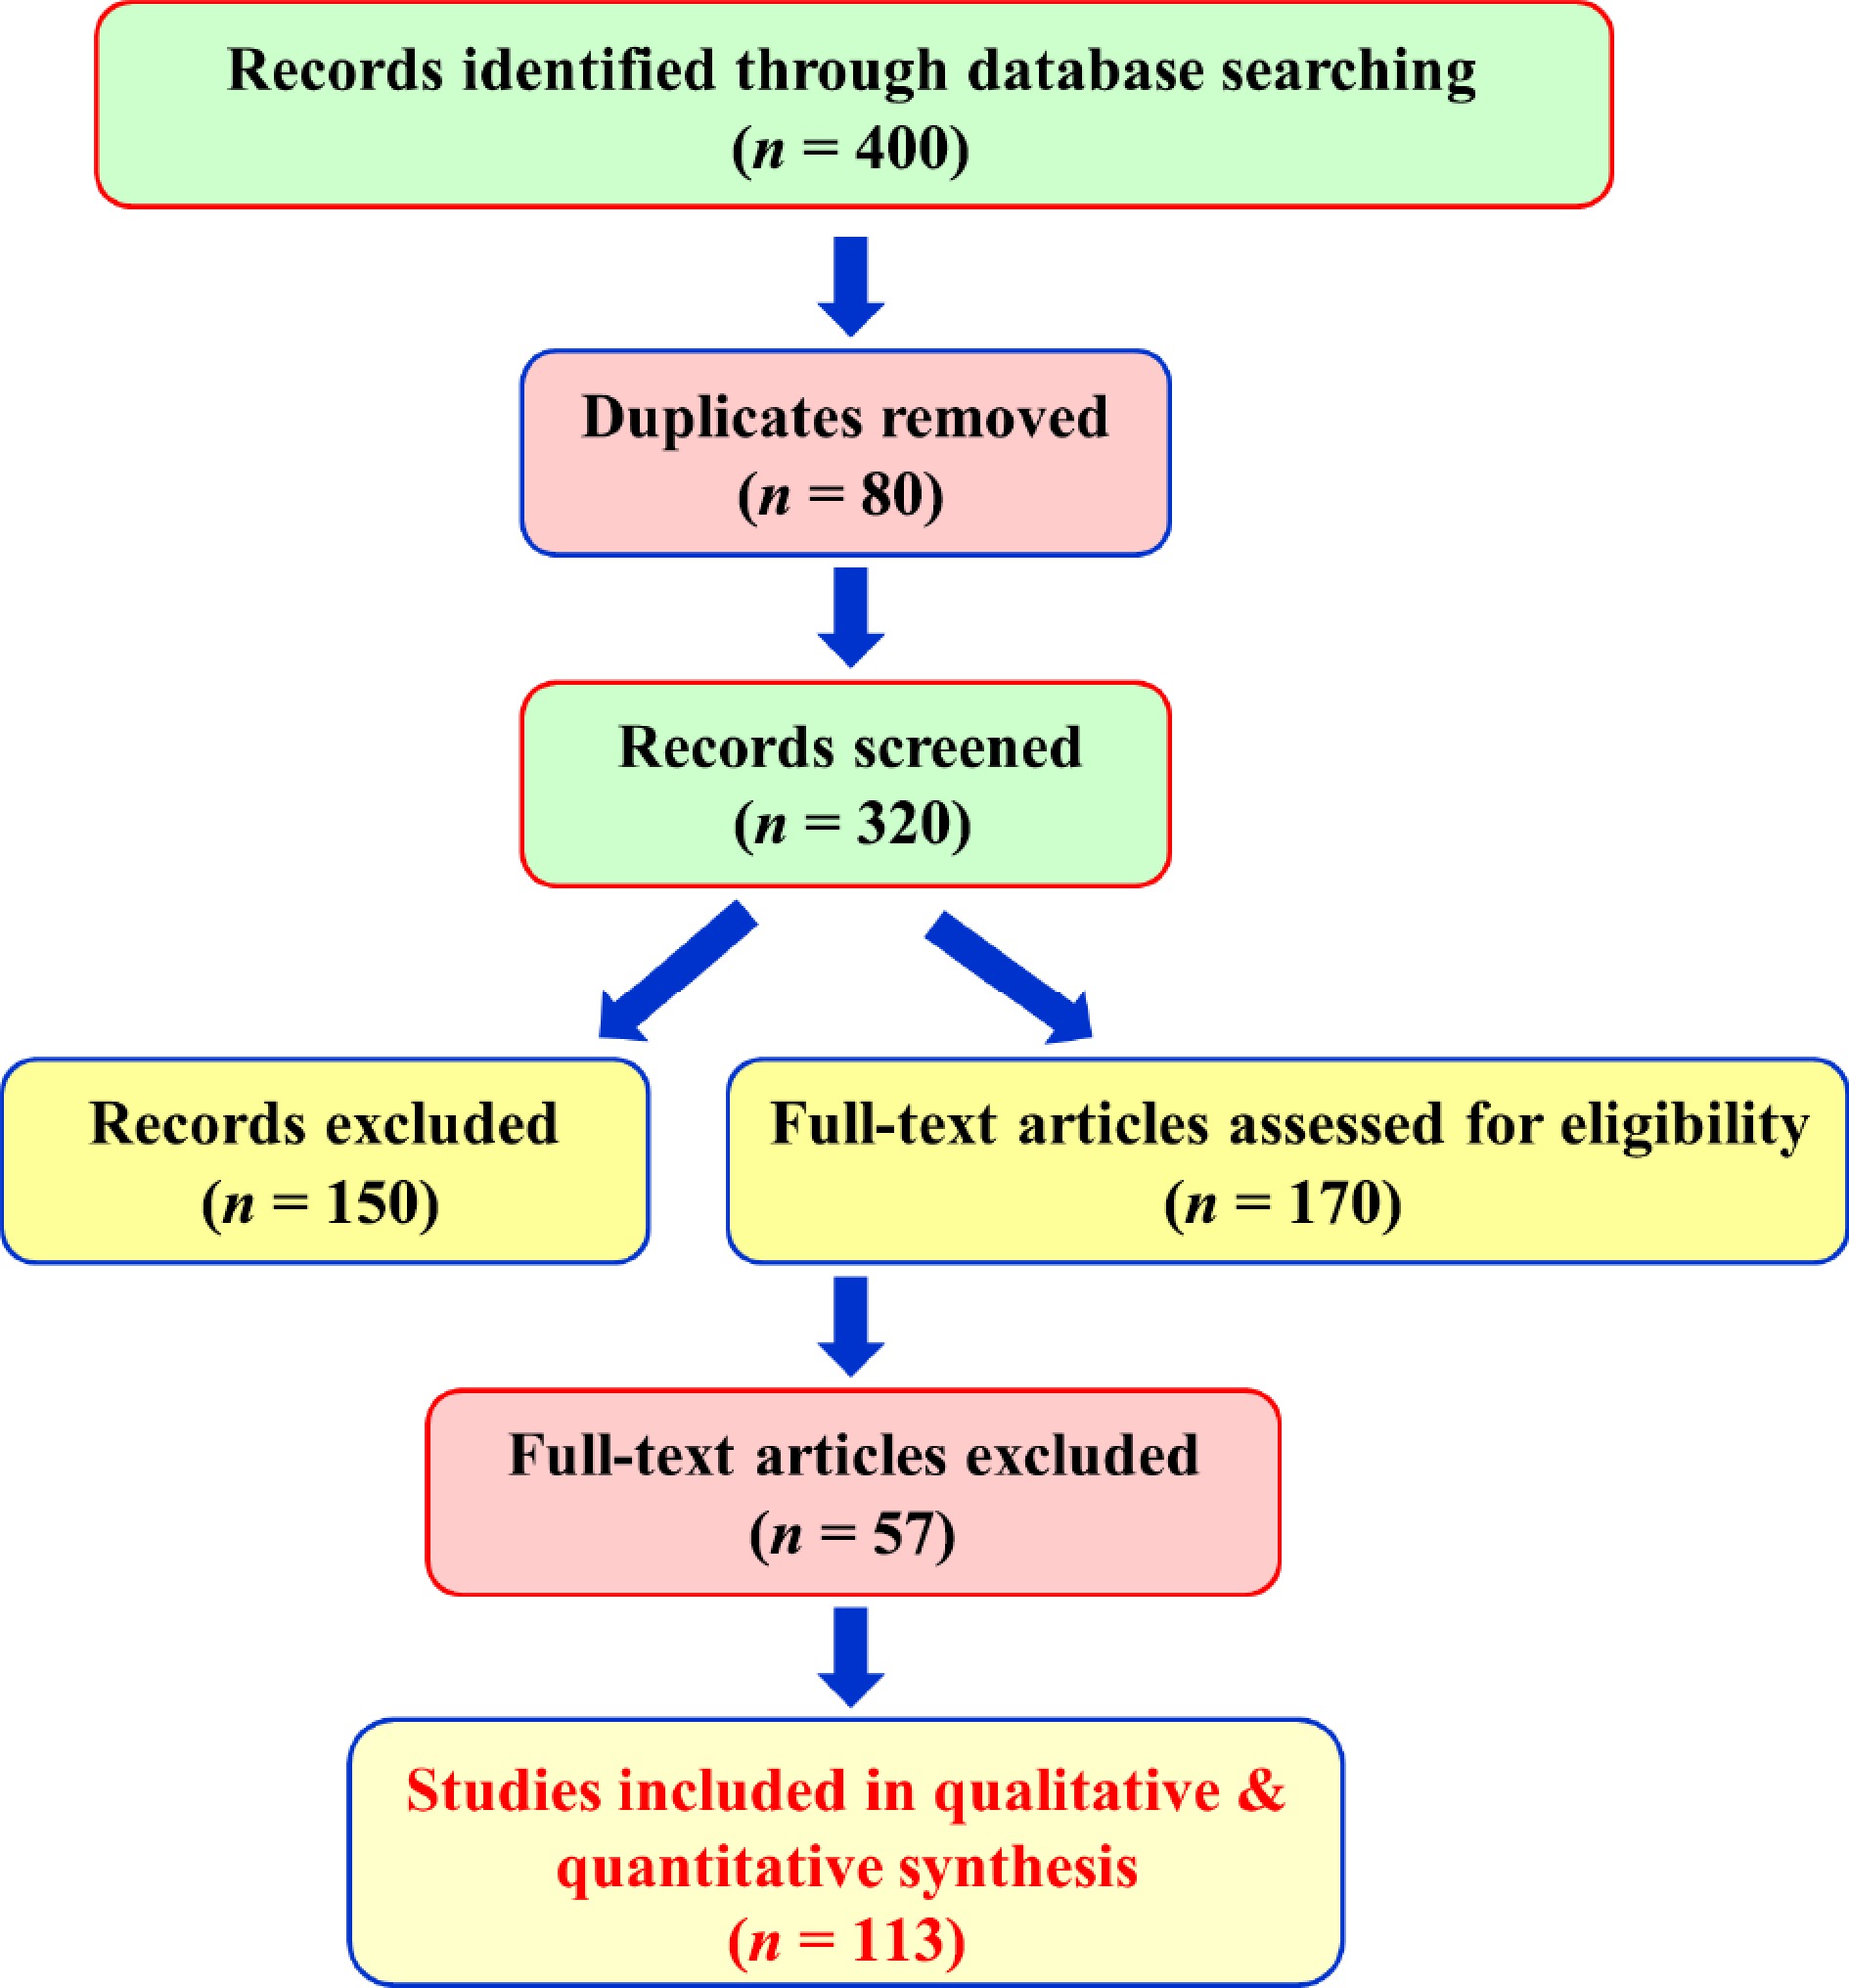
Figure 1.
PRISMA flow diagram of the literature screening and study selection process used in this systematic review. The diagram shows the number of records identified through database searching, duplicates removed, records screened based on titles and abstracts, full-text articles assessed for eligibility, and the final studies included in the review.
-
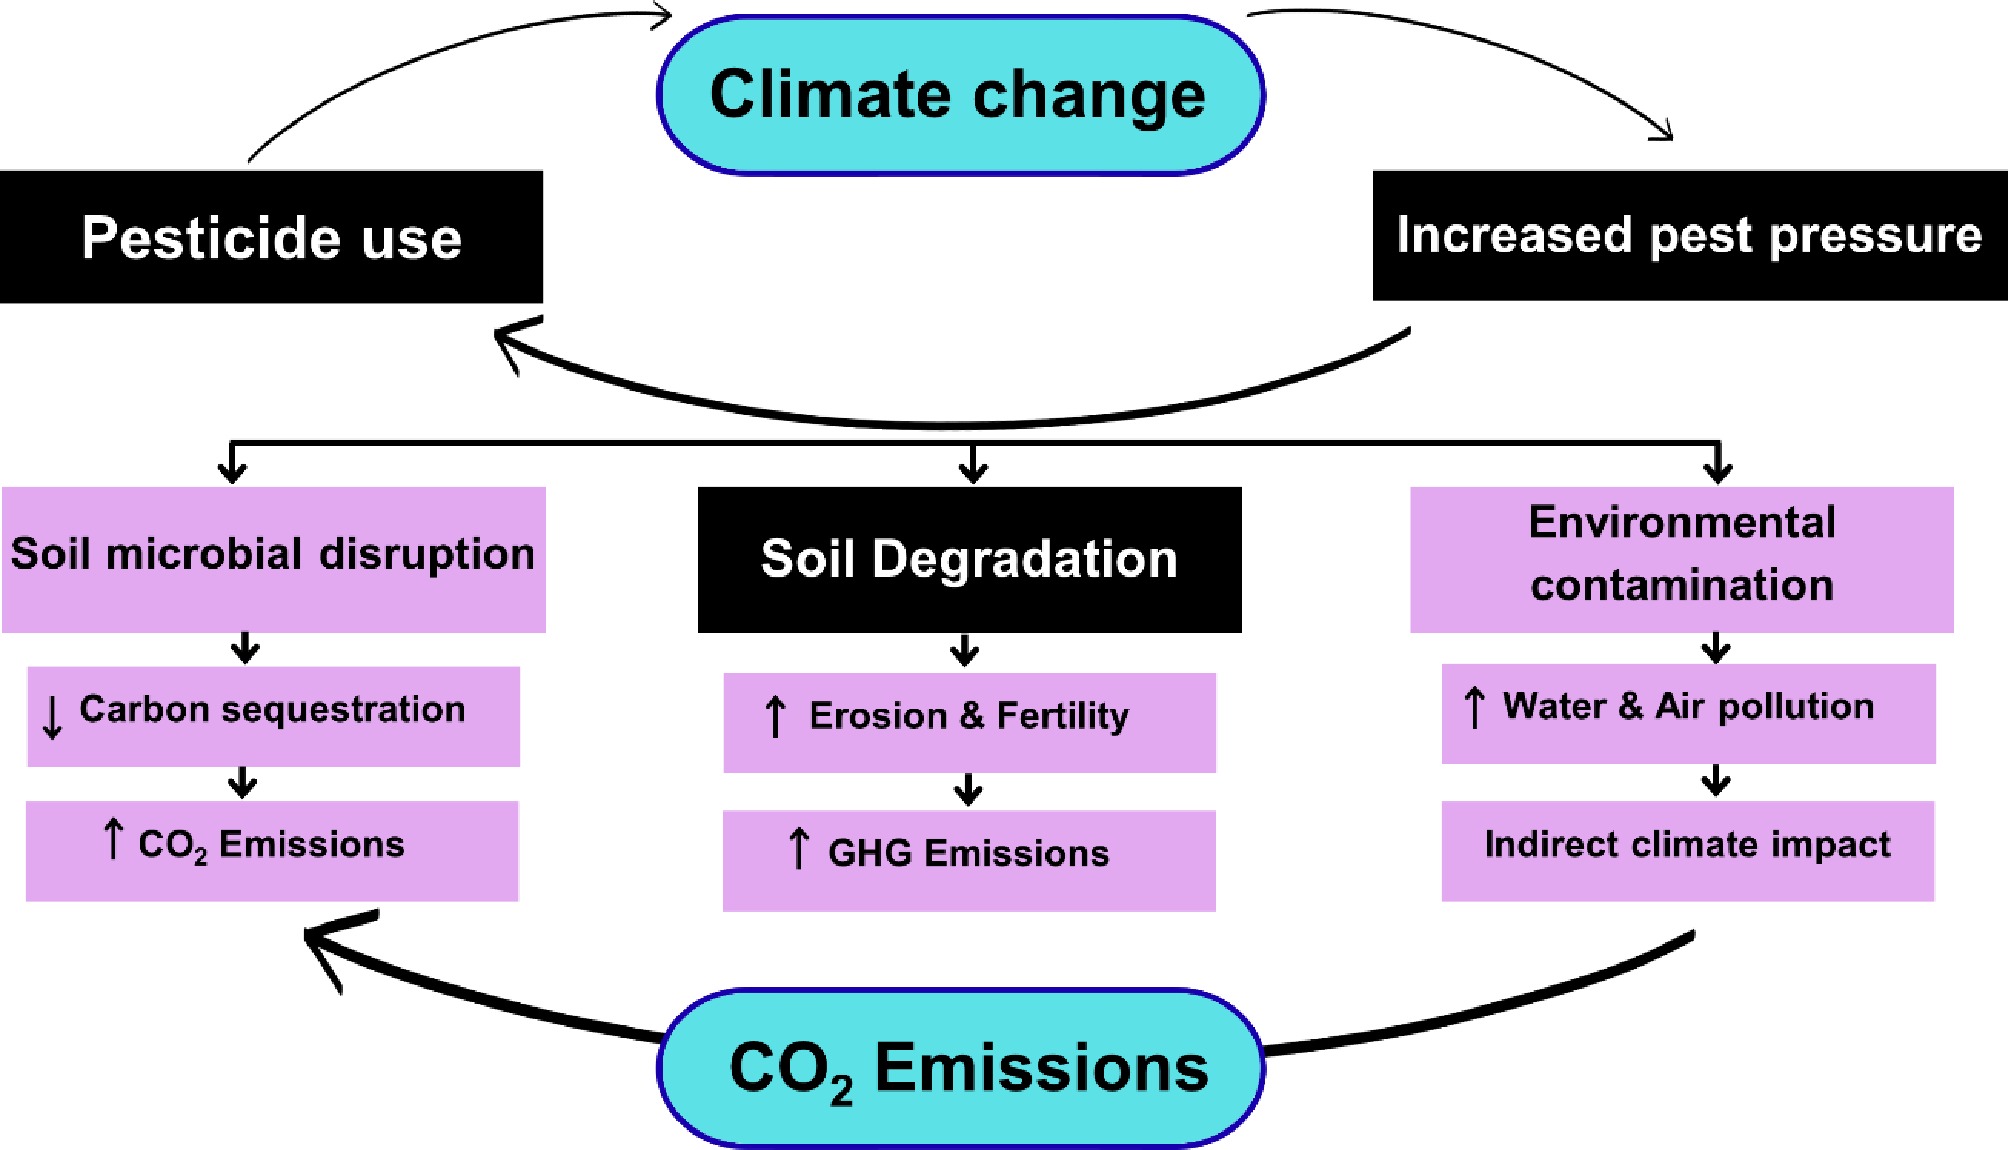
Figure 2.
Flowchart showing the feedback loop between pesticide use and climate change, highlighting how climate change affects pesticide application and how pesticides contribute to environmental impacts that may further intensify climate change.
-
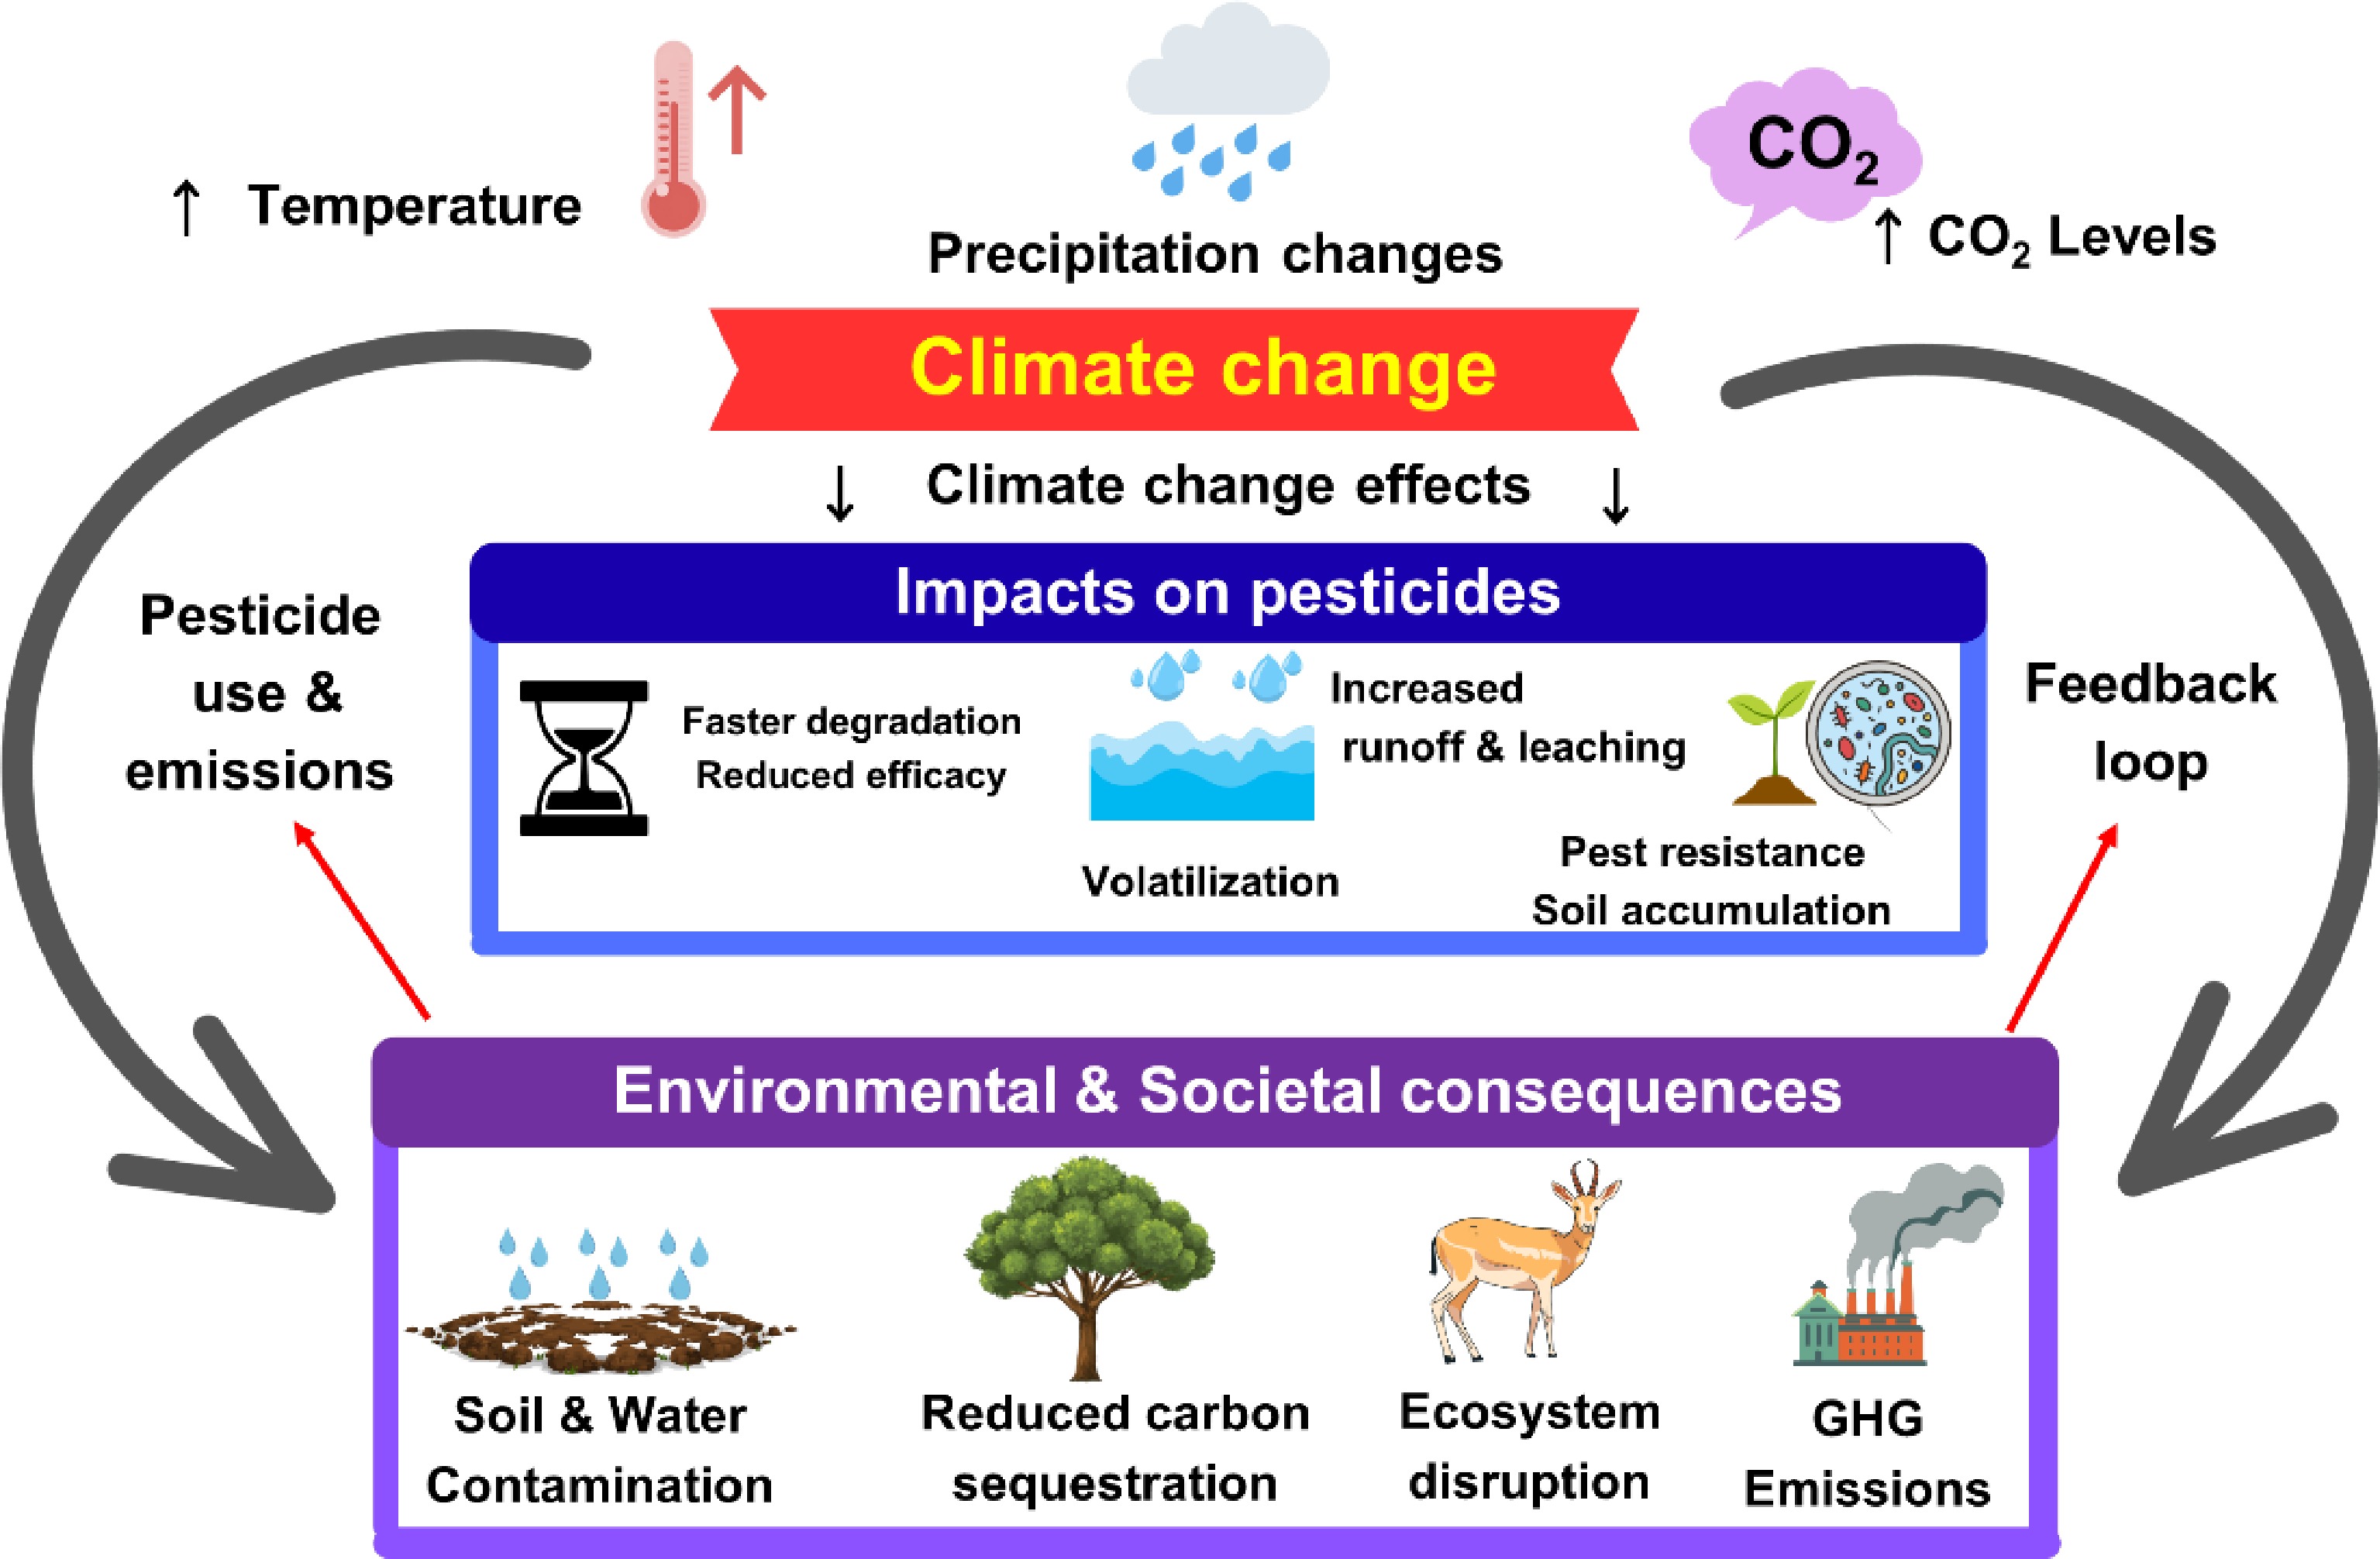
Figure 3.
Flowchart showing the feedback loop of climate change effects on pesticide dynamics, including changes in pesticide behavior, environmental fate, and potential impacts on ecosystems.
-
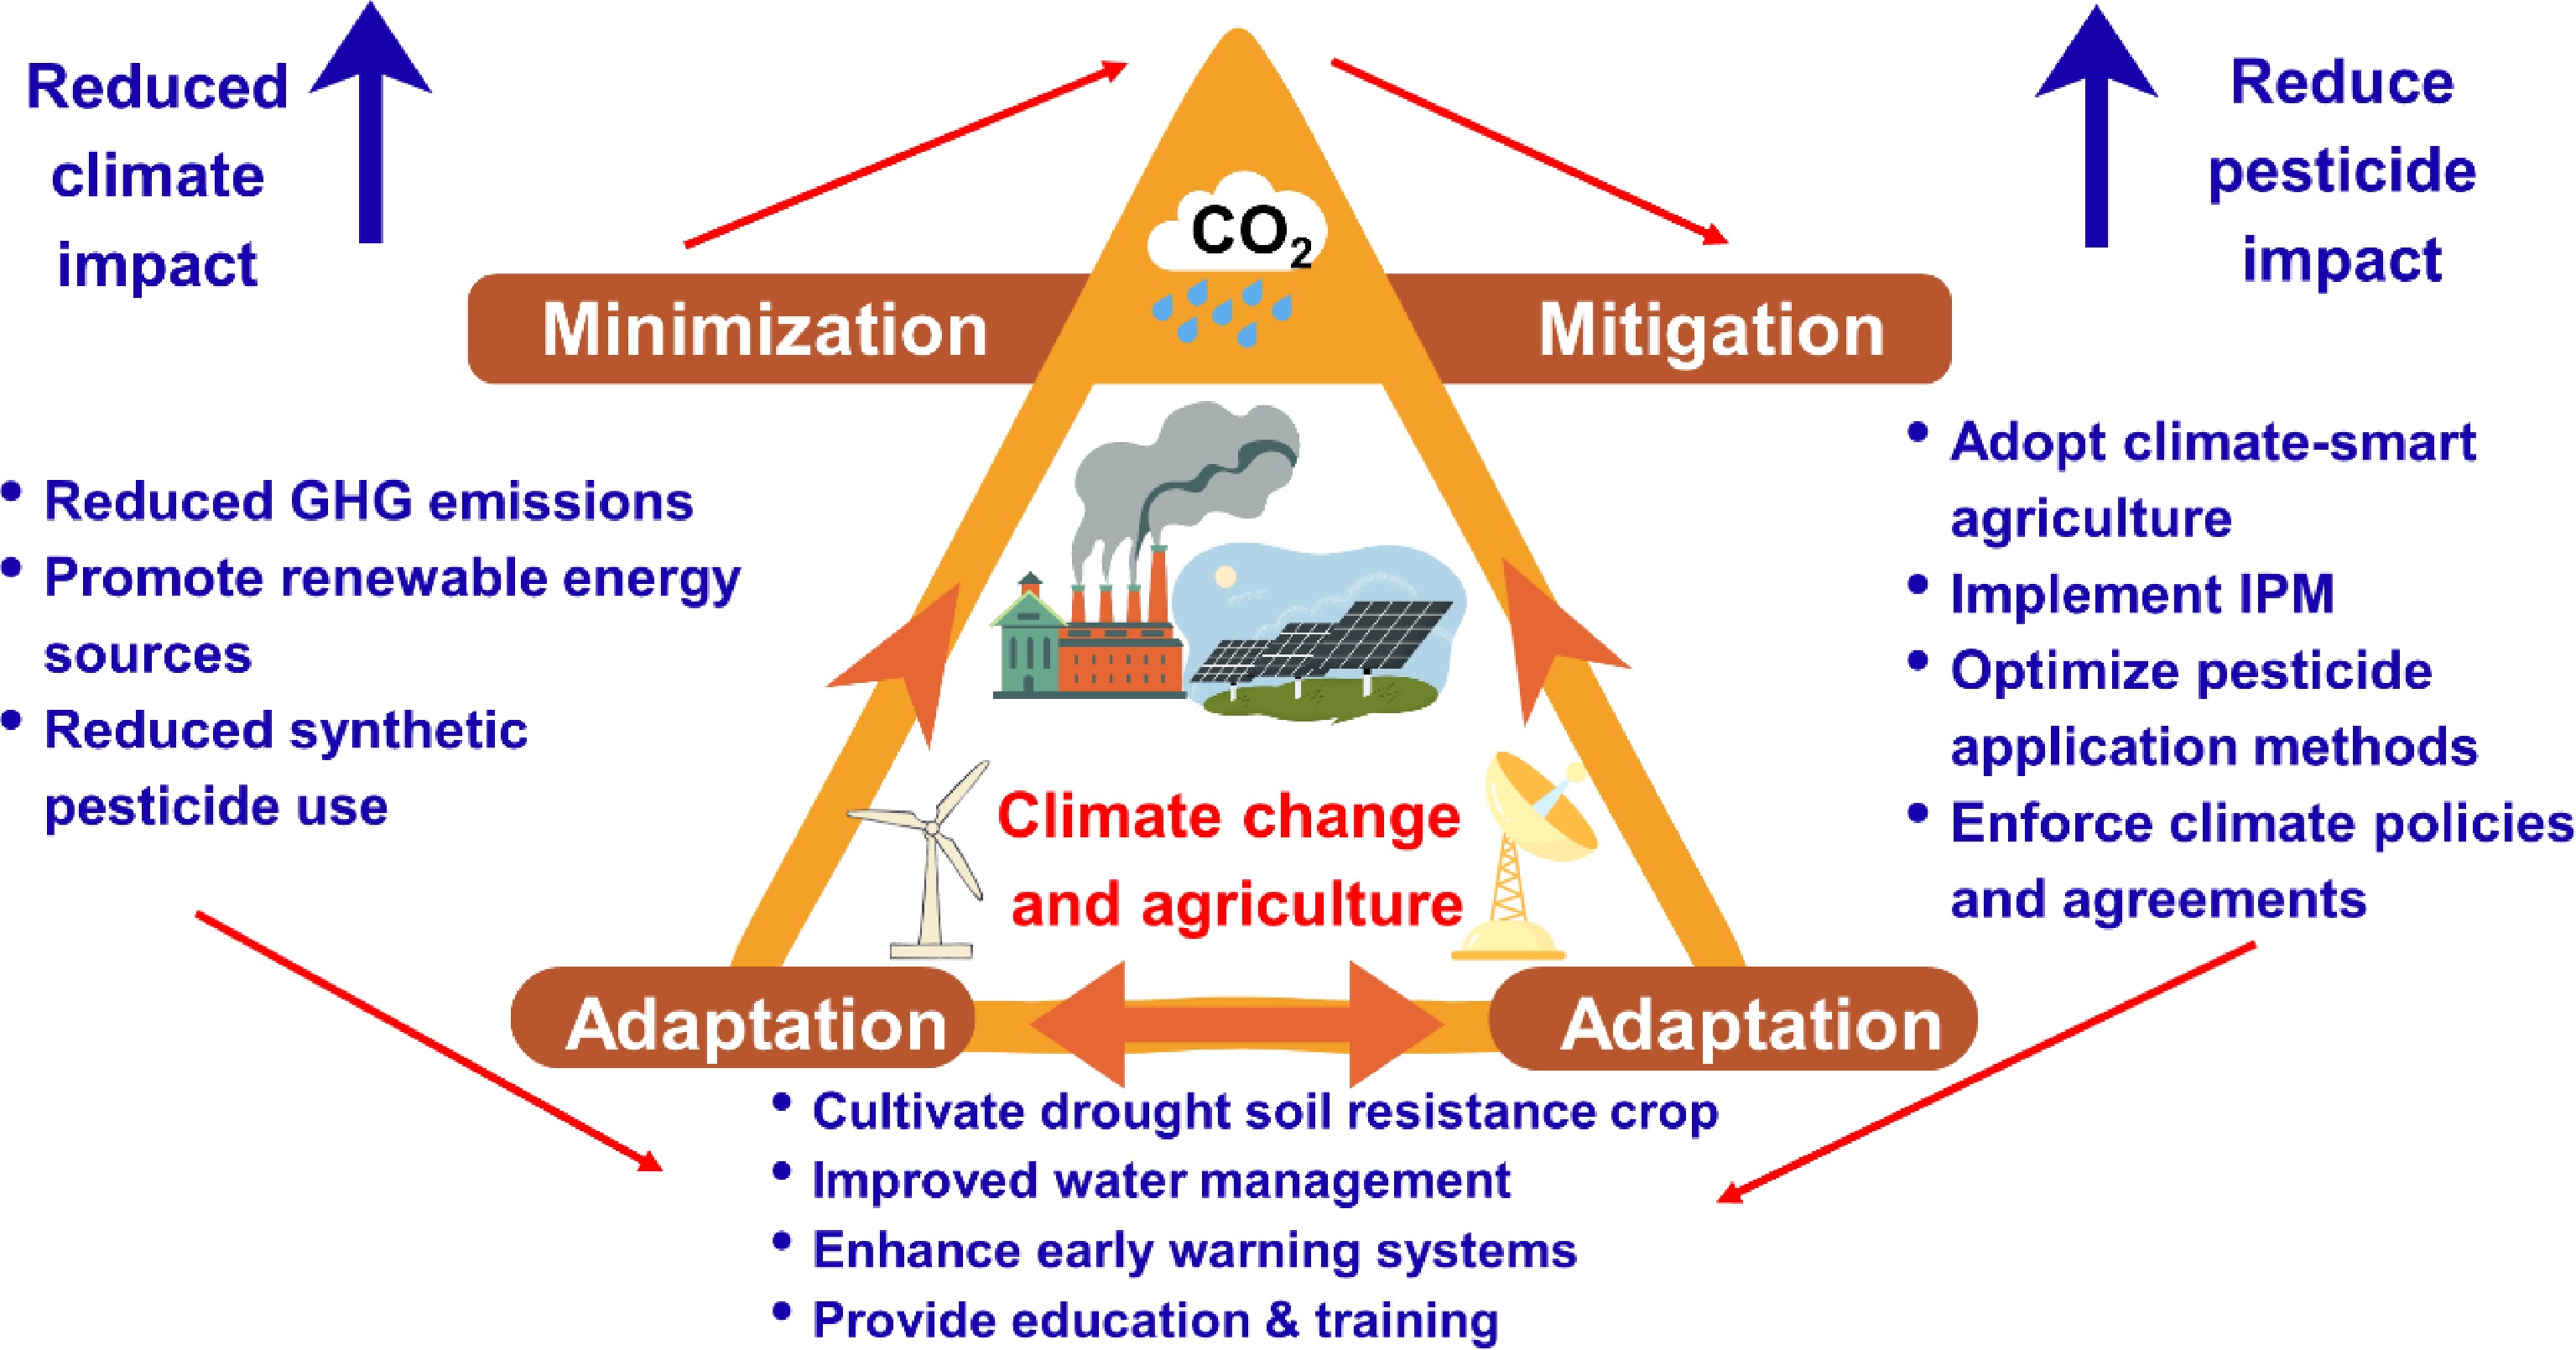
Figure 4.
Flowchart showing strategies for addressing climate change and pesticide impacts, including minimization, mitigation, and adaptation approaches.
-
Life-cycle stage CO2-equivalent
(kg CO2e/kg pesticide)Description/source Production 4−10 Energy-intensive, 99% from fossil fuels[28,29] Transportation 0.2−0.5 Fuel emissions during distribution[27] Application and degradation 0.5−2 Fumigant emissions and degradation in field[30,31] Total 4.7−12.5 Sum of all stages Table 1.
Estimated ranges of greenhouse gas (GHG) emissions associated with pesticide life-cycle stages, compiled from published life-cycle assessments and regulatory reports.
-
Table 2.
Representative mean concentrations of selected pesticide residues in soil and water, compiled from monitoring studies.
-
Pest type Pesticide Observed trend Ref. Insects Chlorpyrifos Reduced efficacy and higher resistance under warming [12] Insects Fipronil Increased toxicity variability with temperature [46] Pathogens Mancozeb Reduced fungicide sensitivity under climate stress [101] Weeds Glyphosate Increased resistance risk under elevated CO2 [23] Table 3.
Climate change-driven pesticide resistance development.
-
Pesticide/group Ecosystem Impact indicator affected by climate stress Evidence‑based source Chlorpyrifos and other pesticides Aquatic Temperature–pesticide interactions alter toxicity (toxicity may increase or change with warming) Systematic evidence that pesticide toxicity changes with temperature increase, influencing aquatic organisms' responses to contaminants[102−104]. Multiple pesticides (glyphosate, atrazine) Soil Altered soil microbial community functions and enzymatic activity Pesticide exposure affects soil carbon cycling and enzyme activity, indicating impacts on microbial processes tied to organic carbon dynamics[105−107]. Mixed pesticides (atrazine, metolachlor) Aquatic Combined high temperature and pesticide exposure increase oxidative stress and tissue damage Elevated temperature combined with pesticides causes greater biological stress in fish, showing interaction effects on organism health[108,109]. General pesticide classes Aquatic & soil Increased organism vulnerability under warming conditions (e.g., higher uptake, altered tolerance) Reviews show that rising temperatures and acidification can increase pesticide effects on aquatic biota and make organisms more vulnerable[43,104,110]. Herbicides and insecticides Aquatic & soil Microbial community disruption and changes in diversity under pesticide exposure Multiple pesticides (including herbicides and insecticides like malathion) have been shown to reduce microbial community diversity and alter ecosystem function[111−113]. Table 4.
Effects of climate change stress on pesticide impacts in different ecosystems.
Figures
(4)
Tables
(4)