-
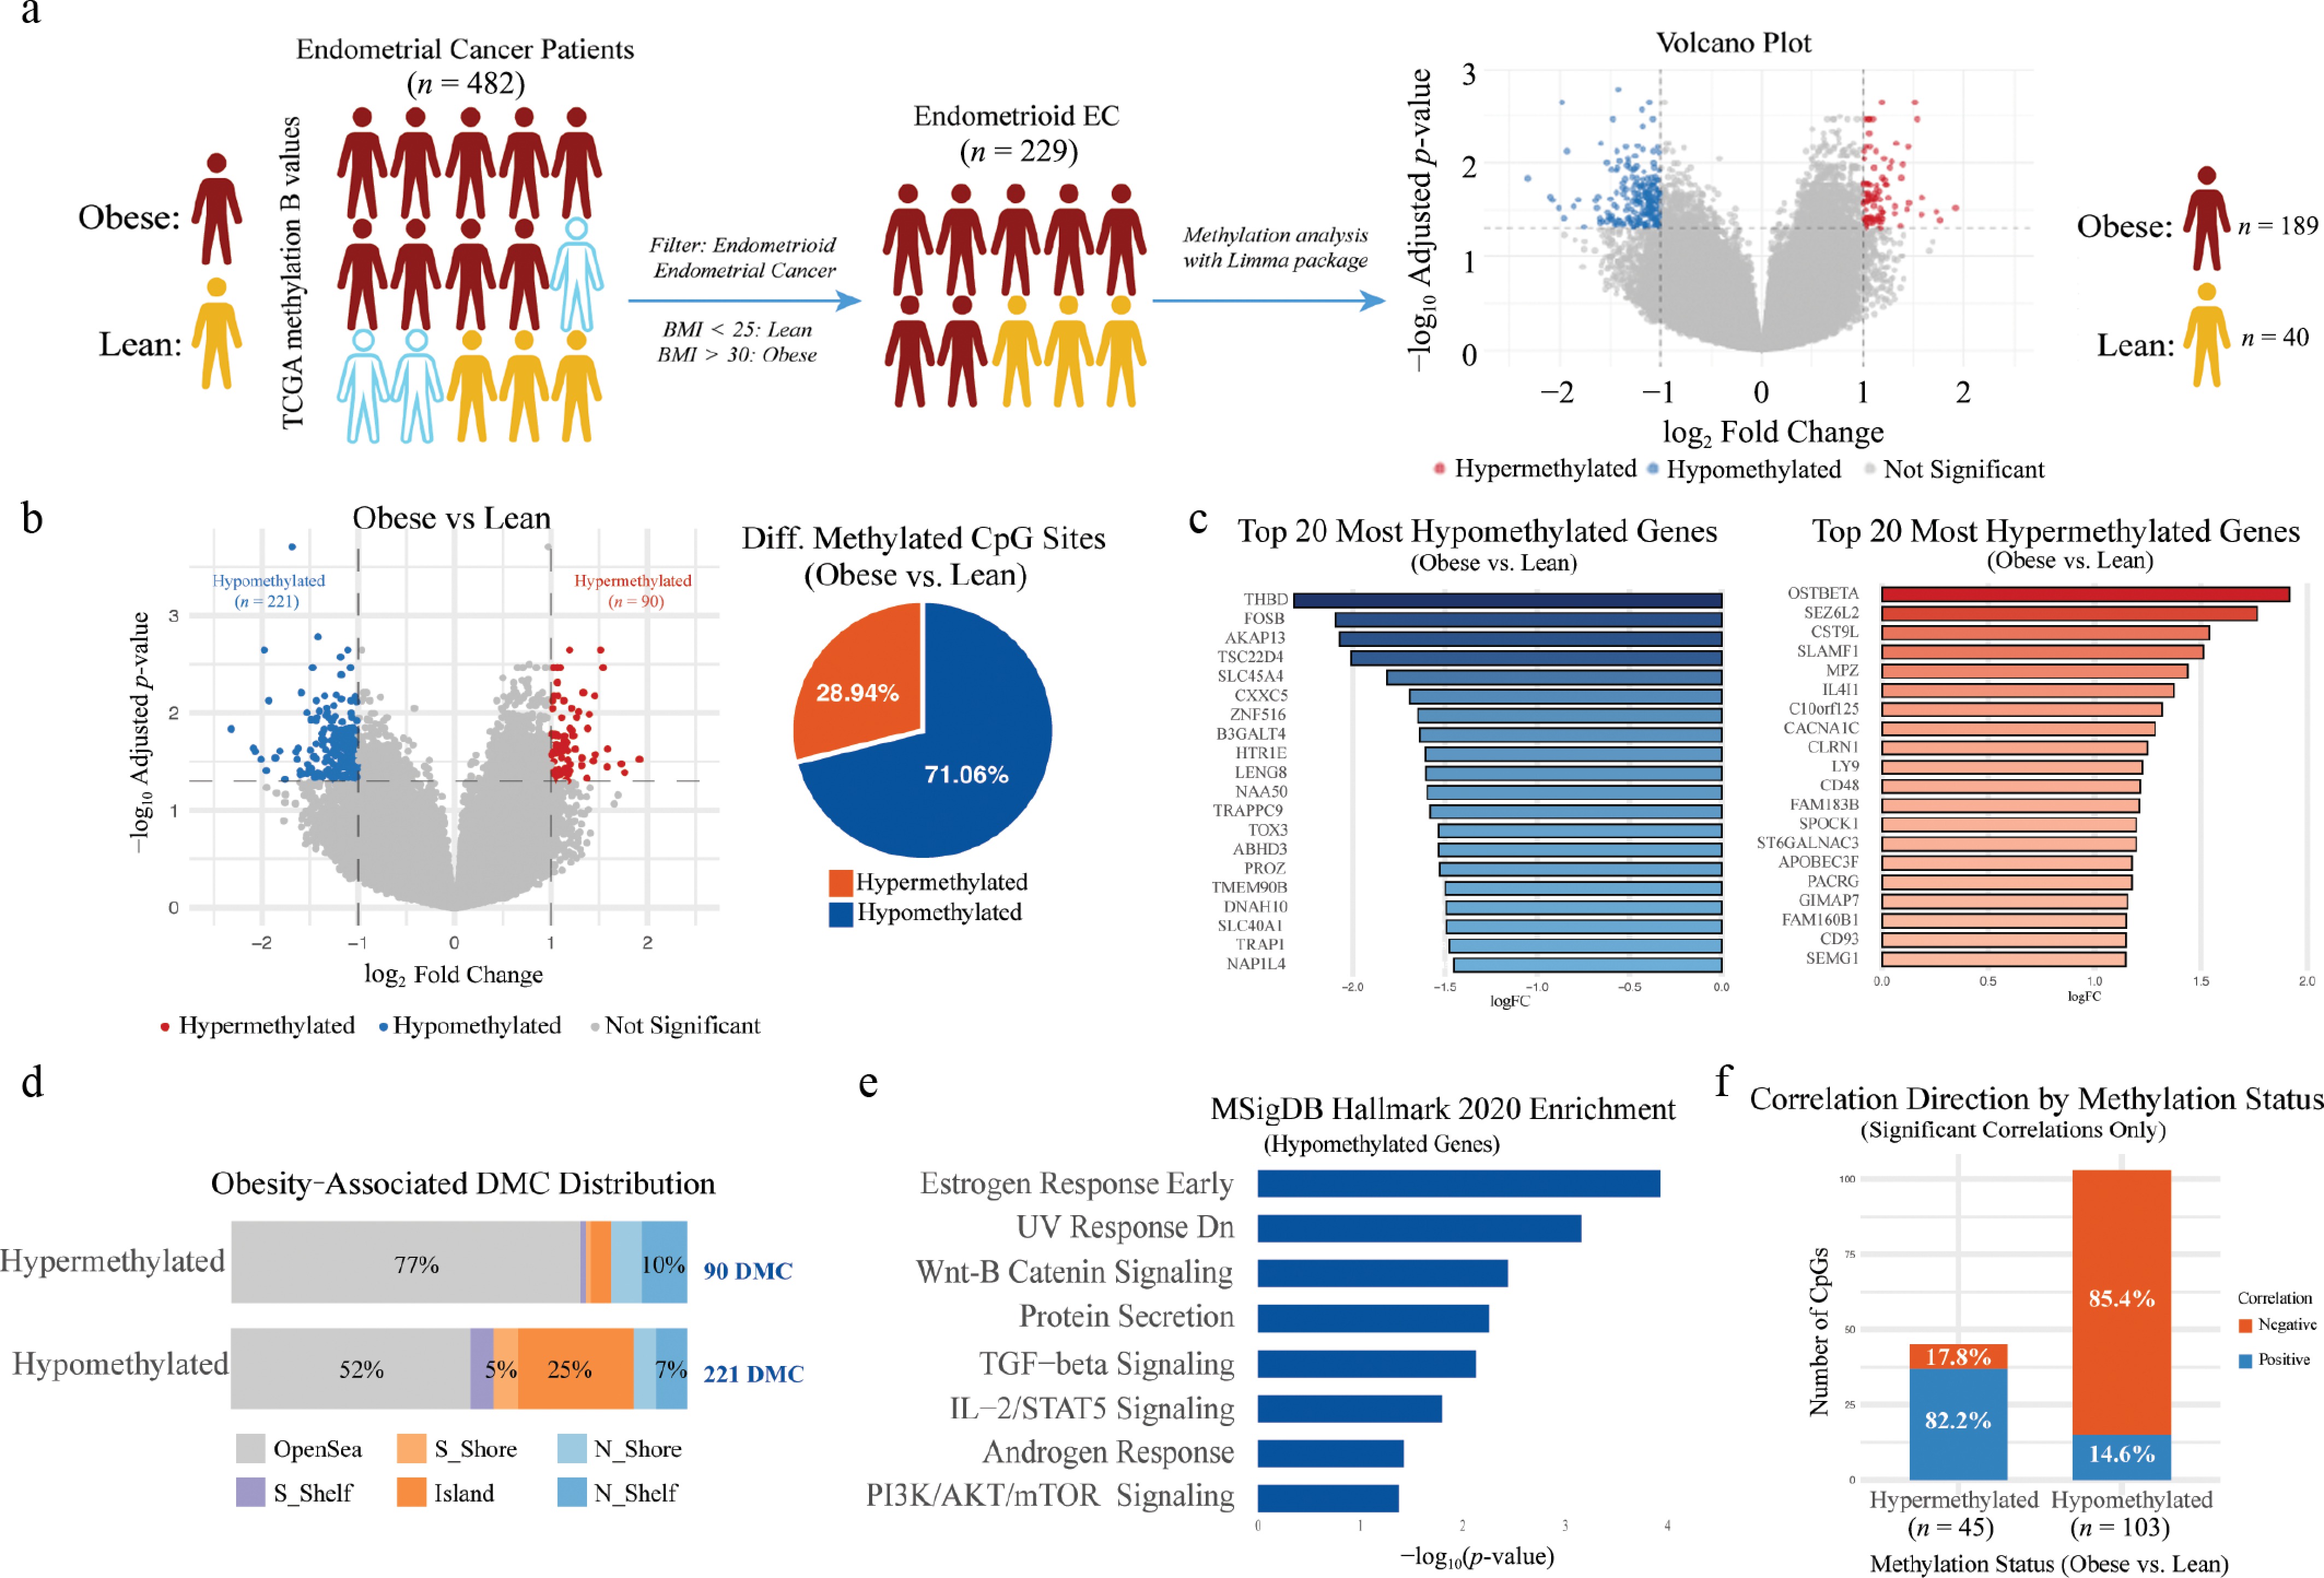
Figure 1.
The study design and obesity-associated DNA methylation features in endometrial cancer. (a) Schematic of study design illustrating the selection of 229 endometrioid endometrial cancer cases from TCGA (482 total tumor samples). (b) Volcano plot displaying DMCs between tumors from obese and lean patients, with hypomethylated sites shown in blue and hypermethylated sites in red (left). Pie chart summarizing the proportions of hypomethylated vs. hypermethylated CpGs among 311 total DMCs (right). (c) Bar plots showing the top 20 most hypomethylated genes (left) and top 20 most hypermethylated genes (right) in tumors from obese patients, ranked by log fold change. (d) Genomic context distribution of obesity-associated DMCs across CpG islands, shores, shelves, and open sea regions for both hypermethylated and hypomethylated sites. (e) MSigDB Hallmark 2020 enrichment analysis of hypomethylated genes in tumors from obese patients. (f) Correlation analysis between methylation status and gene expression among significantly correlated DMGs, showing the proportions of positive vs. negative correlations for hypermethylated and hypomethylated CpGs.
-
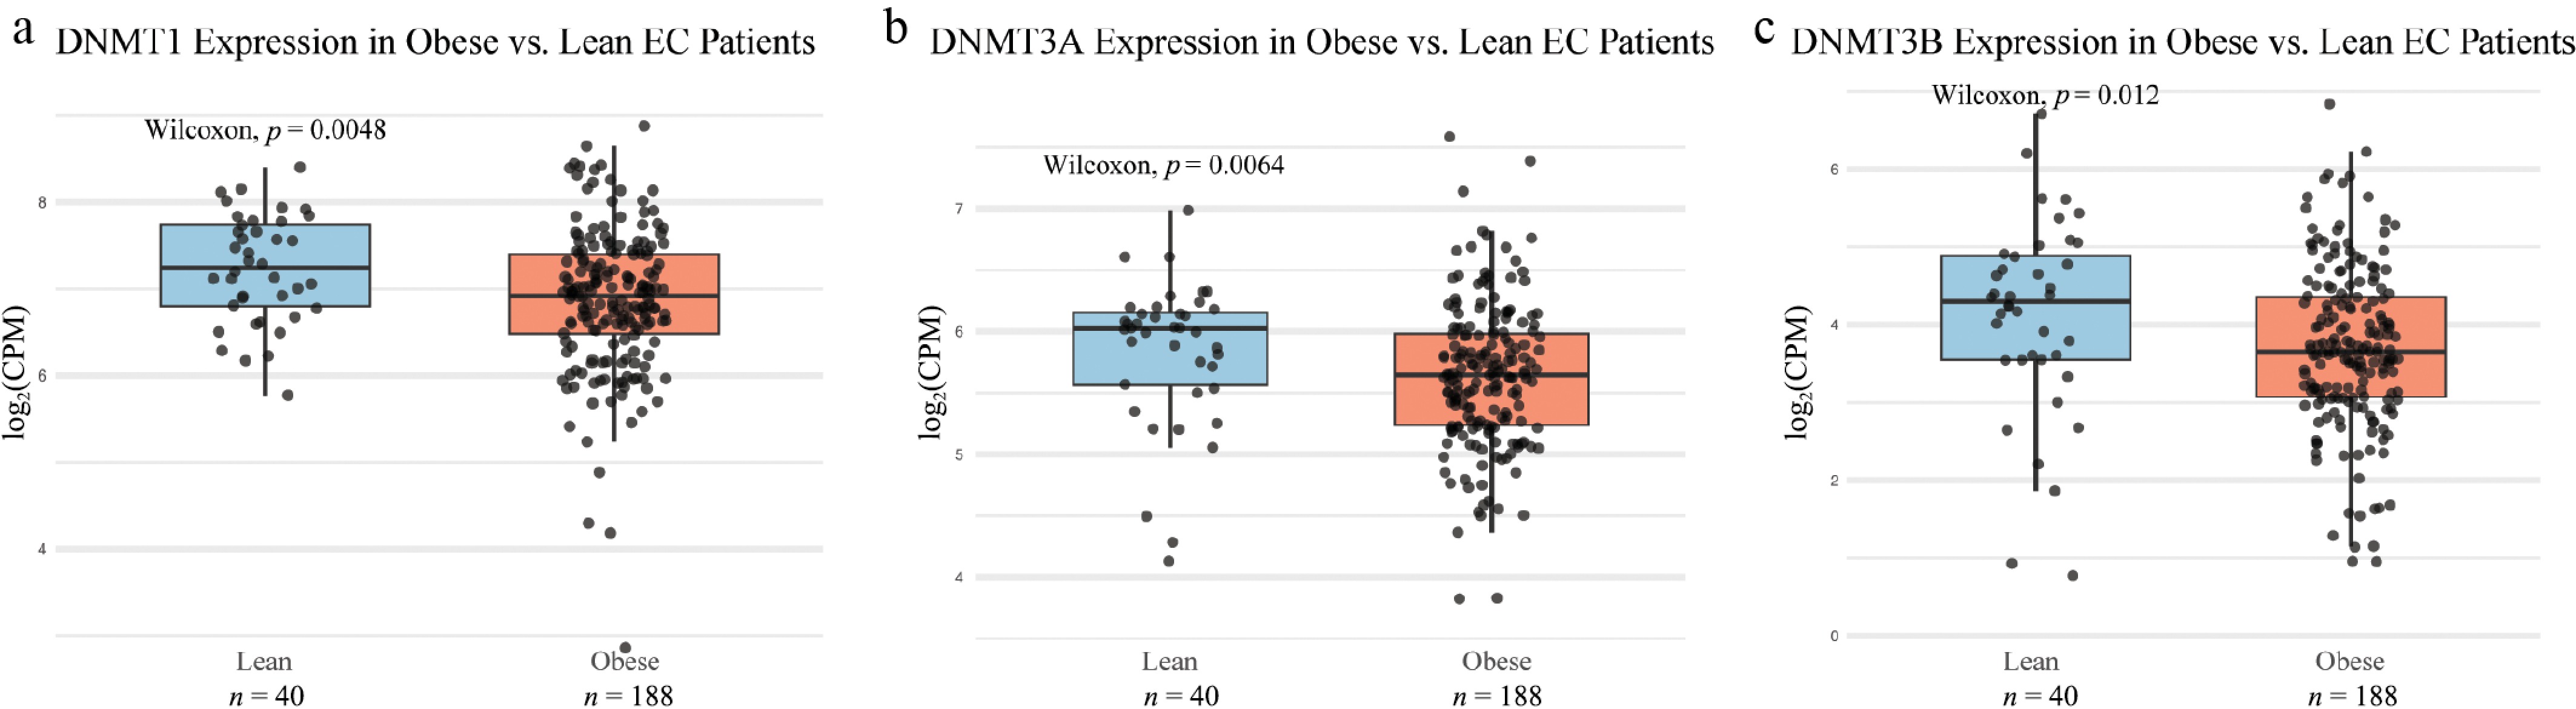
Figure 2.
The expression of DNMTs in obese vs. lean endometrial tumors. Boxplots comparing gene expression levels of (a) DNMT1, (b) DNMT3A, and (c) DNMT3B between lean and obese endometrial cancer patients. Expression values are displayed as log2 counts per million (CPM). Statistical significance was assessed using the Wilcoxon rank-sum test.
-
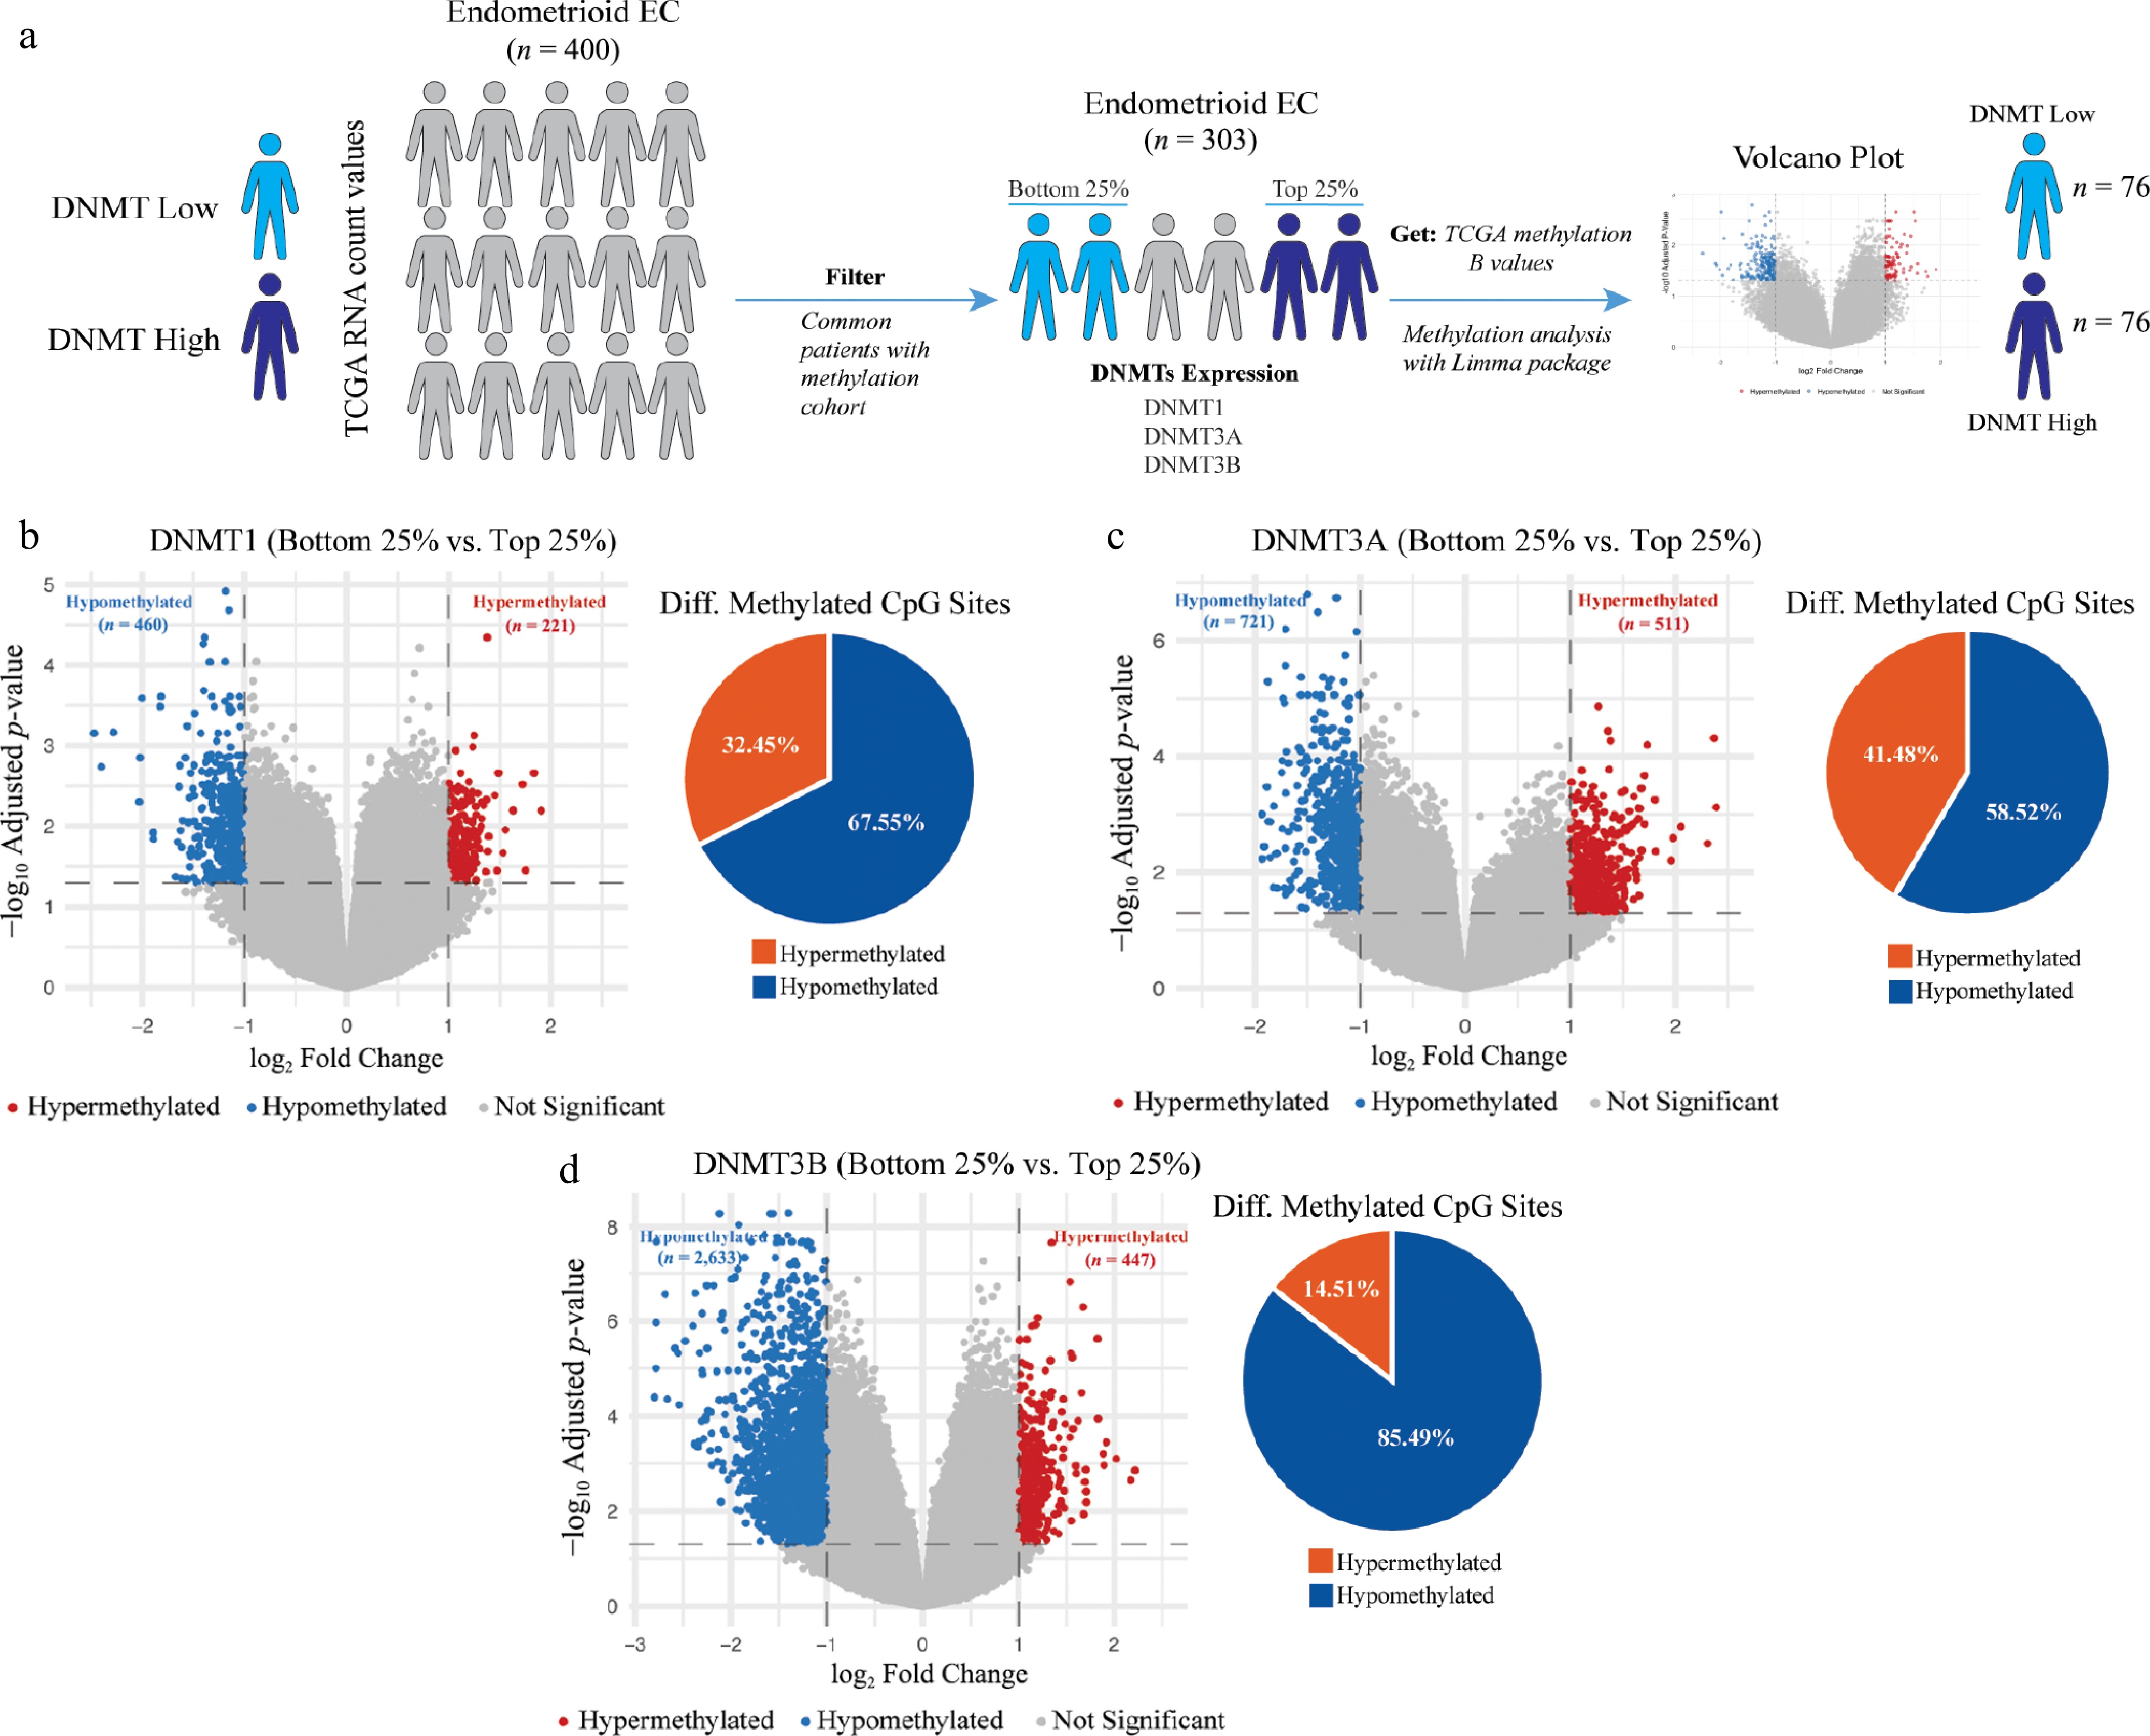
Figure 3.
DNMT-stratified methylation analysis in endometrial cancer. (a) Study design schematic showing stratification of 303 endometrioid EC patients with matched RNA expression and methylation data into DNMT low (bottom 25%) and DNMT high (top 25%) quartiles, followed by differential methylation analysis using the Limma package. (b)–(d) Volcano plots (left) and corresponding pie charts (right) displaying differentially methylated CpG sites between low and high expression groups for (b) DNMT1, (c) DNMT3A, and (d) DNMT3B. Significant hypomethylated sites are shown in blue and hypermethylated sites in red.
-
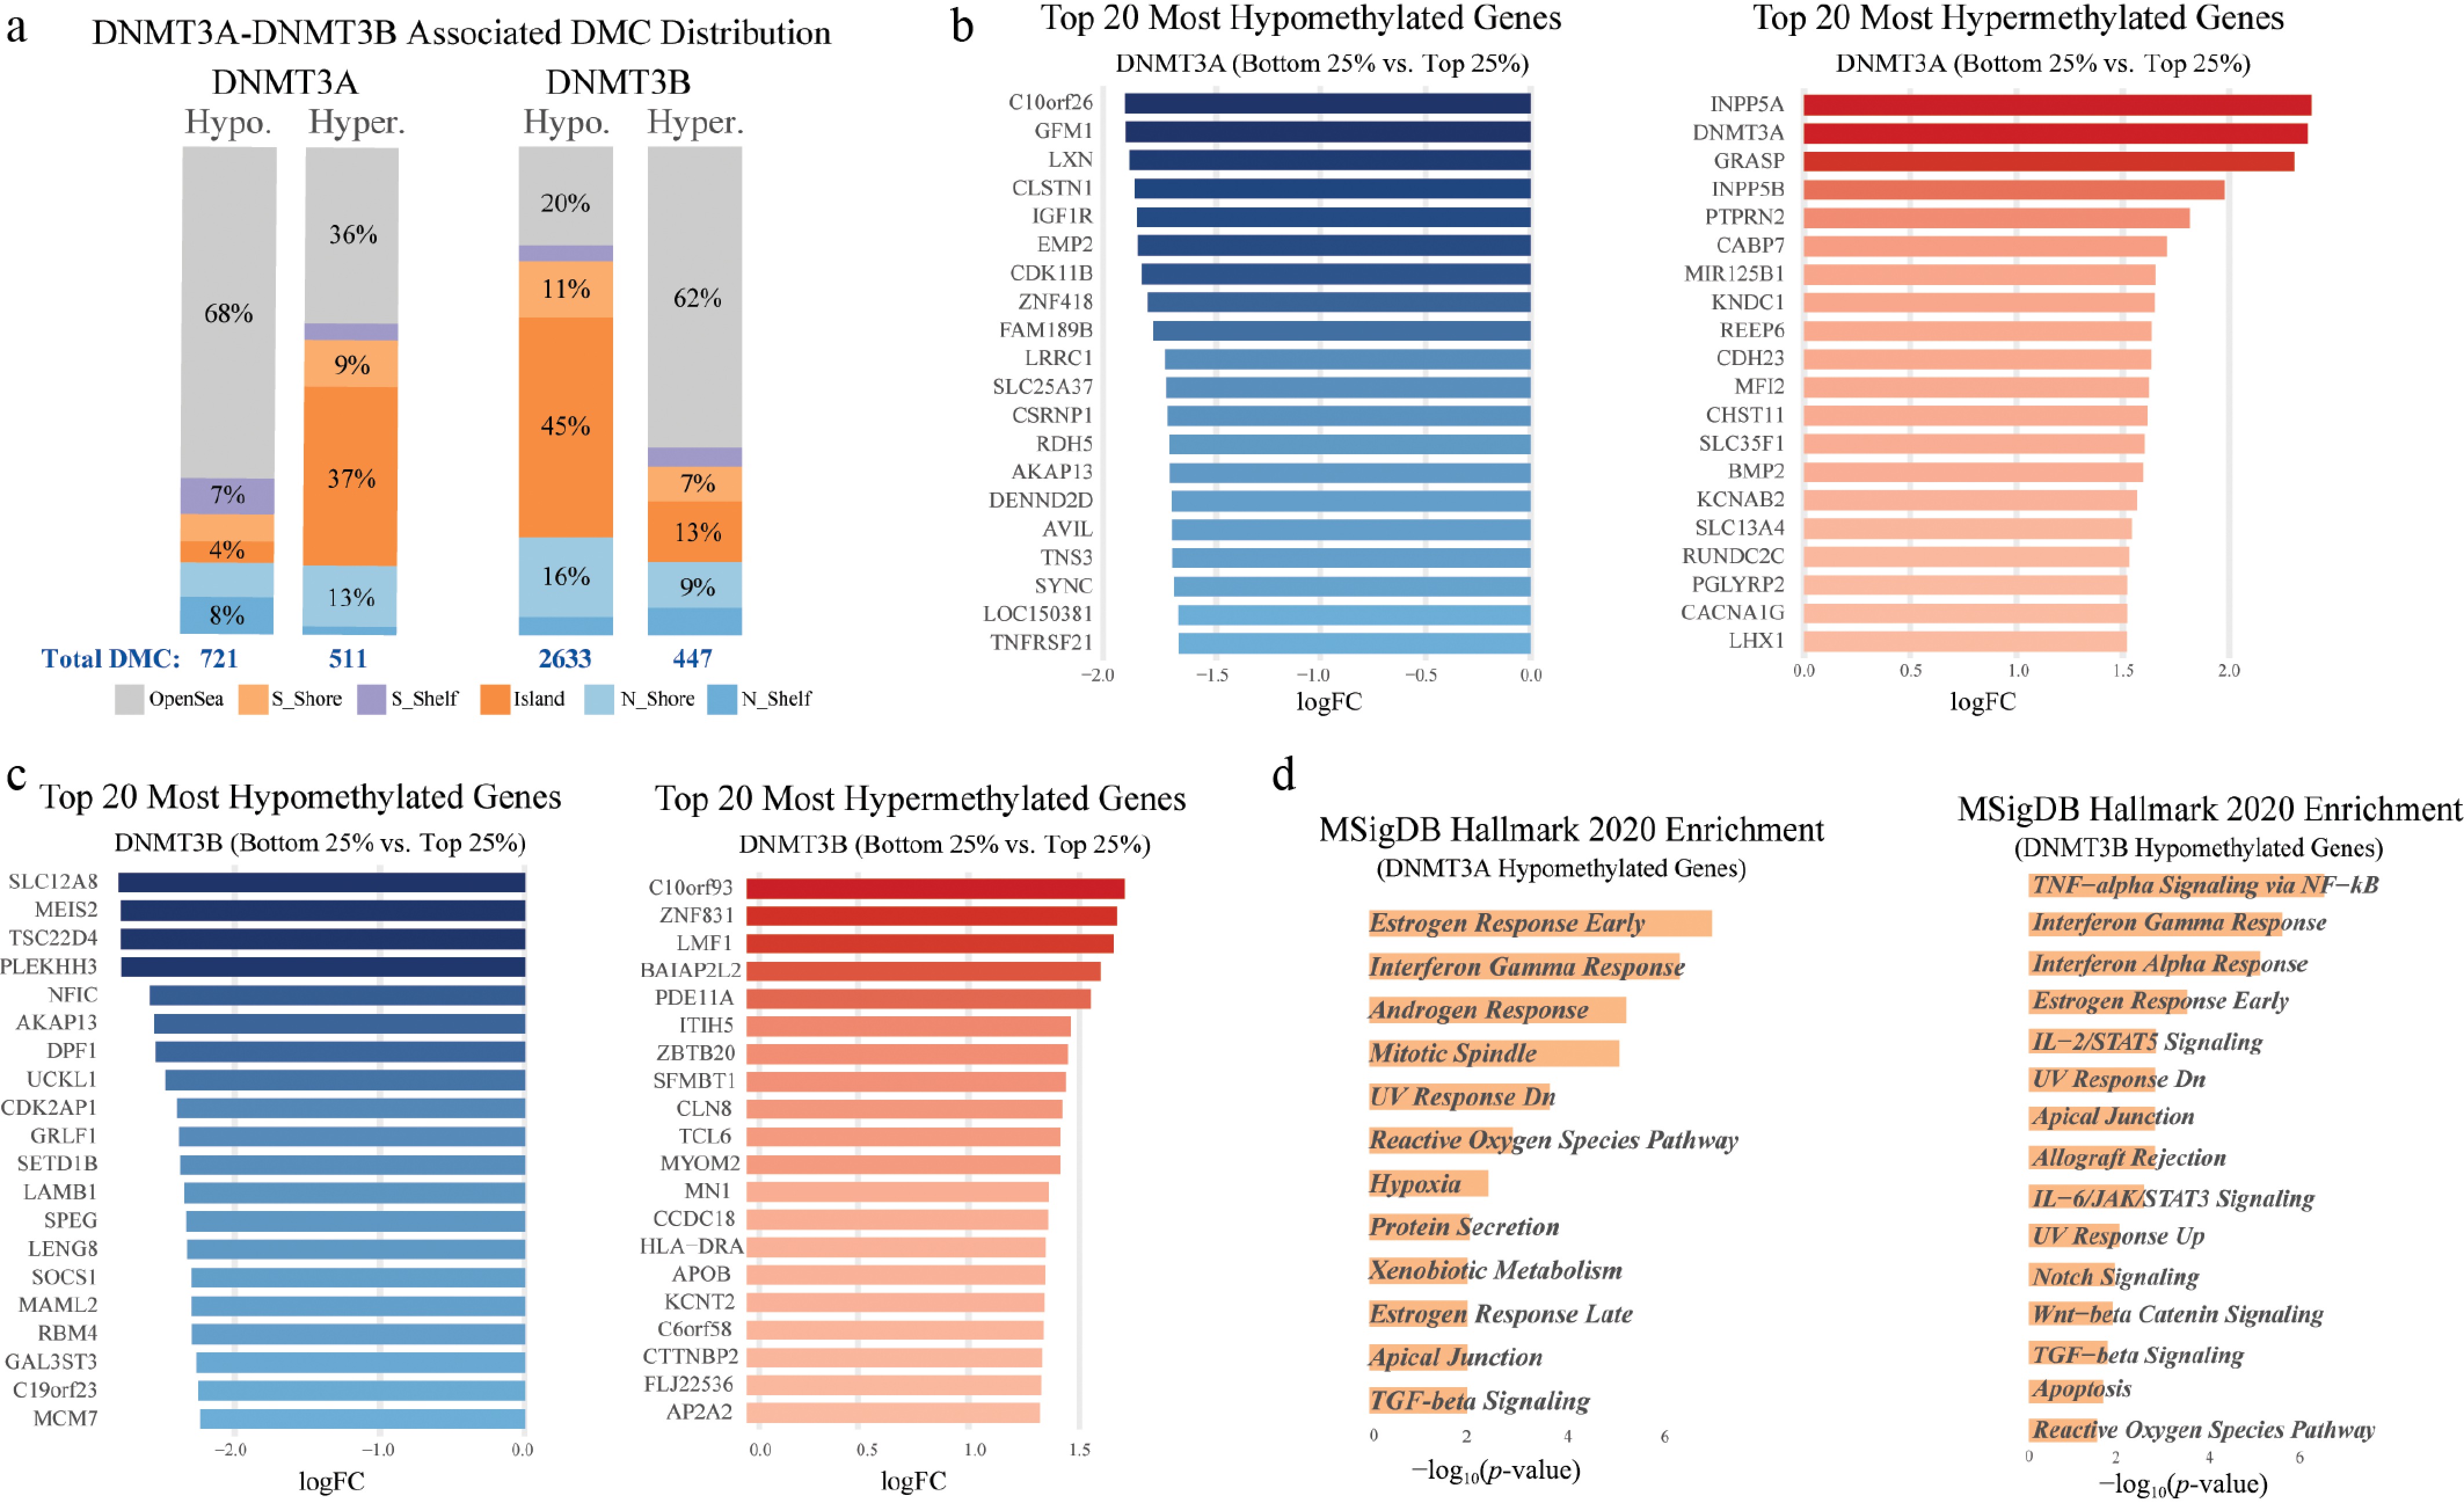
Figure 4.
Genomic distribution and functional annotation of DNMT3A- and DNMT3B-associated methylation changes. (a) Distribution of hyper- and hypomethylated CpGs across genomic in DNMT3A-low vs. DNMT3A-high tumors (left) and DNMT3B-low vs. DNMT3B-high tumors (right). (b) Bar plots showing the top 20 most hypomethylated (left) and hypermethylated (right) genes in DNMT3A-low patients compared to DNMT3A-high patients. (c) Bar plots showing the top 20 most hypomethylated (left) and hypermethylated (right) genes in DNMT3B-low patients compared to DNMT3B-high patients. (d) MSigDB Hallmark 2020 enrichment analysis of hypomethylated genes in DNMT3A low tumors (left) and DNMT3B low tumors (right).
-
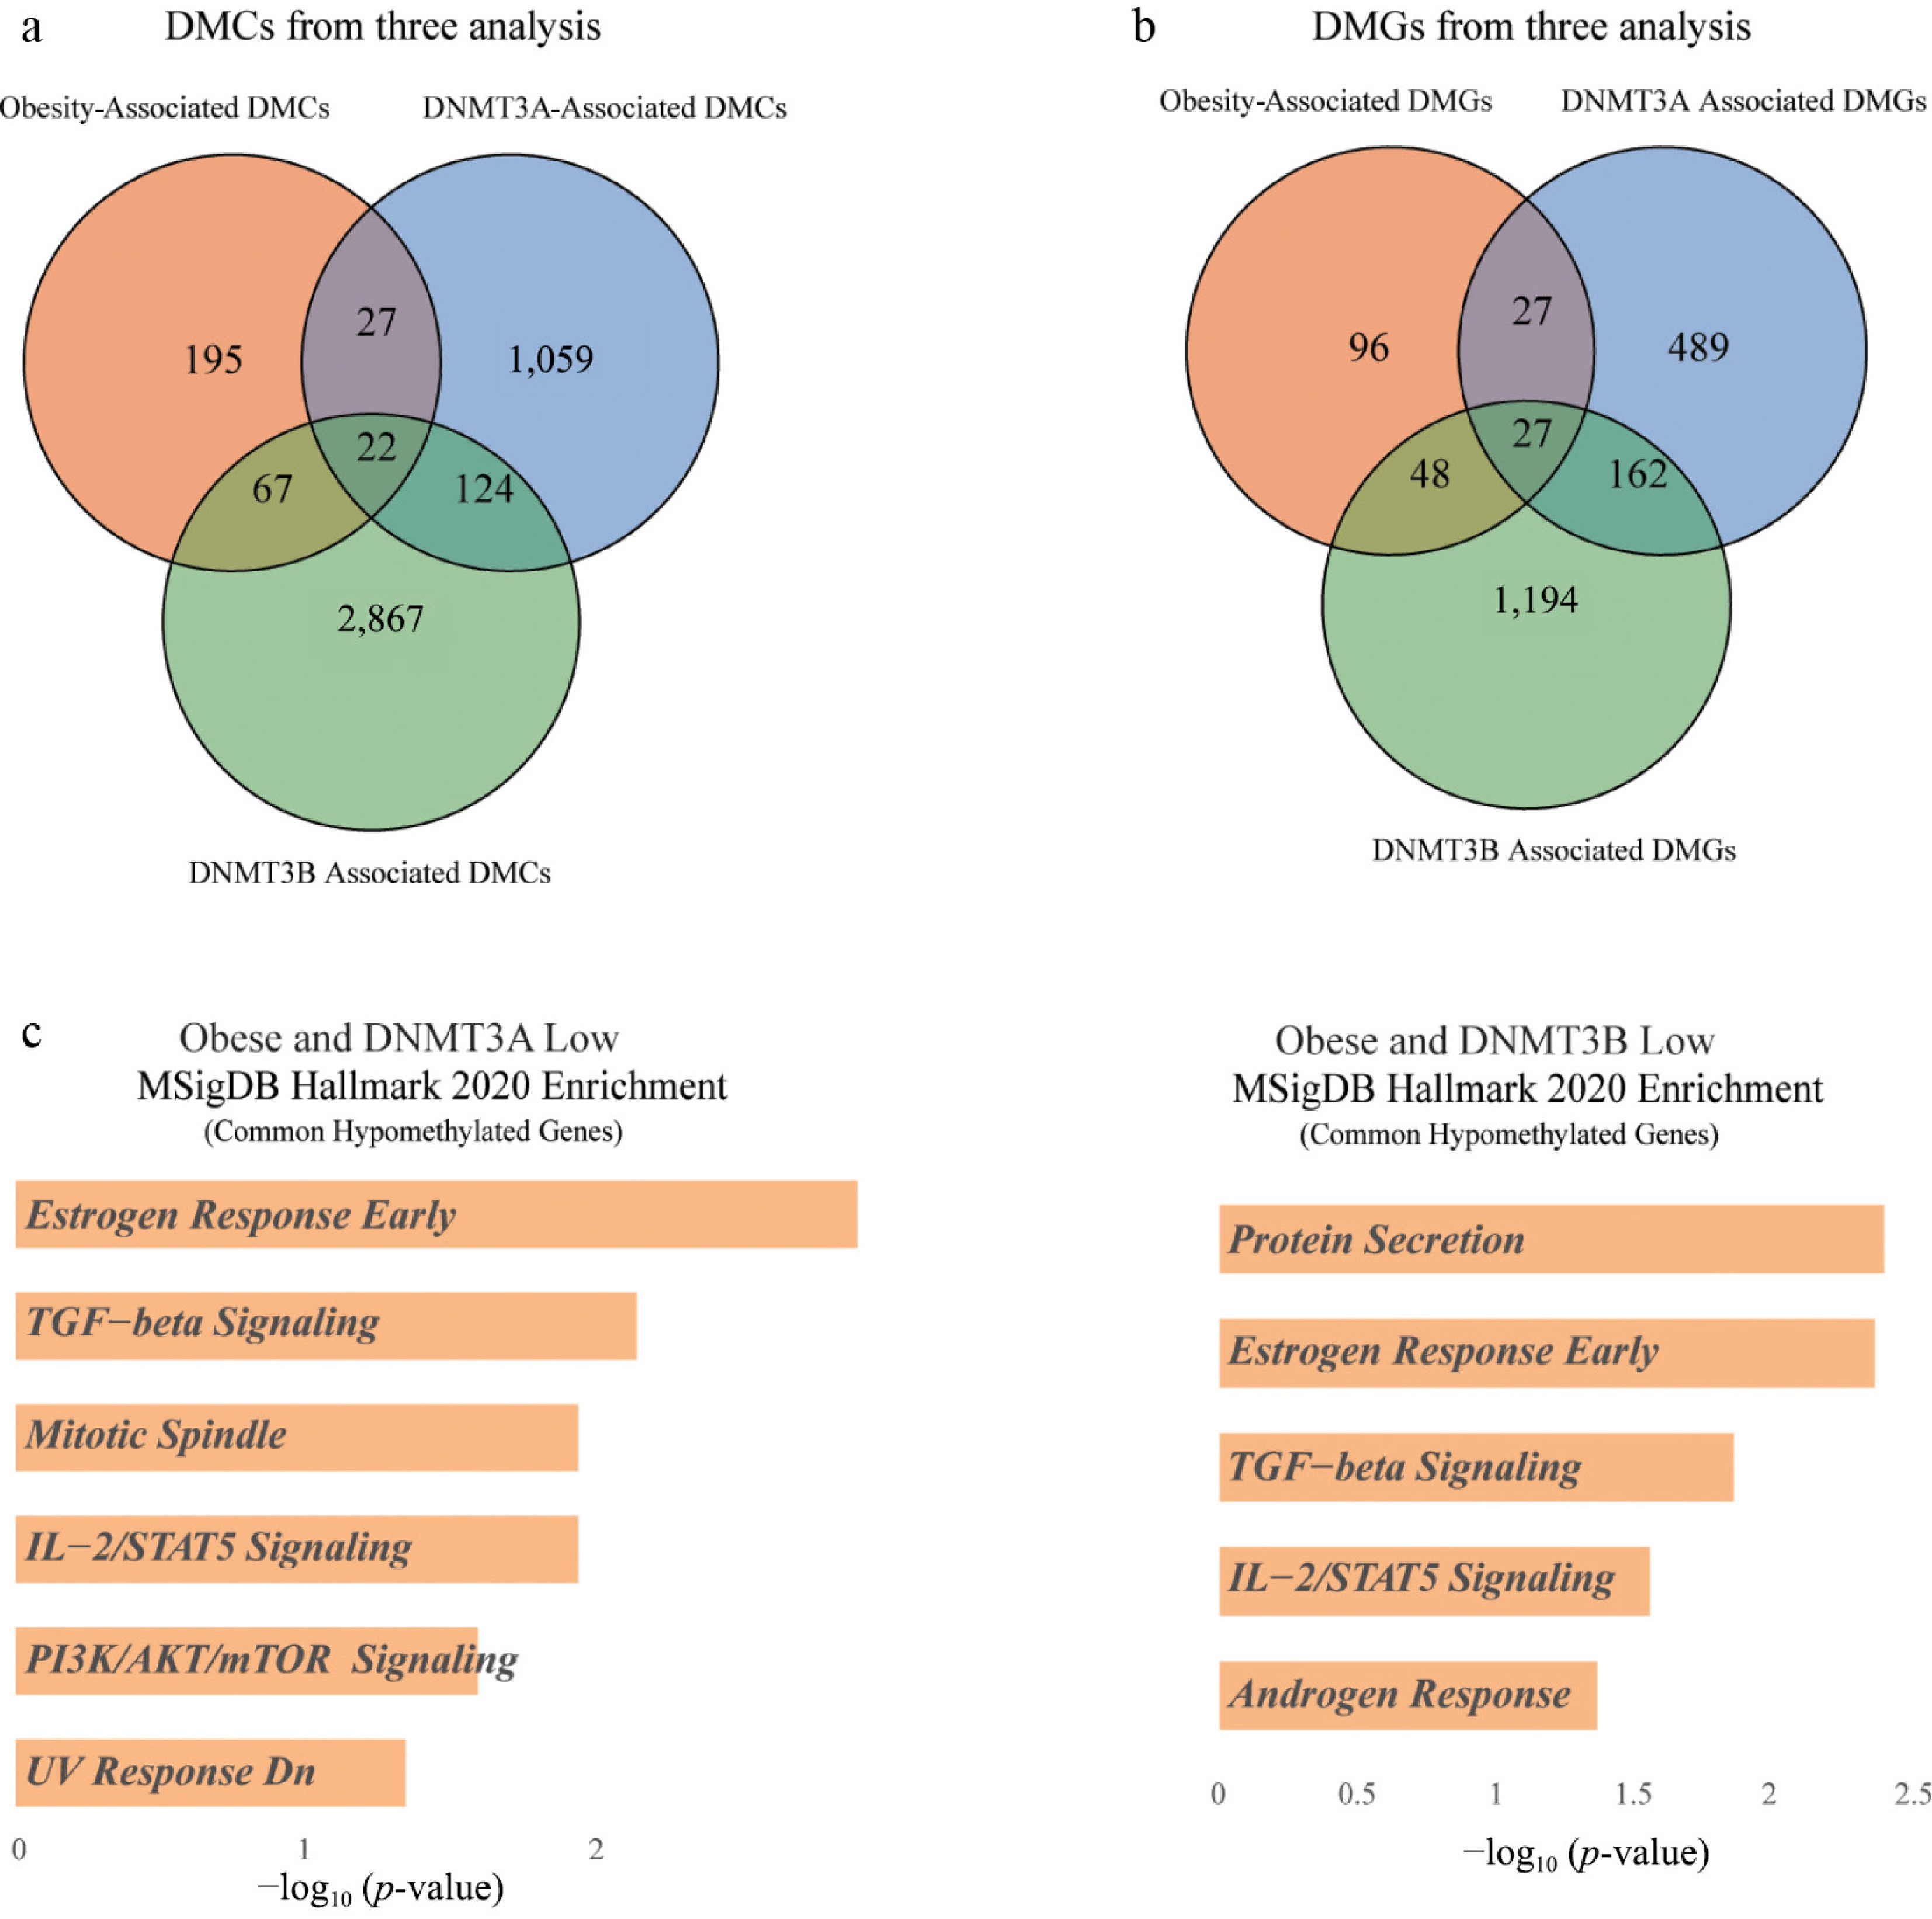
Figure 5.
Intersection of obesity-associated and DNMT3A/B-low-associated methylation changes. (a) Venn diagrams showing overlap of DMCs between obesity-associated DMCs, DNMT3A-associated DMCs and DNMT3B-associated DMCs. (b) Venn diagrams showing overlap of differentially methylated genes (DMGs) between obesity-associated, DNMT3A-associated and DNMT3B-associated DMGs. (c) MSigDB Hallmark 2020 enrichment analysis of common hypomethylated genes shared between obesity-associated and DNMT3A-low signatures (left) and between obesity-associated and DNMT3B-low signatures (right).
-
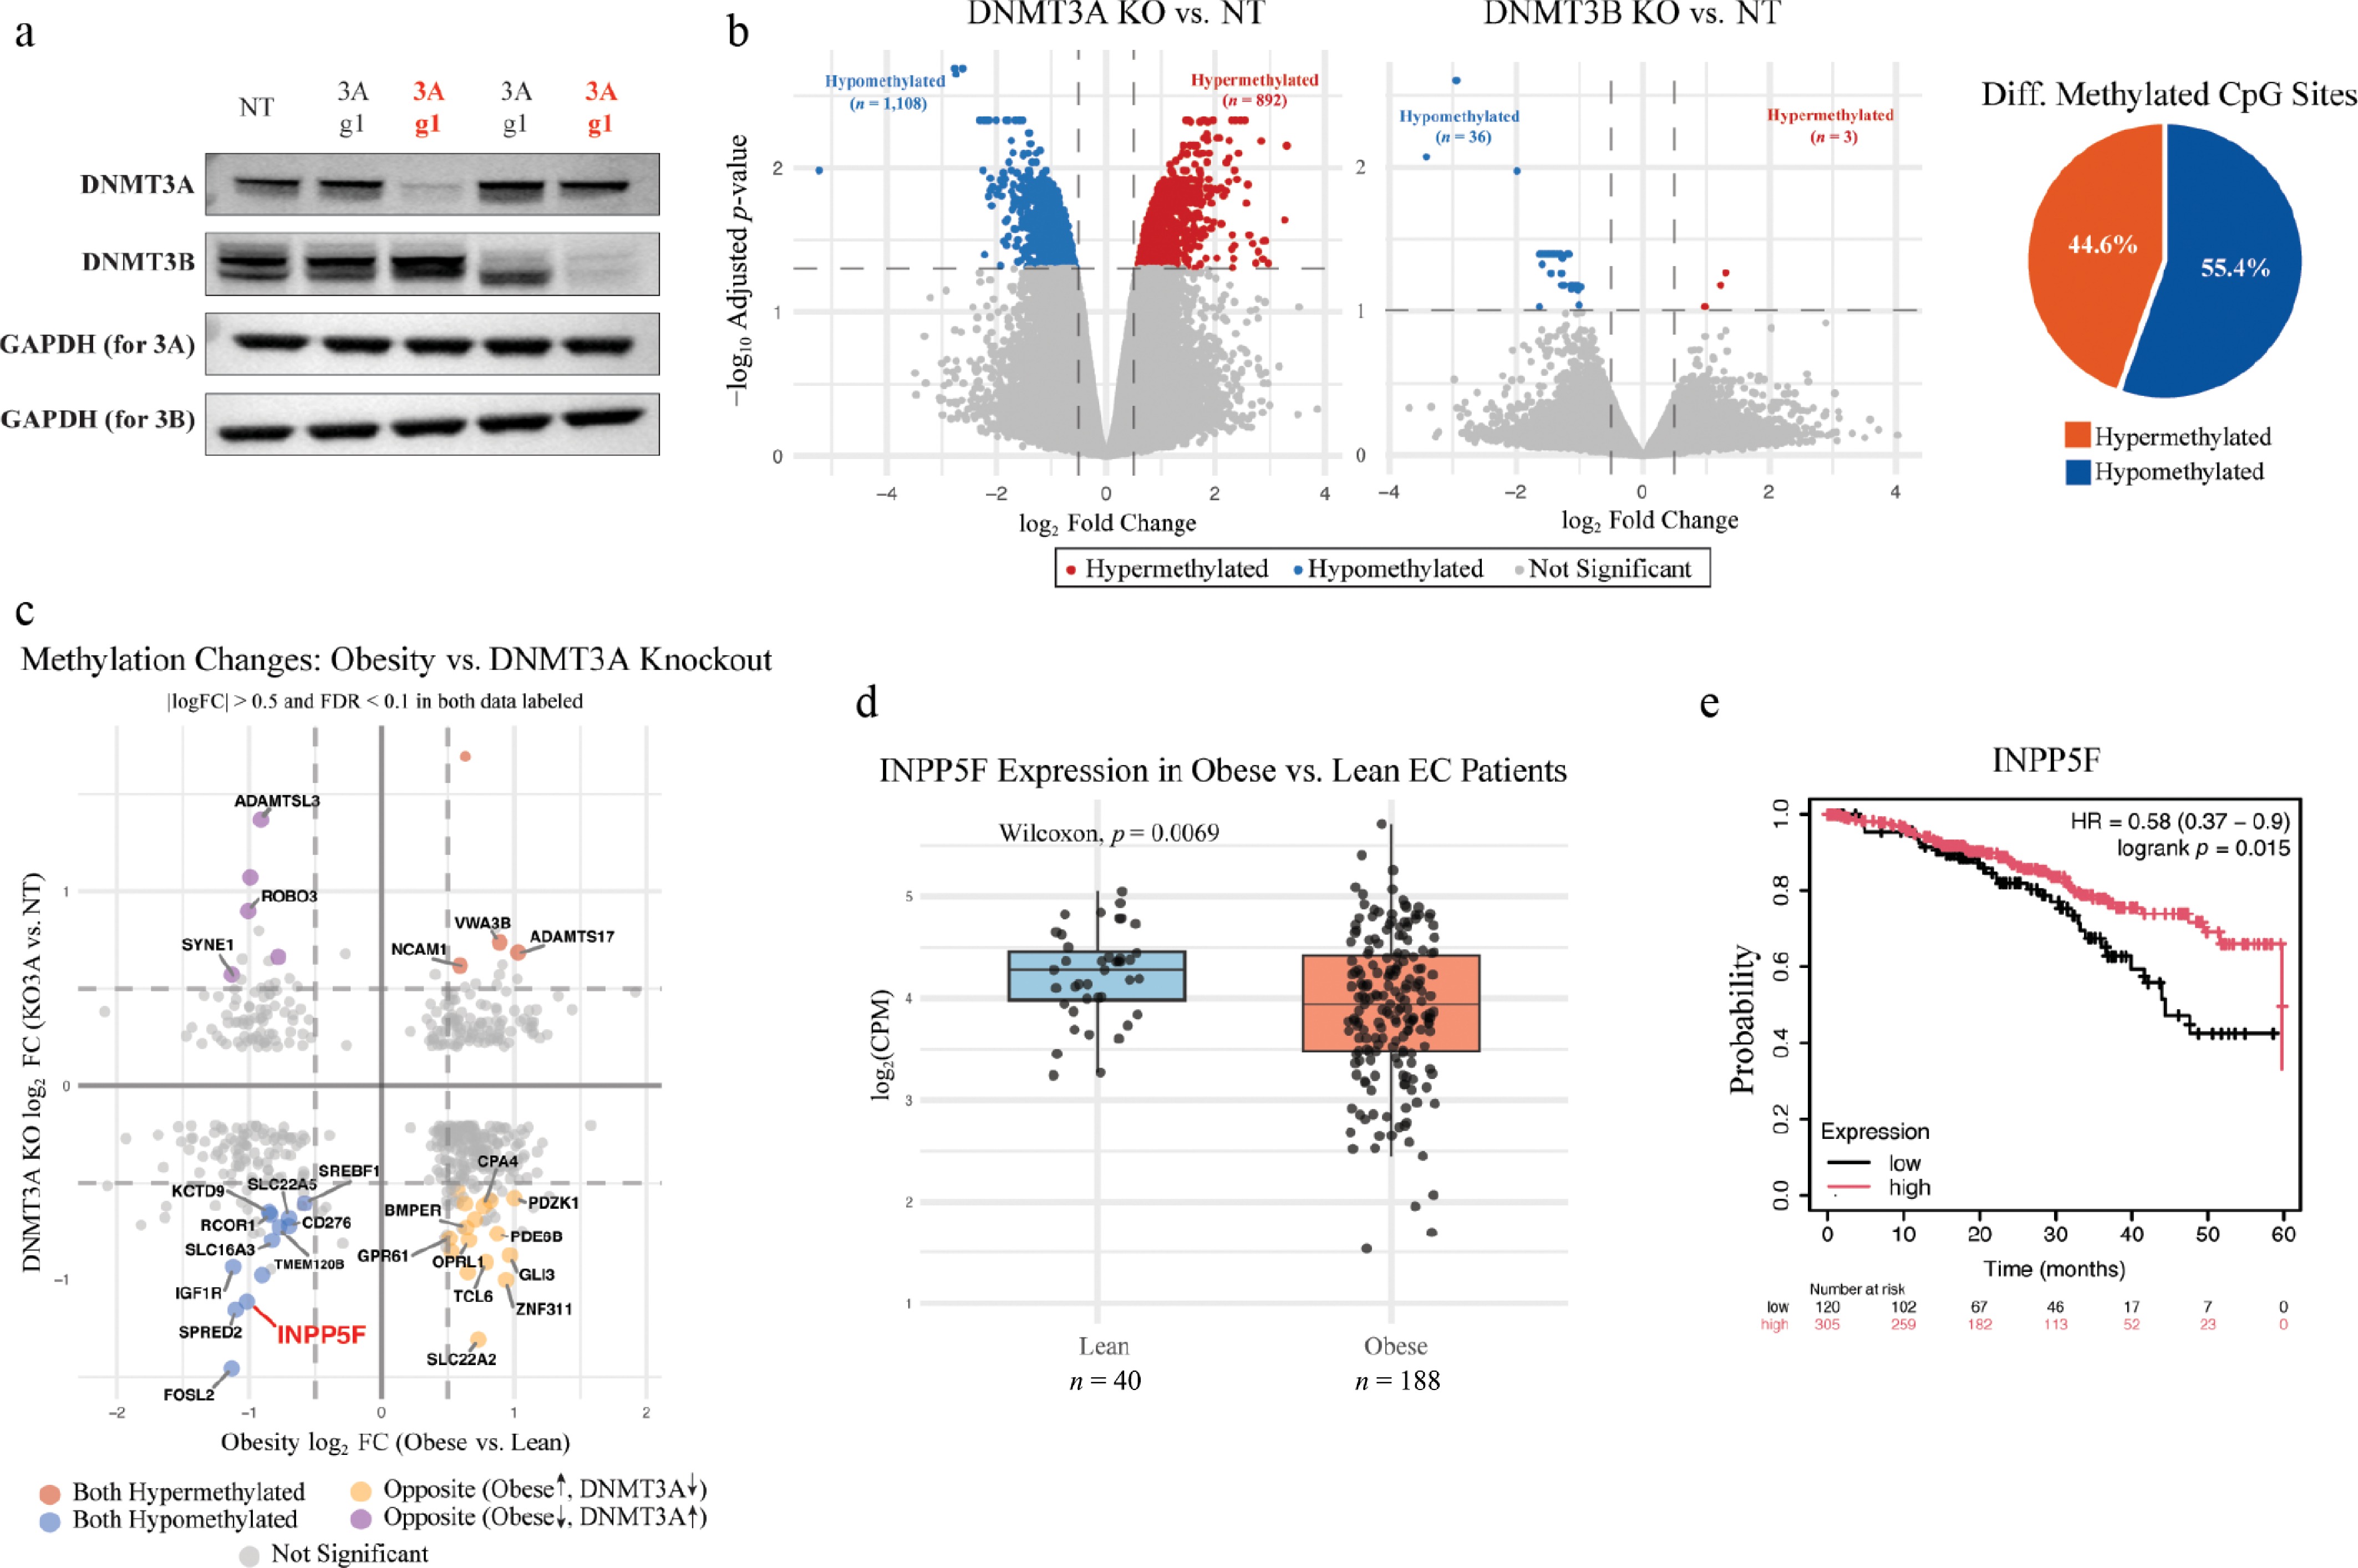
Figure 6.
CRISPR/Cas9 mediated DNMT KO validation and integration with obesity-associated methylation signatures. (a) WB analysis confirming CRISPR/Cas9 mediated KO efficiency in HEC1B endometrial cancer cells. Lanes show non-targeting control (NT) and cells transduced with guide RNAs targeting DNMT3A (g1, g3) or DNMT3B (g1, g3). GAPDH serves as a loading control. (b) Volcano plots showing DMCs in DNMT3A KO (left) and DNMT3B KO (right) cells compared to non-targeting controls, with corresponding pie chart indicating 55.4% hypomethylation and 44.6% hypermethylation in DNMT3A KO cells. (c) Scatter plot integrating obesity-associated methylation changes (x-axis: log2 fold change in tumors from obese vs. lean patients) with DNMT3A knockout-induced changes (y-axis: log2 fold change in DNMT3A KO vs. NT cells). Points represent CpG sites, with colors indicating concordant hypomethylation (blue), concordant hypermethylation (red), or discordant patterns (yellow/green). Significant genes are labeled. (d) Boxplot comparing INPP5F expression between lean and tumors from obese patients (Wilcoxon p = 0.0069). (e) Kaplan–Meier survival curve from the UCEC dataset (n = 543) showing that low INPP5F expression is associated with decreased overall survival (HR = 0.58; 95% CI: 0.37–0.90).
-
Clinical features n Lean1 Obese1 Age (years) 229 ≤ 50 8 (20%) 23 (12%) 50–64 17 (43%) 95 (50%) ≥ 65 15 (38%) 70 (37%) Age not reported 0 (0%) 1 (0.5%) Race (self-reported) 229 Black or African American 3 (7.5%) 40 (21%) Not reported 2 (5.0%) 7 (3.7%) Other 4 (10%) 9 (4.8%) White 31 (78%) 133 (70%) FIGO_stage 229 I 27 (68%) 129 (68%) II 4 (10%) 20 (11%) III 9 (23%) 34 (18%) IV 0 (0%) 6 (3.2%) Tumor grade 229 Grade 1 3 (7.5%) 36 (19%) Grade 2 7 (18%) 52 (28%) Grade 3 16 (40%) 45 (24%) Not available 14 (35%) 56 (30%) Recurrence 229 Yes 3 (7.5%) 22 (12%) No 21 (53%) 100 (53%) Not available 16 (40%) 67 (35%) 1 n (%). Table 1.
Clinical characteristics of analyzed tumor samples.
Figures
(6)
Tables
(1)