-
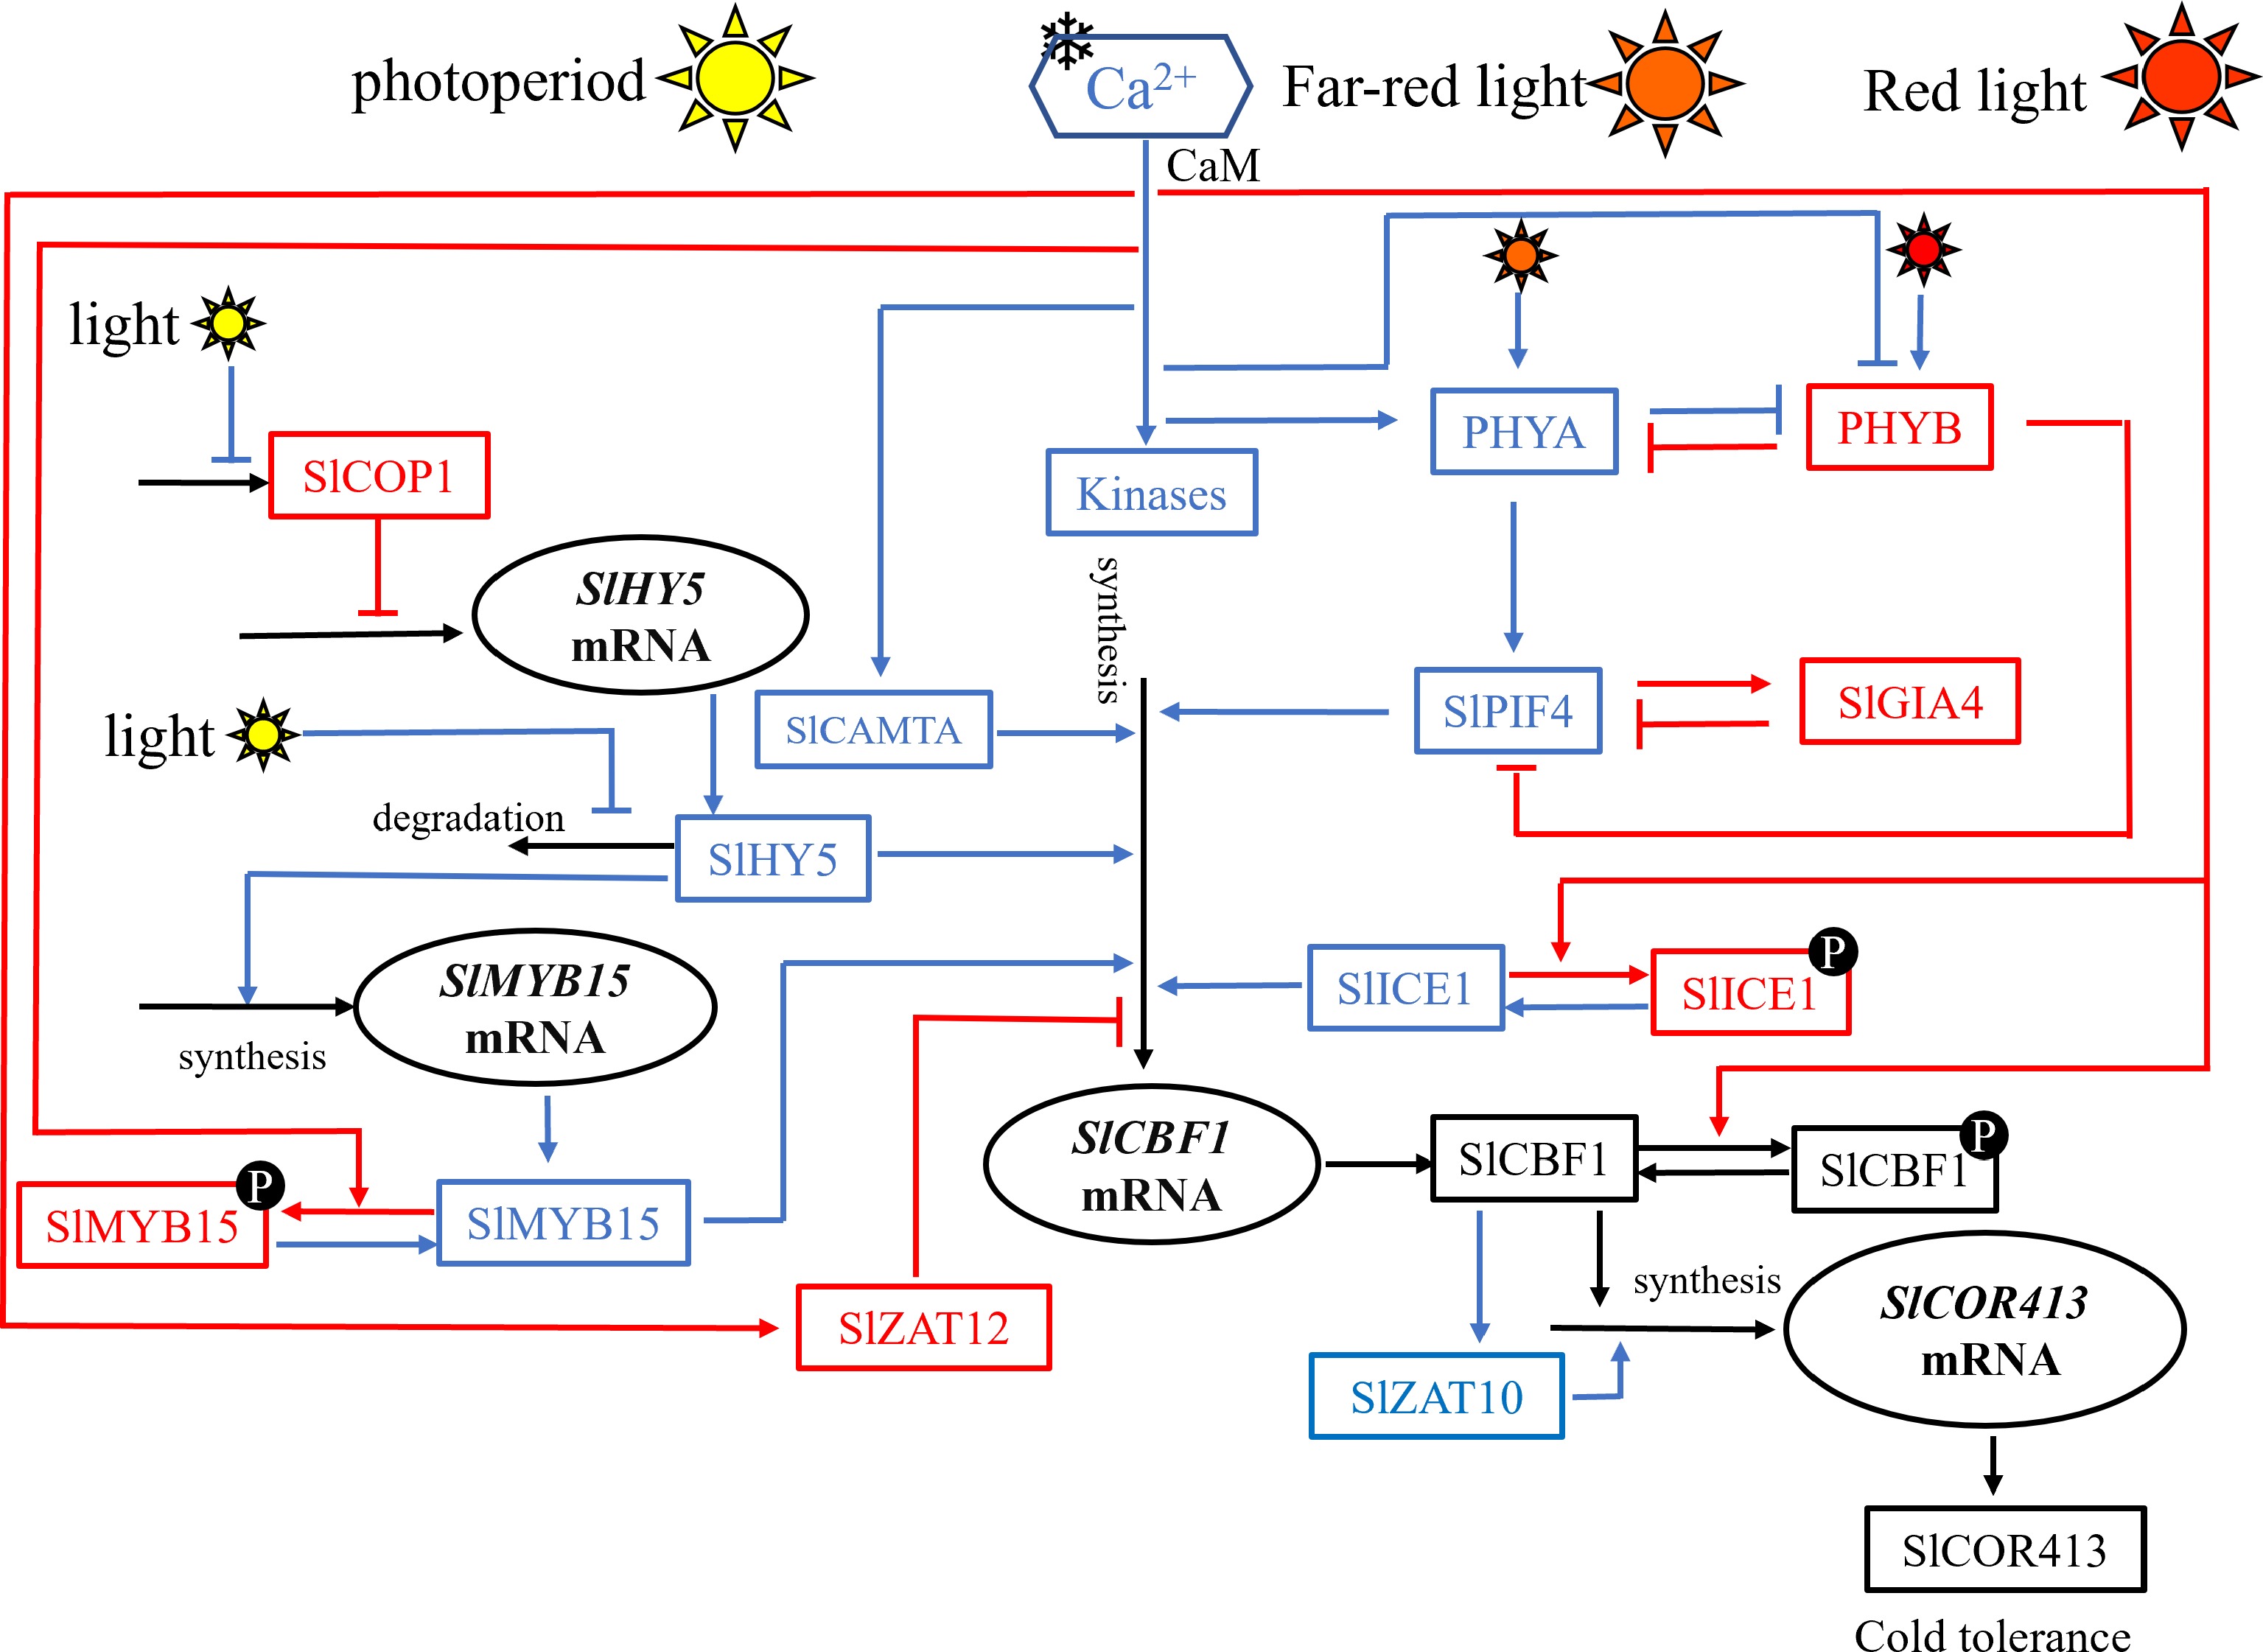
Figure 1.
Schematic model for light- and cold-responsive signaling transduction pathways in tomato. Signaling pathway were constructed only in light–dark cycles and red–far red (R:FR) light conditions. This pathway involves negative and positive regulators of the core genes—SlICE1, SlCBF1, and SlCOR413—which are linked with light-related genes and proteins. In order to clarify the regulatory relations in the network, the structure is artificially divided into four modules. The first module is COP1–HY5–MYB15, where HY5 acts as a light-influenced hub. Considering the role of light quality in the pathway, PHY–PIF4–GIA4 is proposed in the photochrome-dependent pathway. Upstream regulators (SlHY5, SlMYB15, SlPIF4, and SlCAMTA as activators and SlZAT12 as inhibitor) of CBF ultimately determine the expression profile of the cold-responsive components in the core ICE–CBF–COR module.
-
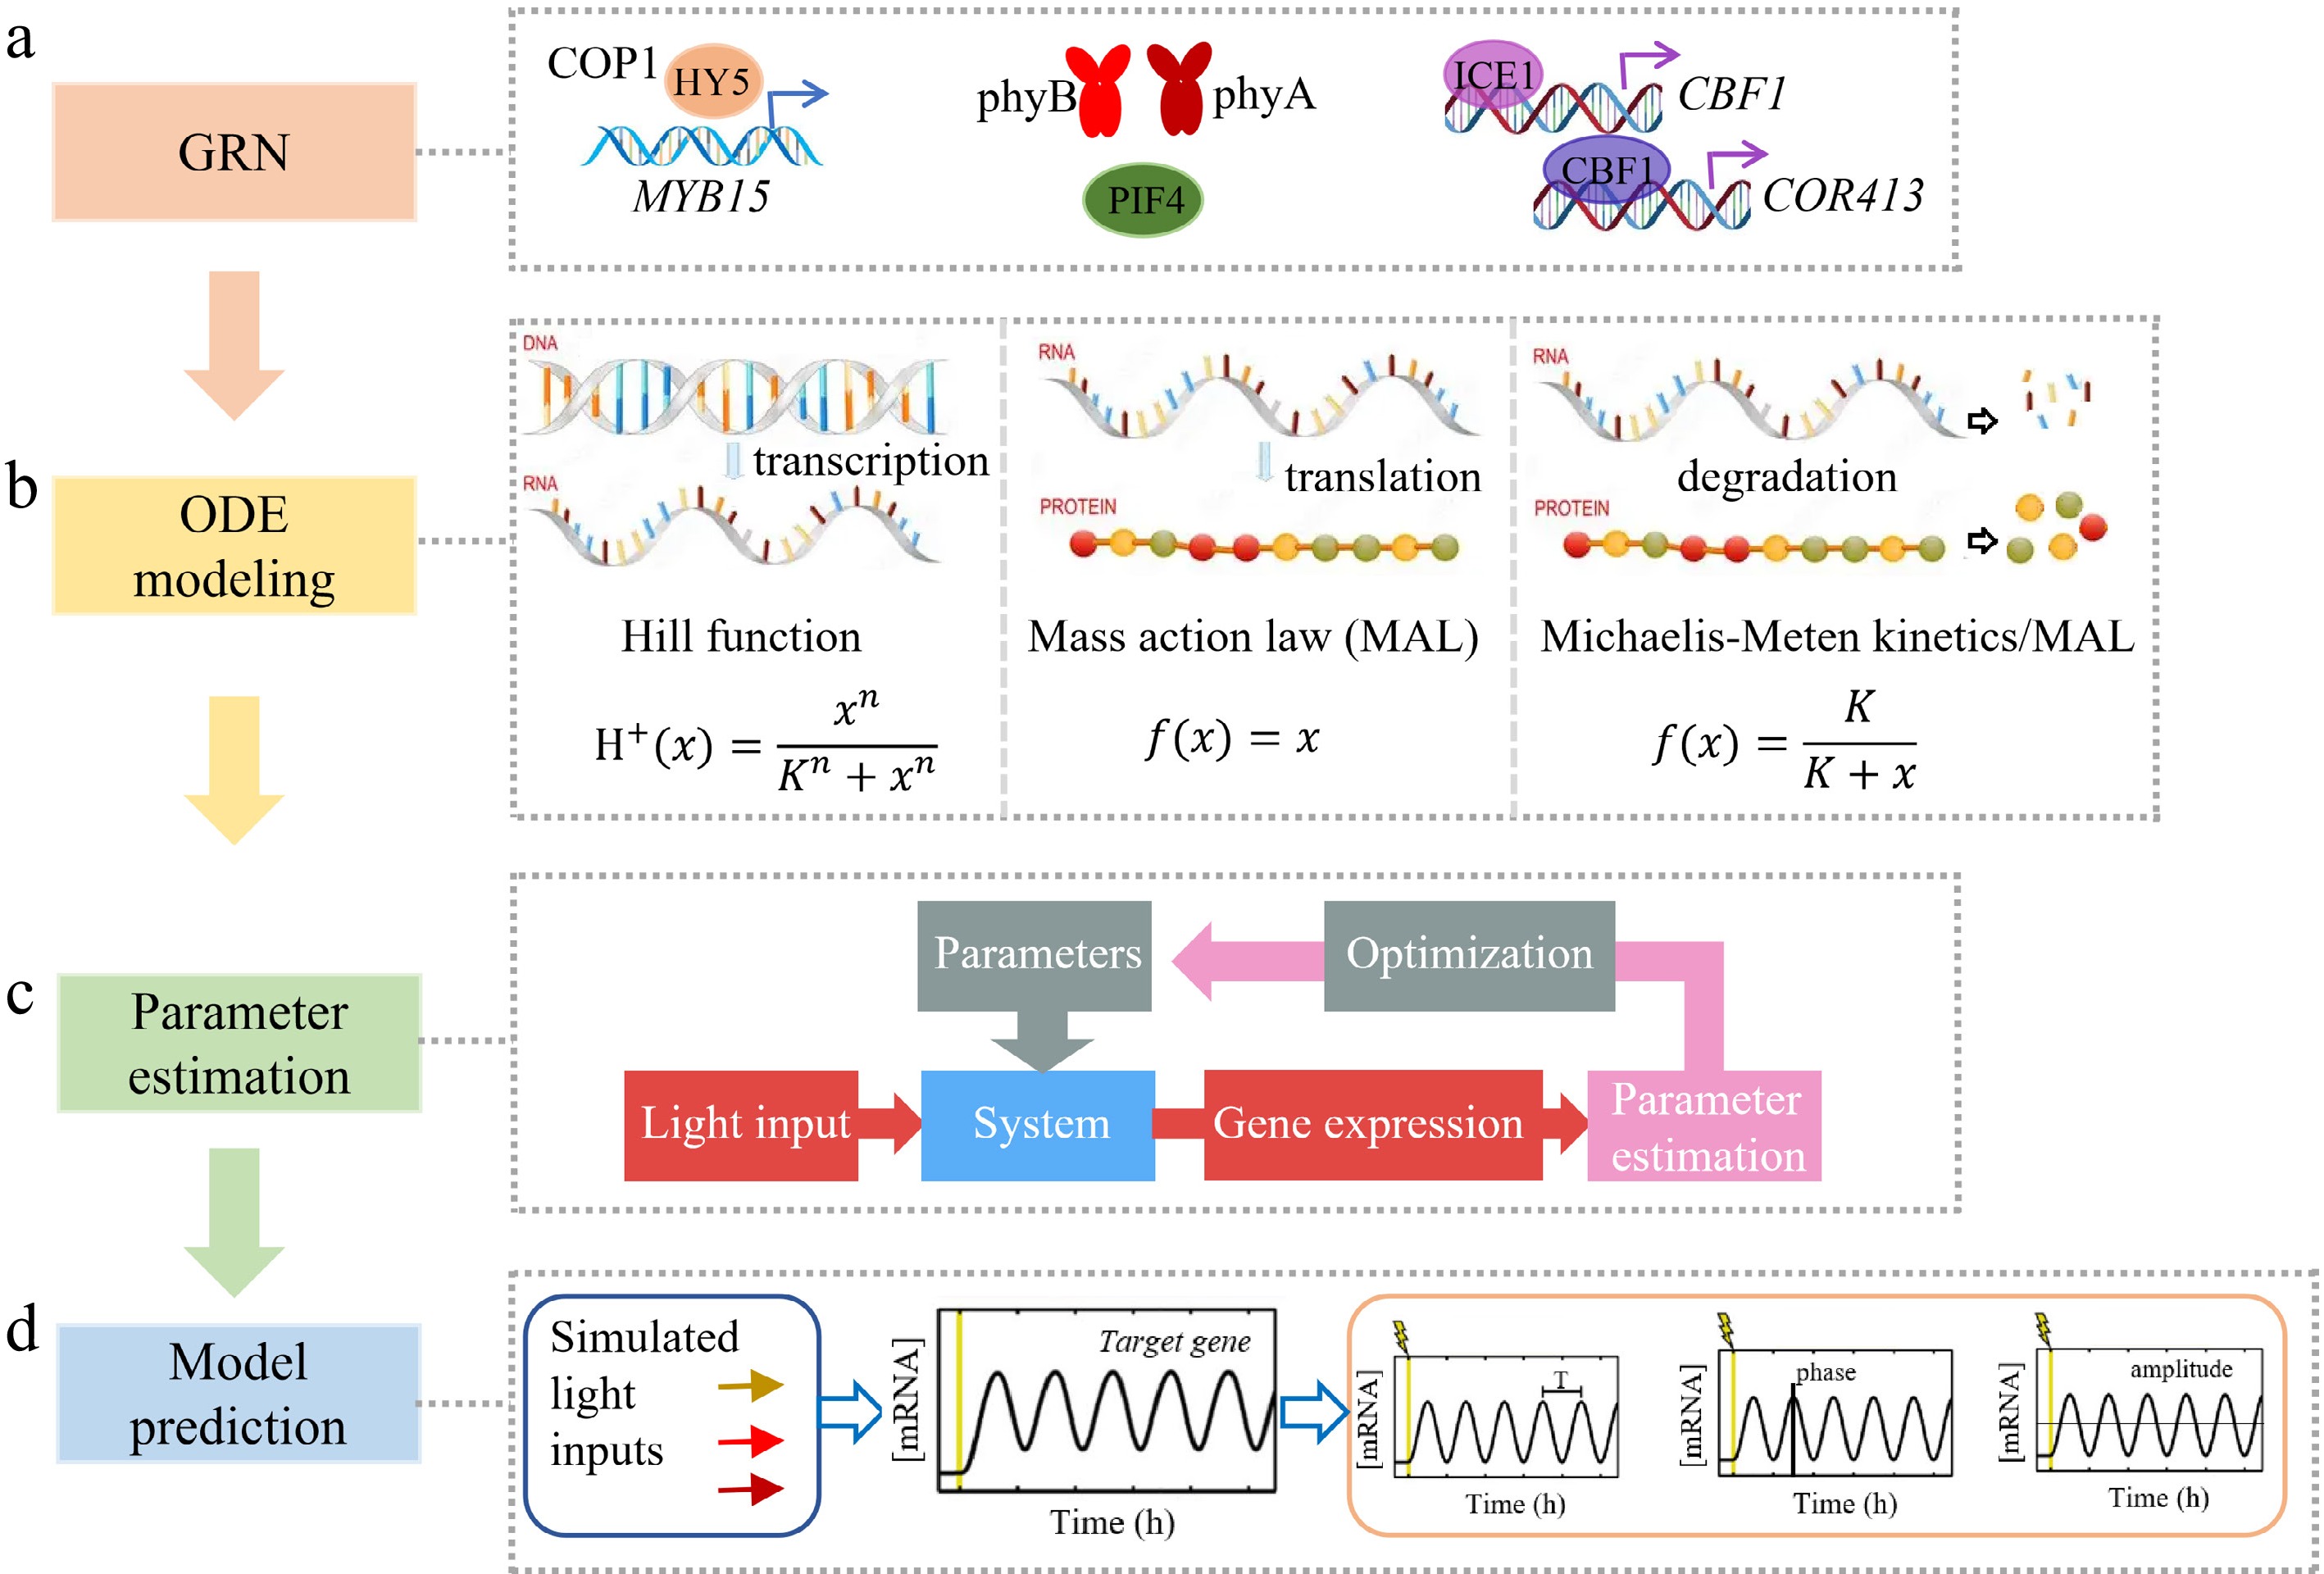
Figure 2.
Modeling and verification process of the integrated regulatory network for light and low temperature signals. (a) Construction of the gene regulatory network (GRN). A core GRN was assembled from molecular evidence, integrating key light- and cold-responsive components. The network includes phyA/phyB photoreceptors (inhibiting PIF4 and HY5), COP1-regulated SlMYB15 activation, ICE1-mediated induction of CBF1, and downstream regulation of COR413, establishing a mechanistic foundation for mathematical formulation. (b) The ODE model's formulation. Biological processes were translated into quantitative kinetic equations: Transcriptional regulation was modeled using Hill functions to capture transcription factors' (TFs') dose–response patterns. Translation was described by mass-action kinetics; protein degradation was followed Michaelis–Menten or first-order decay. These components were integrated into an ODE system for a dynamic analysis of signal integration. (c) Parameter estimation. Model parameters were optimized by minimizing the sum of squared errors between simulated and experimental expression data obtained under 12-h light–12-h dark photocycles at 4 °C, including SlHY5 (wild-type) and SlMYB15 (wild-type, hy5 mutant, and SlHY5-overexpression lines). Iterative least-squares fitting yielded a parameter set that accurately reproduces the observed dynamics. (d) Model prediction and experimental validation. Using the optimized parameters, the model was simulated under varied photoperiods. It successfully predicted the cycle length, phase, and amplitude changes of target genes, validating its capacity to simulate light–temperature signals' integration and providing a predictive tool for dissecting cold acclimation mechanisms under complex environmental scenarios.
-
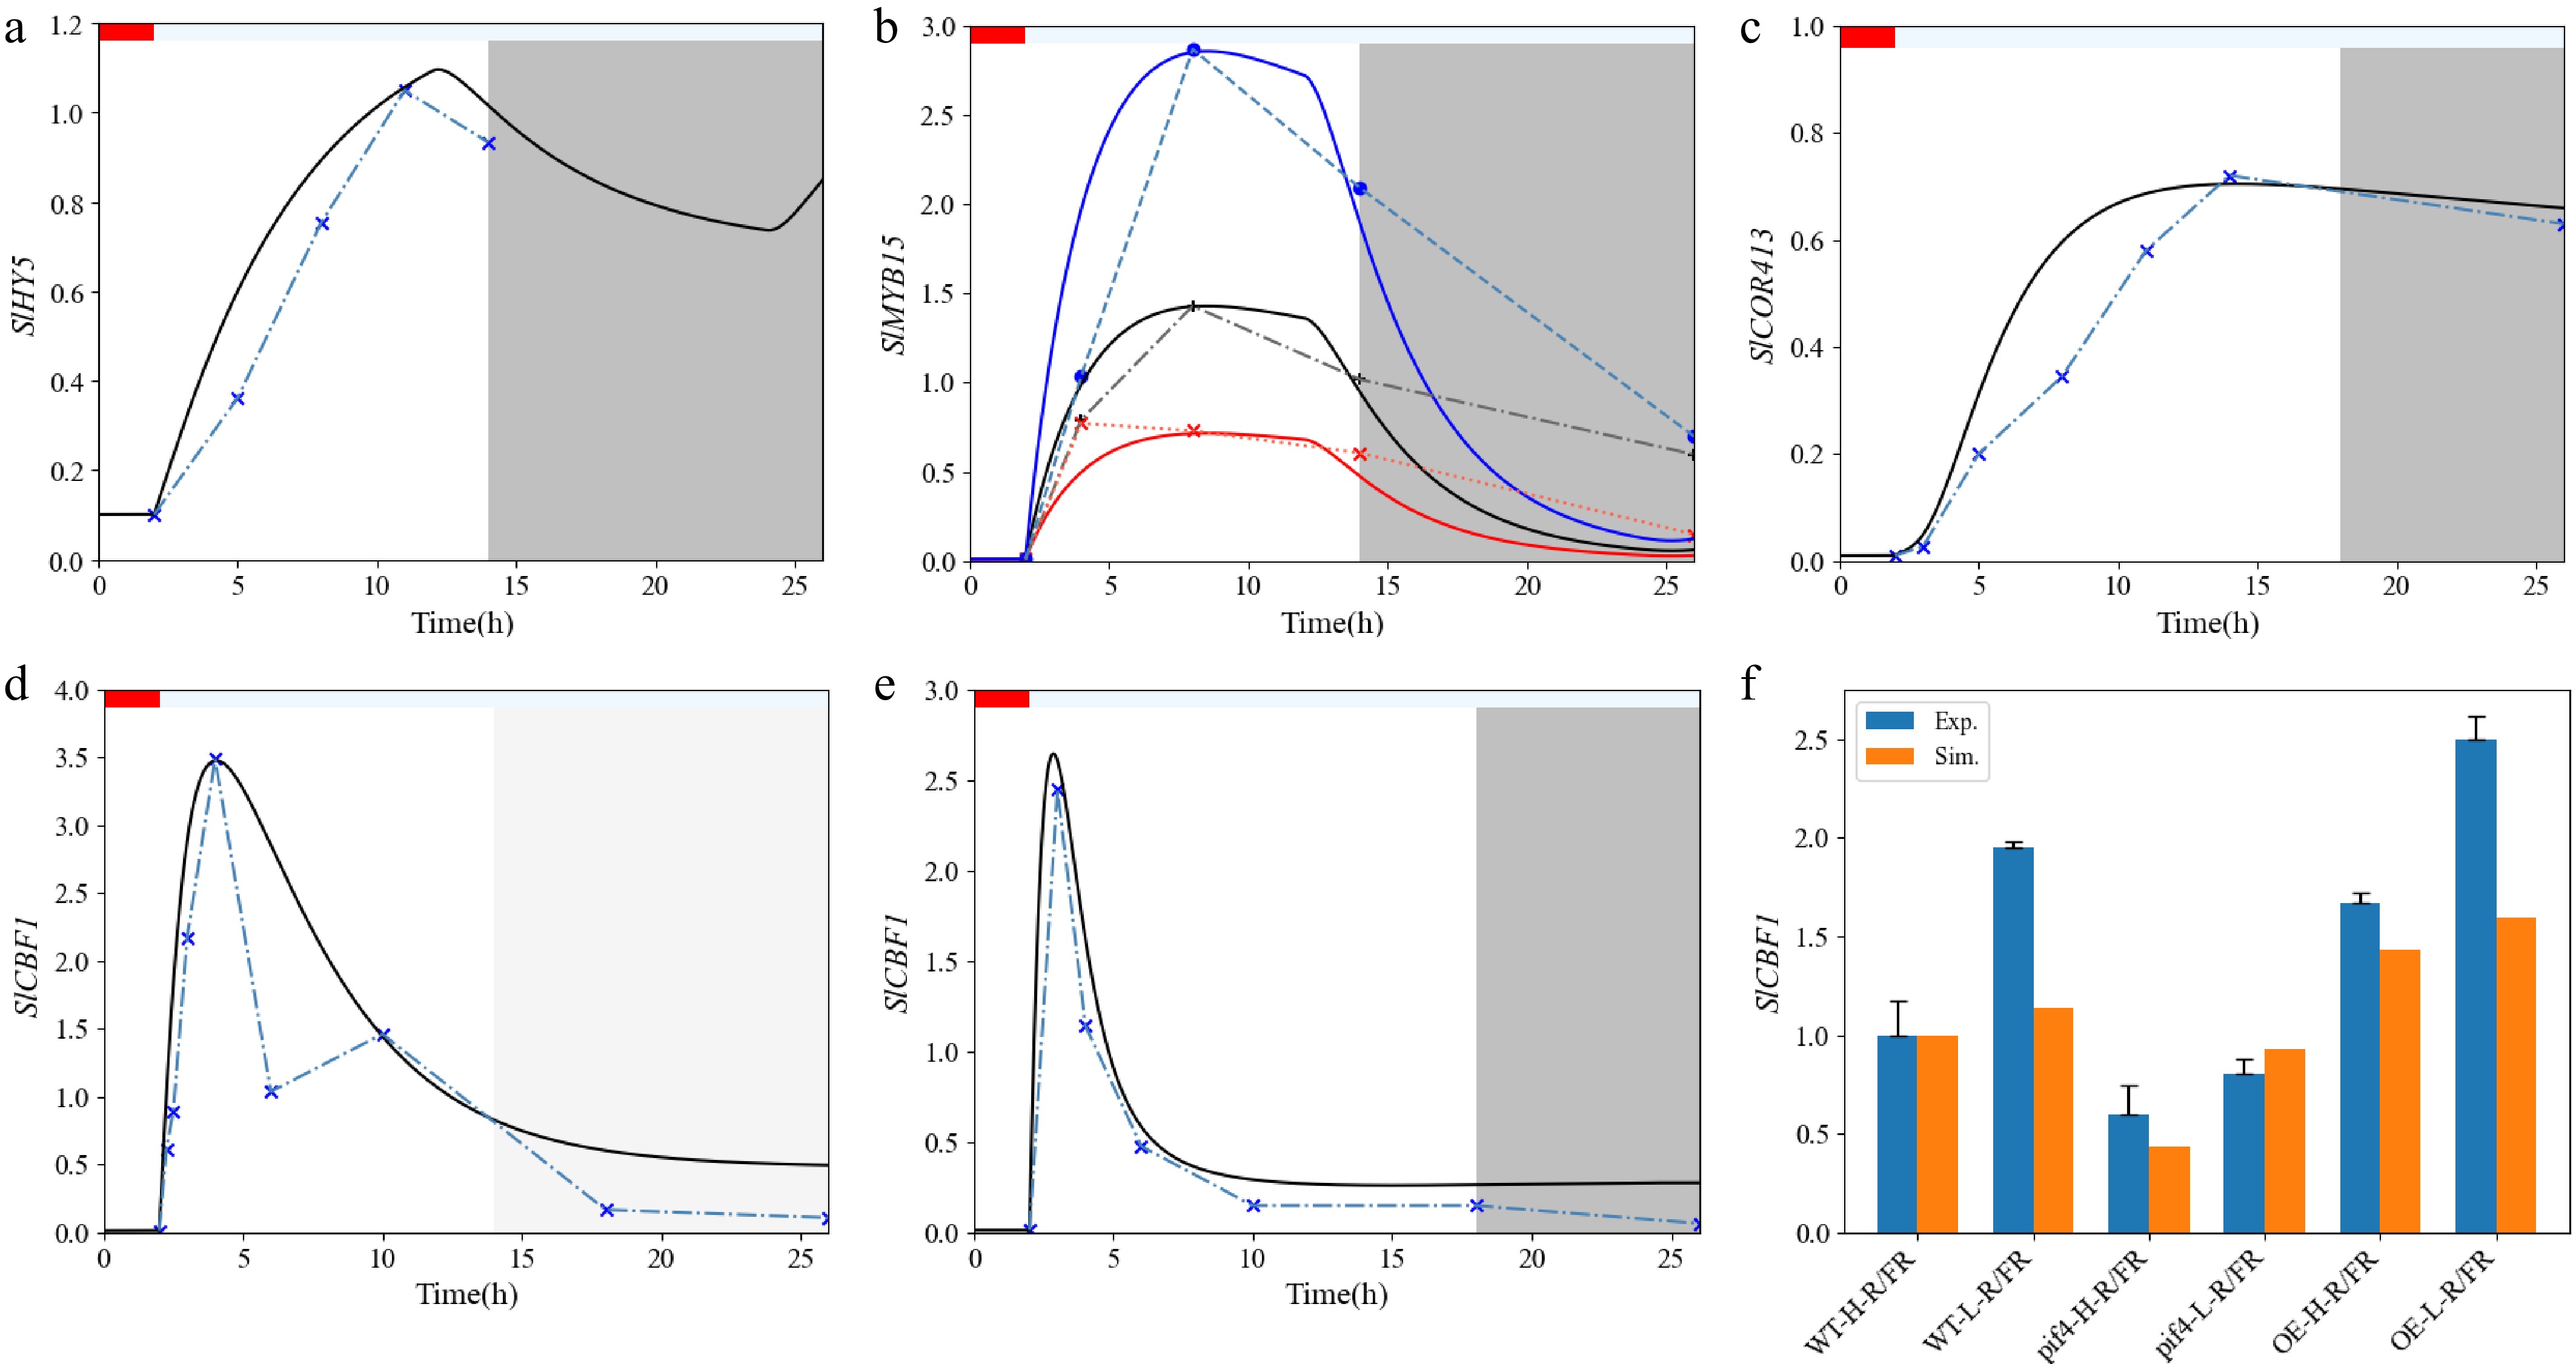
Figure 3.
Time series validation of the cold-related genes after cold shock. (a, b) The expression levels of SlHY5 and SlMYB15 for basic parameter estimation. (c–e) Model validation of SlCBF1 and SlCOR413 expression in under light–dark (LD) or in LL conditions. (f) Experimental and simulated SlCBF1 gene relative expression in tomato (wild-type [WT], pif4 mutant, and SlPIF4-overexpressing [OE]) plants after exposure to 4 °C under H-R:FR or L-R:FR conditions. Experimental data (blue crosses) were derived from Figure 6a in Wang et al.[14], from Figure 3b in Zhang et al.[13], from Figure 2a in Zhang et al.[12], and from Figure 2c in Wang et al.[29]. Black solid curves indicate the simulations, which were obtained by numerical integration of the kinetic equations (Eqs [1]–[24]), by the classical fourth-order Runge–Kutta method. The parameters are shown in Supplementary Table S2. The red and the blue bars represent warm and low temperature treatments, respectively.
-
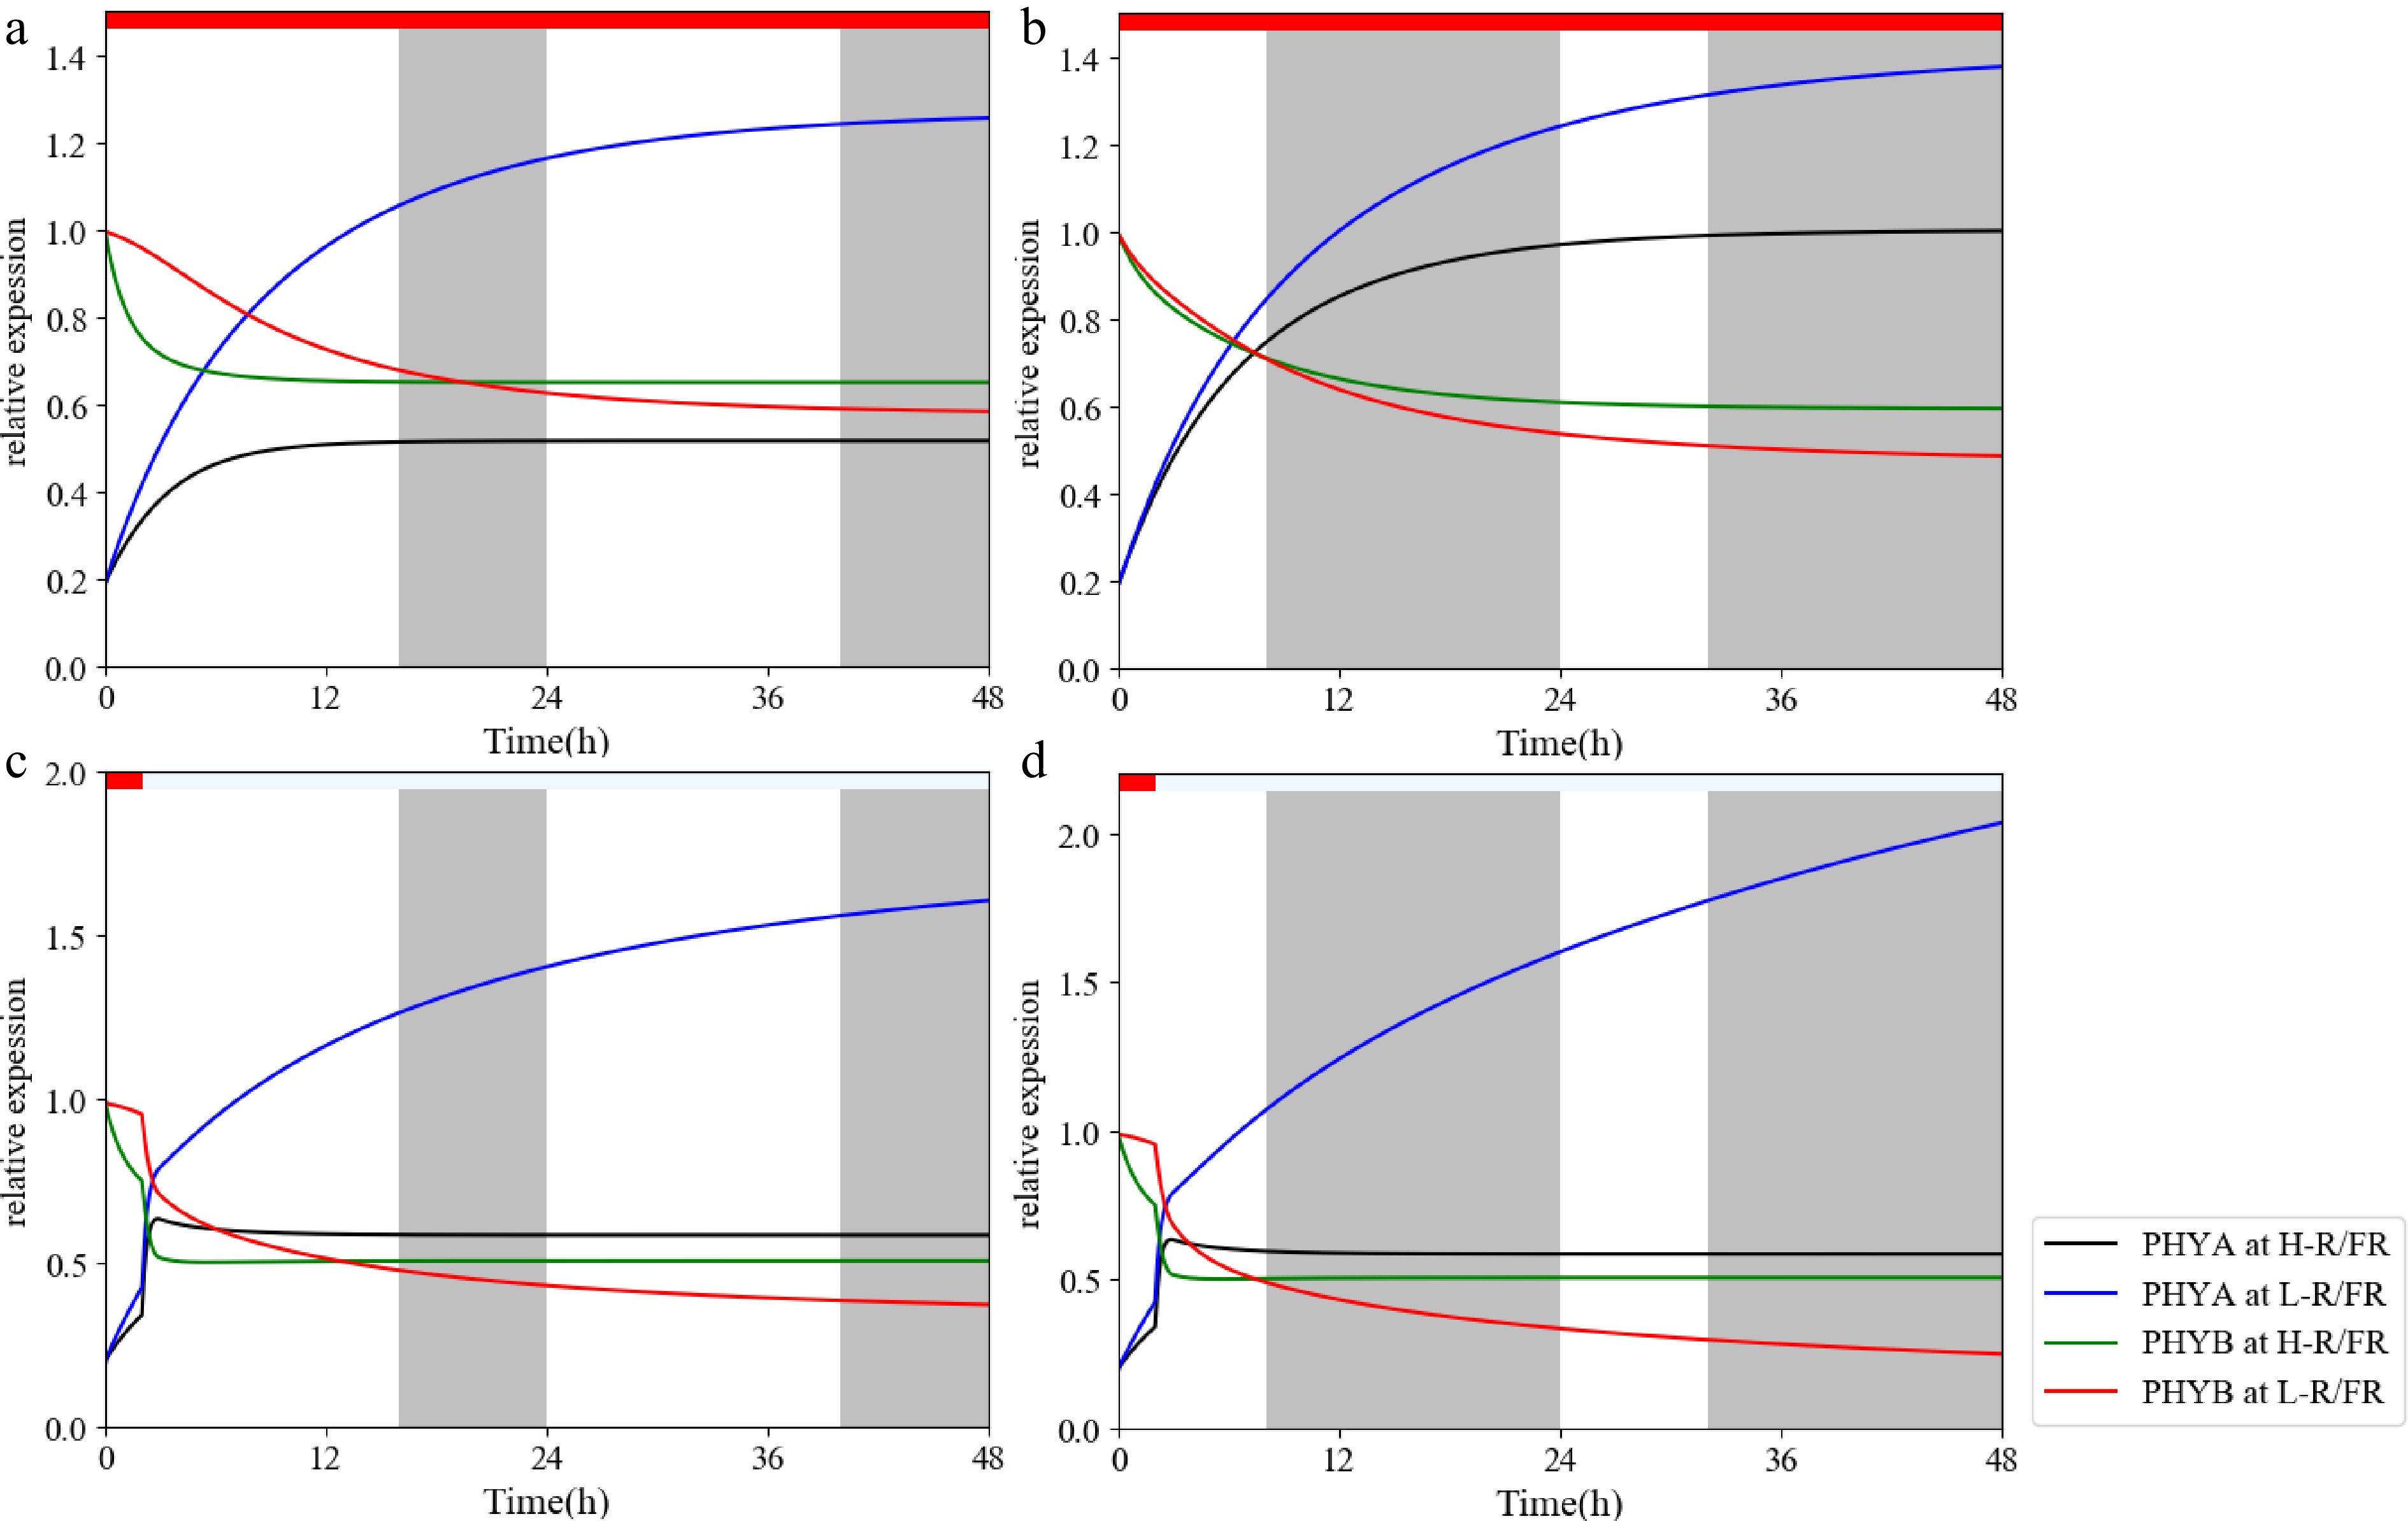
Figure 4.
Tomato phytochromes in response to variations in temperature, photoperiod, and light quality. (a–d) Accumulation of phytochrome proteins (SlPHYA; SlPHYB) as influenced by temperature, photoperiod and light quality in tomato plants. Plants were maintained at 25 or 10 °C under LD (16 h) or SD (8 h) conditions with a high R:FR ratio (
$ \gamma =0.5 $ $ \gamma =2.5 $ $ L(t) $ $ \gamma $ -
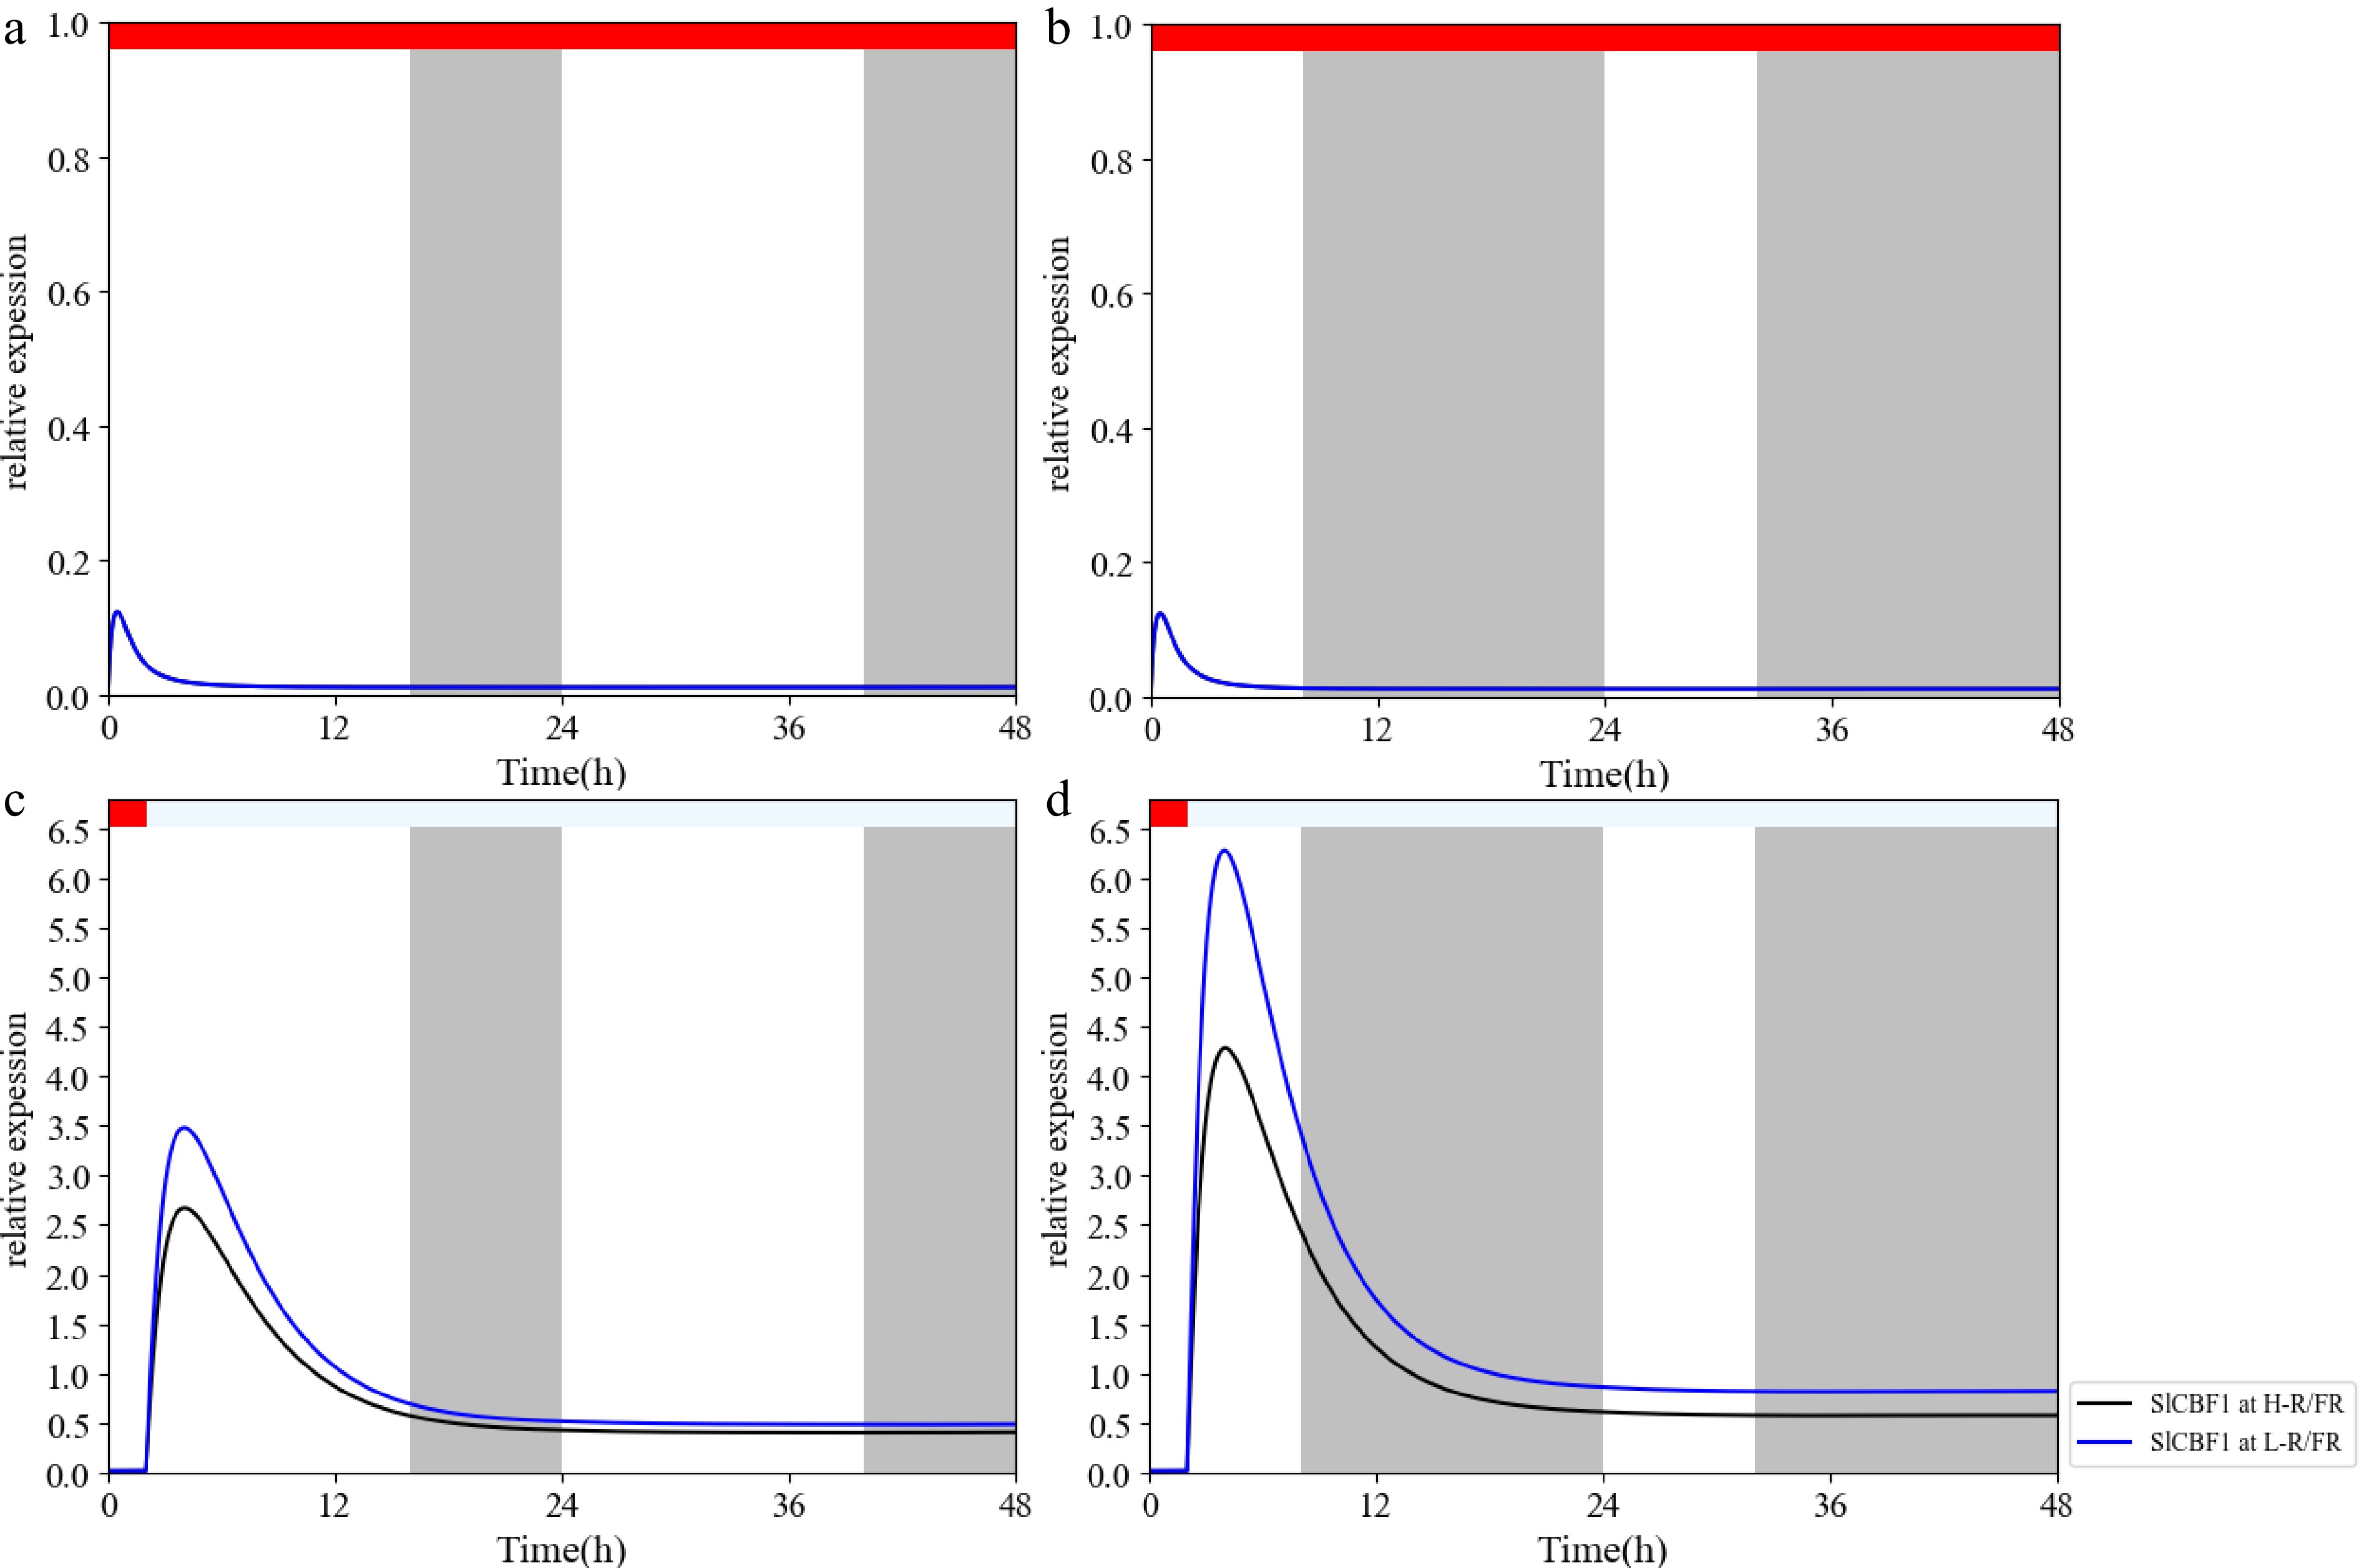
Figure 5.
Short-day (SD) and low R/FR-induced cold tolerance in tomato plants. (a–d) Transcripts of the cold-tolerant gene SlCBF1 as influenced by temperature, photoperiod, and light quality in tomato plants. Plants were maintained at 25 or 10 °C under LD (16 h) or SD (8 h) conditions with a high R:FR ratio (
$ \gamma =0.5 $ $ \gamma =2.5 $ $ L(t) $ $ \gamma $ -
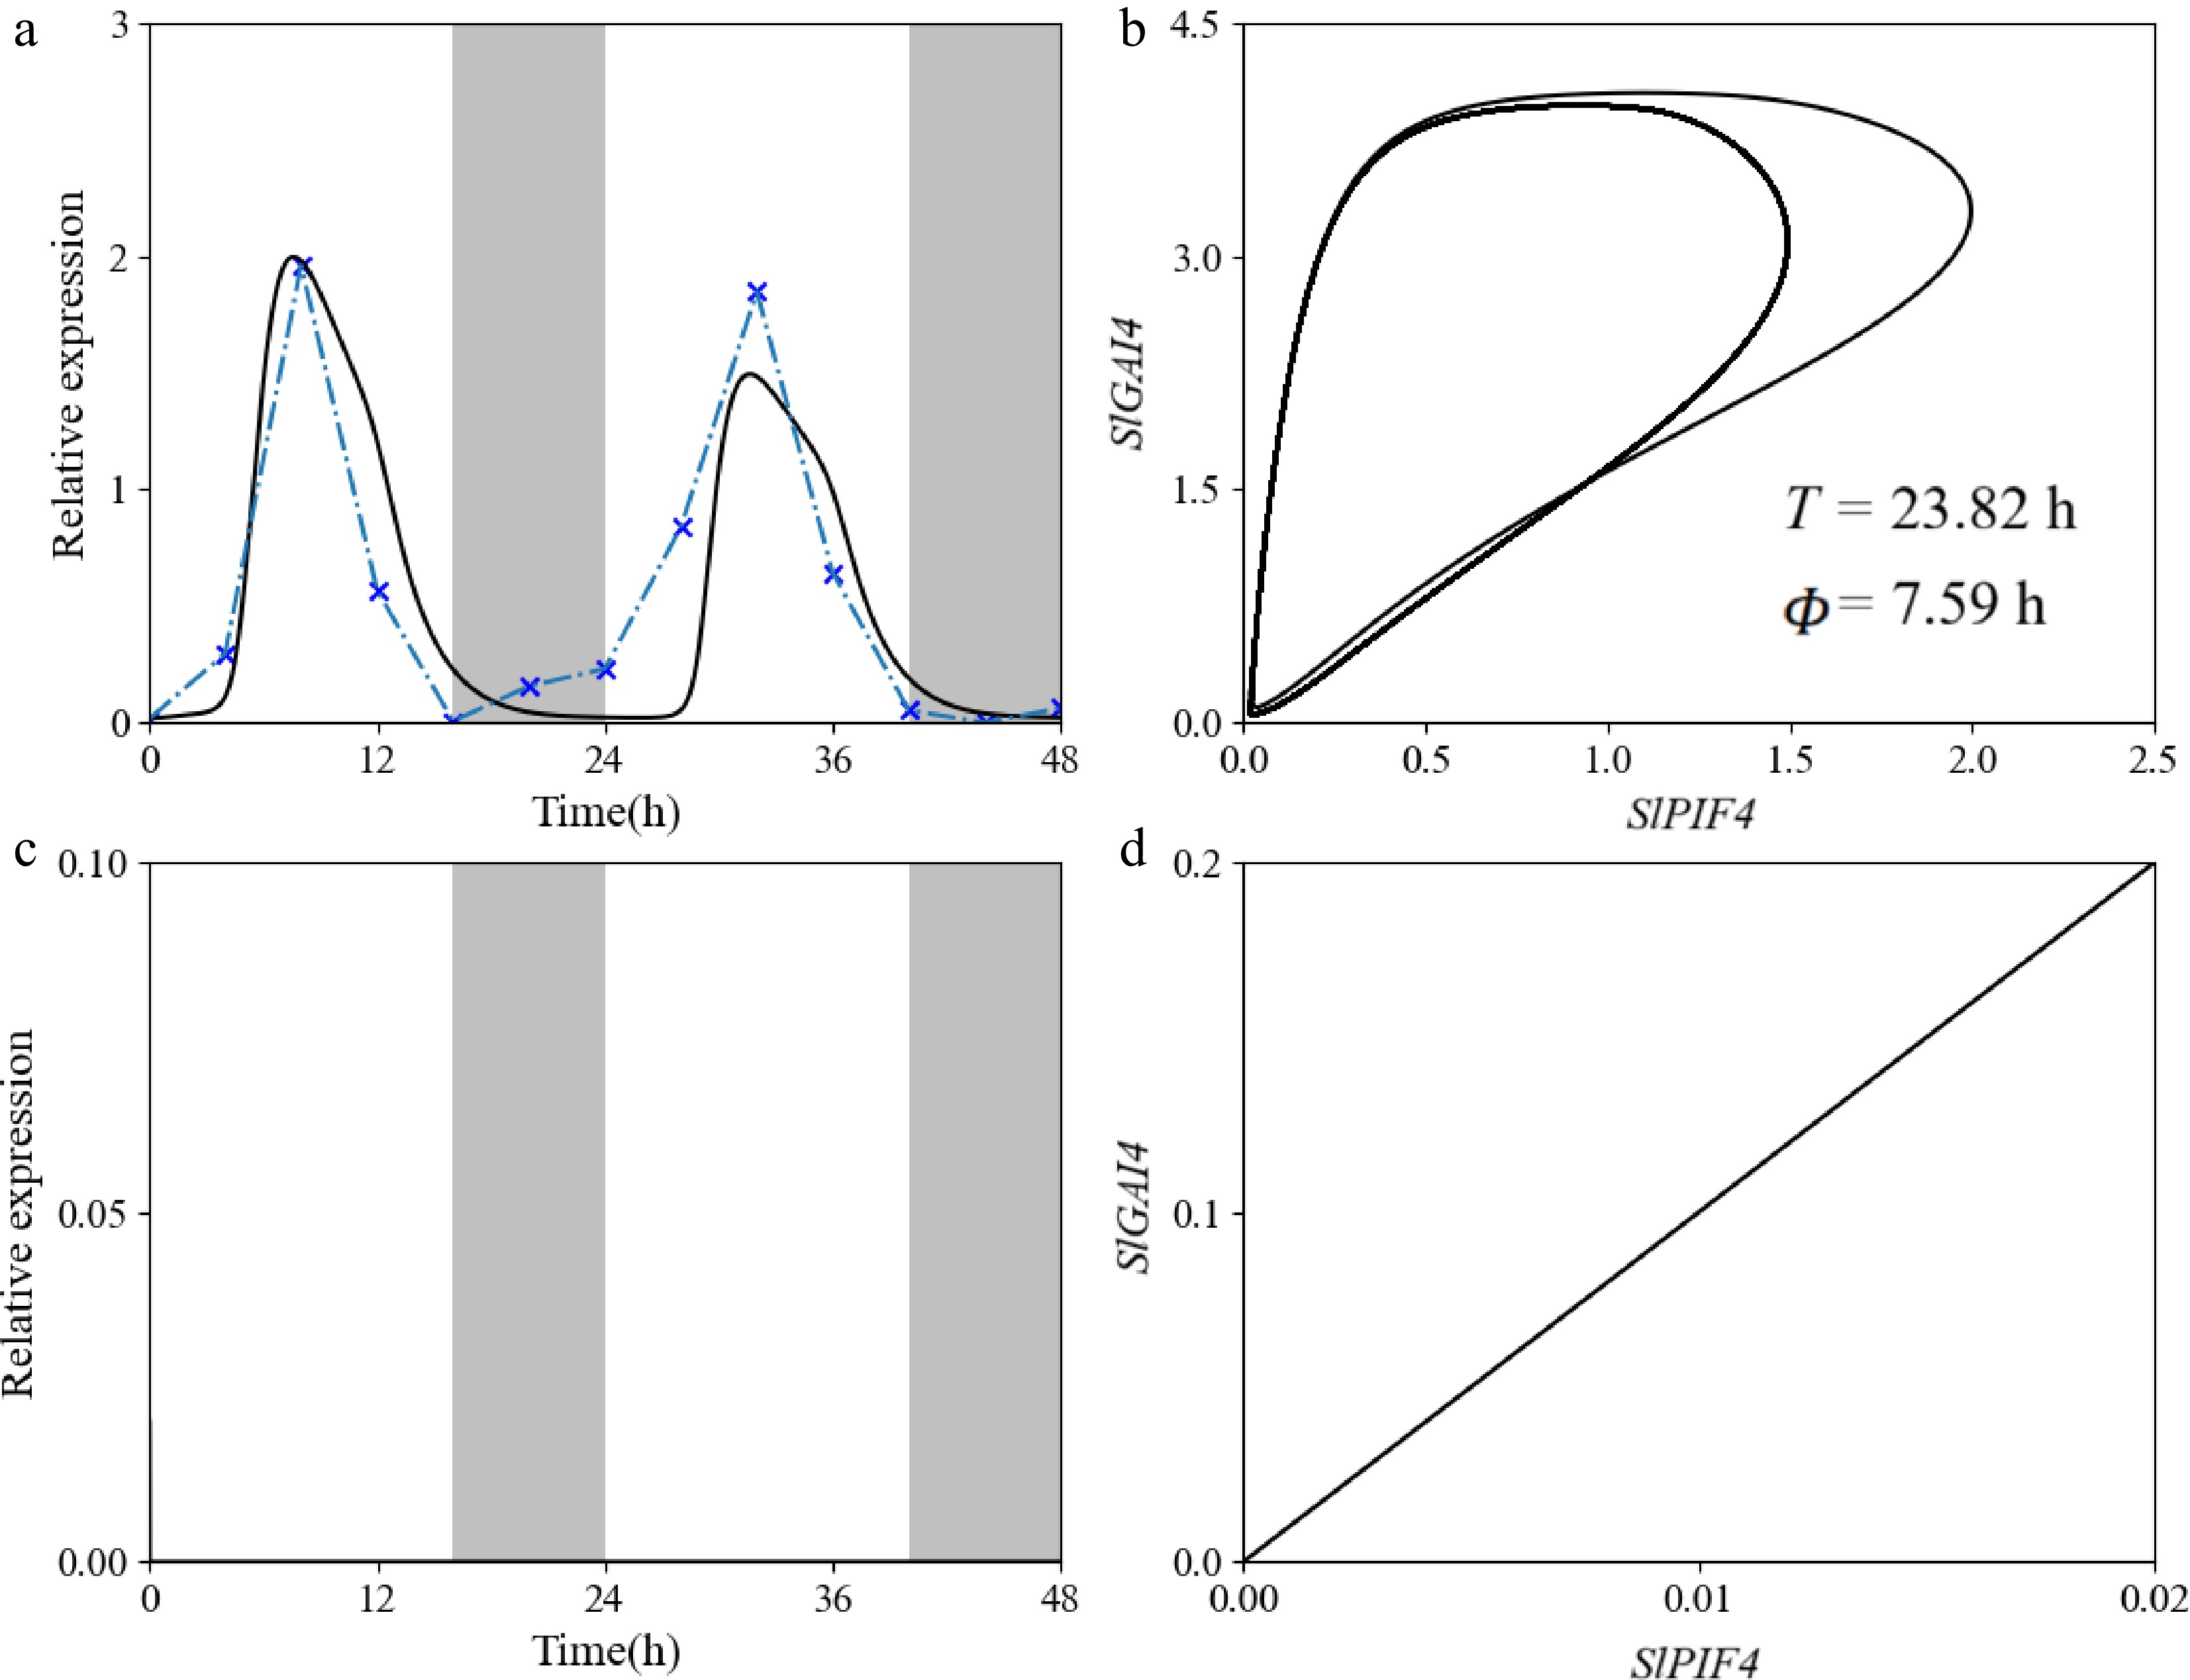
Figure 6.
The PIF4–GAI4 negative feedback loop regulates the oscillation of SlPIF4's expression. (a) Gray and white backgrounds denote dark (12 h) and light (12 h) periods, respectively. Blue dotted line with asterisks: Experimental relative expression of PIF4; black solid line: model simulation. (b) The closed orbit reflects a stable limit cycle generated by negative feedback between PIF4 mRNA and GAI4 protein, with a period of 23.82 h and a phase lag of 7.59 h. (c) When the negative feedback interaction is removed, the expression of PIF4 loses rhythmicity and remains near the baseline, failing to respond to light–dark transitions. (d) The system shifts from a closed orbit to a monotonically increasing linear path, indicating a transition from oscillatory to steady-state dynamics.
-
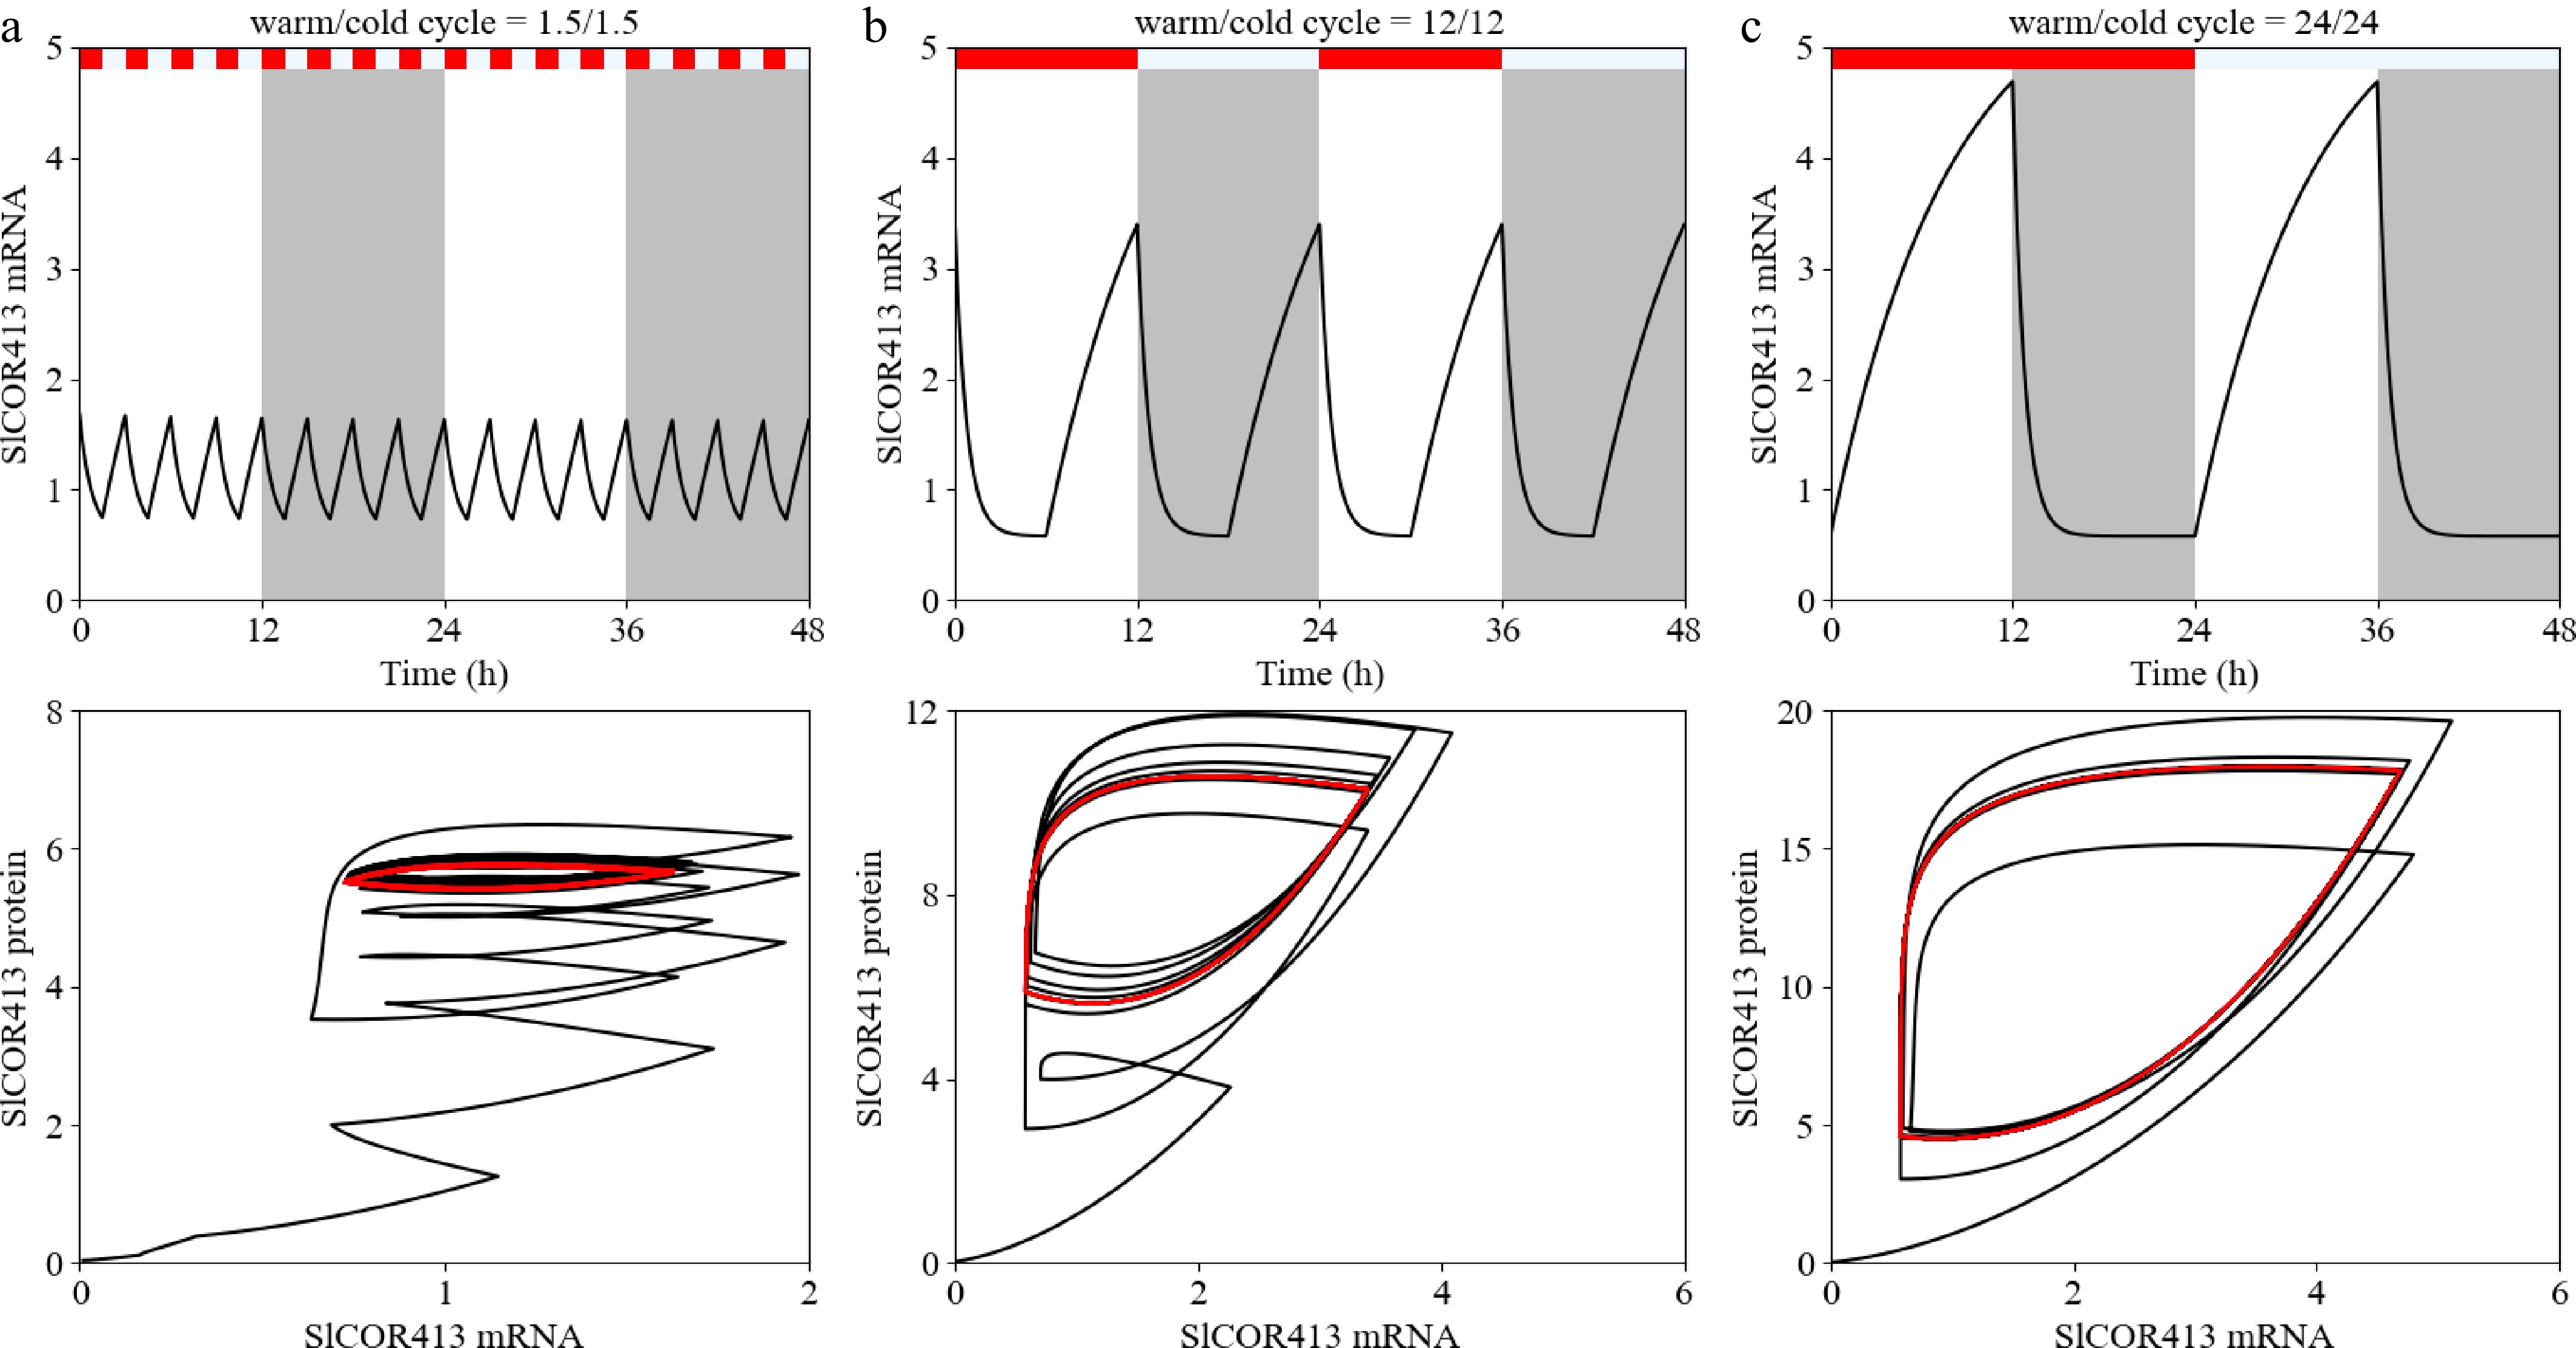
Figure 7.
Cold-induced oscillation of SlCOR413 in tomato plants. In order to investigate the oscillation of cold-related genes induced by low temperature, the dynamic behavior of plants subjectively simulated under continuous low temperature after five rounds of different cooling and warming cycles (warm:cold = 1.5:1.5 in Panel a; warm:cold = 12:12 in Panel b; warm:cold = 24:24 in Panel c).
Figures
(7)
Tables
(0)