-
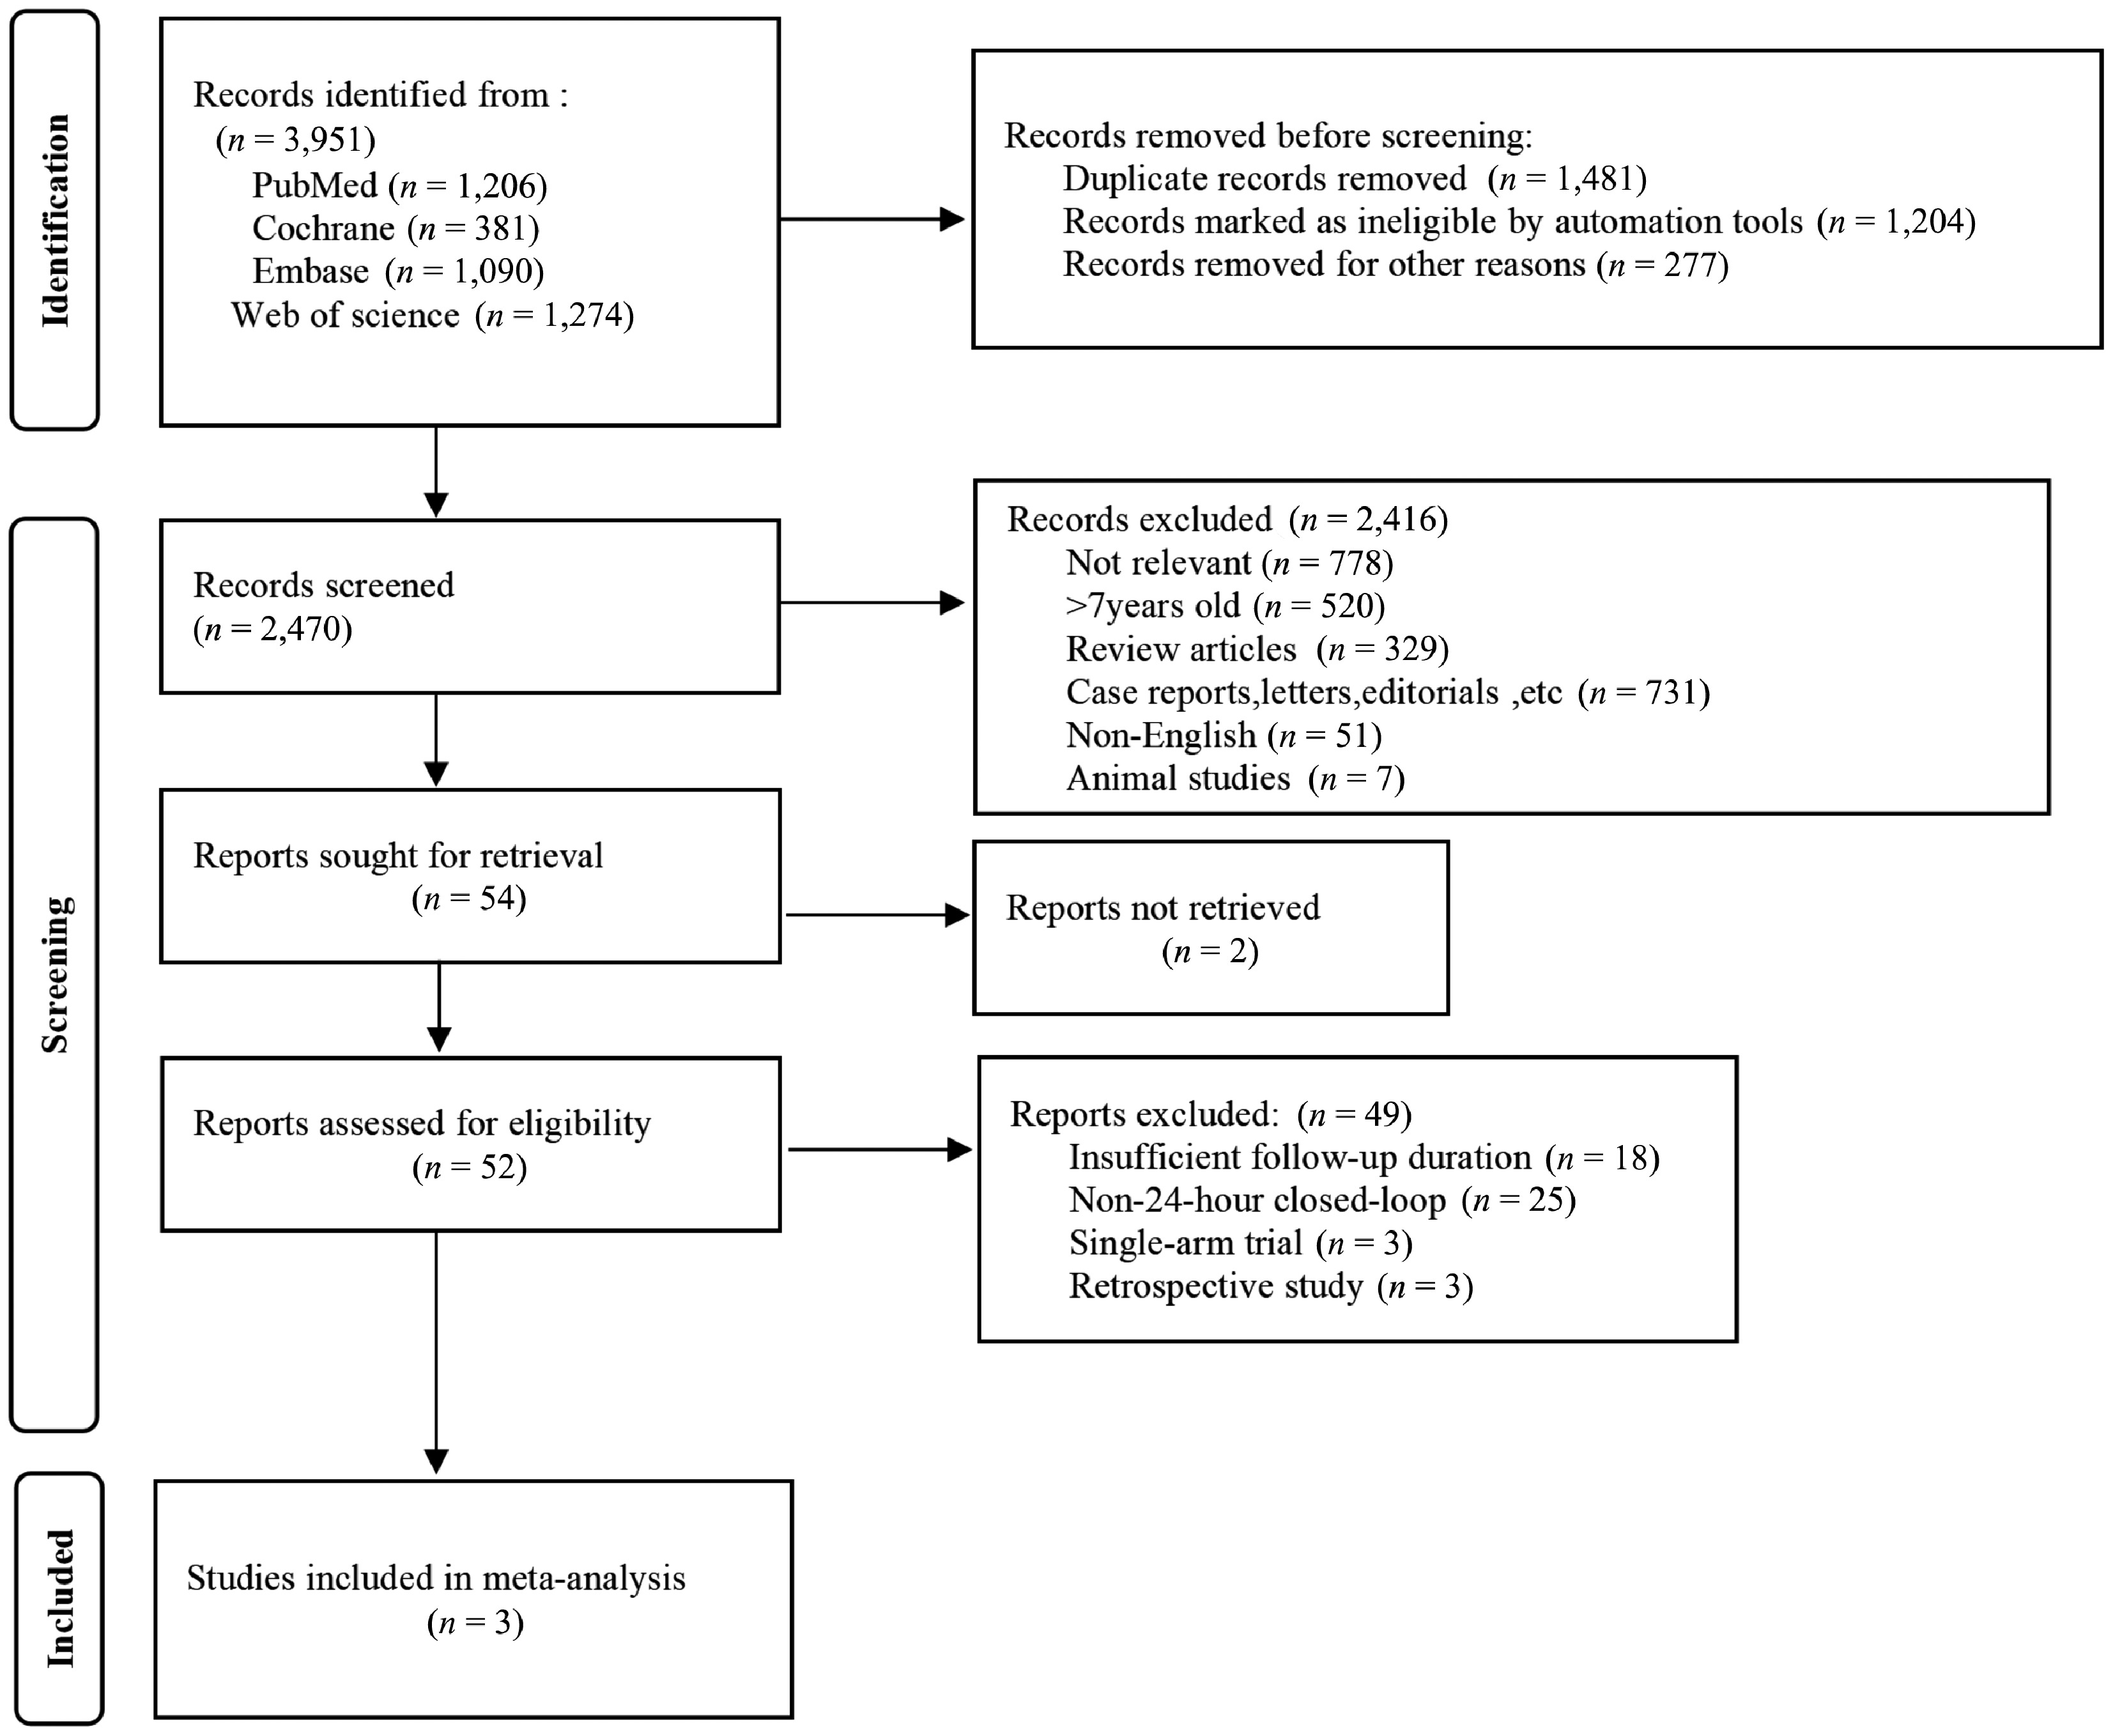
Figure 1.
PRISMA flowchart for study selection.
-
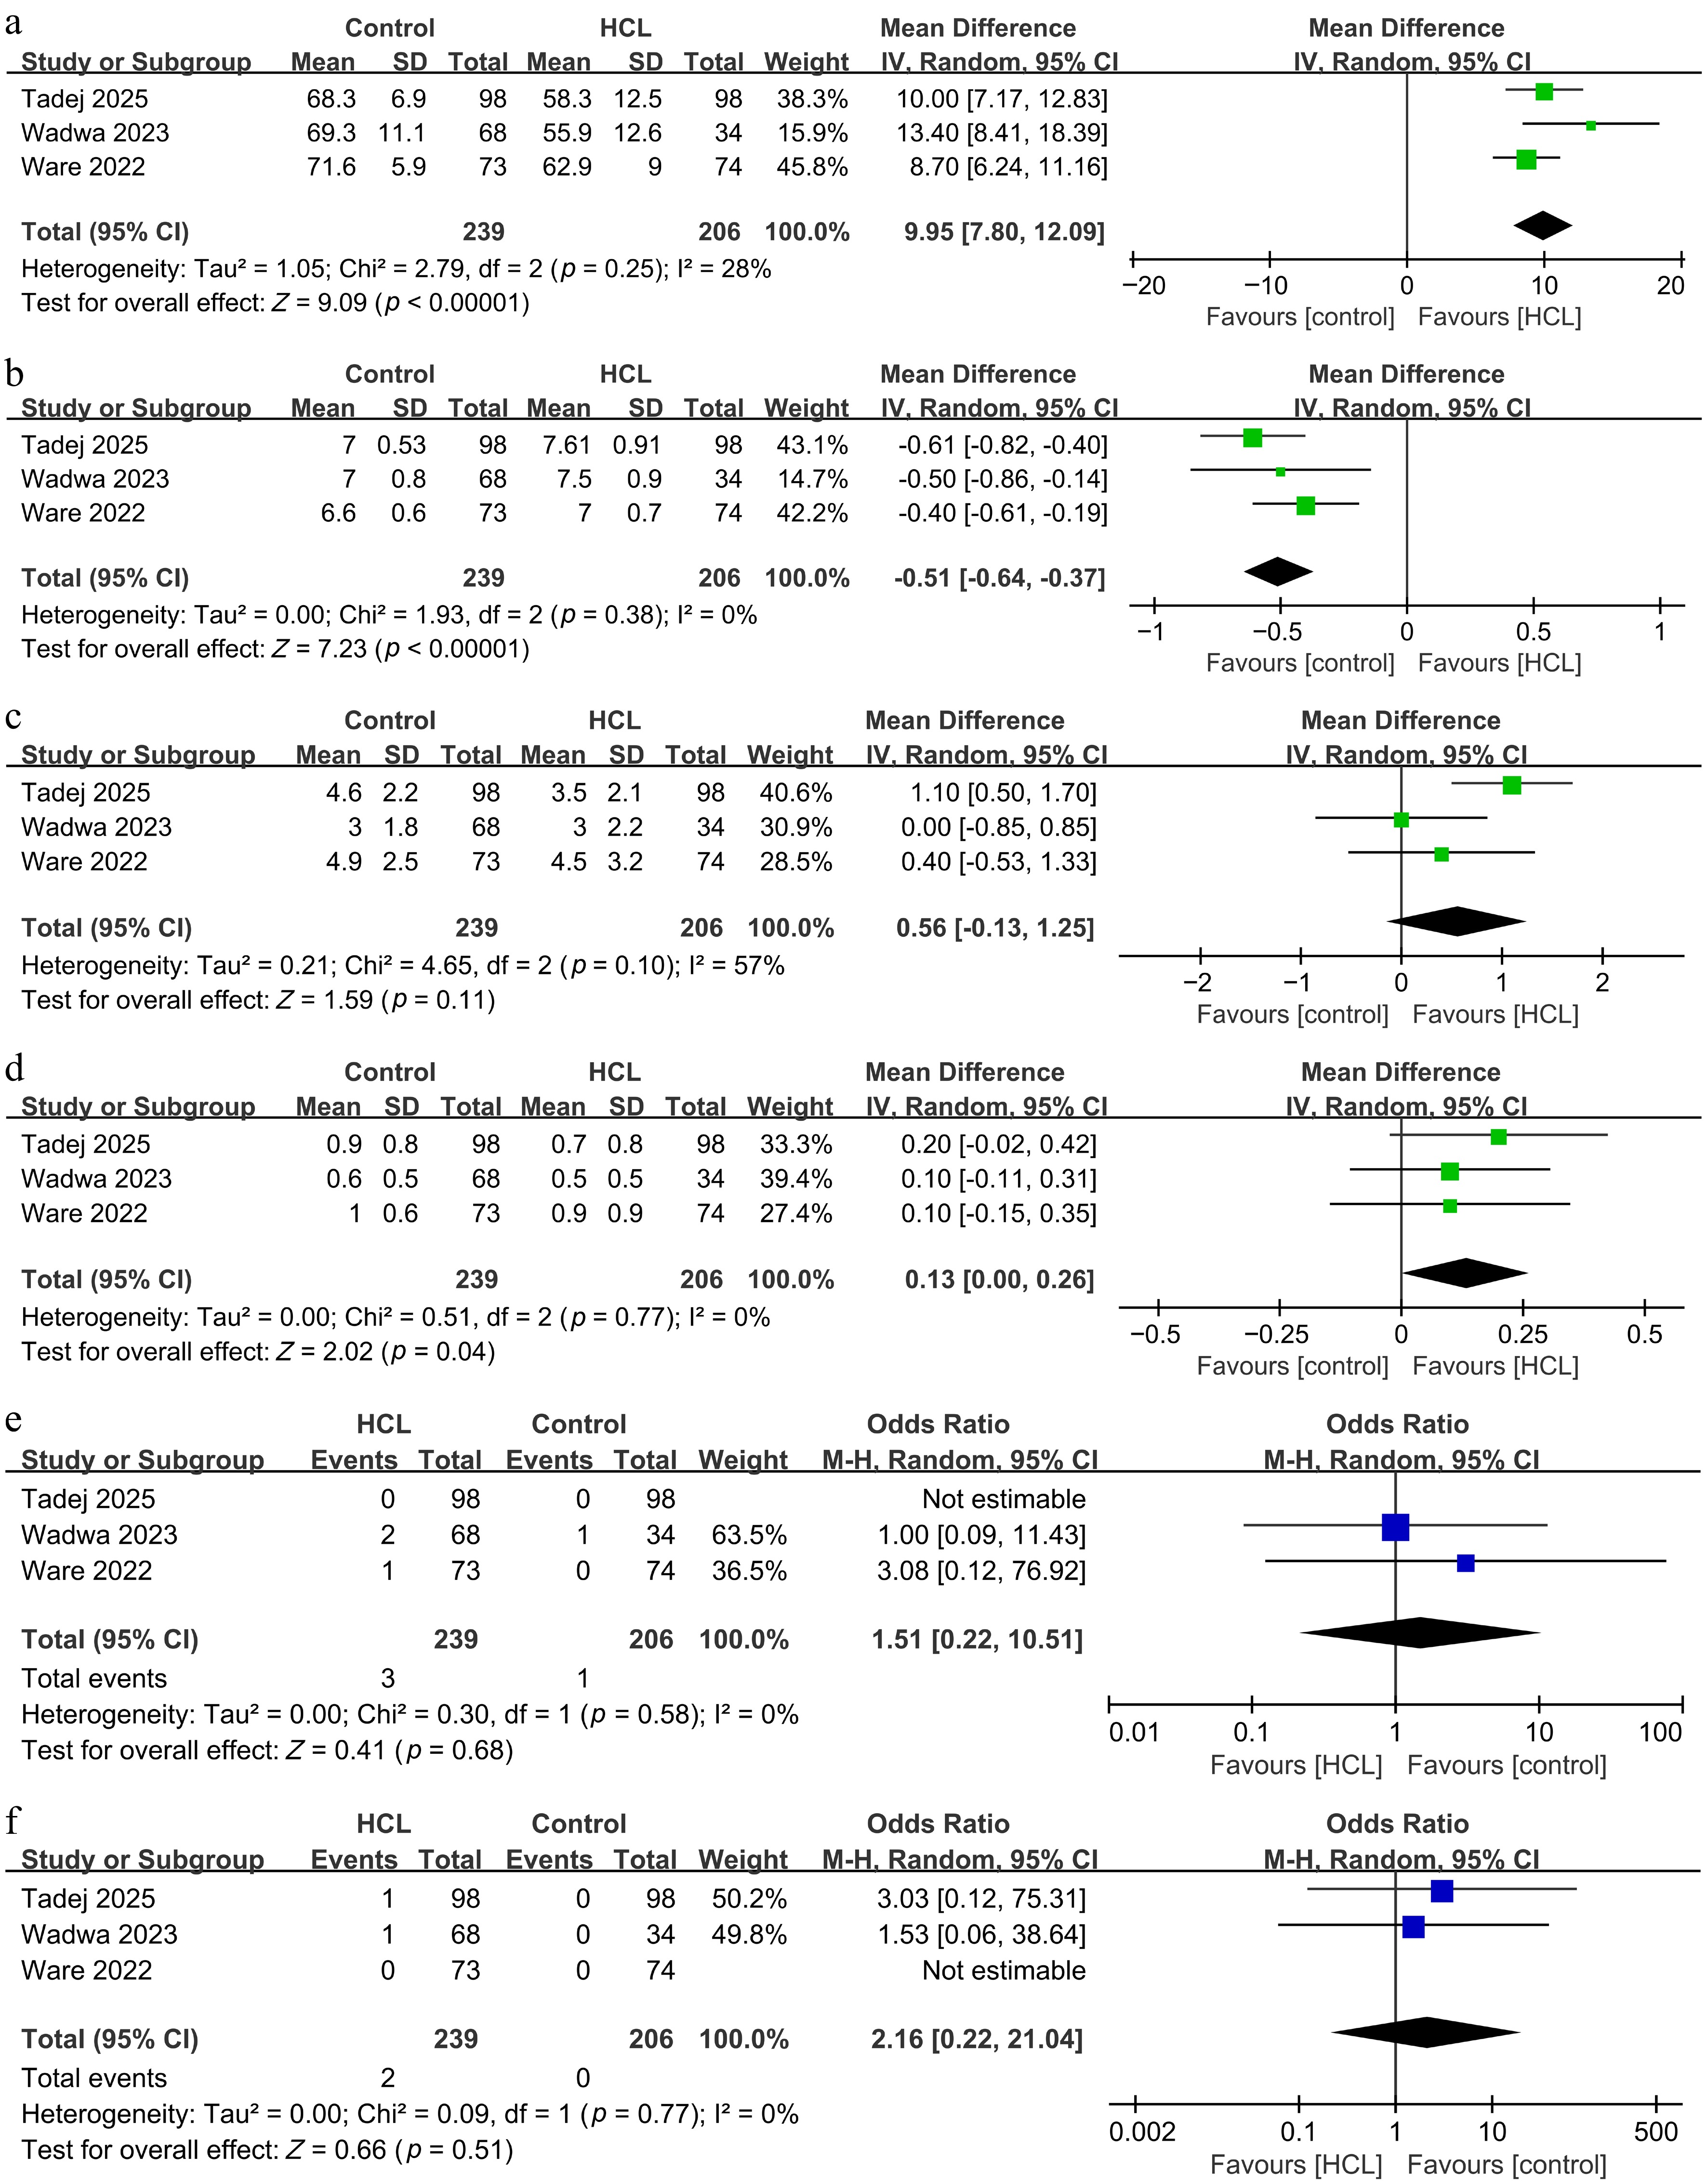
Figure 2.
Forest plots of glycemic outcomes and serious adverse events. (a) TIR. (b) HbA1c. (c) Percentage of time with sensor glucose < 70 mg/dL. (d) Percentage of time with sensor glucose < 54 mg/dL. (e) Severe hypoglycemia. (f) DKA.
-
Study Journal Study
designNumber of patients Age, years (mean ± SD) Females,
n (%)Prior
therapyType of HCL Control group treatment Baseline HbA1c (%)
mean ± SDStudy
durationHCL Control Battelino et al.[22] Lancet Diabetes Endocrinol RCRT 98 4.7 ± 1.2 48 (49%) MDI: 21%, CSII: 8%, SAP: 70% MiniMed 780G system MM + SBL 7.5 ± 1.2 7.7 ± 0.9 Two 12-week periods Wadwa et al.[23] N Engl J Med RCT 102 3.9 ± 1.2 52 (51%) CSII: 65%, MDI: 35% Tandem control-IQ MDI or
CSII + CGM7.3 ± 0.7 7.4 ± 0.6 13-week Ware et al.[24] N Engl J Med RCRT 74 5.6 ± 1.6 31 (42%) CSII CamAPS FX MM + SAP 7.50 ± 0.91 7.56 ± 1.01 Two 16-week periods RCRT, randomized crossover trial; SBL, sensor-based low glucose suspension; AM, auto mode; MM, manual + SBL mode; SAP, sensor-augmented pump. Table 1.
Basic characteristics of the studies.
-
Study Sensor glucose HCL group Control group Difference (95%CI) p-value Battelino et al.[22] > 180 mg/dL 27.1 ± 6.4 38.1 ± 13 NA NA > 250 mg/dL 7.7 ± 4.6 13.1 ± 9.5 NA NA Wadwa et al.[23] > 250 mg/dL 8.4 ± 7.2 15.0 ± 10.9 −5.4 (−0.73 to −3.6) < 0.001 Ware et al.[24] > 180 mg/dL 22.9 (19.3–27.3) 31.7 (23.4–40.1) −8.5 (−9.9 to −7.1) < 0.001 > 300 mg/dL 2 (1.2–3.1) 3.1 (1.3–5.7) −1.0 (−1.6 to −0.6) NA Data are presented as the mean ± standard deviation or median (95% CI); between-group differences, 95% CIs, and p-values were obtained from the original studies. Table 2.
Percentage of time with hyperglycemia.
-
Certainty assessment No. of patients Effect Certainty Importance Outcome No. of
studiesStudy
designRisk of bias Inconsistency Indirectness Imprecision Other considerations HCL Conventional therapy Relative
(95% CI)Absolute
(95% CI)Time in range (sensor glucose 70–180 mg/dL, TIR) 3 RCT Not serious Not serious Not serious Seriousa None 239 206 – MD 9.95 higher (7.80–12.09 higher) ⊕⊕⊕○
ModerateaCritical Glycated hemoglobin (HbA1c) 3 RCT Not serious Not serious Not serious Seriousa None 239 206 – MD 0.51 lower (0.64–0.37 lower) ⊕⊕⊕○
ModerateaCritical Percentage of time with sensor glucose < 70 mg/dL 3 RCT Not serious Seriousb Not serious seriousa None 239 206 – MD 0.56 higher (0.13 lower to 1.25 higher) ⊕⊕○○
Lowa,bImportant Percentage of time with sensor glucose < 54 mg/dL 3 RCT Not serious Not serious Not serious Seriousa None 239 206 – MD 0.13 higher (0.00–0.26 higher) ⊕⊕⊕○
ModerateaImportant Diabetic ketoacidosis 3 RCT Not serious Not serious Not serious Seriousc none 239 (2 events) 206 (0 events) OR 2.16 (0.22–21.04) 0.8% in HCL vs 0.0% in control ⊕⊕⊕○
ModeratecCritical Severe hypoglycemia 3 RCT Not serious Not serious Not serious Seriousc None 239 (3 events) 206 (1 event) OR 1.51 (0.22–10.51) 7.6 more per 1,000 (from 4 fewer to 44 more) ⊕⊕⊕○
ModeratecCritical CI: confidence interval; MD: mean difference; OR: odds ratio; HCL: hybrid closed-loop; TIR: time in range; RCT: randomized controlled trial. a. A small number of included studies (3 RCTs) and limited total sample size. b. I2 = 57%. c. Low event rate and wide confidence intervals, causing imprecision. Table 3.
Summary of the findings (GRADE)
Figures
(2)
Tables
(3)