-
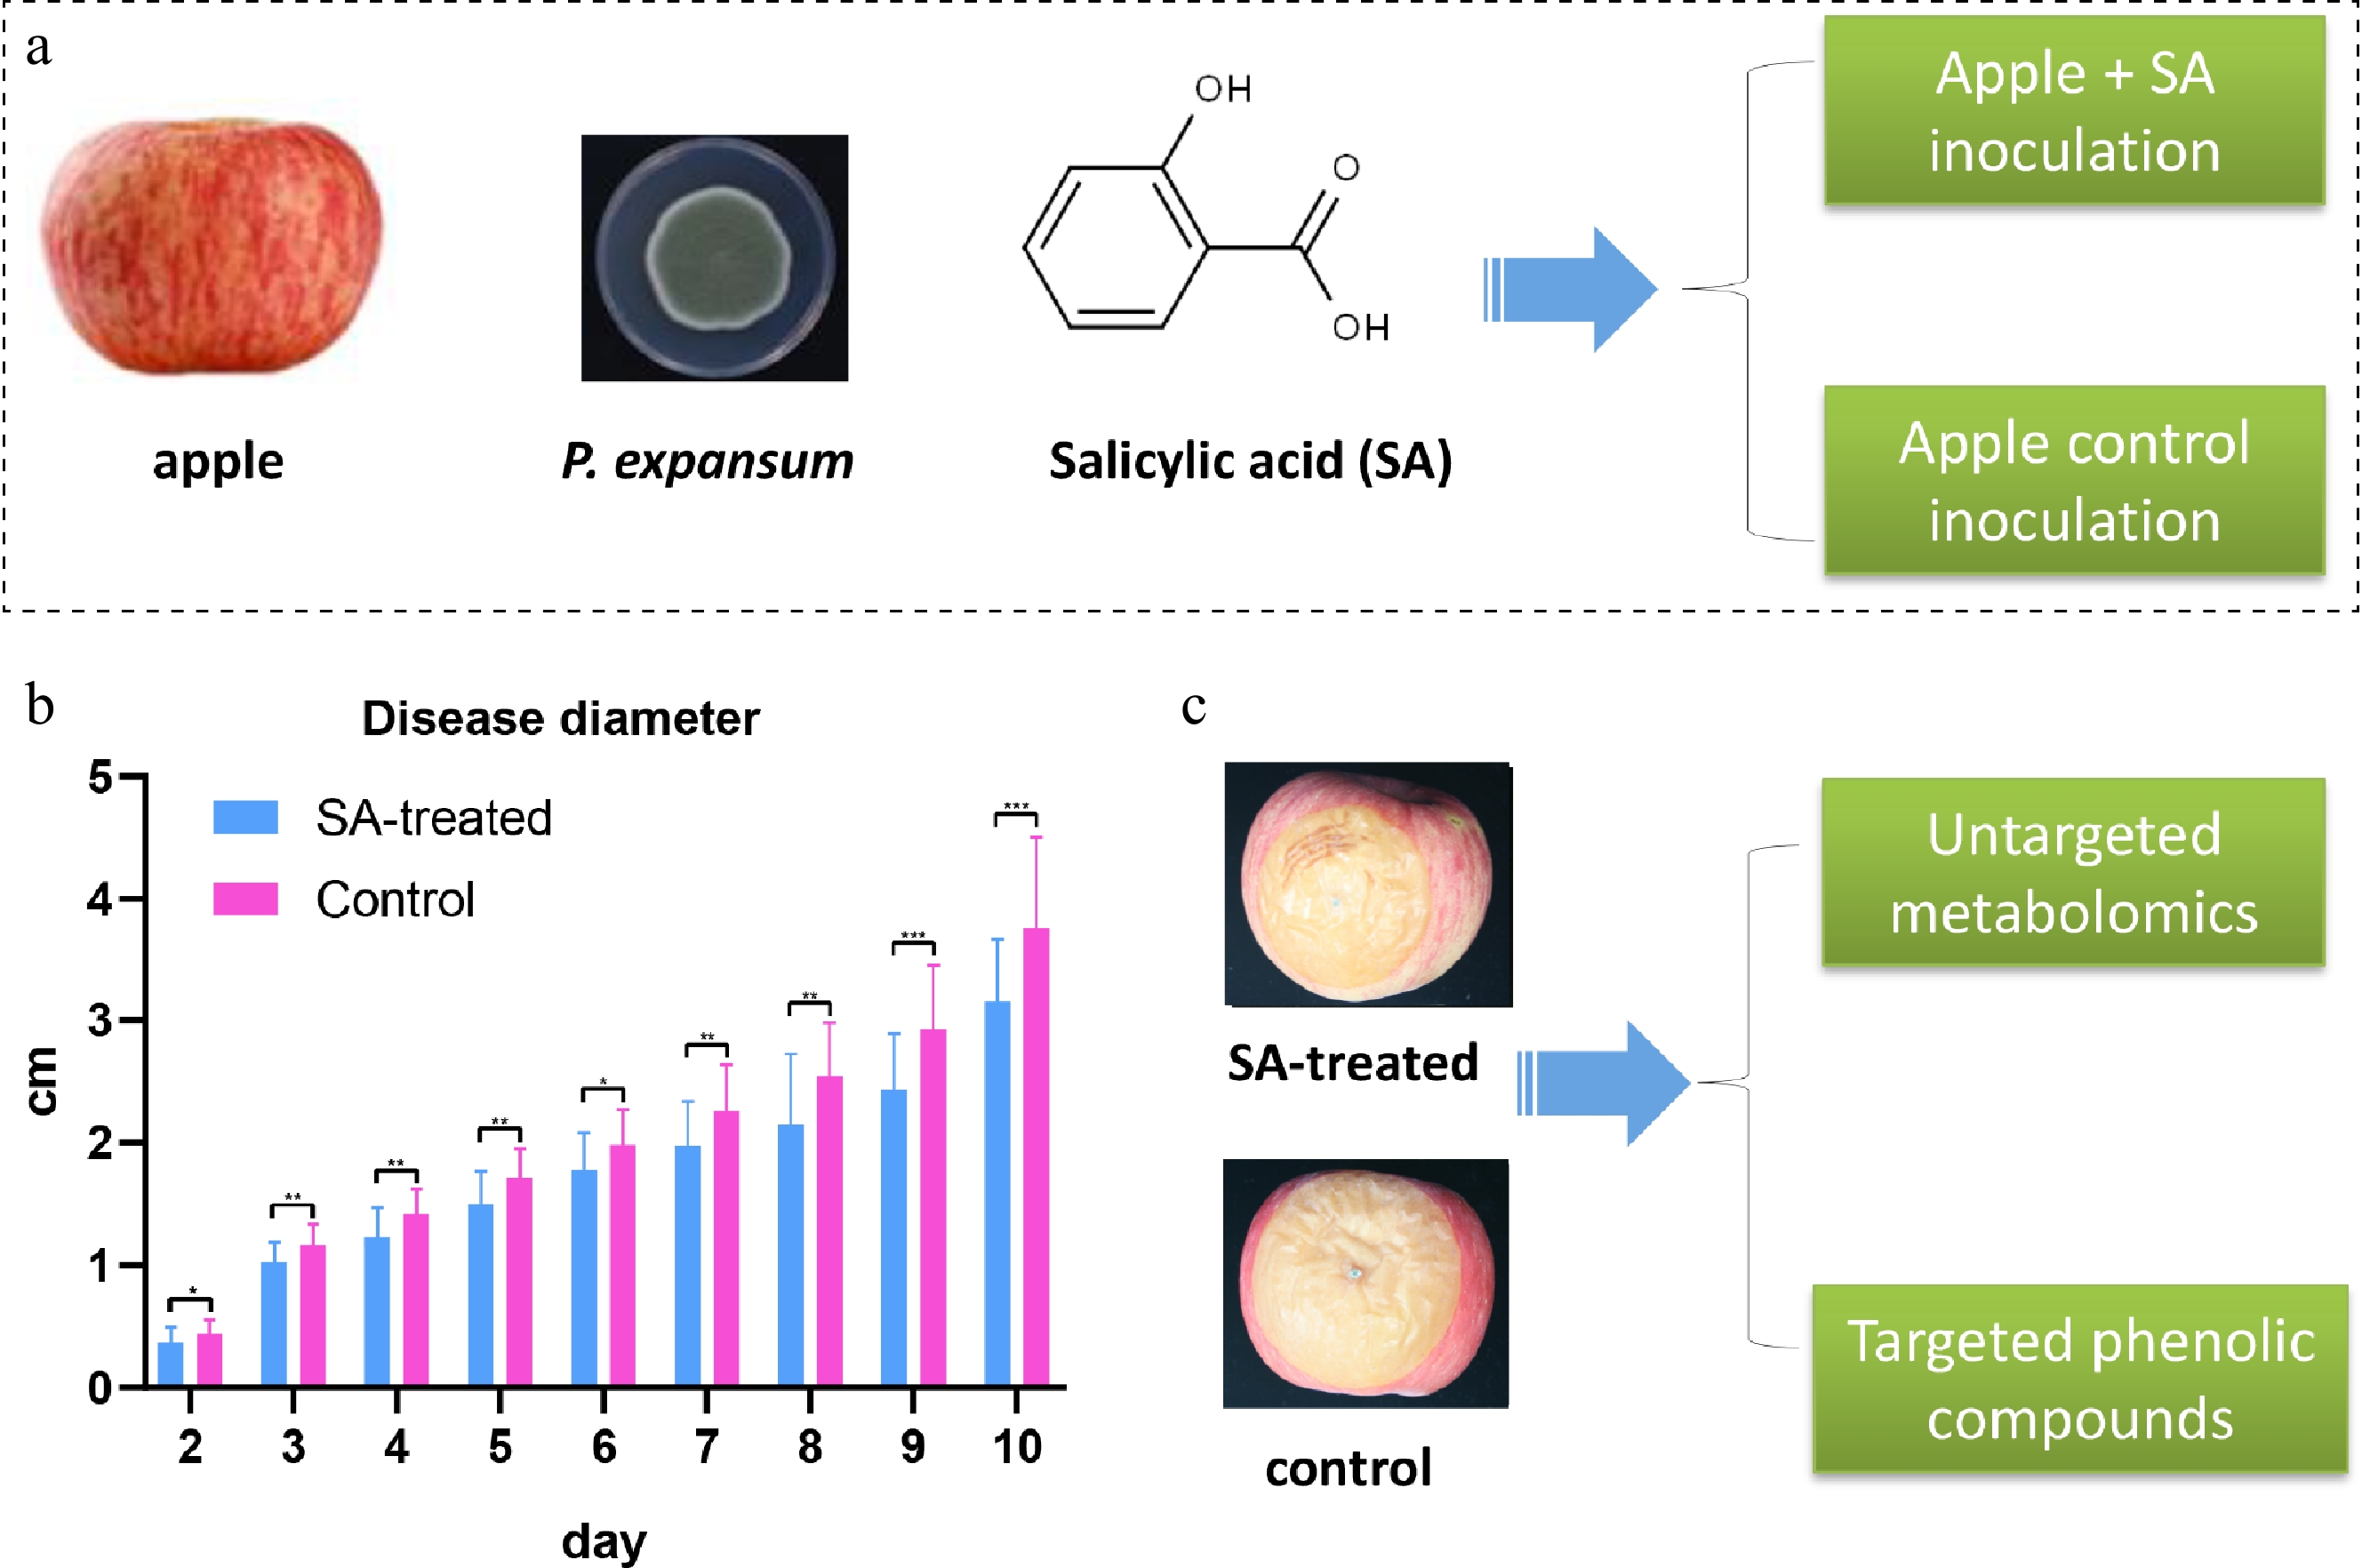
Figure 1.
Experimental workflow illustrating apple sample groupings, salicylic acid (SA) treatment, pathogen inoculation, disease assessment, and metabolomic analysis. (a) Schematic illustration of the SA treatment (pre-treated with 5 mmol/L SA followed by inoculation) and the control. (b) Statistical comparison of lesion diameters between the control and SA-treated groups (* p < 0.05, ** p < 0.01, *** p < 0.001). (c) Both control and SA-treated fruits were subjected to untargeted metabolomic analysis. Key differential metabolites were subsequently validated via targeted metabolomics using an expanded sample set.
-
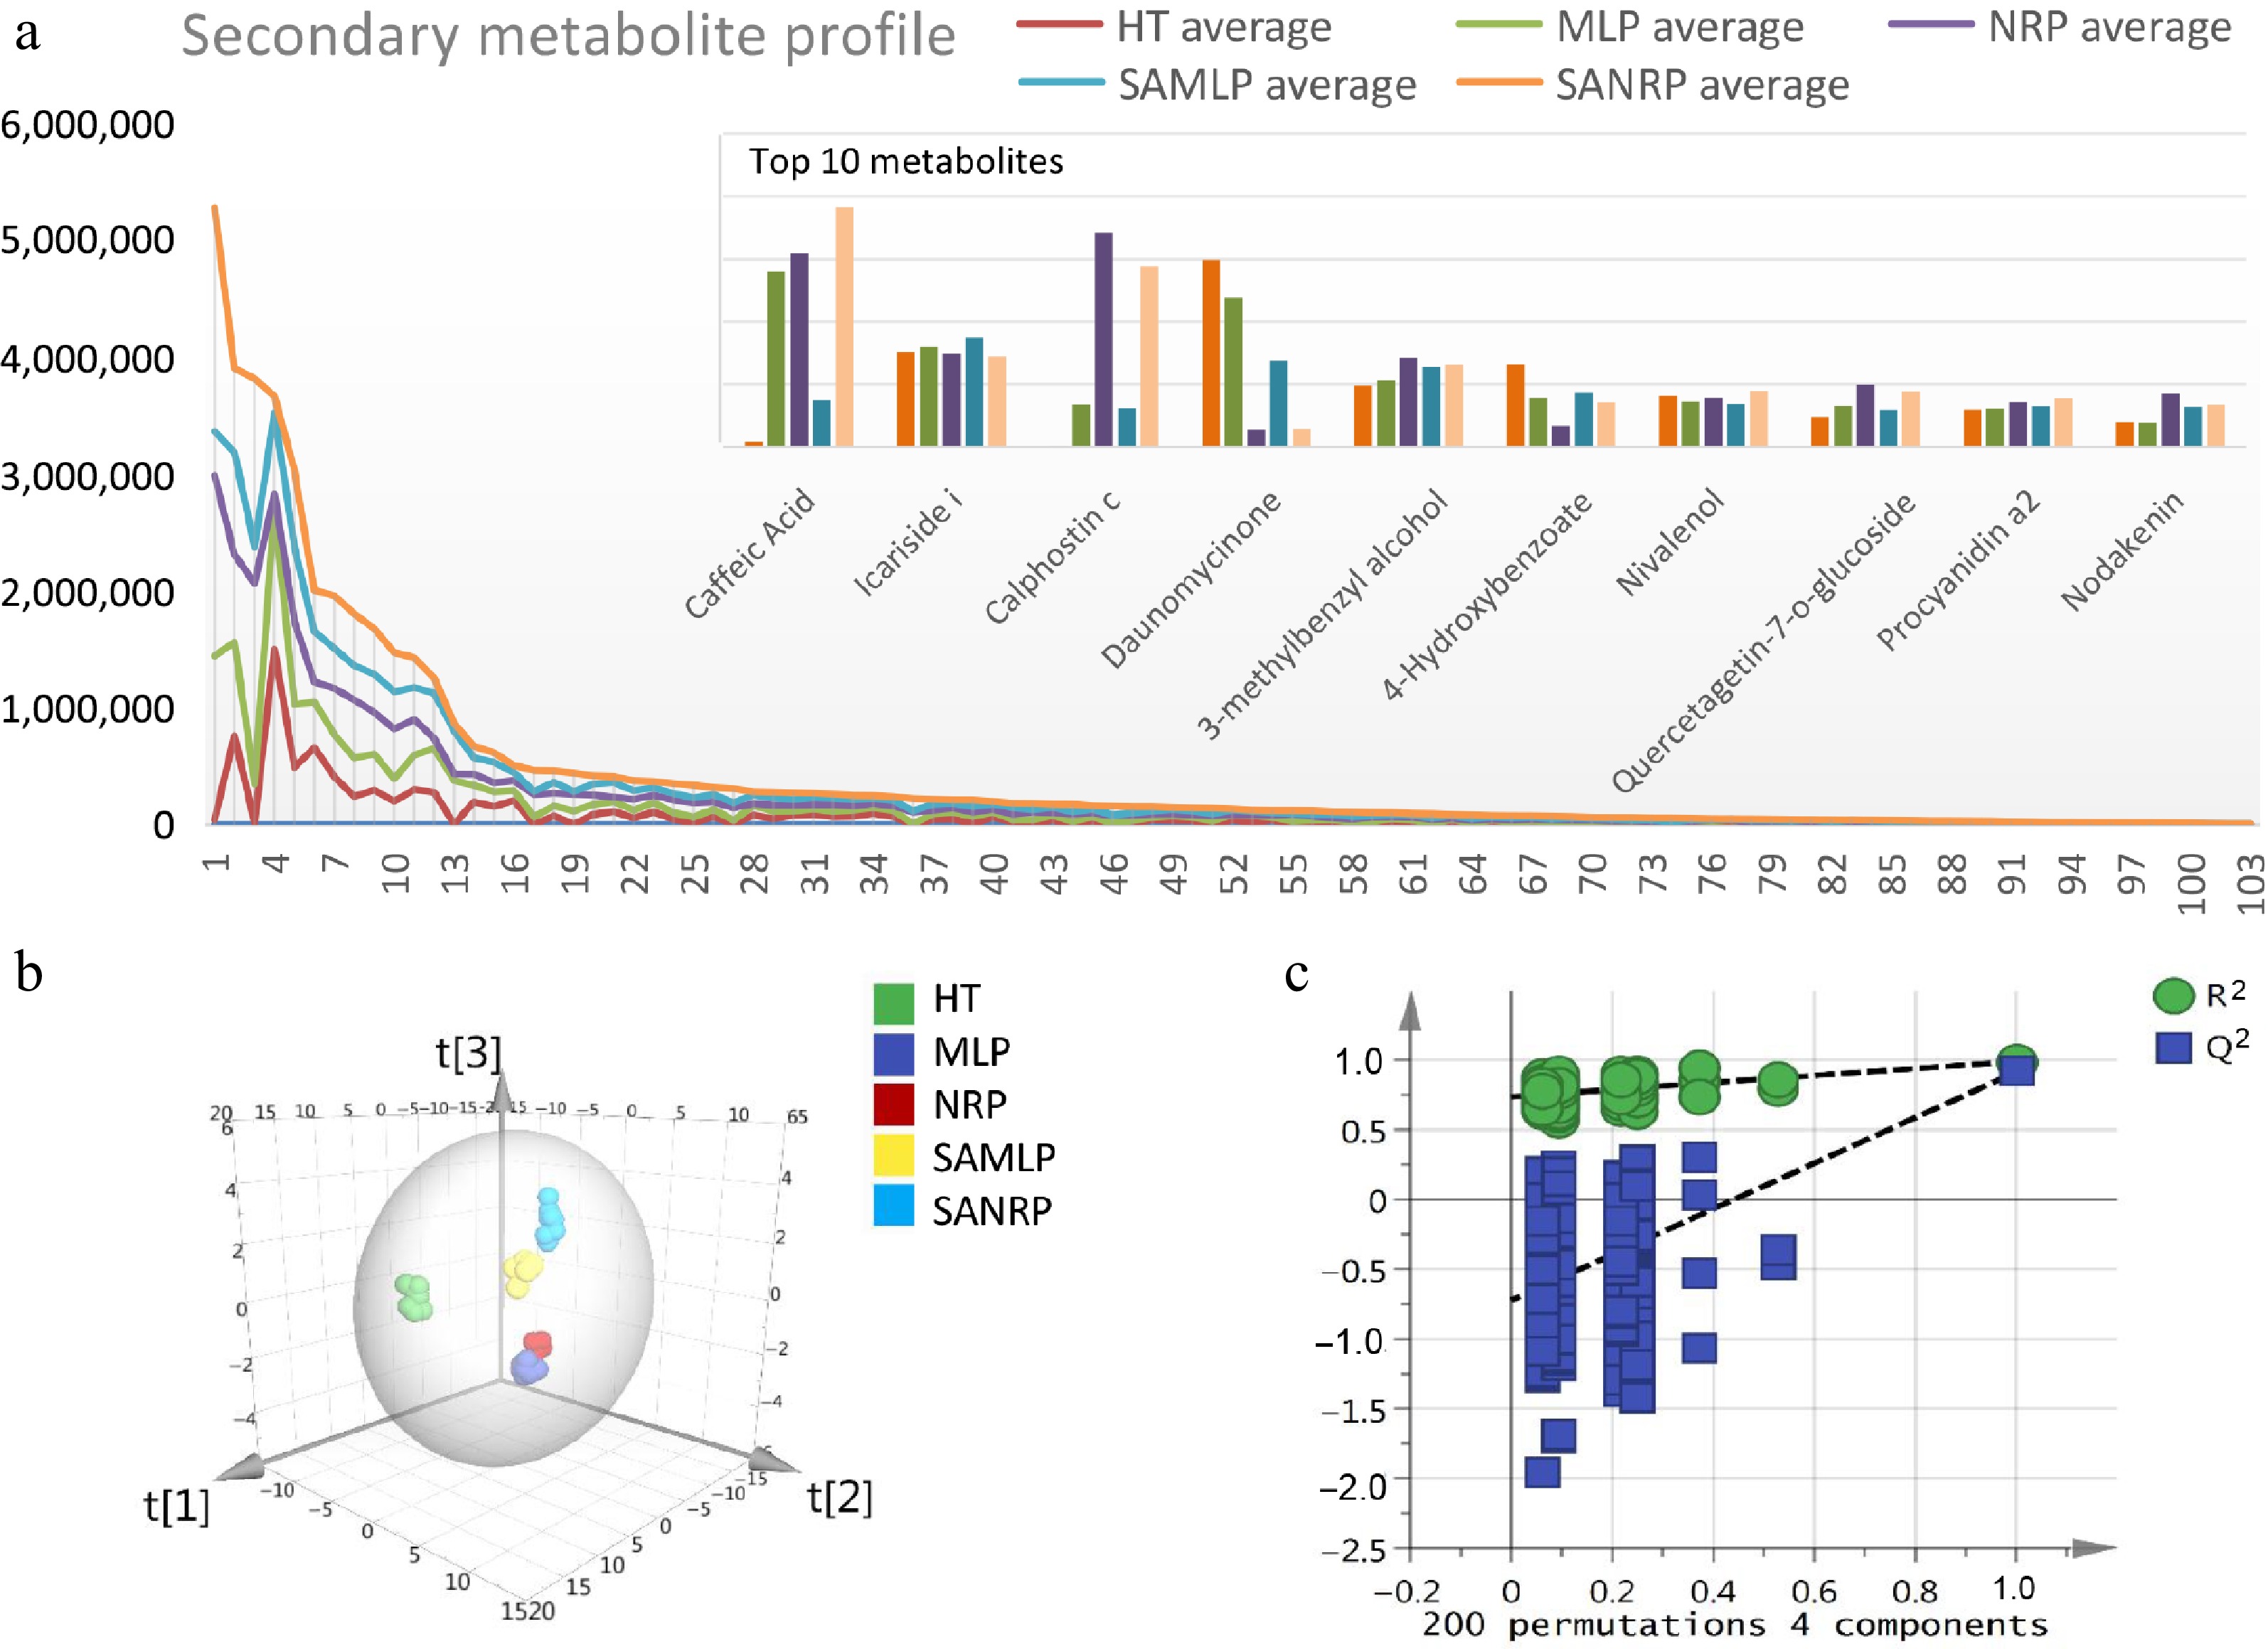
Figure 2.
Analysis of secondary metabolite profiles in apple fruit during P. expansum infection using OPLS-DA. (a) Secondary metabolite profiles in different tissue groups: Healthy tissue (HT), the lesion's margin (MLP), newly rotted tissue (NRP), and their SA-treated counterparts (SAMLP and SANRP). (b) Distinct group separation as visualized by the OPLS-DA model. (c) Permutation test validation plot confirming the robustness and reliability of the statistical model.
-
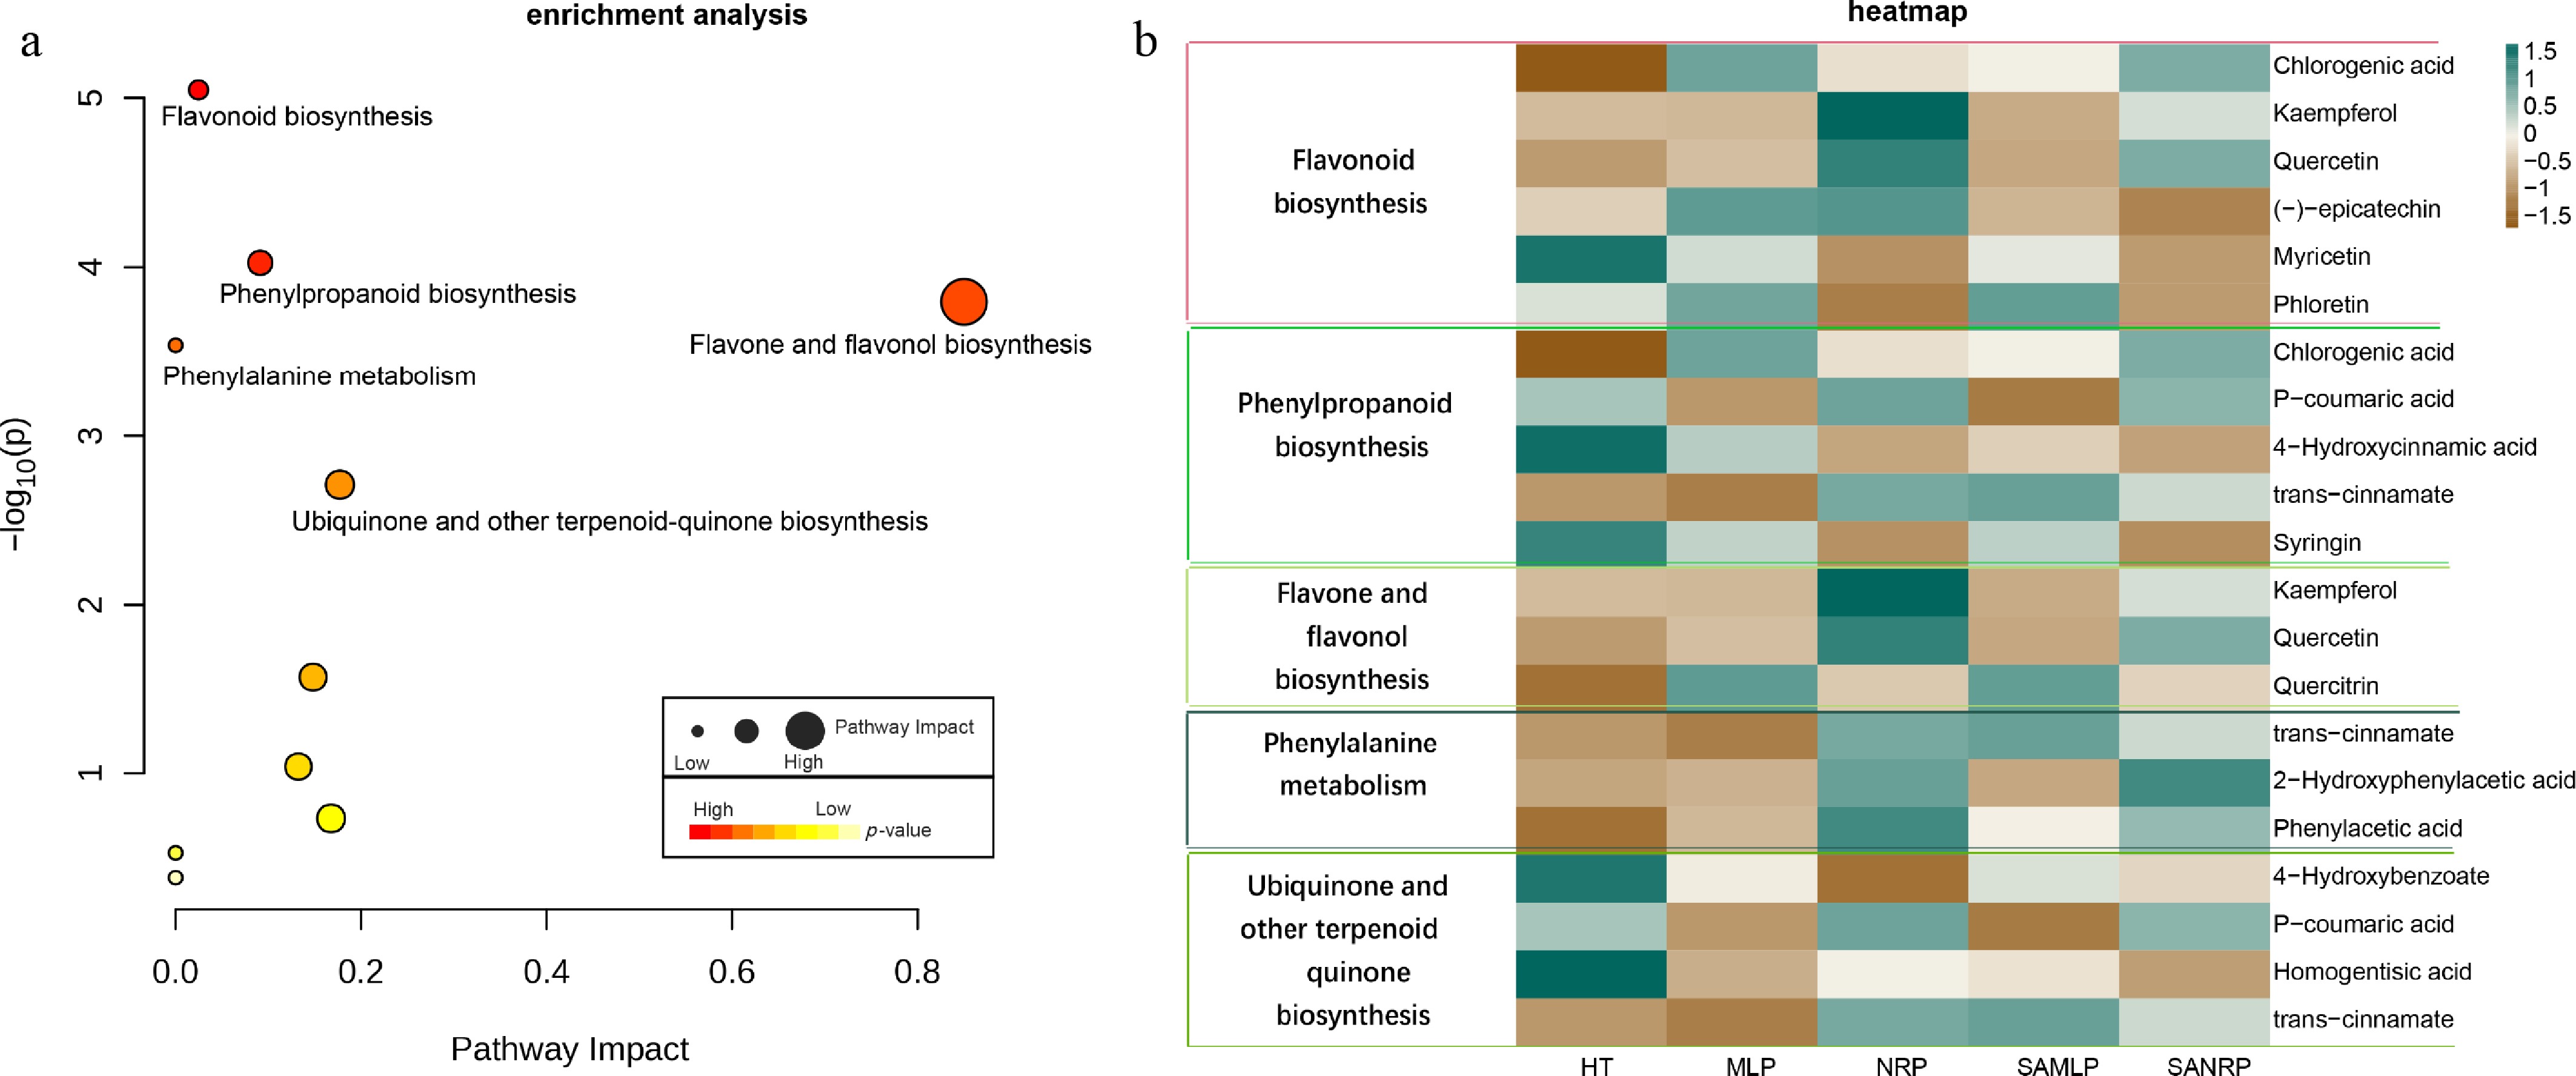
Figure 3.
KEGG pathway analysis of differential metabolites during P. expansum infection. (a) Enriched metabolic pathways. The color gradient from red to green indicates the level of significance [−log10 (p-adjust), with red representing higher significance], and the size of the dots represents the number of annotated metabolites. (b) Heatmap showing the relative abundance profiles of key differential metabolites across sample groups (HT, MLP, NRP, SAMLP, SANRP). Metabolite names are listed on the right. The color scale from blue to red represents the normalized abundance (Z-score).
-
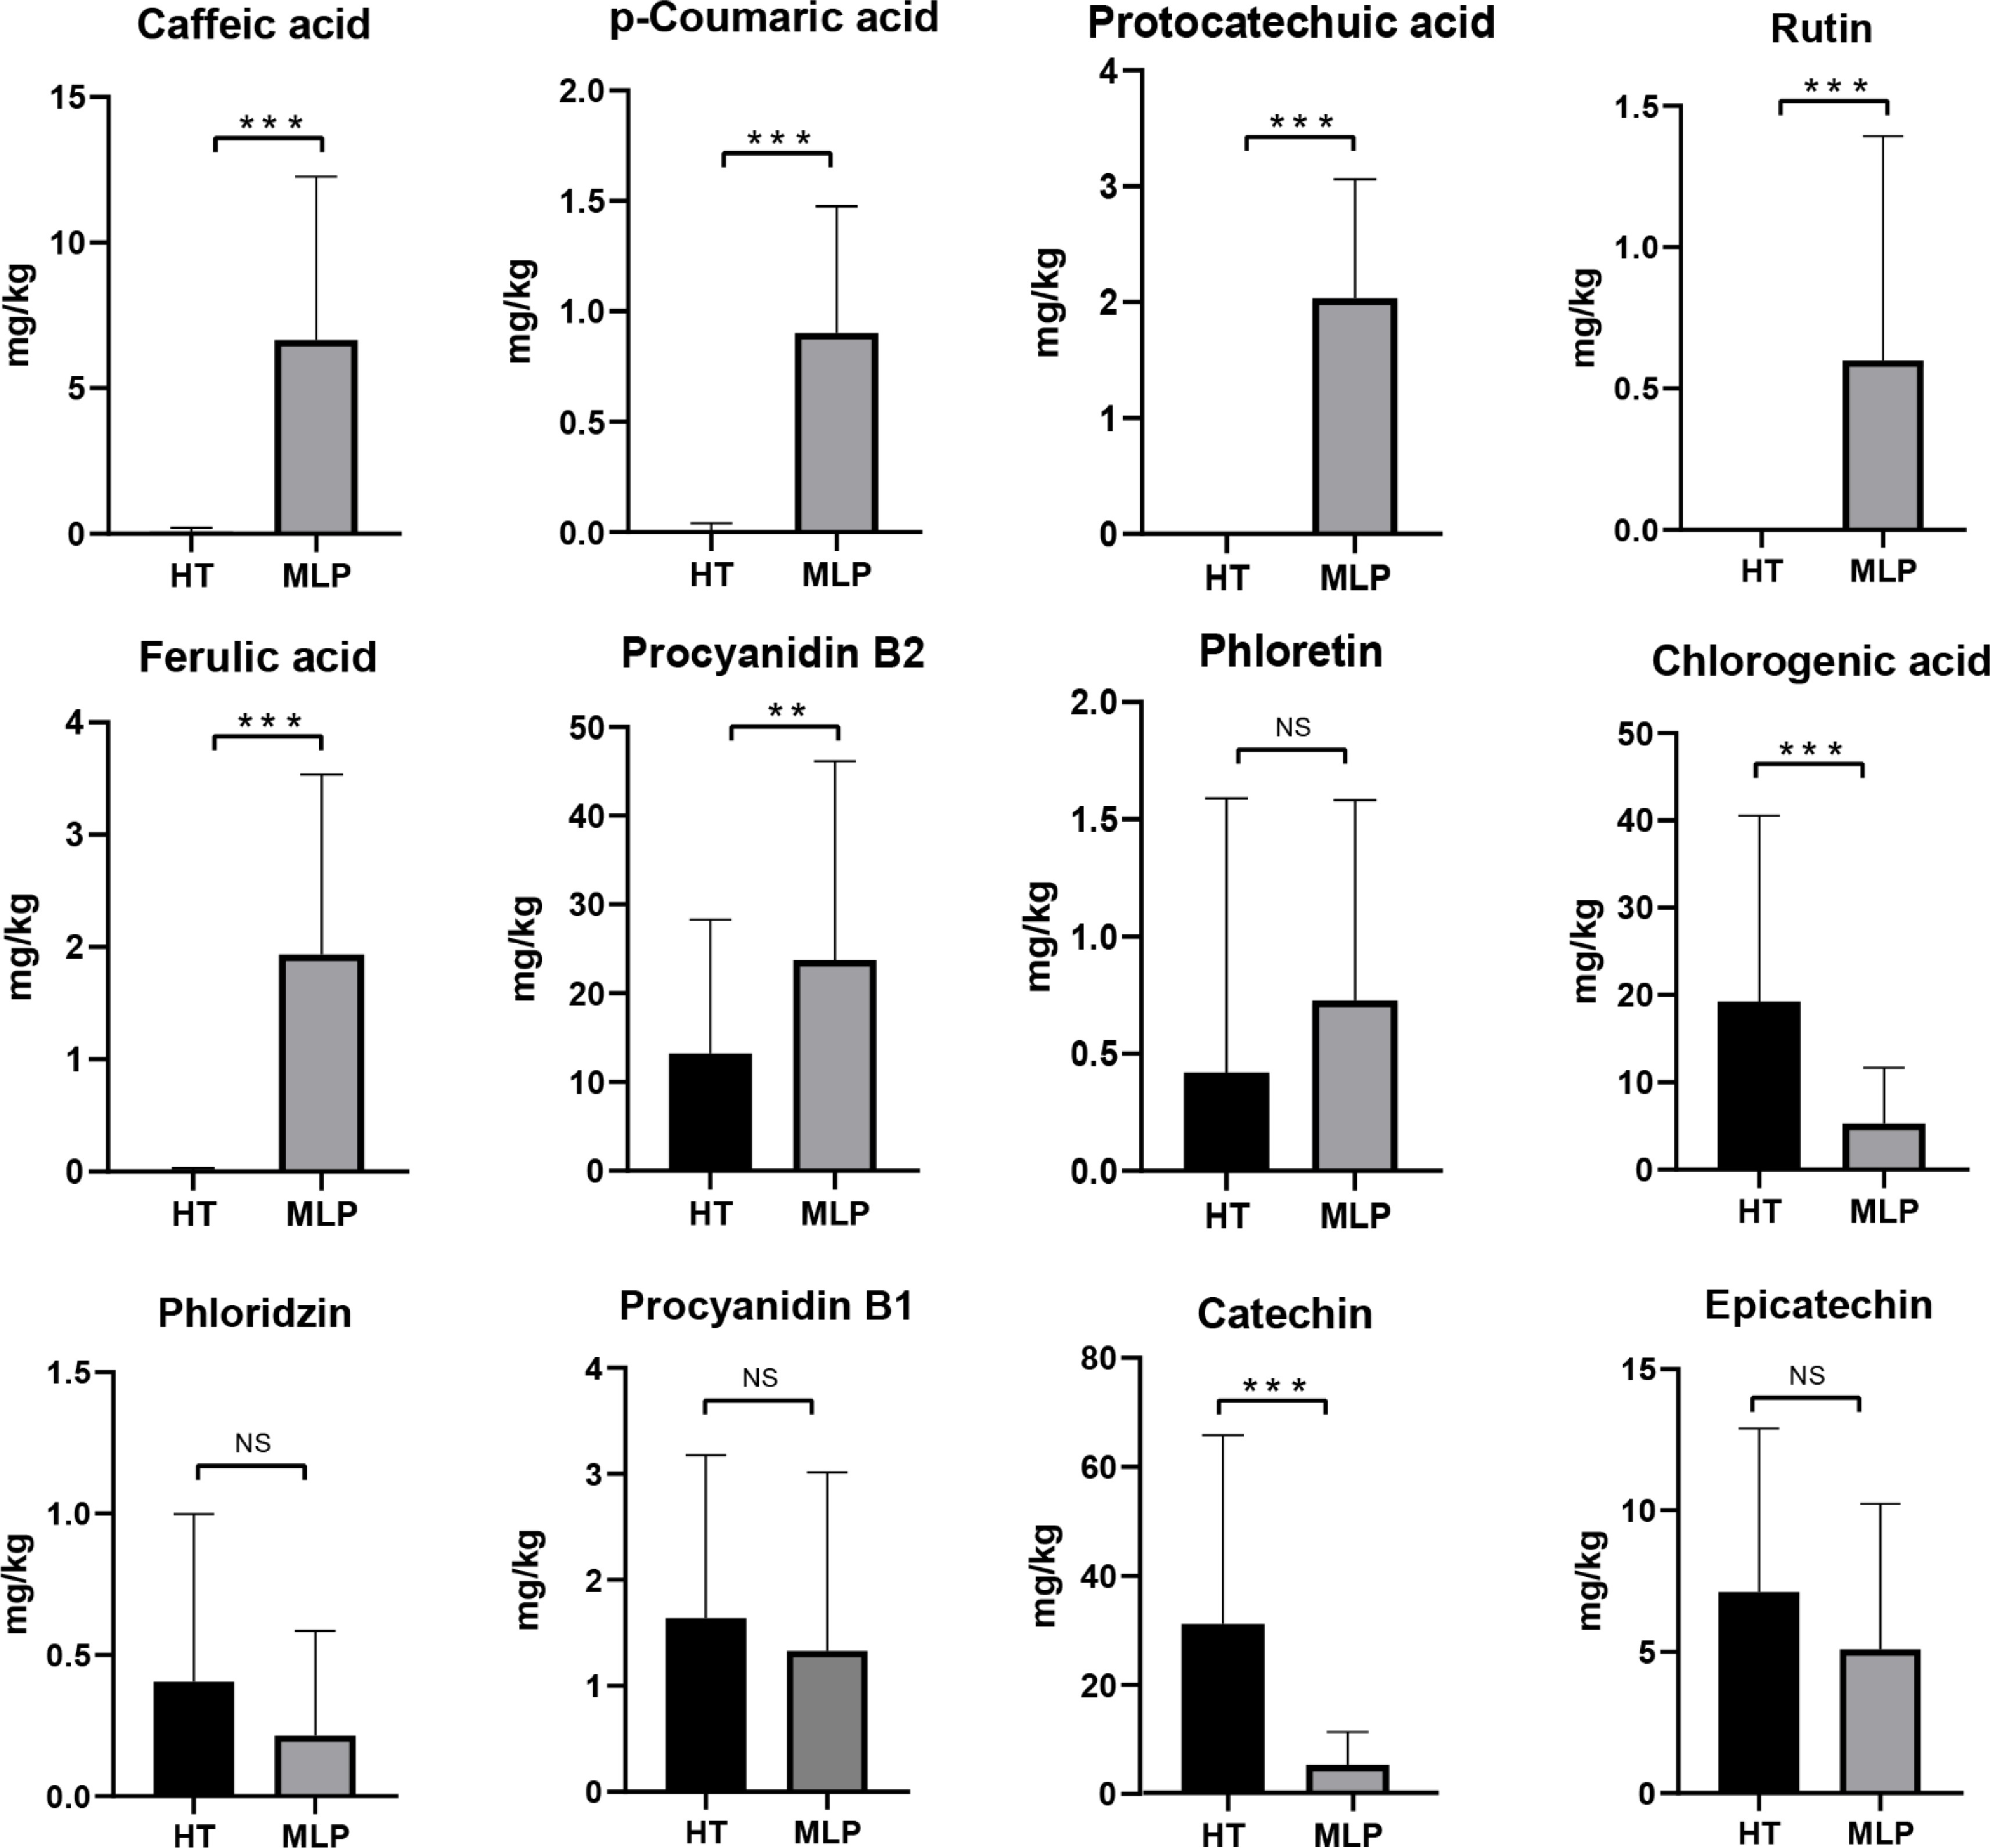
Figure 4.
Differential accumulation patterns of phenolic compounds in healthy (HT) and infected (MLP) apple tissues. Data are presented as mean ± standard deviation (SD). Compared with HT, the concentrations of caffeic acid, p-coumaric acid, protocatechuic acid, rutin, ferulic acid, procyanidin B2, and phloretin were elevated in MLP tissues. In contrast, the levels of chlorogenic acid, phloridzin, procyanidin B1, catechin, and epicatechin were reduced (** p < 0.01, *** p < 0.001; NS, nonsignificant differences).
-
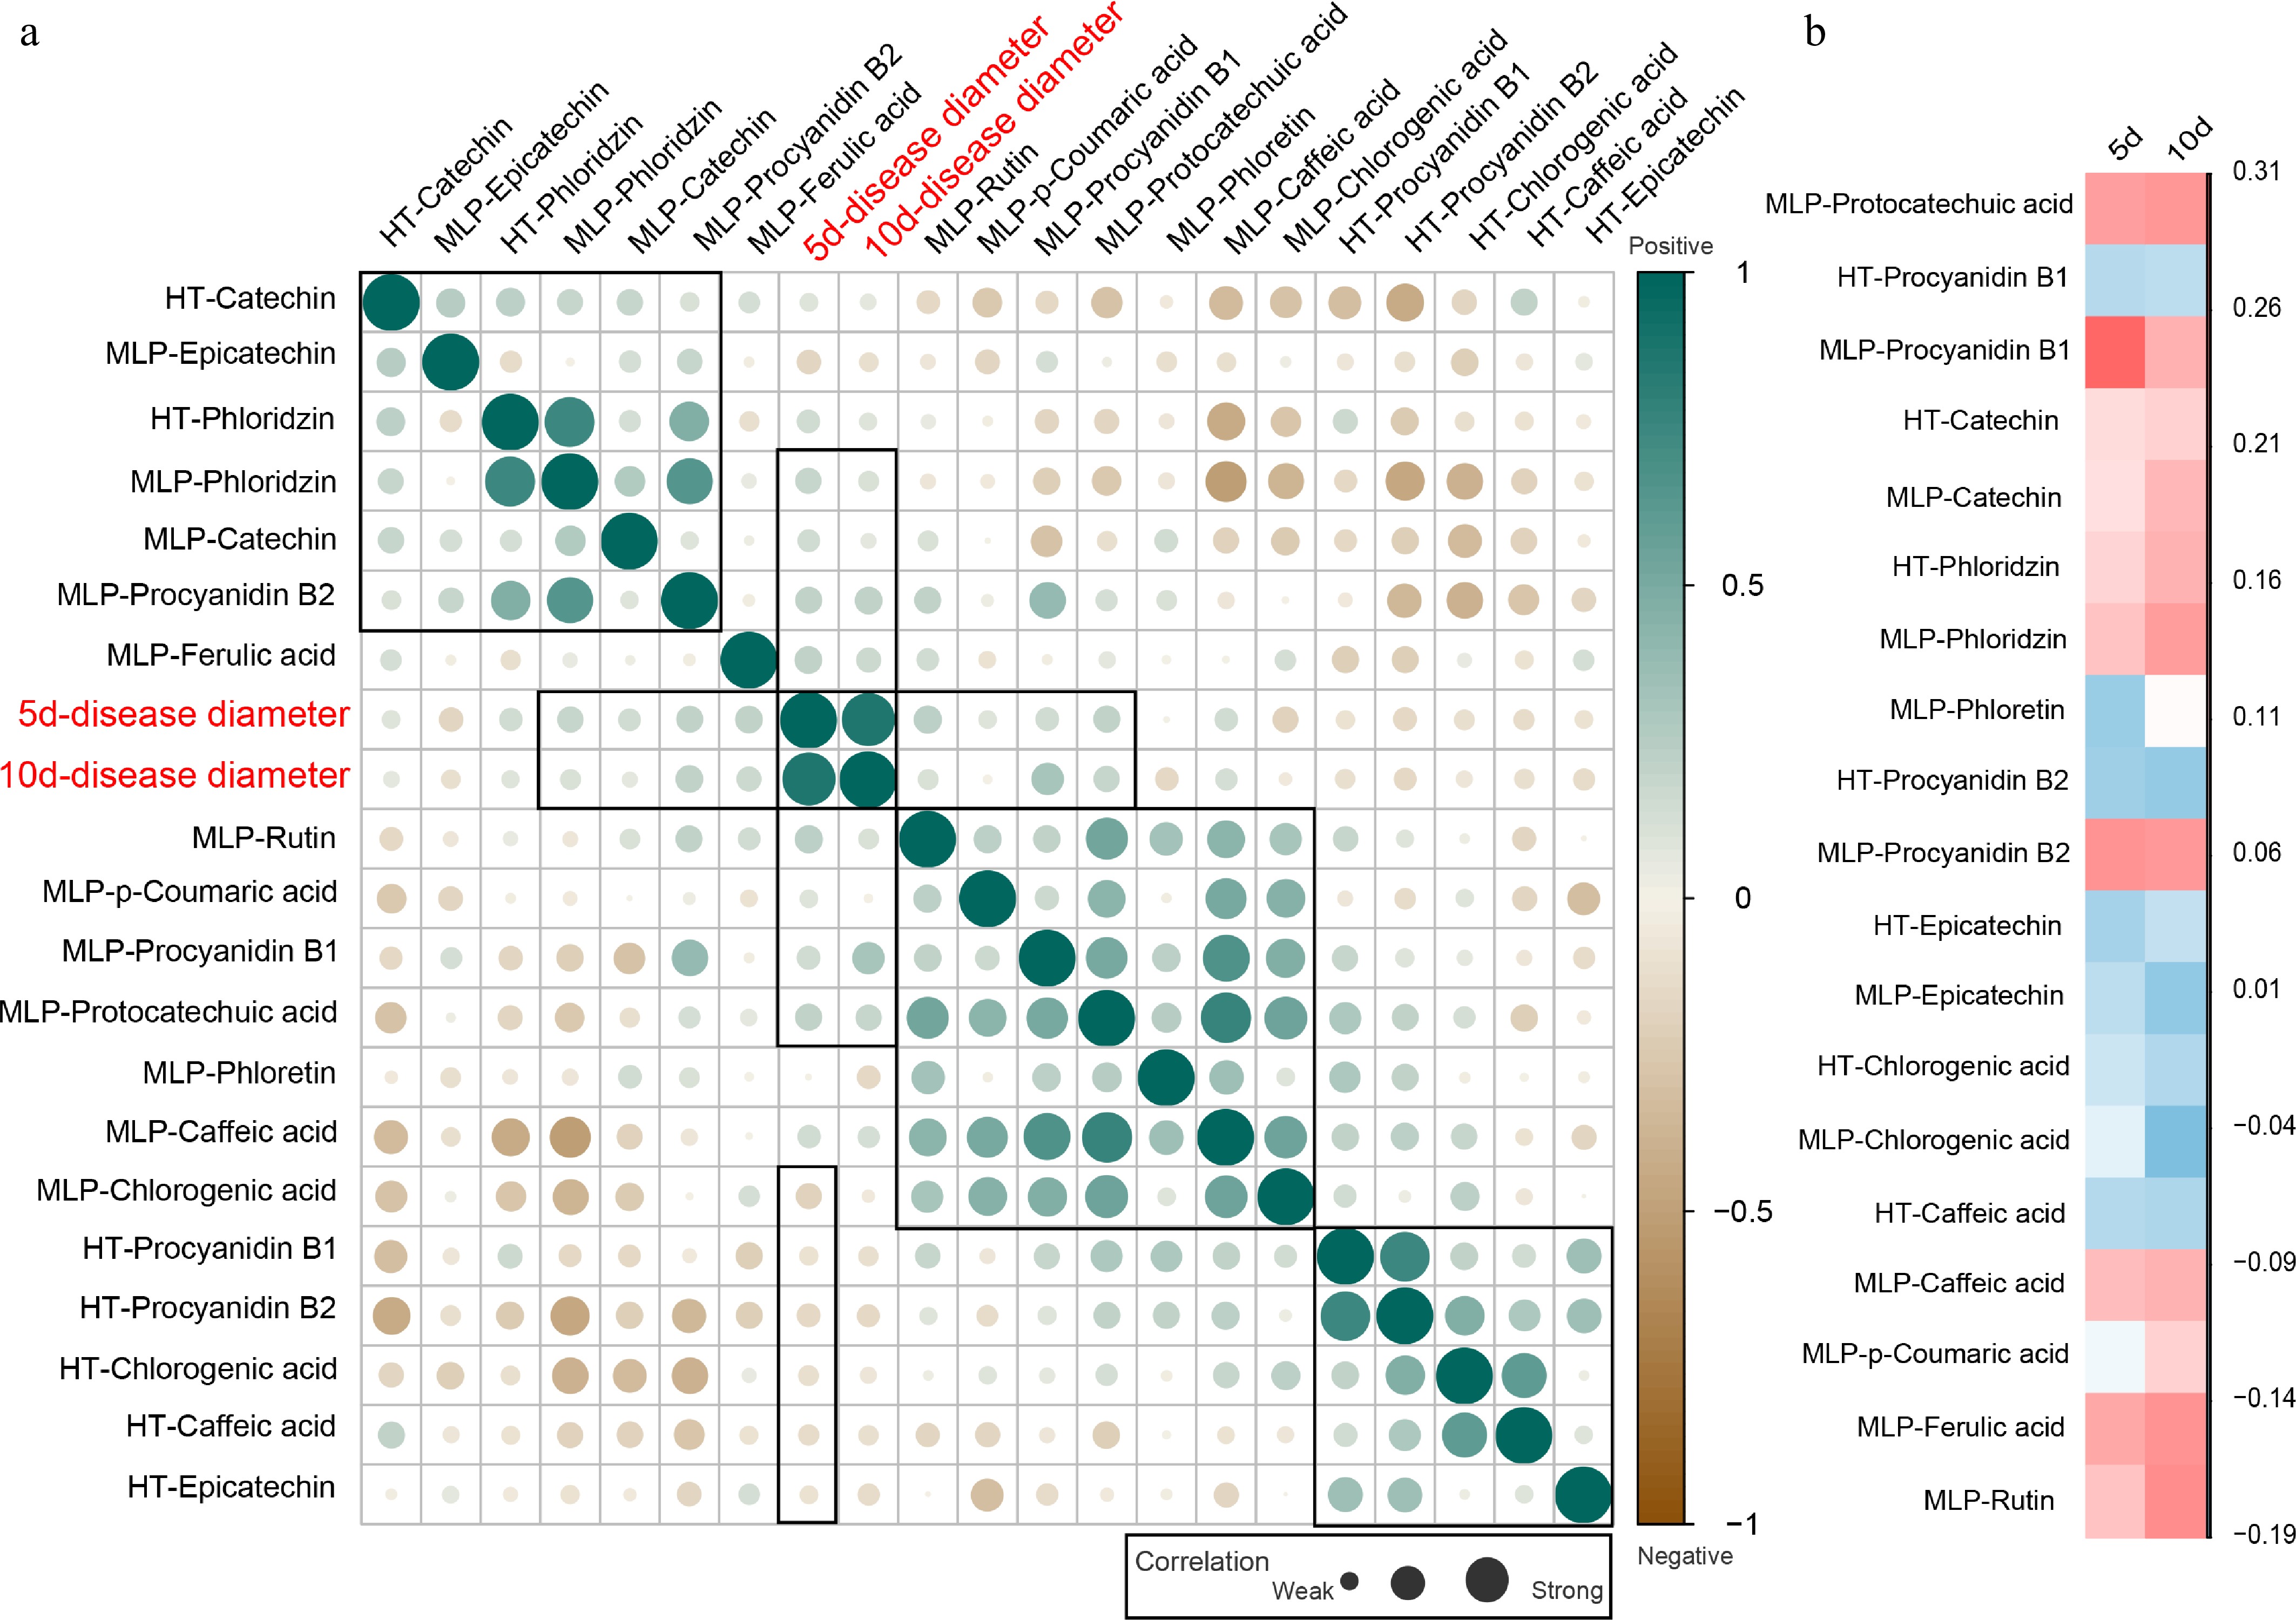
Figure 5.
Correlation analysis between disease progression and phenolic metabolite levels. (a) Correlation matrix between the lesions' diameters (measured on Days 5 and 10 after inoculation) and phenolic metabolites in healthy (HT) and infected (MLP) samples. Circle size represents the absolute correlation coefficient (|r|); larger circles indicate stronger correlations. (b) Heatmap visualization highlighting the correlations between the lesions' diameters and key phenolic metabolites in HT and MLP samples. The color scale from blue to red represents the strength and direction of the correlation (Z-score normalized).
Figures
(5)
Tables
(0)