-
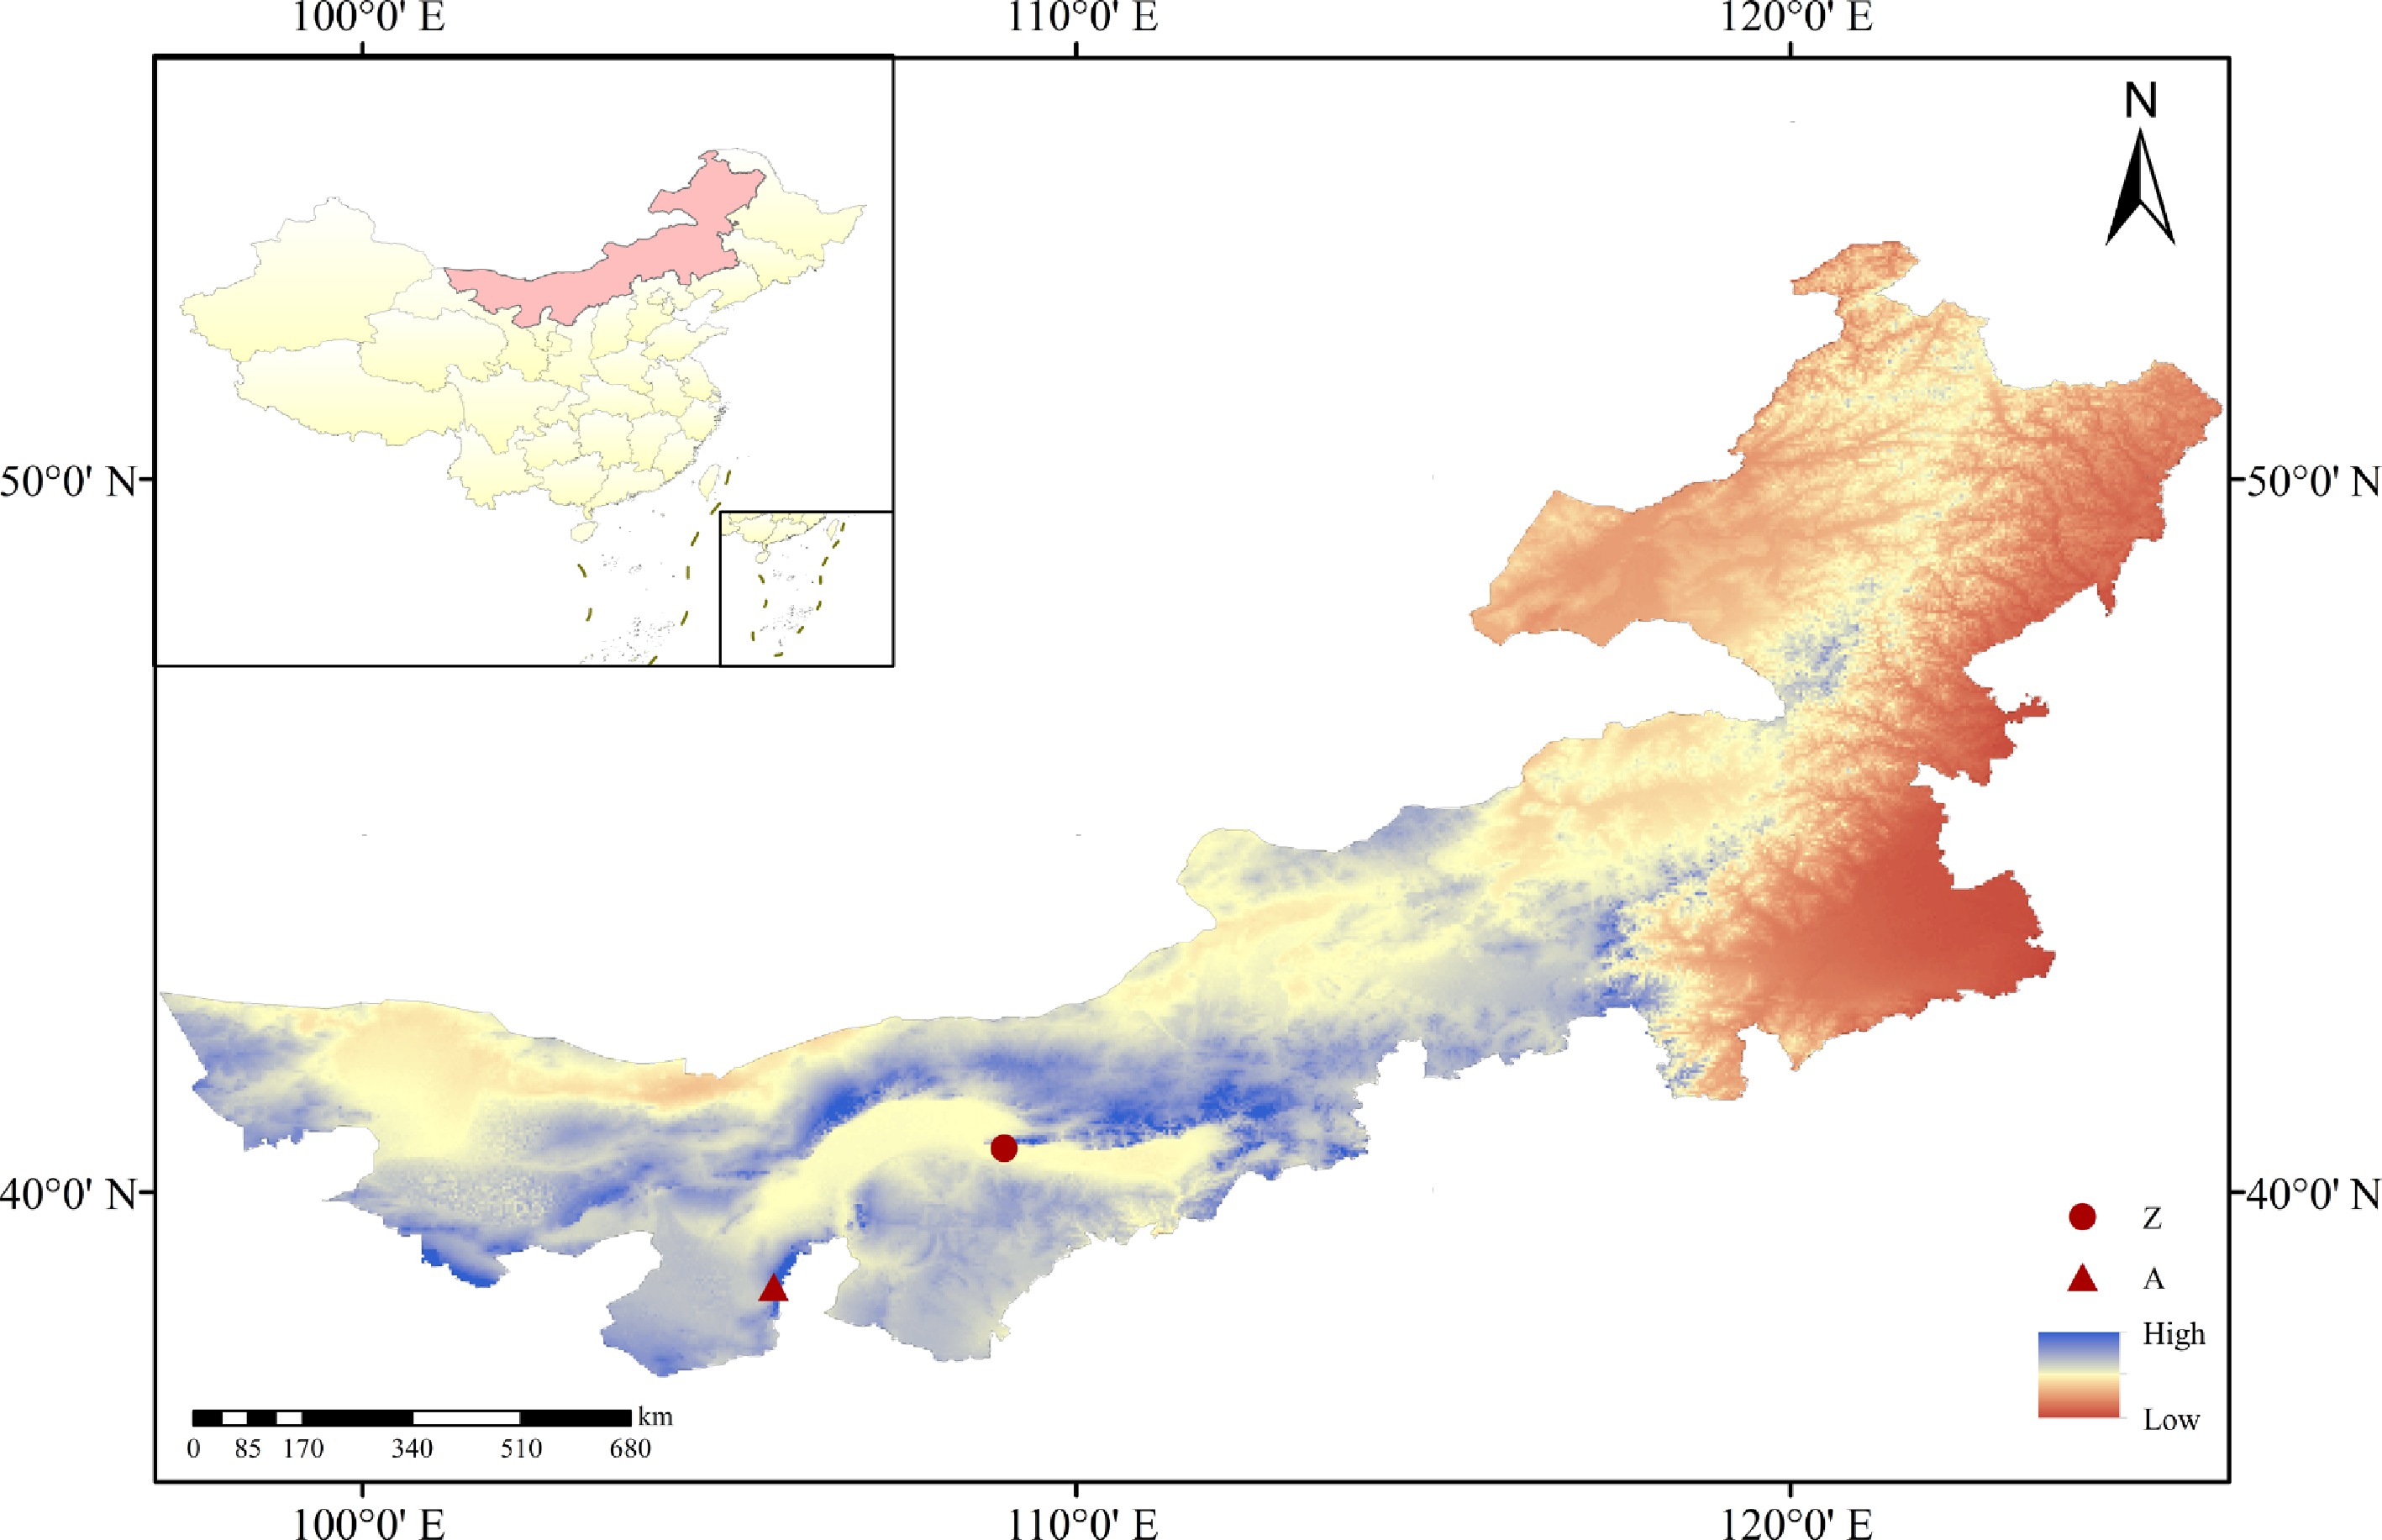
Figure 1.
Geographic locations of wild (Group A, Alxa) and cultivated (Group Z, Baotou) Arnebia guttata sampling sites in Inner Mongolia, China. The base map data used in this study are the 2024 standard administrative division data (Map Approval No. GS [2024] 0650) from the National Platform for Common Geospatial Information Services (Tianditu), available at
www.tianditu.gov.cn . -
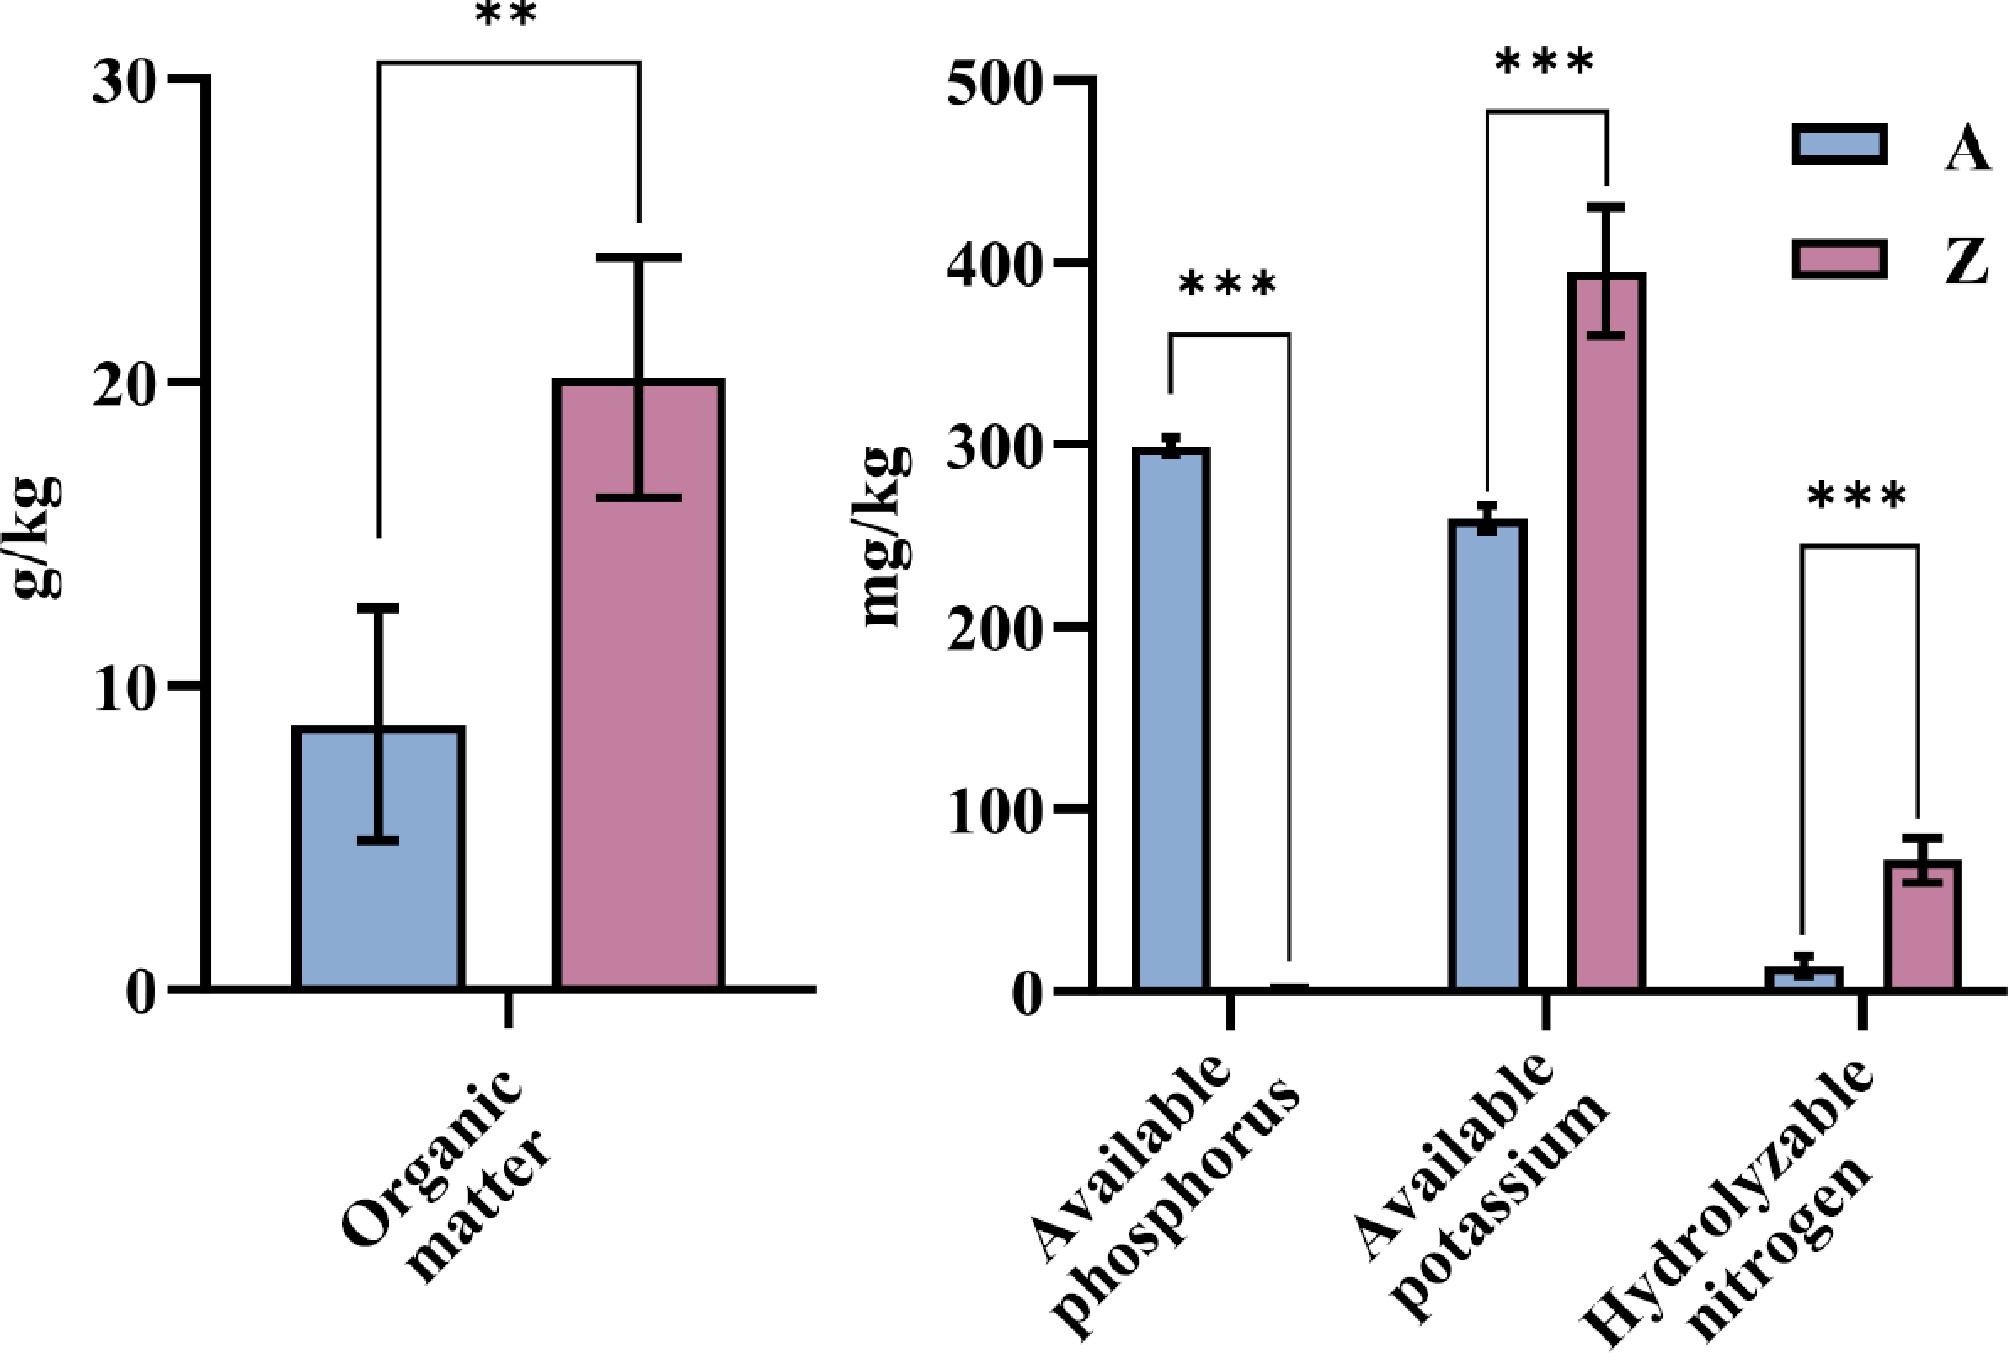
Figure 2.
Comparison of physicochemical parameters in rhizosphere soil between wild (Group A) and cultivated (Group Z) Arnebia guttata (* p < 0.05, ** p < 0.01, *** p < 0.001, n = 5).
-
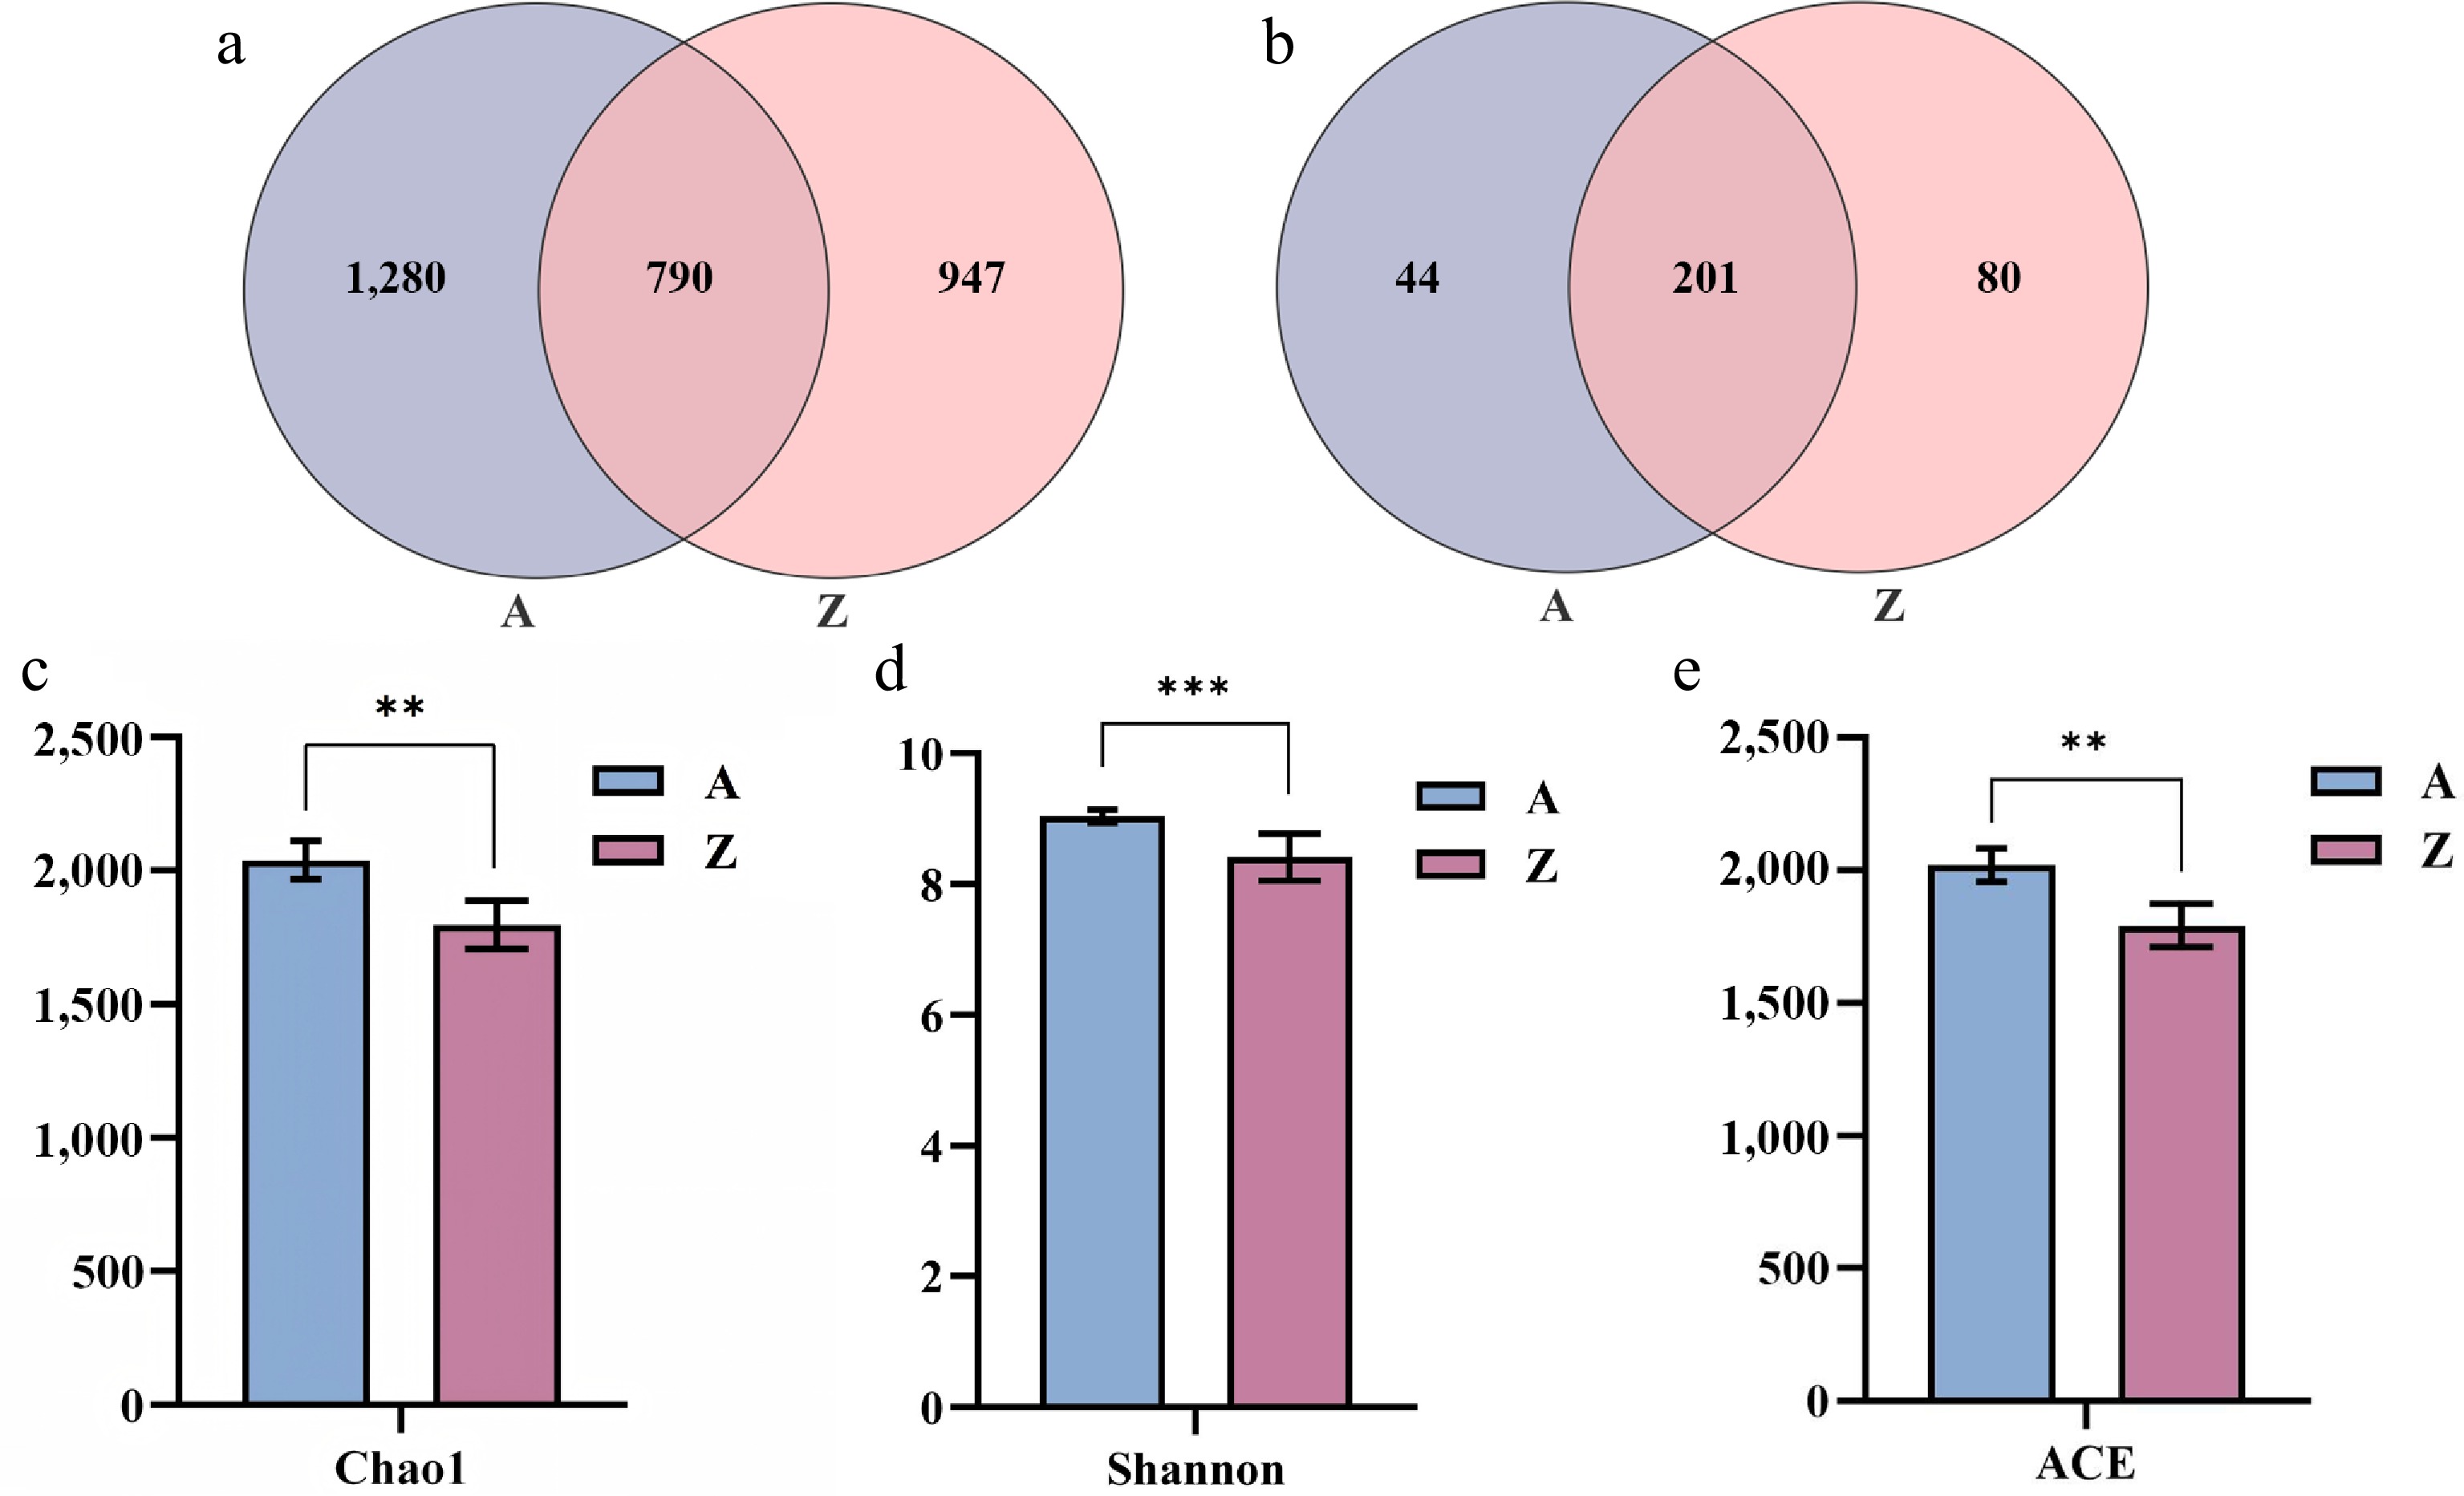
Figure 3.
Comparison of OTU abundance and alpha diversity in rhizosphere soil bacterial communities between wild (Group A) and cultivated (Group Z) Arnebia guttata: (a) Venn diagram showing the number of total observed OTUs shared and unique between the two groups. (b) Venn diagram at the genus level. (c−e) Comparisons of the Chao1 (c), Shannon (d), and ACE (e) alpha diversity indices between groups. Statistical significance was determined by Student's t-test (* p < 0.05, ** p < 0.01, *** p < 0.001, n = 5).
-
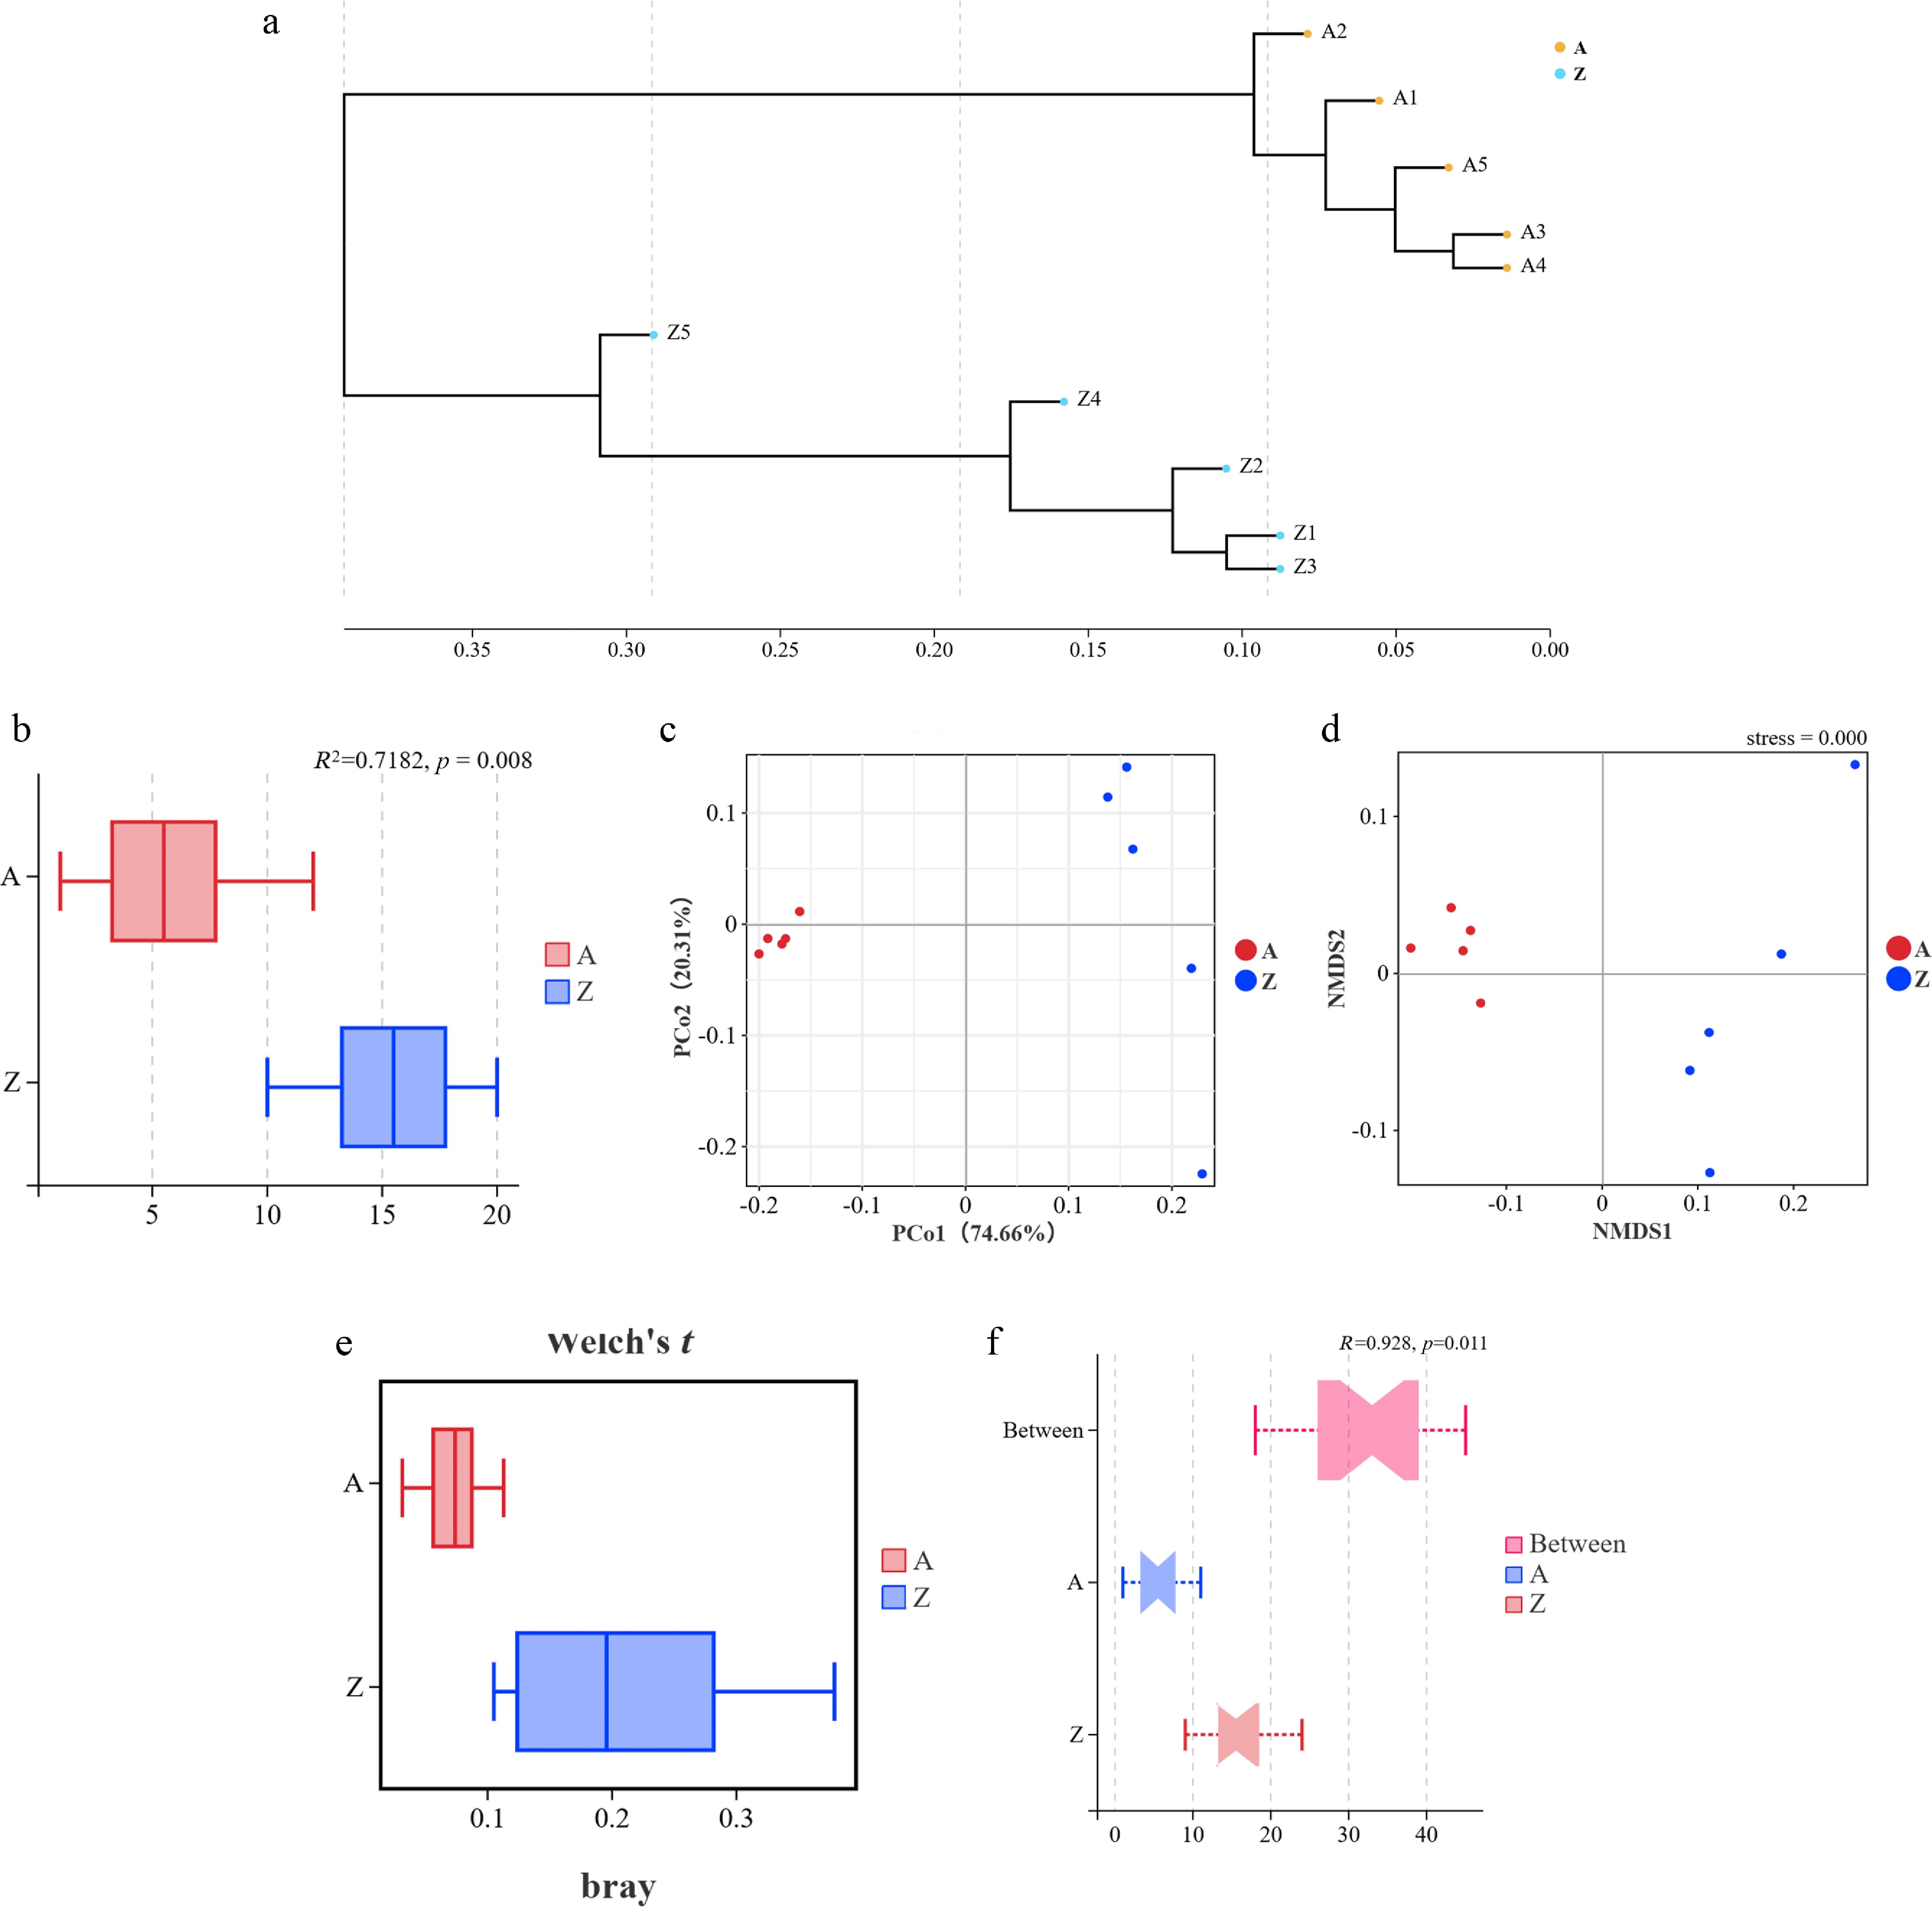
Figure 4.
Differences in rhizosphere bacterial community structure between cultivated (Group Z) and wild (Group A) Arnebia guttata based on phylum level, and analysis of intragroup heterogeneity. (a) UPGMA clustering tree analysis based on phylum-level community structure. (b) Adonis statistical test based on phylum-level community structure. (c, d) PCoA analysis (c) and NMDS analysis (d) based on phylum-level community composition. (e) Welch's t-test based on phylum-level community structure (comparison of intragroup heterogeneity). (f) Anosim analysis.
-
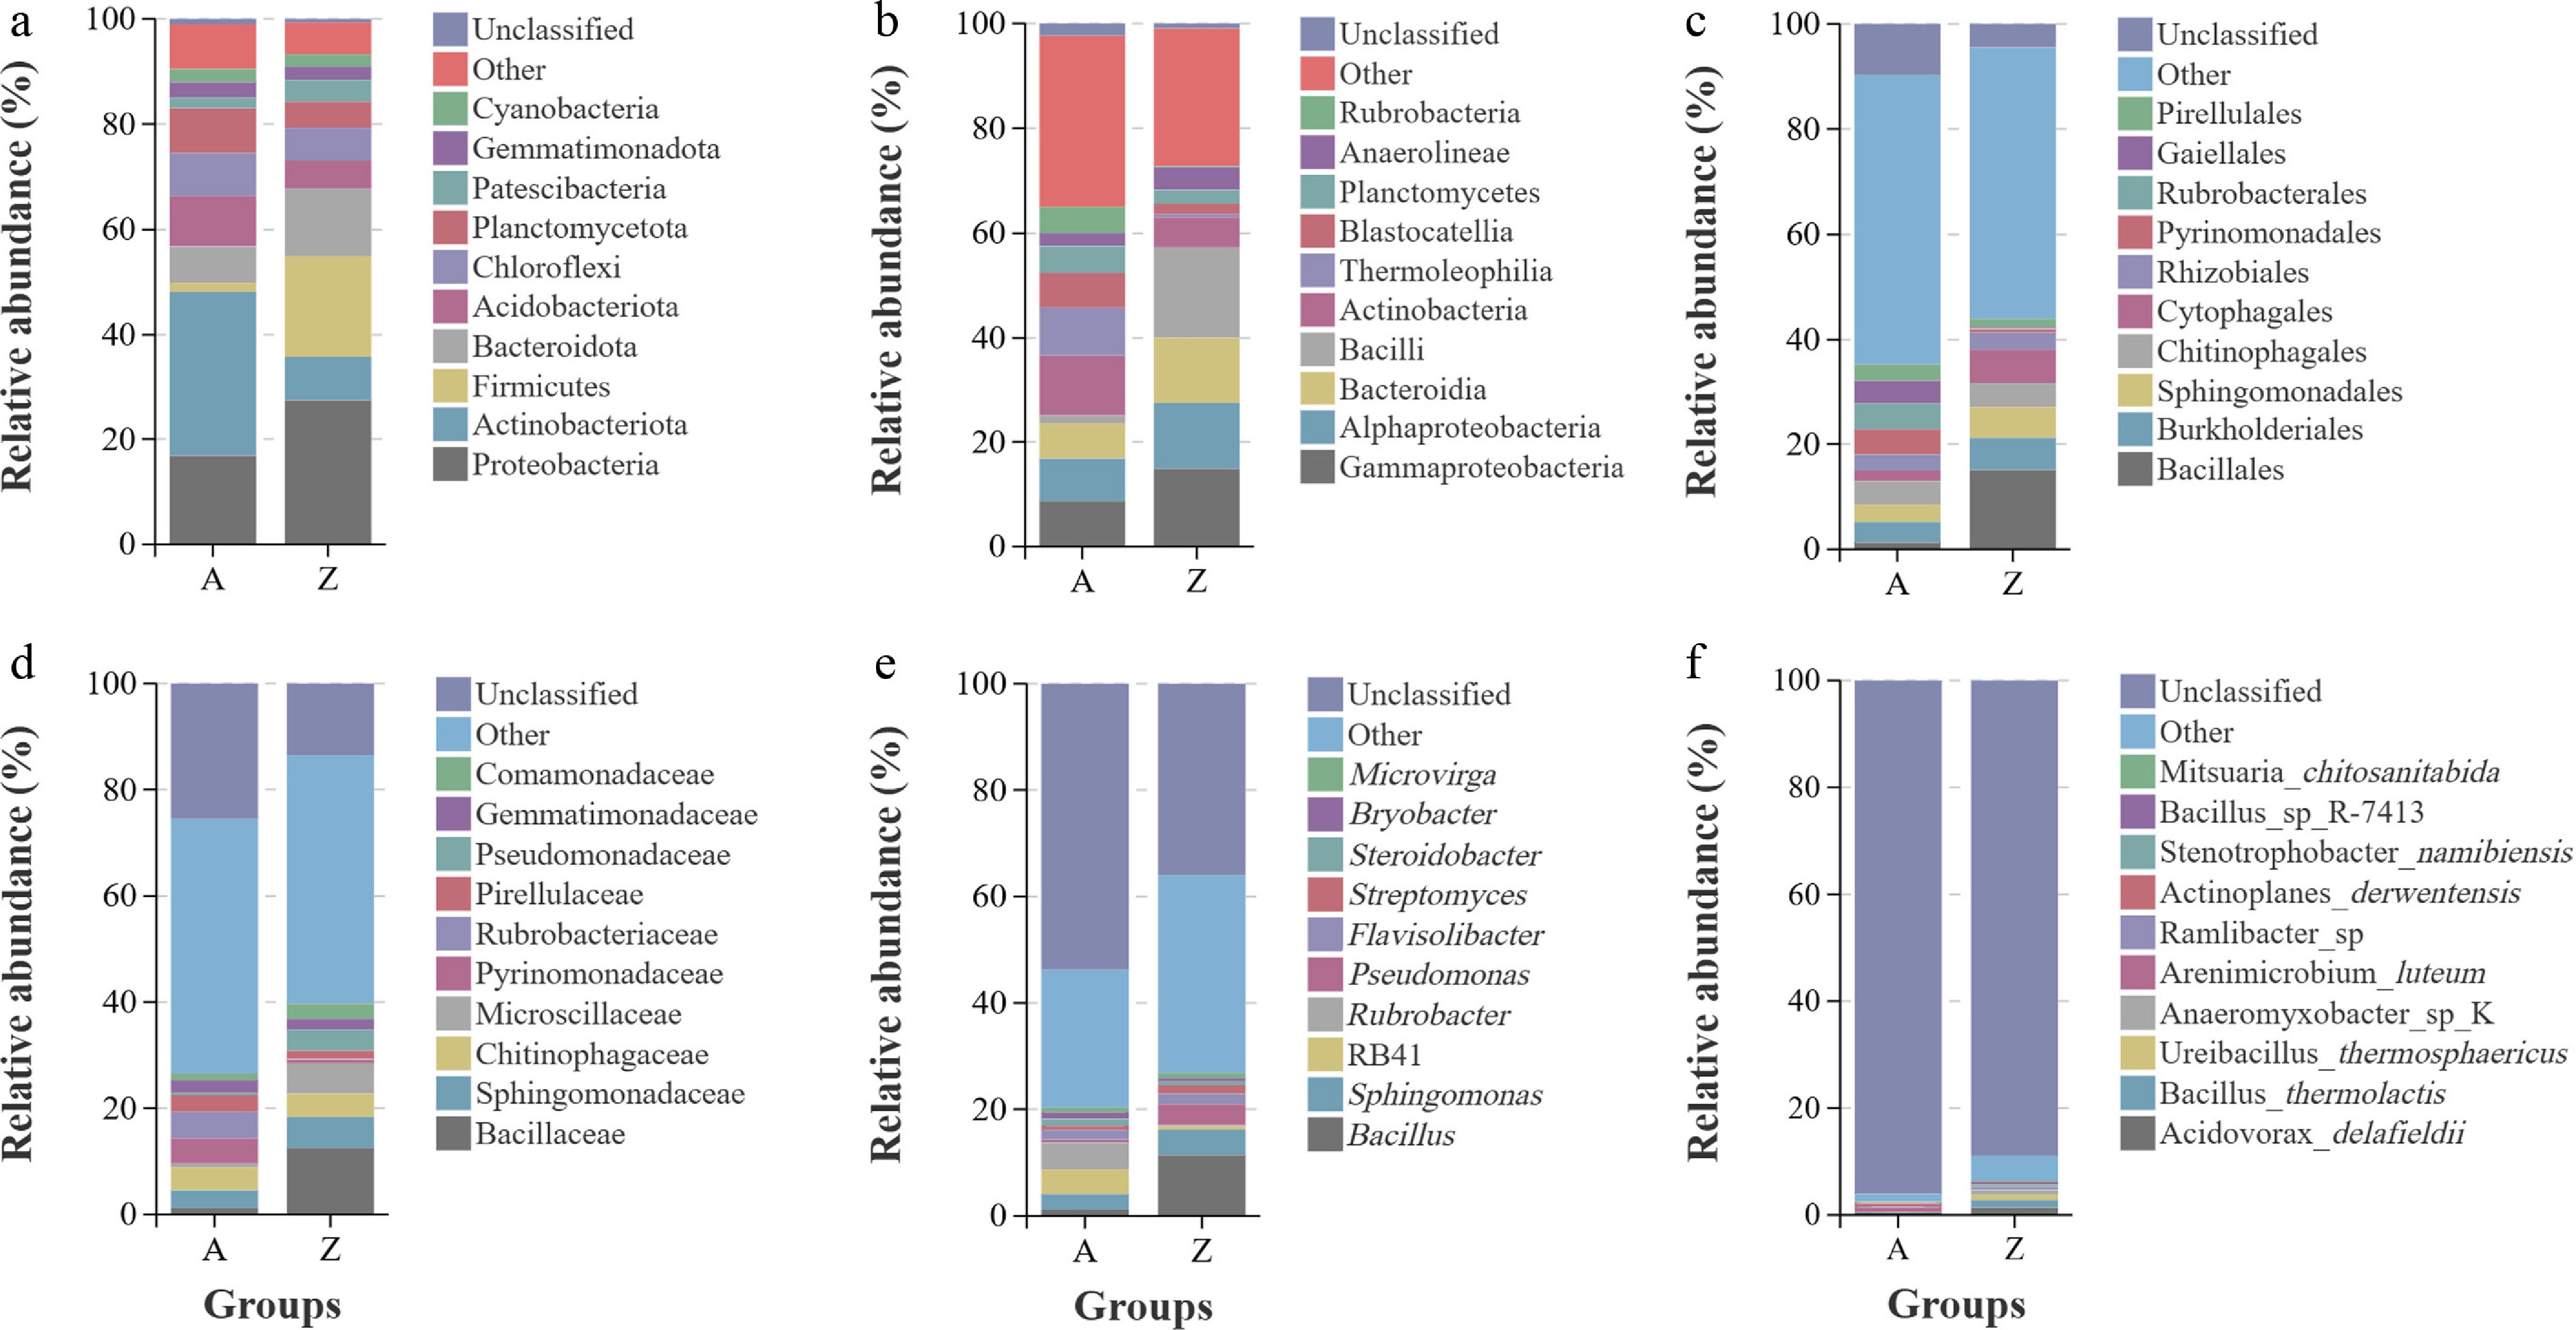
Figure 5.
Distribution of rhizosphere microbiota in cultivated (Group Z) and wild (Group A) Arnebia guttata: (a) phylum; (b) class; (c) order; (d) family; (e) genus; and (f) species.
-
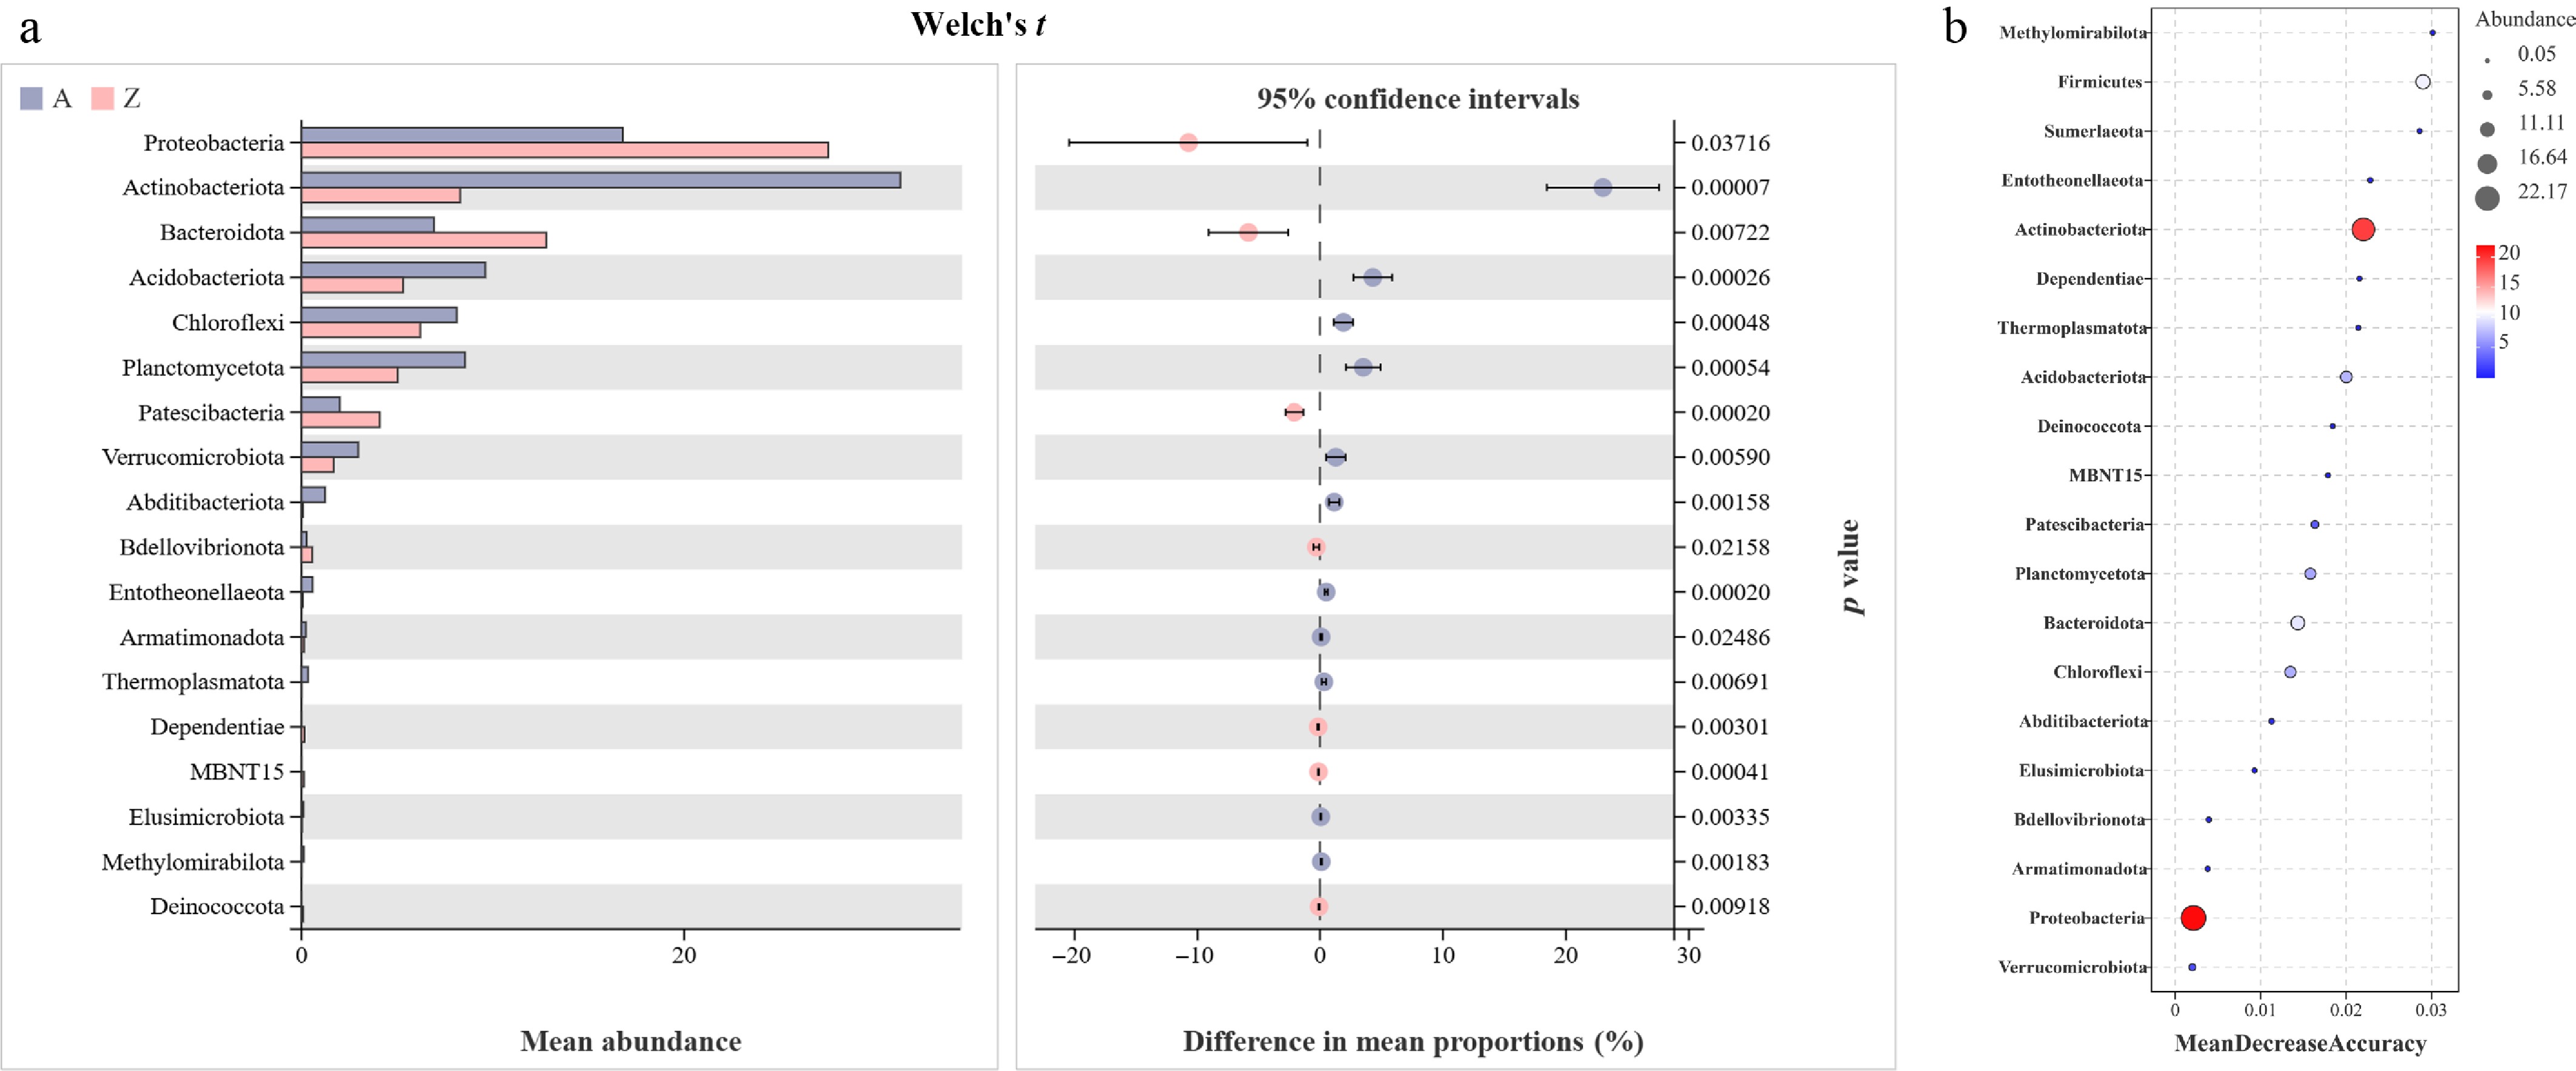
Figure 6.
Differences between cultivated (Group Z) and wild-type (Group A) Arnebia guttata and indicated microbial communities identified by Welch's t-test at the phylum level (a) and random forest analysis (b).
-
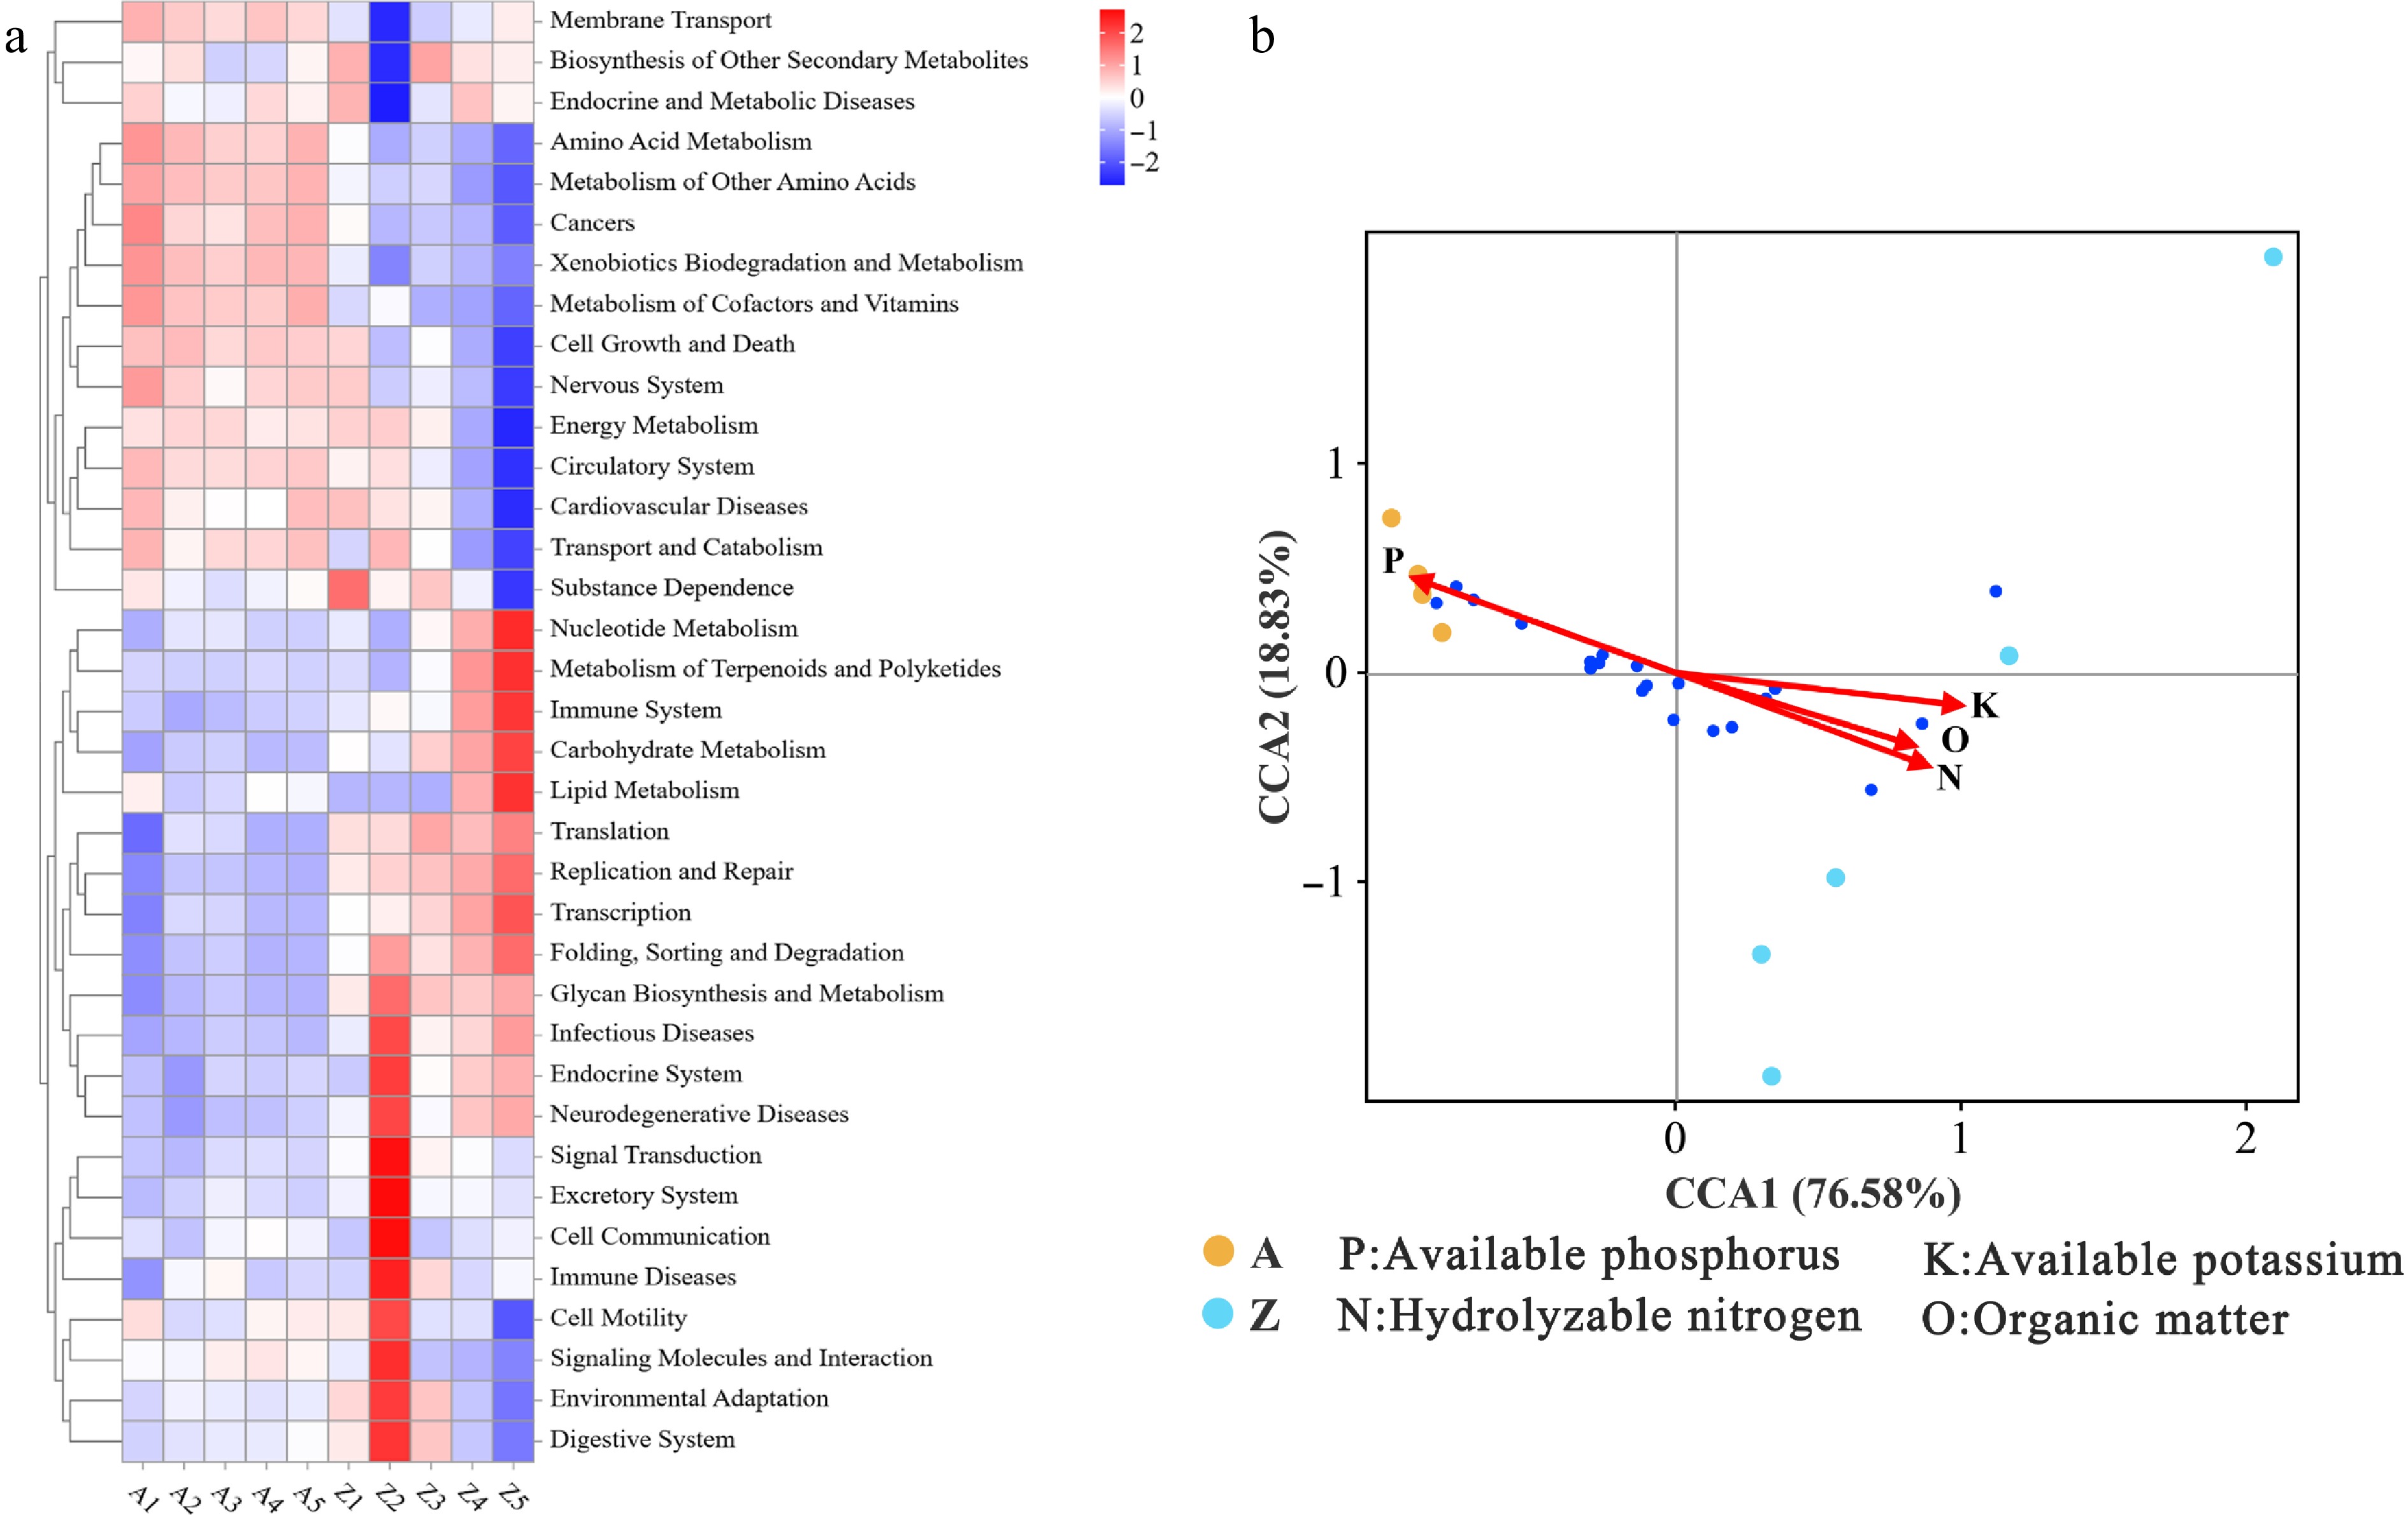
Figure 7.
Comparison of functional characteristics between cultivated and wild-type Arnebia guttata root-zone bacterial communities and their association with environmental factors: (a) Community functional heatmap based on Tax4Fun prediction and KEGG database (top 36 high-abundance pathways). (b) Canonical correspondence analysis (CCA) reveals the driving role of key environmental factors (K, O, N, and P) on community structure; the blue dots in the figure represent the top 20 bacterial phyla by abundance.
-
Samples Potency Cultivated A. guttata sample Wild A. guttata sample Alkannin 0.060 ± 0.002 a 0.001 ± 0.001 b Acetylshikonin 0.309 ± 0.009 a 0.006 ± 0.002 b β,β-dimethyl-acryl-alkannin 0.627 ± 0.306 — Different letters in the same row indicate significant differences (p < 0.05). — means not detected. Table 1.
Results of sample content determination (mean ± SD, n = 3).
Figures
(7)
Tables
(1)