-

Figure 1.
Changes in mouse body weight, oxidative indicators in serum, and behavioral experiments over 0−30 d. (a) Schematic diagram of the experimental design for BALB/c mice from 0 to 30 d. (b) Changes in body weight over 0−30 d. (c) Escape latency in the water maze on day 0 and day 30. (d) Number of electric shocks in the passive avoidance test on day 0 and day 30. (e) MDA levels (n = 5). (f) SOD levels (n = 5). Different symbols '*' indicate significant differences compared to the Con group (p < 0.05).
-
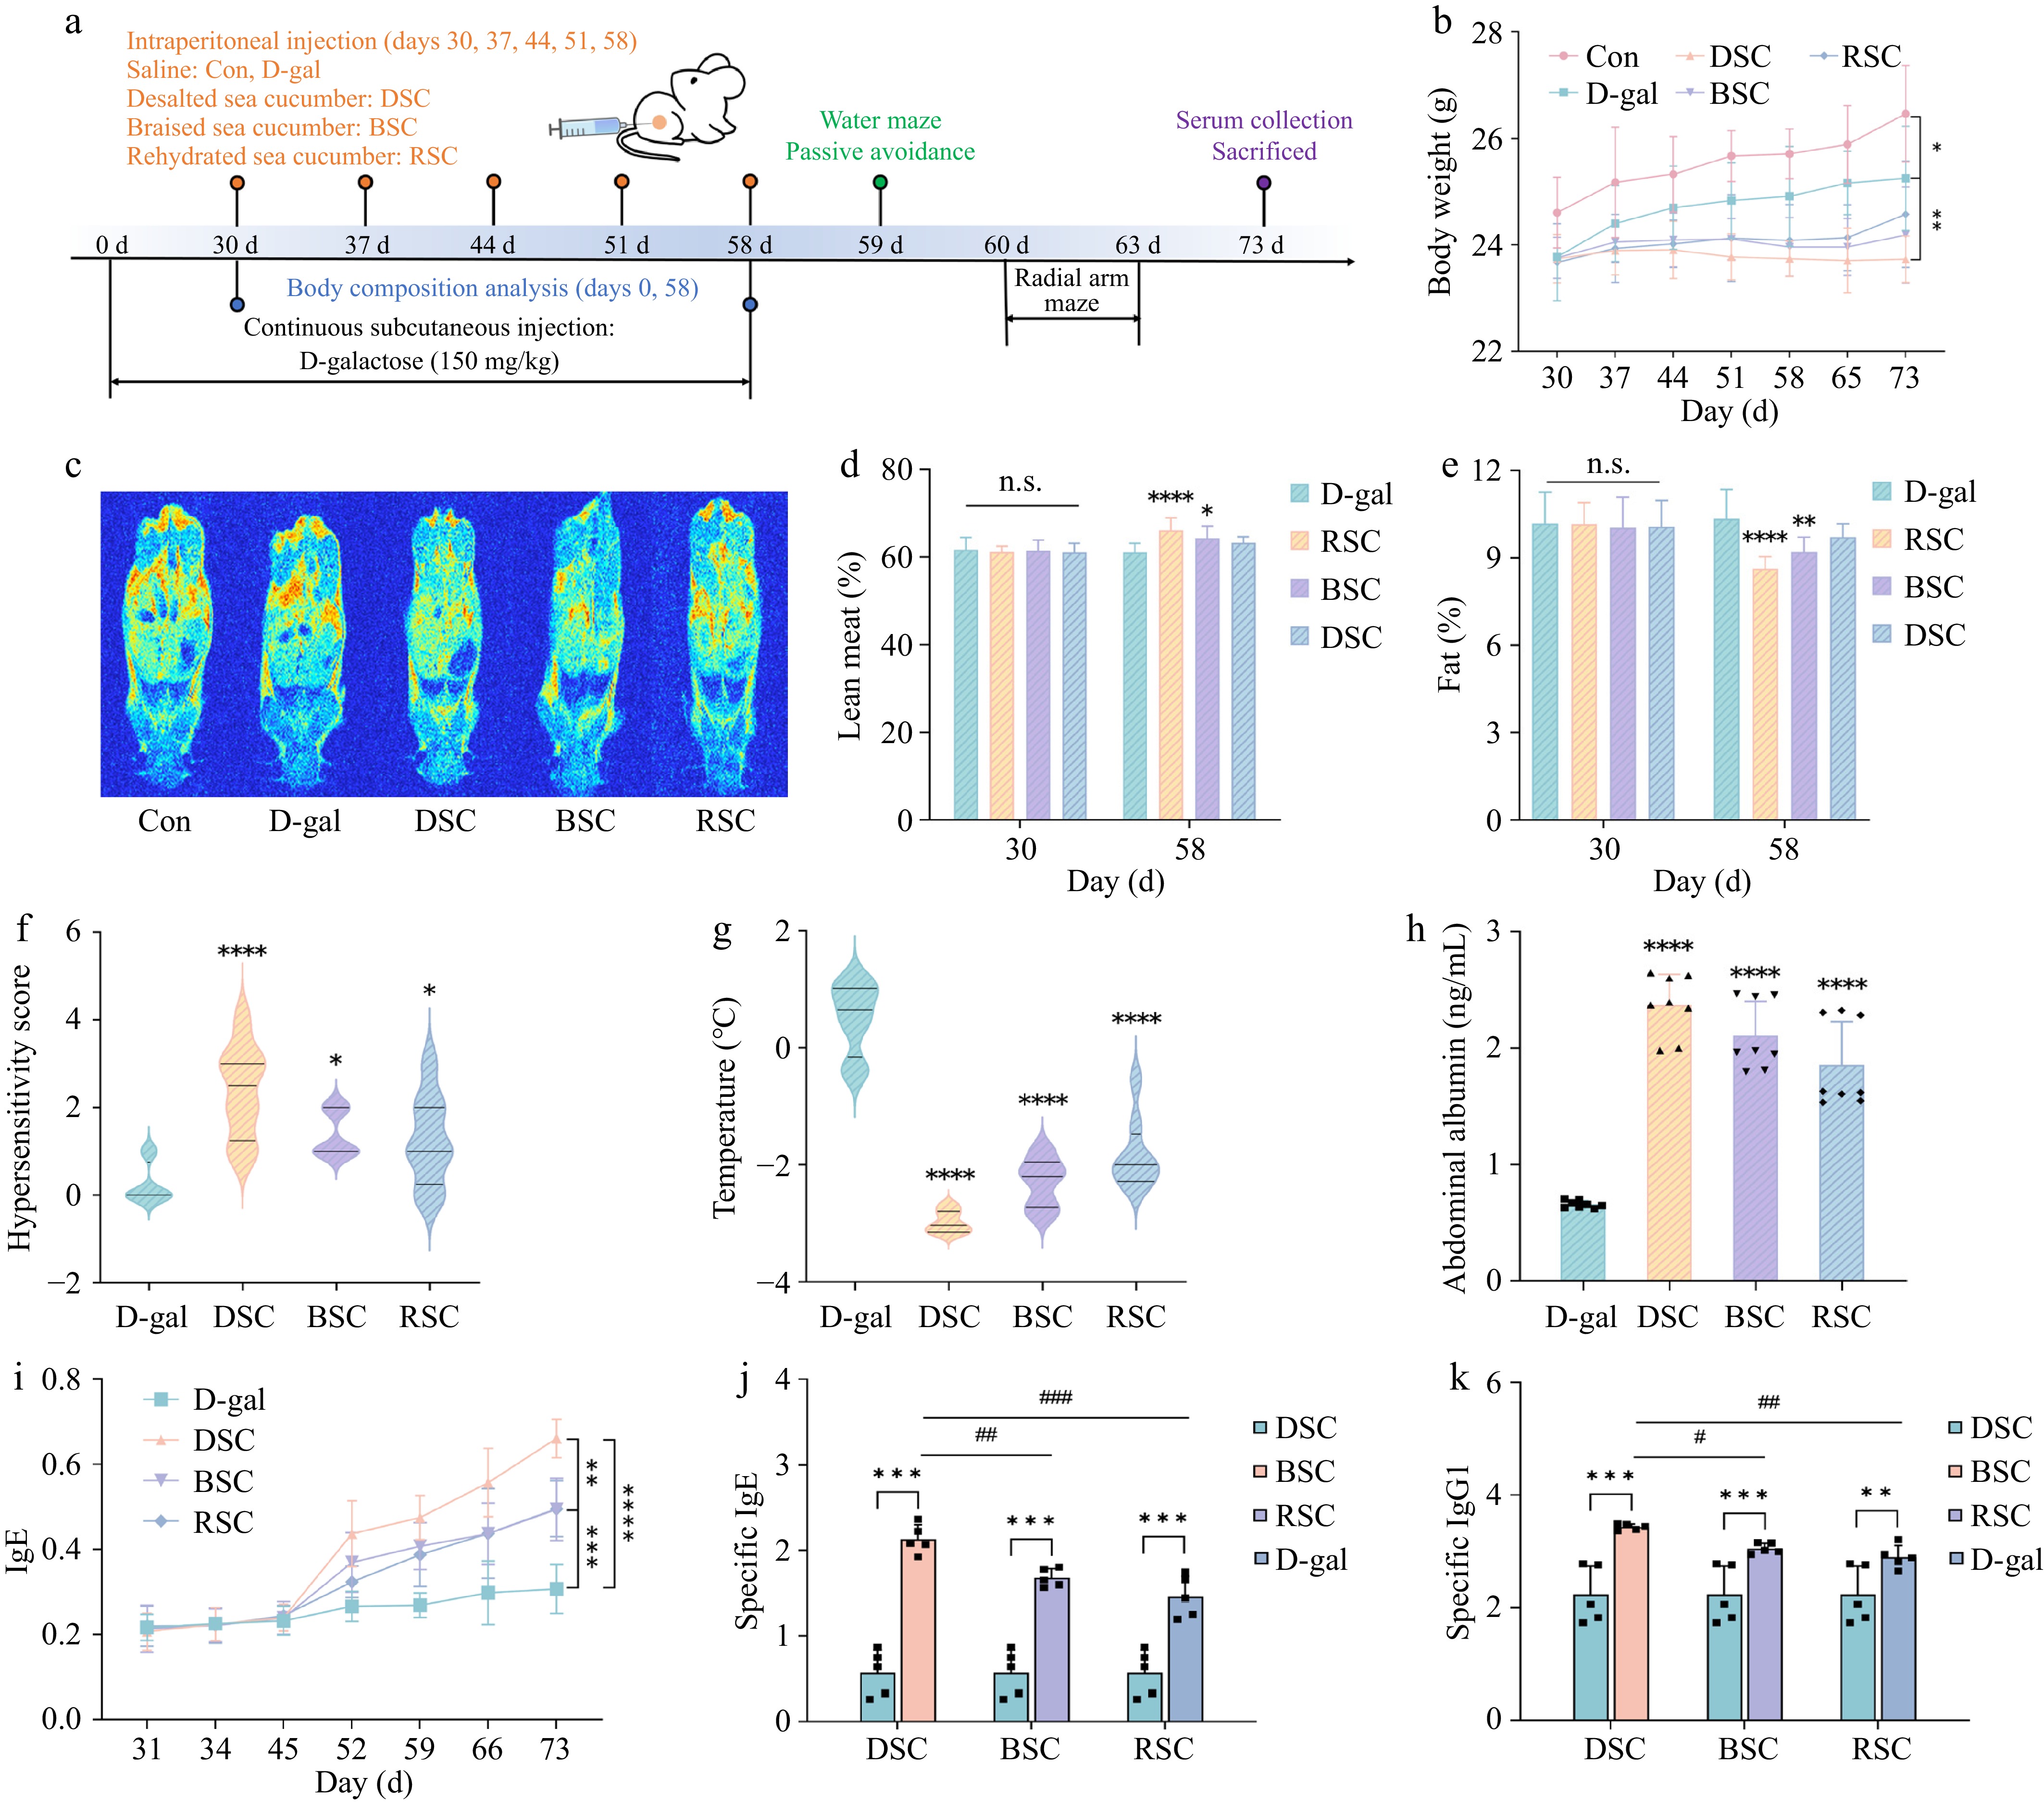
Figure 2.
Analysis of body composition, allergic reactions, and serological analysis and detection in mice. (a) Schematic diagram of the experimental design for BALB/c mice from 0 to 73 d. (b) Changes in mouse body weight (n = 10) from 30 to 73 d. (c) MRI images. (d) Relative content of lean meat in mice (n = 10). Different symbols '*' indicate significant differences (p < 0.05) between 30 and 58 d for the same group. (e) Relative content of fat in mice (n = 10). Different symbols '*' indicate significant differences (p < 0.05) between 30 and 58 d for the same group. (f) Allergy symptom scores after high-dose stimulation (n = 10). (g) Ear temperature after high-dose stimulation (n = 10). (h) Abdominal albumin (n = 10). (i) Trend of specific IgE. (j) Specific IgE. (k) Specific IgG1. Different symbols '*' indicate significant differences compared to the D-gal group (p < 0.05). Different symbols '#' indicate significant differences compared to the DSC group (p < 0.05).
-
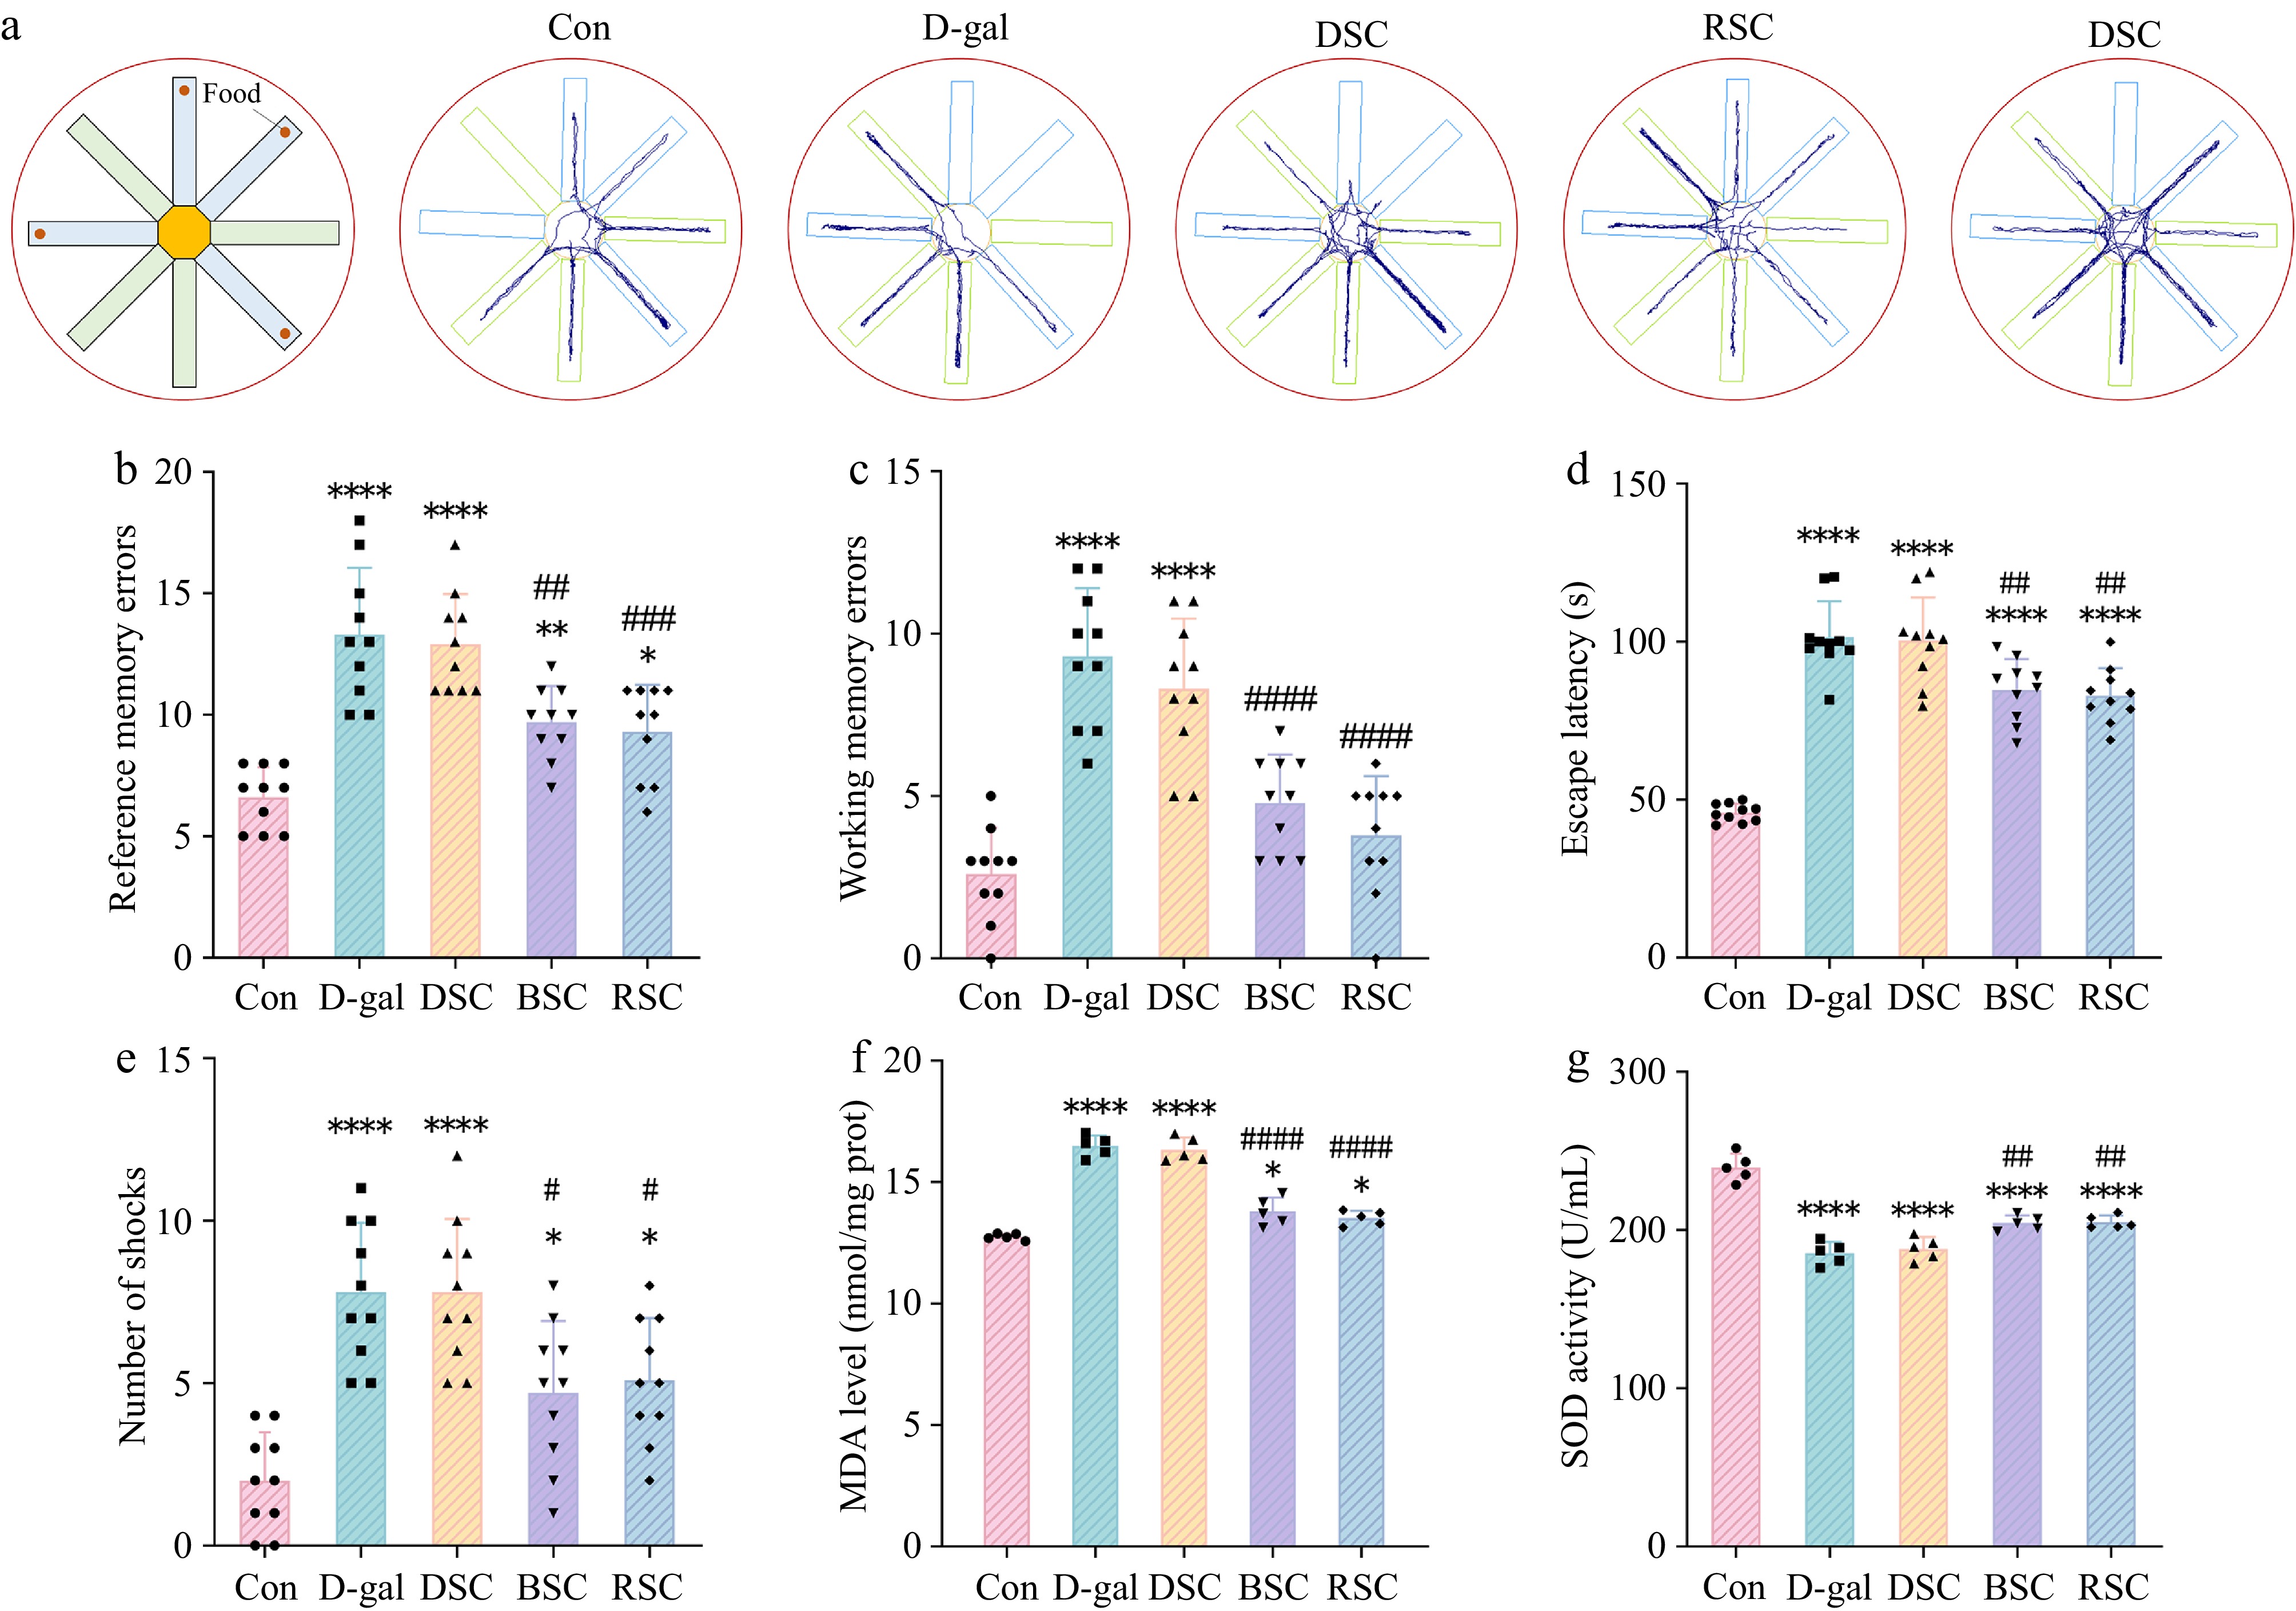
Figure 3.
Behavioral experiments on aged mice (n = 10). (a) The movement trajectory of the mice in the eight-arm maze. (b) The number of reference memory errors in the eight-arm maze test. (c) The number of working memory errors in the eight-arm maze test. (d) The escape latency of the mice in the water maze test. (e) The number of electric shocks in the passive avoidance test. (f) MDA levels (n = 5). (g) SOD levels (n = 5). Different symbols '*' indicate significant differences compared to the Con group (p < 0.05). Different symbols '#' indicate significant differences compared to the D-gal group (p < 0.05).
-
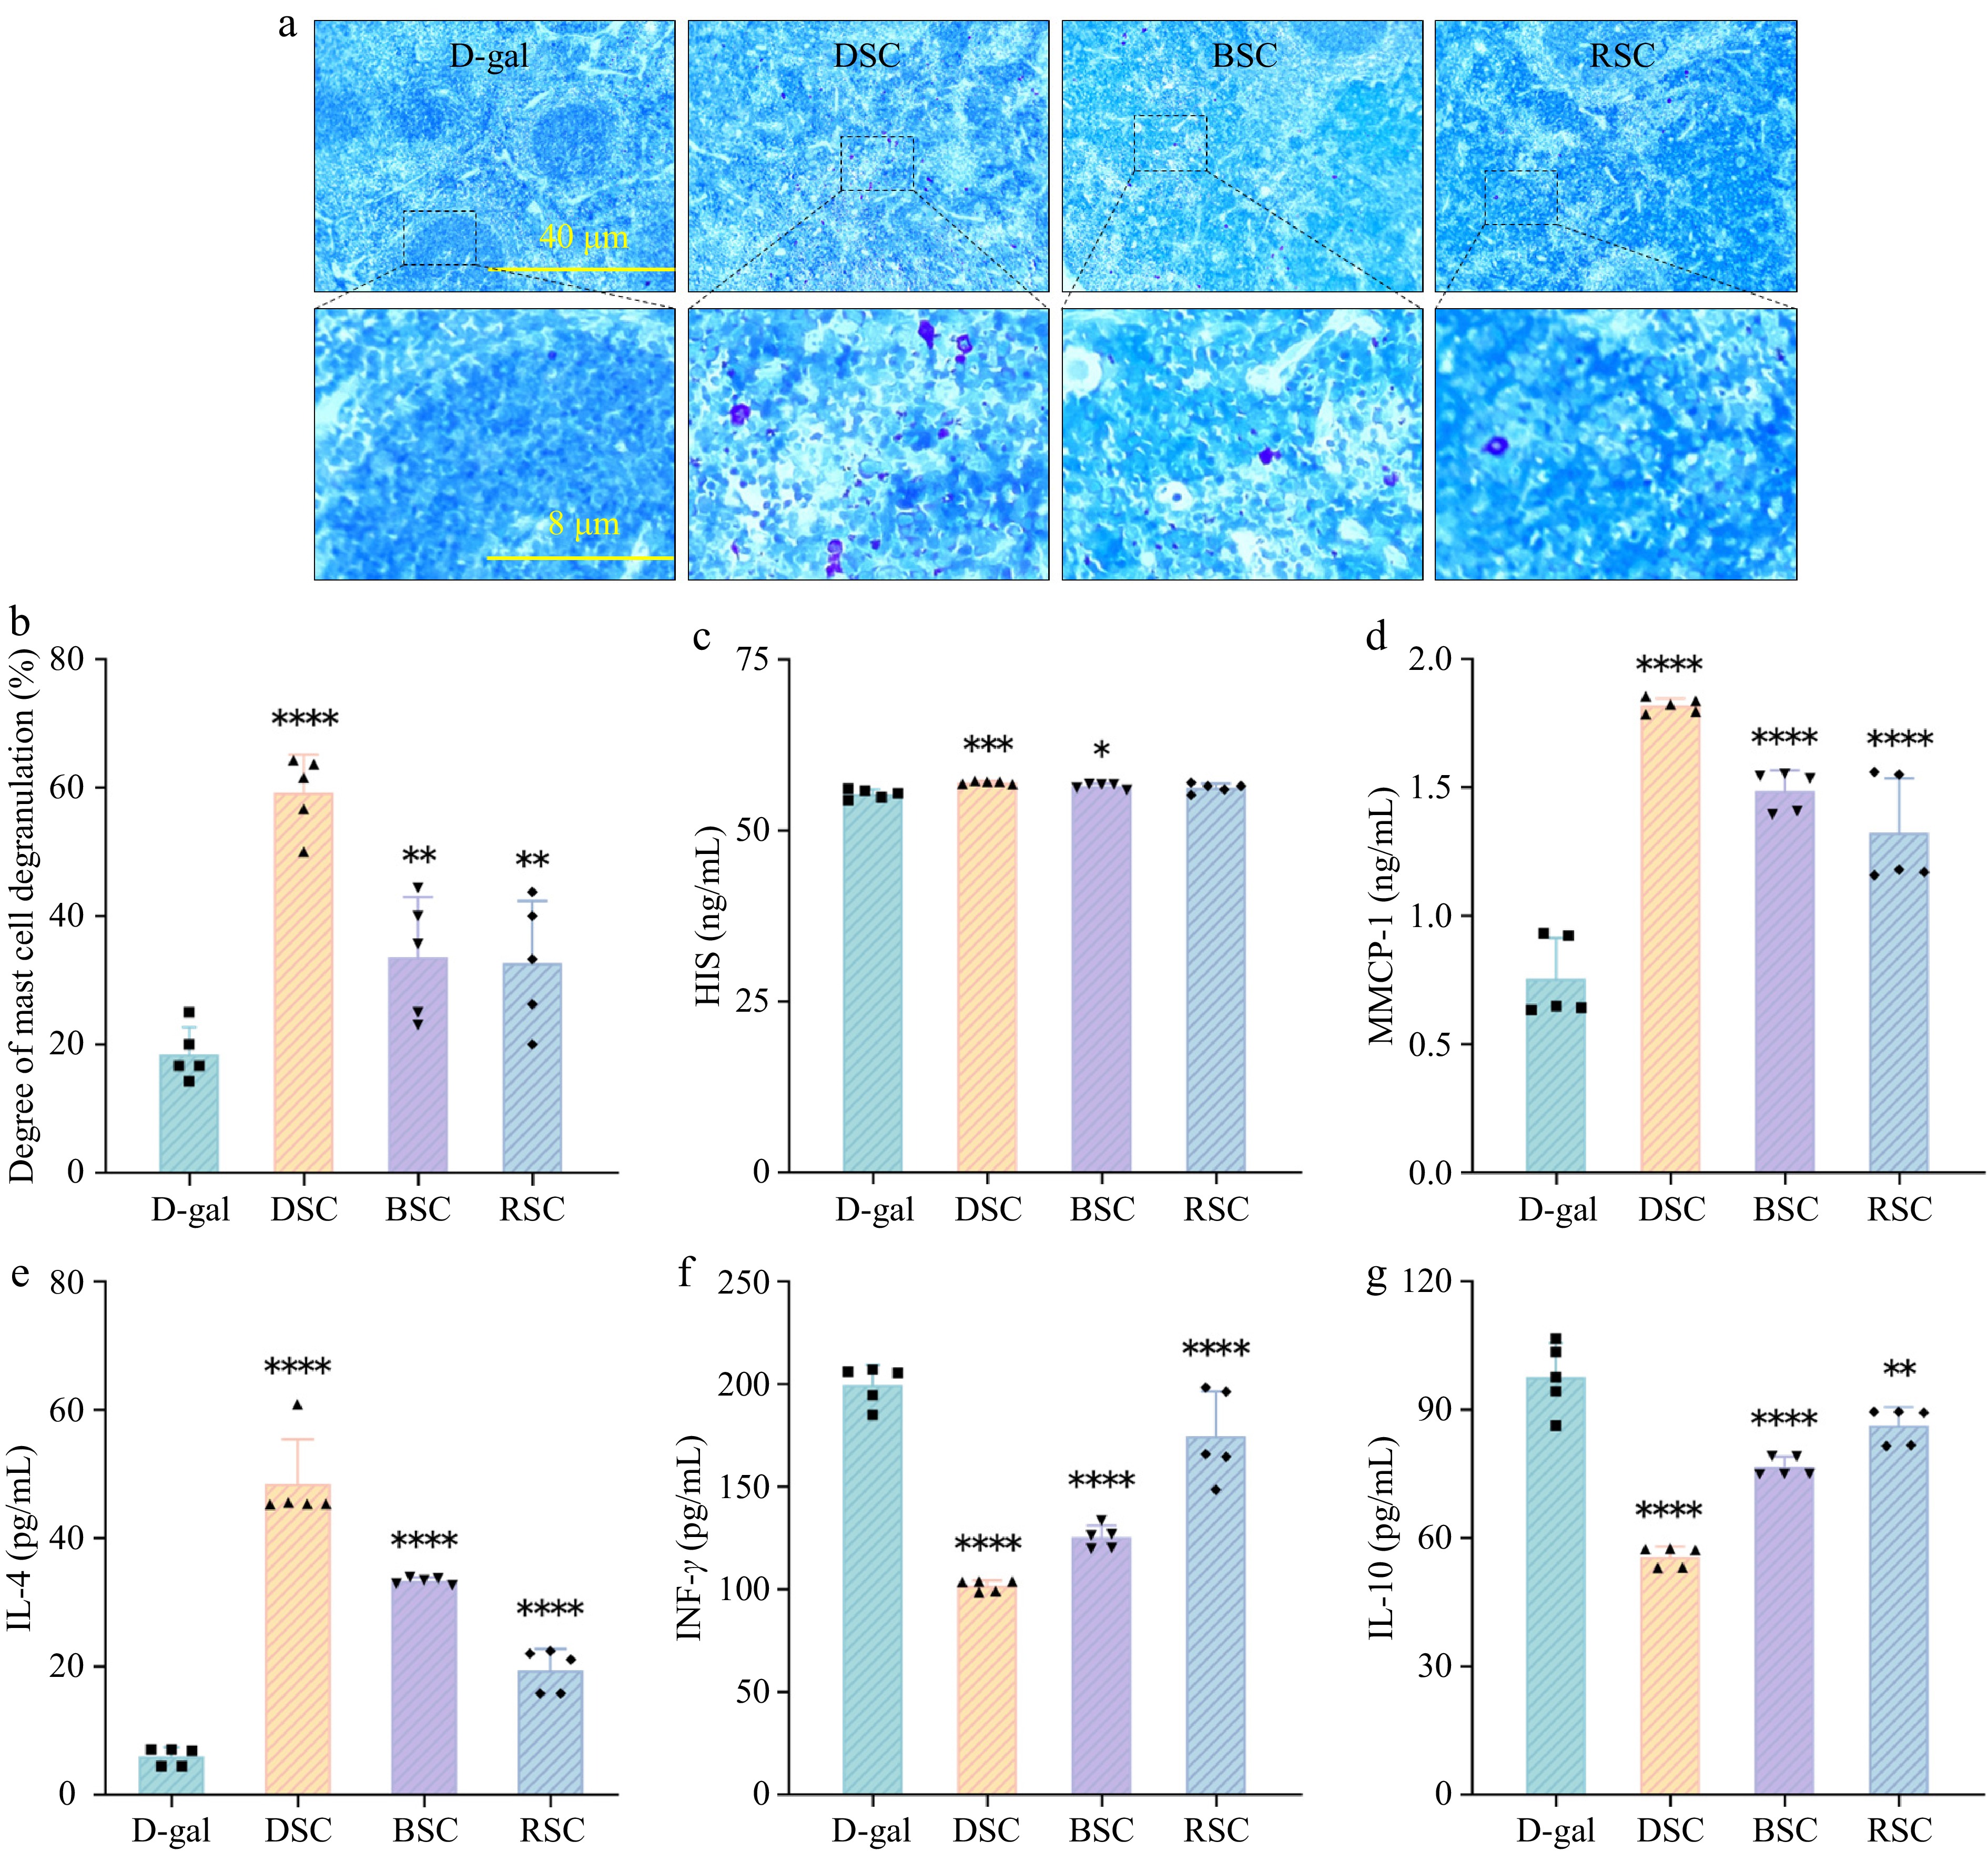
Figure 4.
Basophils degranulate and release inflammatory mediators. (a) Toluidine blue staining section of splenic basophils. (b) Degree of basophil degranulation in mouse spleen (n = 5). (c) Histamine (n = 5). (d) MMCP-1 (n = 5). (e) IL-4 (n = 5). (f) IFN-γ (n = 5). (g) IL-10 (n = 5). Different symbols '*' indicate significant differences compared to the D-gal group (p < 0.05).
-
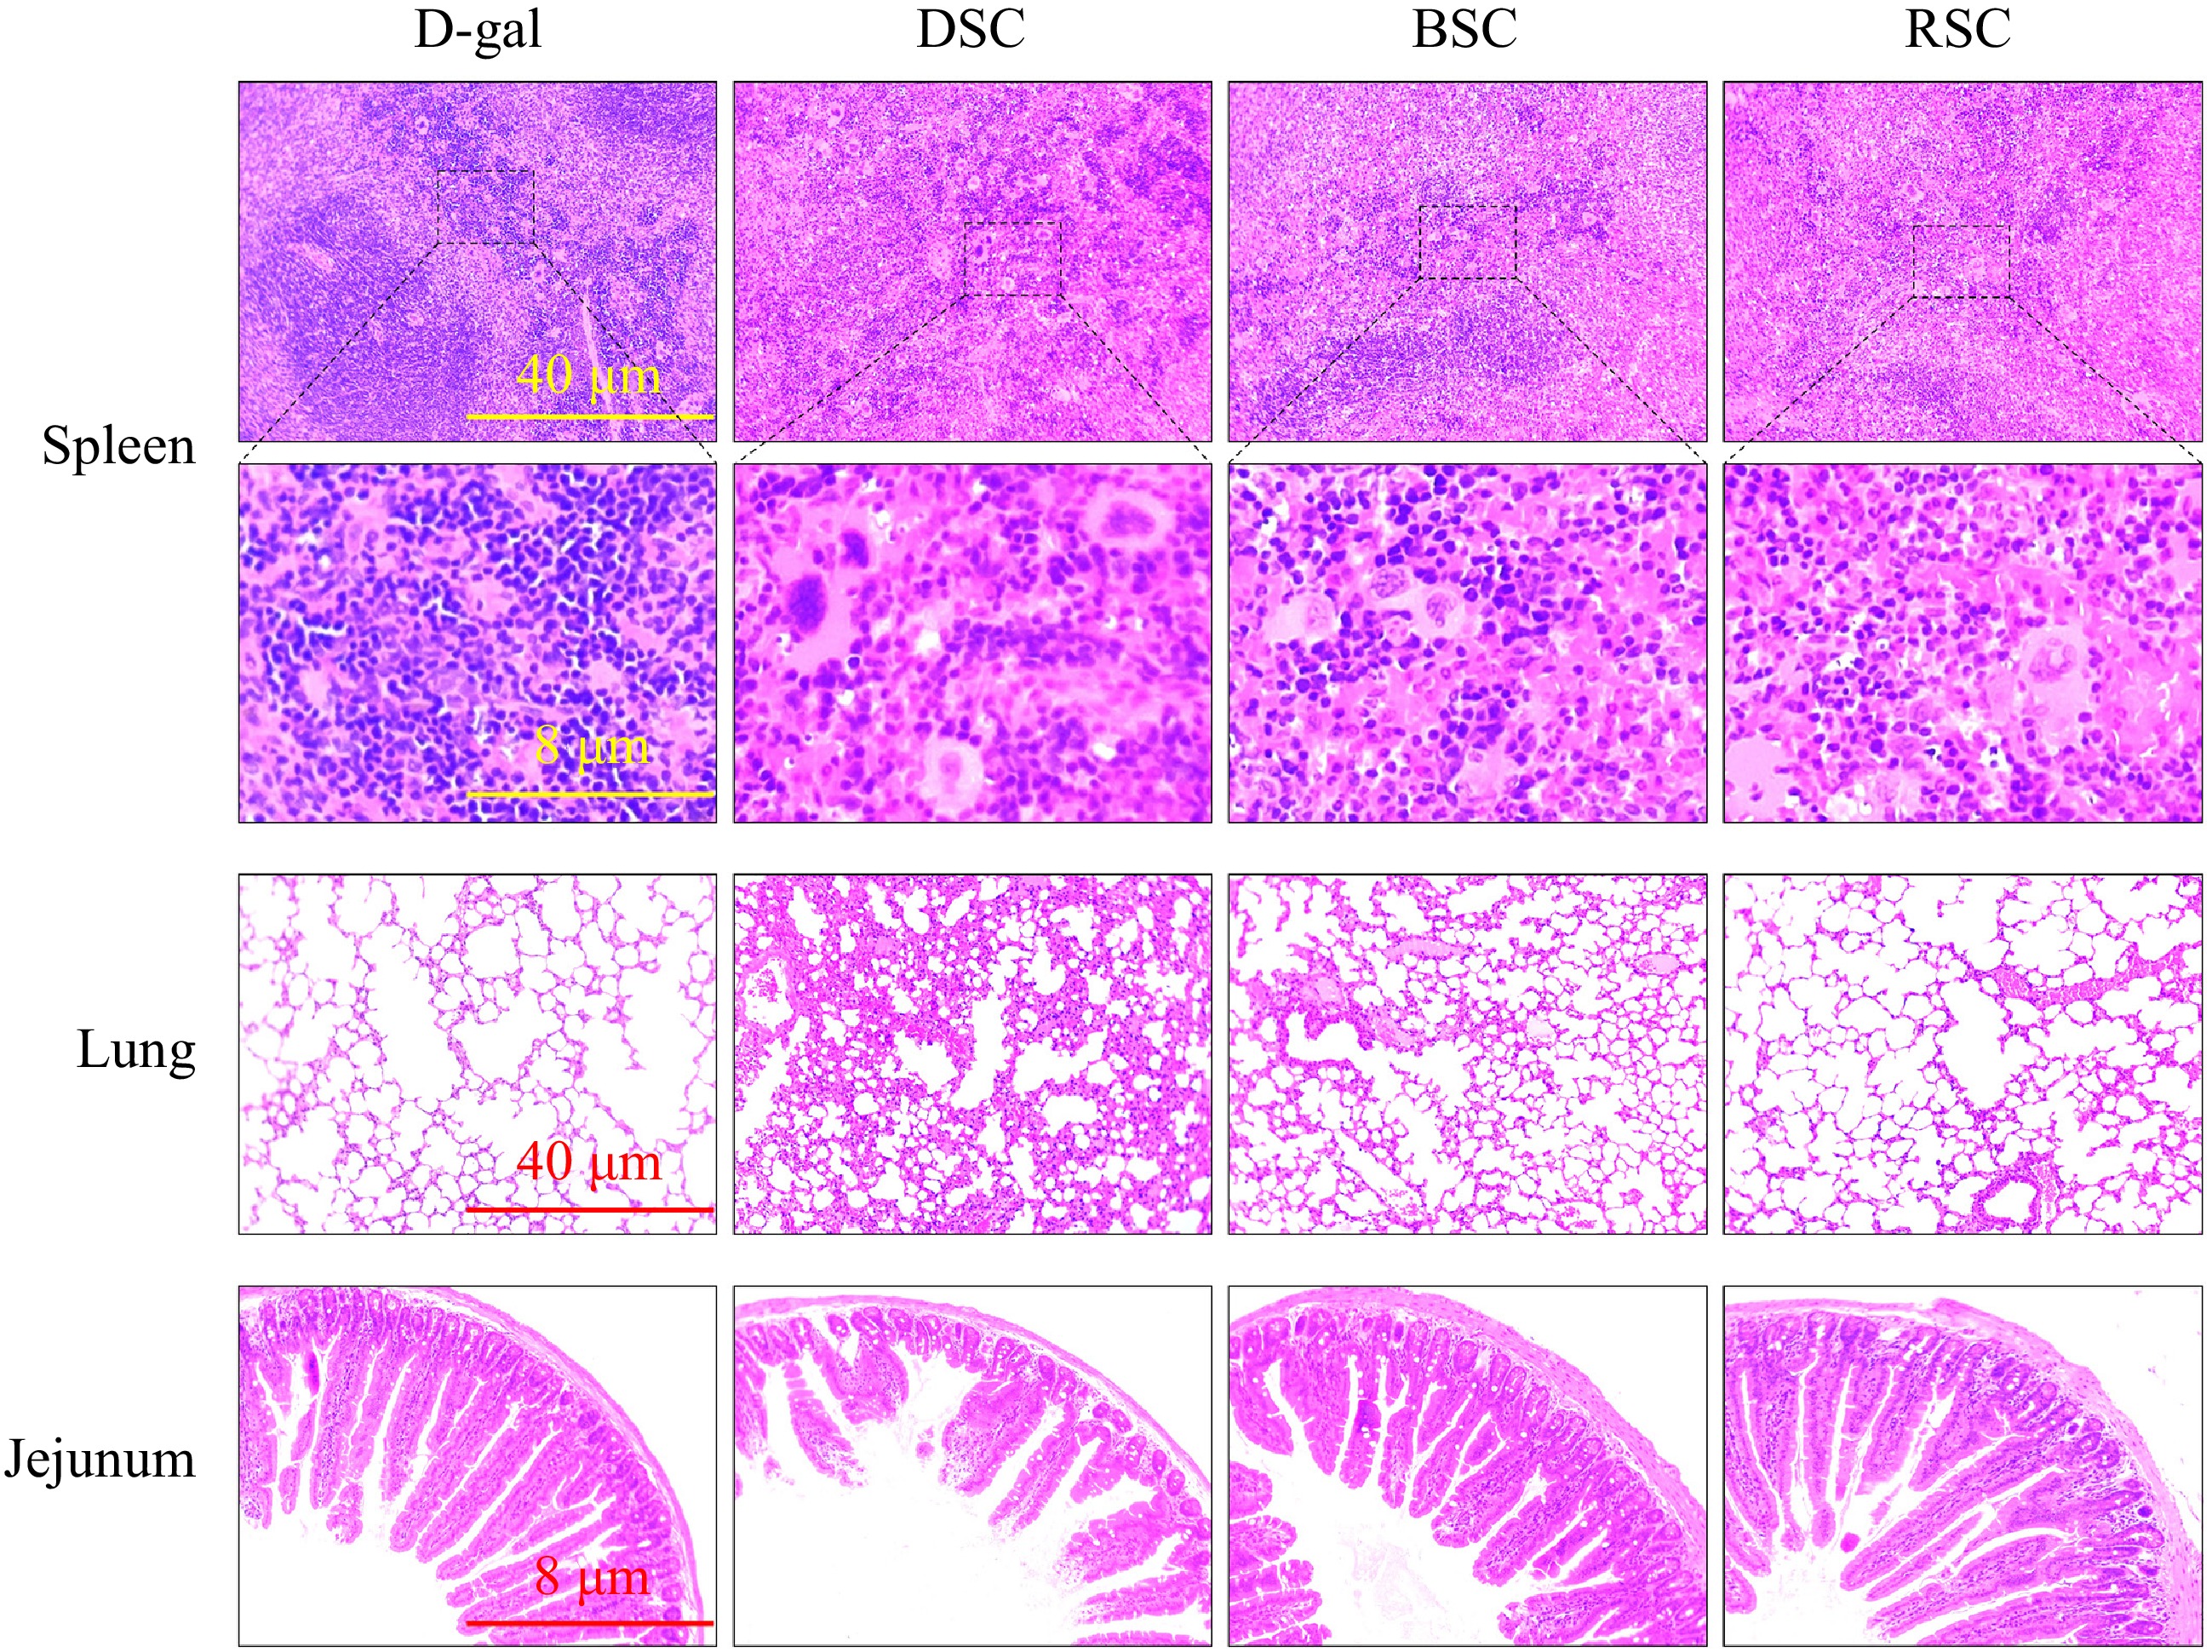
Figure 5.
Histopathological study of the spleen, lungs, and jejunum of sensitized mice. HE-stained sections of the spleen, lungs, and jejunum.
-
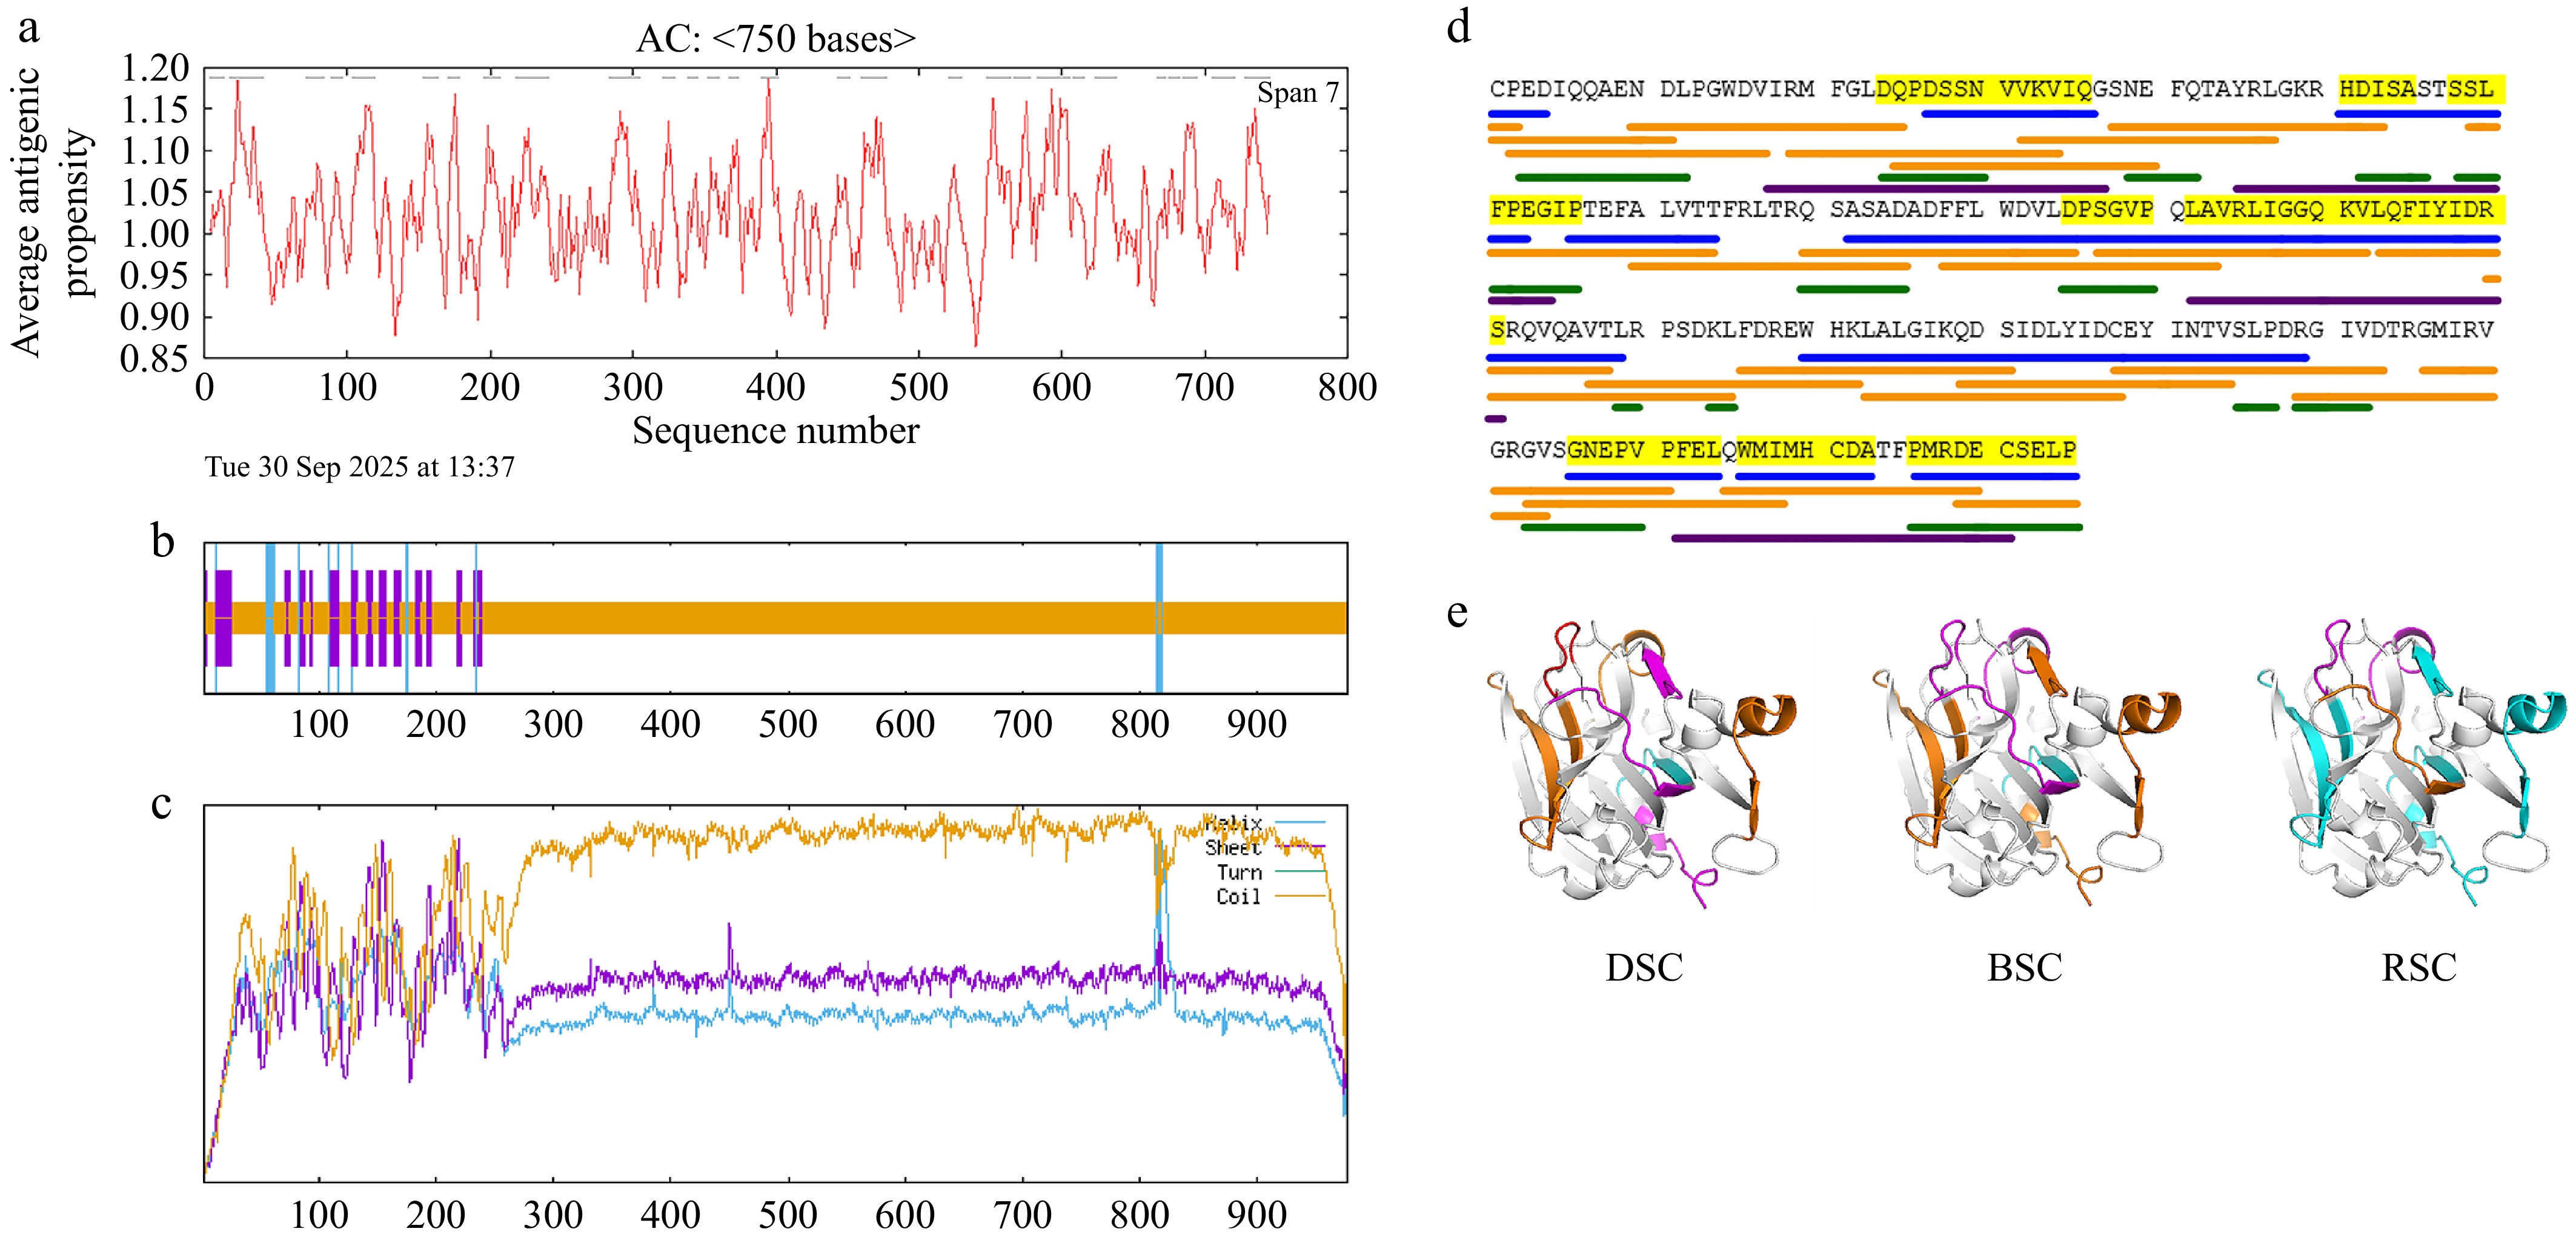
Figure 6.
Prediction results of antigen linear epitopes and their visual localization. (a) Immunomedicine group. (b) SOPMA. (c) KAJ8032882. Yellow represents linear epitopes. (d) KAJ8032882 in DSC, BSC, and RSC.
-
KAJ8032882 SVMTriP 18–37, 45–64, 102–121, 192–211 Immunomedicine group 1–4, 27–36, 51–63, 66–74, 82–129, 140–169, 186–194, 196–203, 206–215 SOPMA 3–12, 24–30, 39–42, 52–56, 58–66, 80–85, 95–100, 129–130, 134–135, 165–167, 169–172, 183–190, 206–215 ABCpred 1–2, 1–11, 2–17, 10–25, 19–24, 25–40, 32–47, 38–53, 59–74, 60–75, 80–95, 88–103, 97–112, 113–128, 120–135, 127–142,
136–151, 143–158, 149–164, 158–173, 169–184, 176–191, 183–198, 195–210, 209–215Table 1.
Prediction of linear epitopes of the main allergens of sea cucumbers.
Figures
(6)
Tables
(1)