-
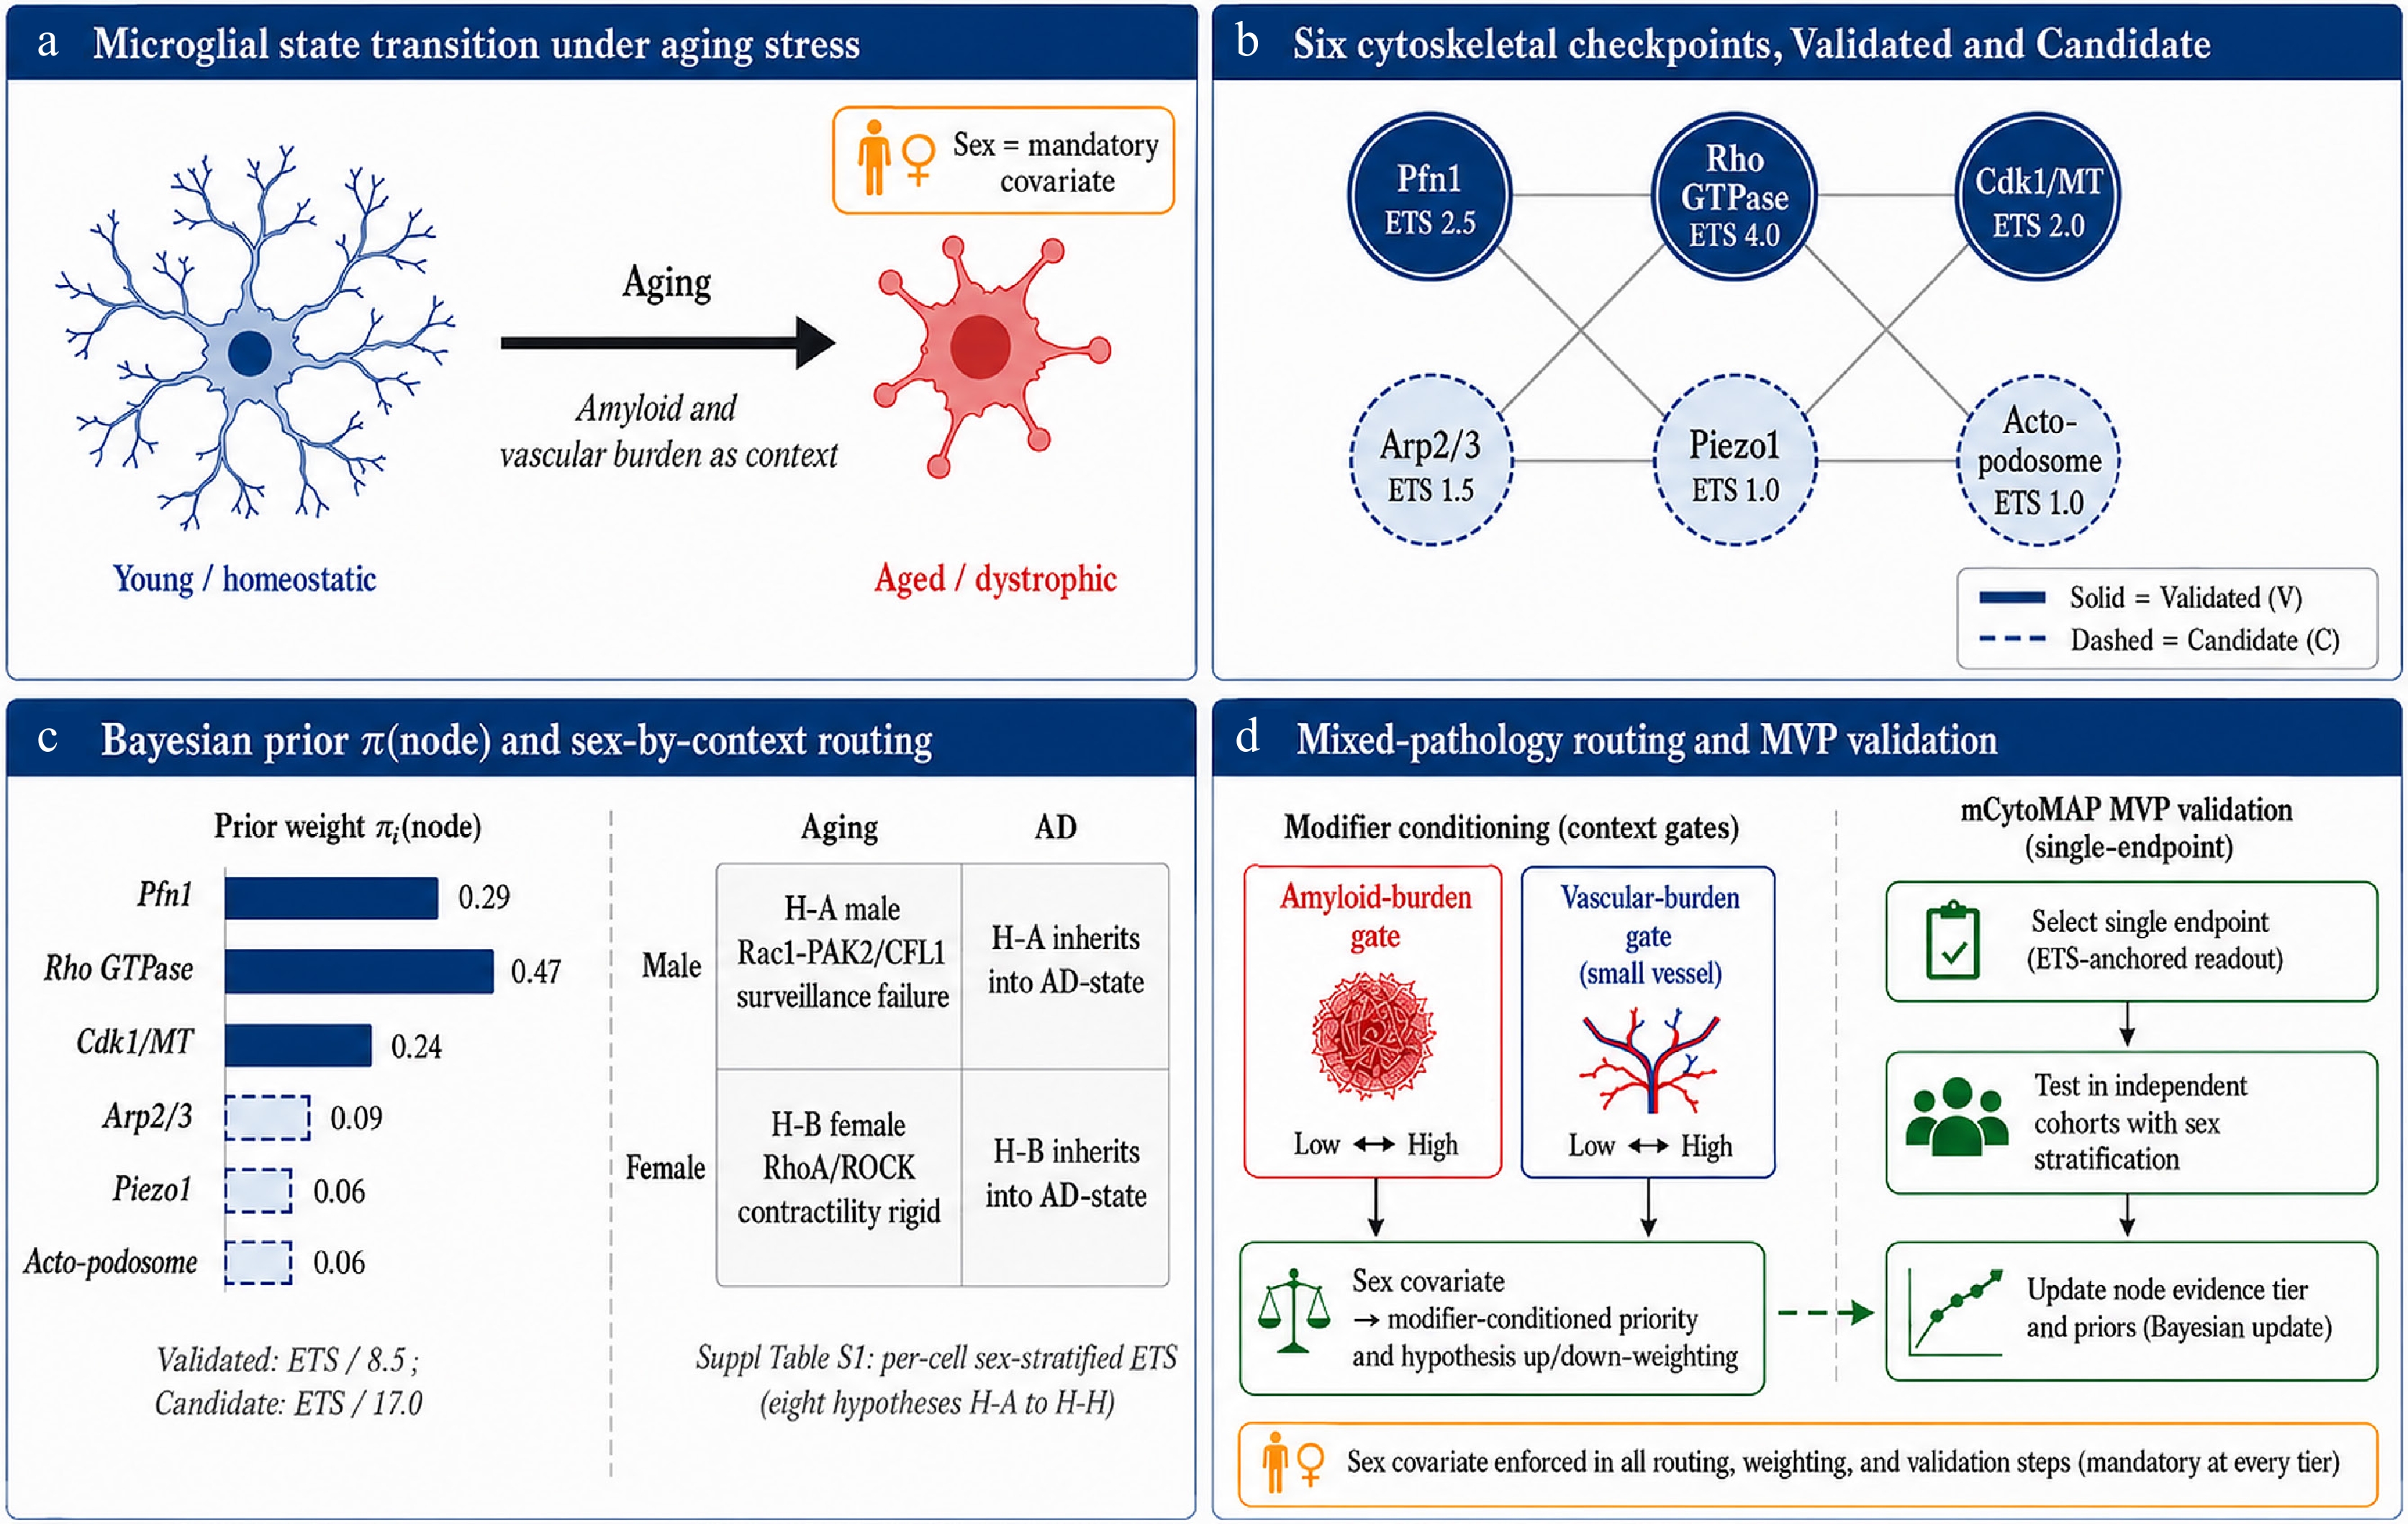
Figure 1.
Framework overview of cytoskeletal checkpoints as state-control nodes in the aging microglial targetome. (a) Microglial state transition under aging stress: young/homeostatic microglia (ramified, cool blue) shift to aged/dystrophic microglia (coral red) as aging proceeds, with amyloid and vascular burden acting as the disease-stage context. Sex is enforced as a mandatory covariate at every tier of the framework (gold-bordered badge). (b) Six cytoskeletal checkpoints organised by evidence tier: Pfn1, Rho GTPase network, and Cdk1/MT remodelling enter the Validated tier (solid borders) with Evidence-Tier Scores of 2.5, 4.0, and 2.0, respectively; Arp2/3 complex, Piezo1, and the actomyosin-podosome surveillance module enter the Candidate tier (dashed borders) with ETS values of 1.5, 1.0, and 1.0. (c) The Bayesian-style prior π(node) follows the two-tier normalisation rule (Validated: ETS/8.5; Candidate: ETS/17.0), giving per-node weights of 0.29 (Pfn1), 0.47 (Rho GTPase), 0.24 (Cdk1/MT), 0.09 (Arp2/3), 0.06 (Piezo1), and 0.06 (actomyosin–podosome). The sex-by-context routing grid (Male/Female × Aging/AD) maps to the H-A directional working hypothesis (male = Rac1-PAK2/CFL1 surveillance failure) and H-B (female = RhoA/ROCK contractility-rigid state), with the full per-cell sex-stratified ETS matrix and the eight directional hypotheses H-A through H-H in Supplementary Table S1. (d) Mixed-pathology routing and MVP validation: amyloid-burden and vascular-burden context gates re-weight the six-node ETS prior and up- or down-weight the relevant directional hypotheses; the resulting prior is then tested through the single-endpoint mCytoMAP MVP validation pathway, selection of a single sex-stratified ETS-anchored readout, testing in independent cohorts with sex stratification, and Bayesian update of node evidence tiers and priors. Sex covariate enforcement is mandatory in all routing, weighting, and validation steps.
-
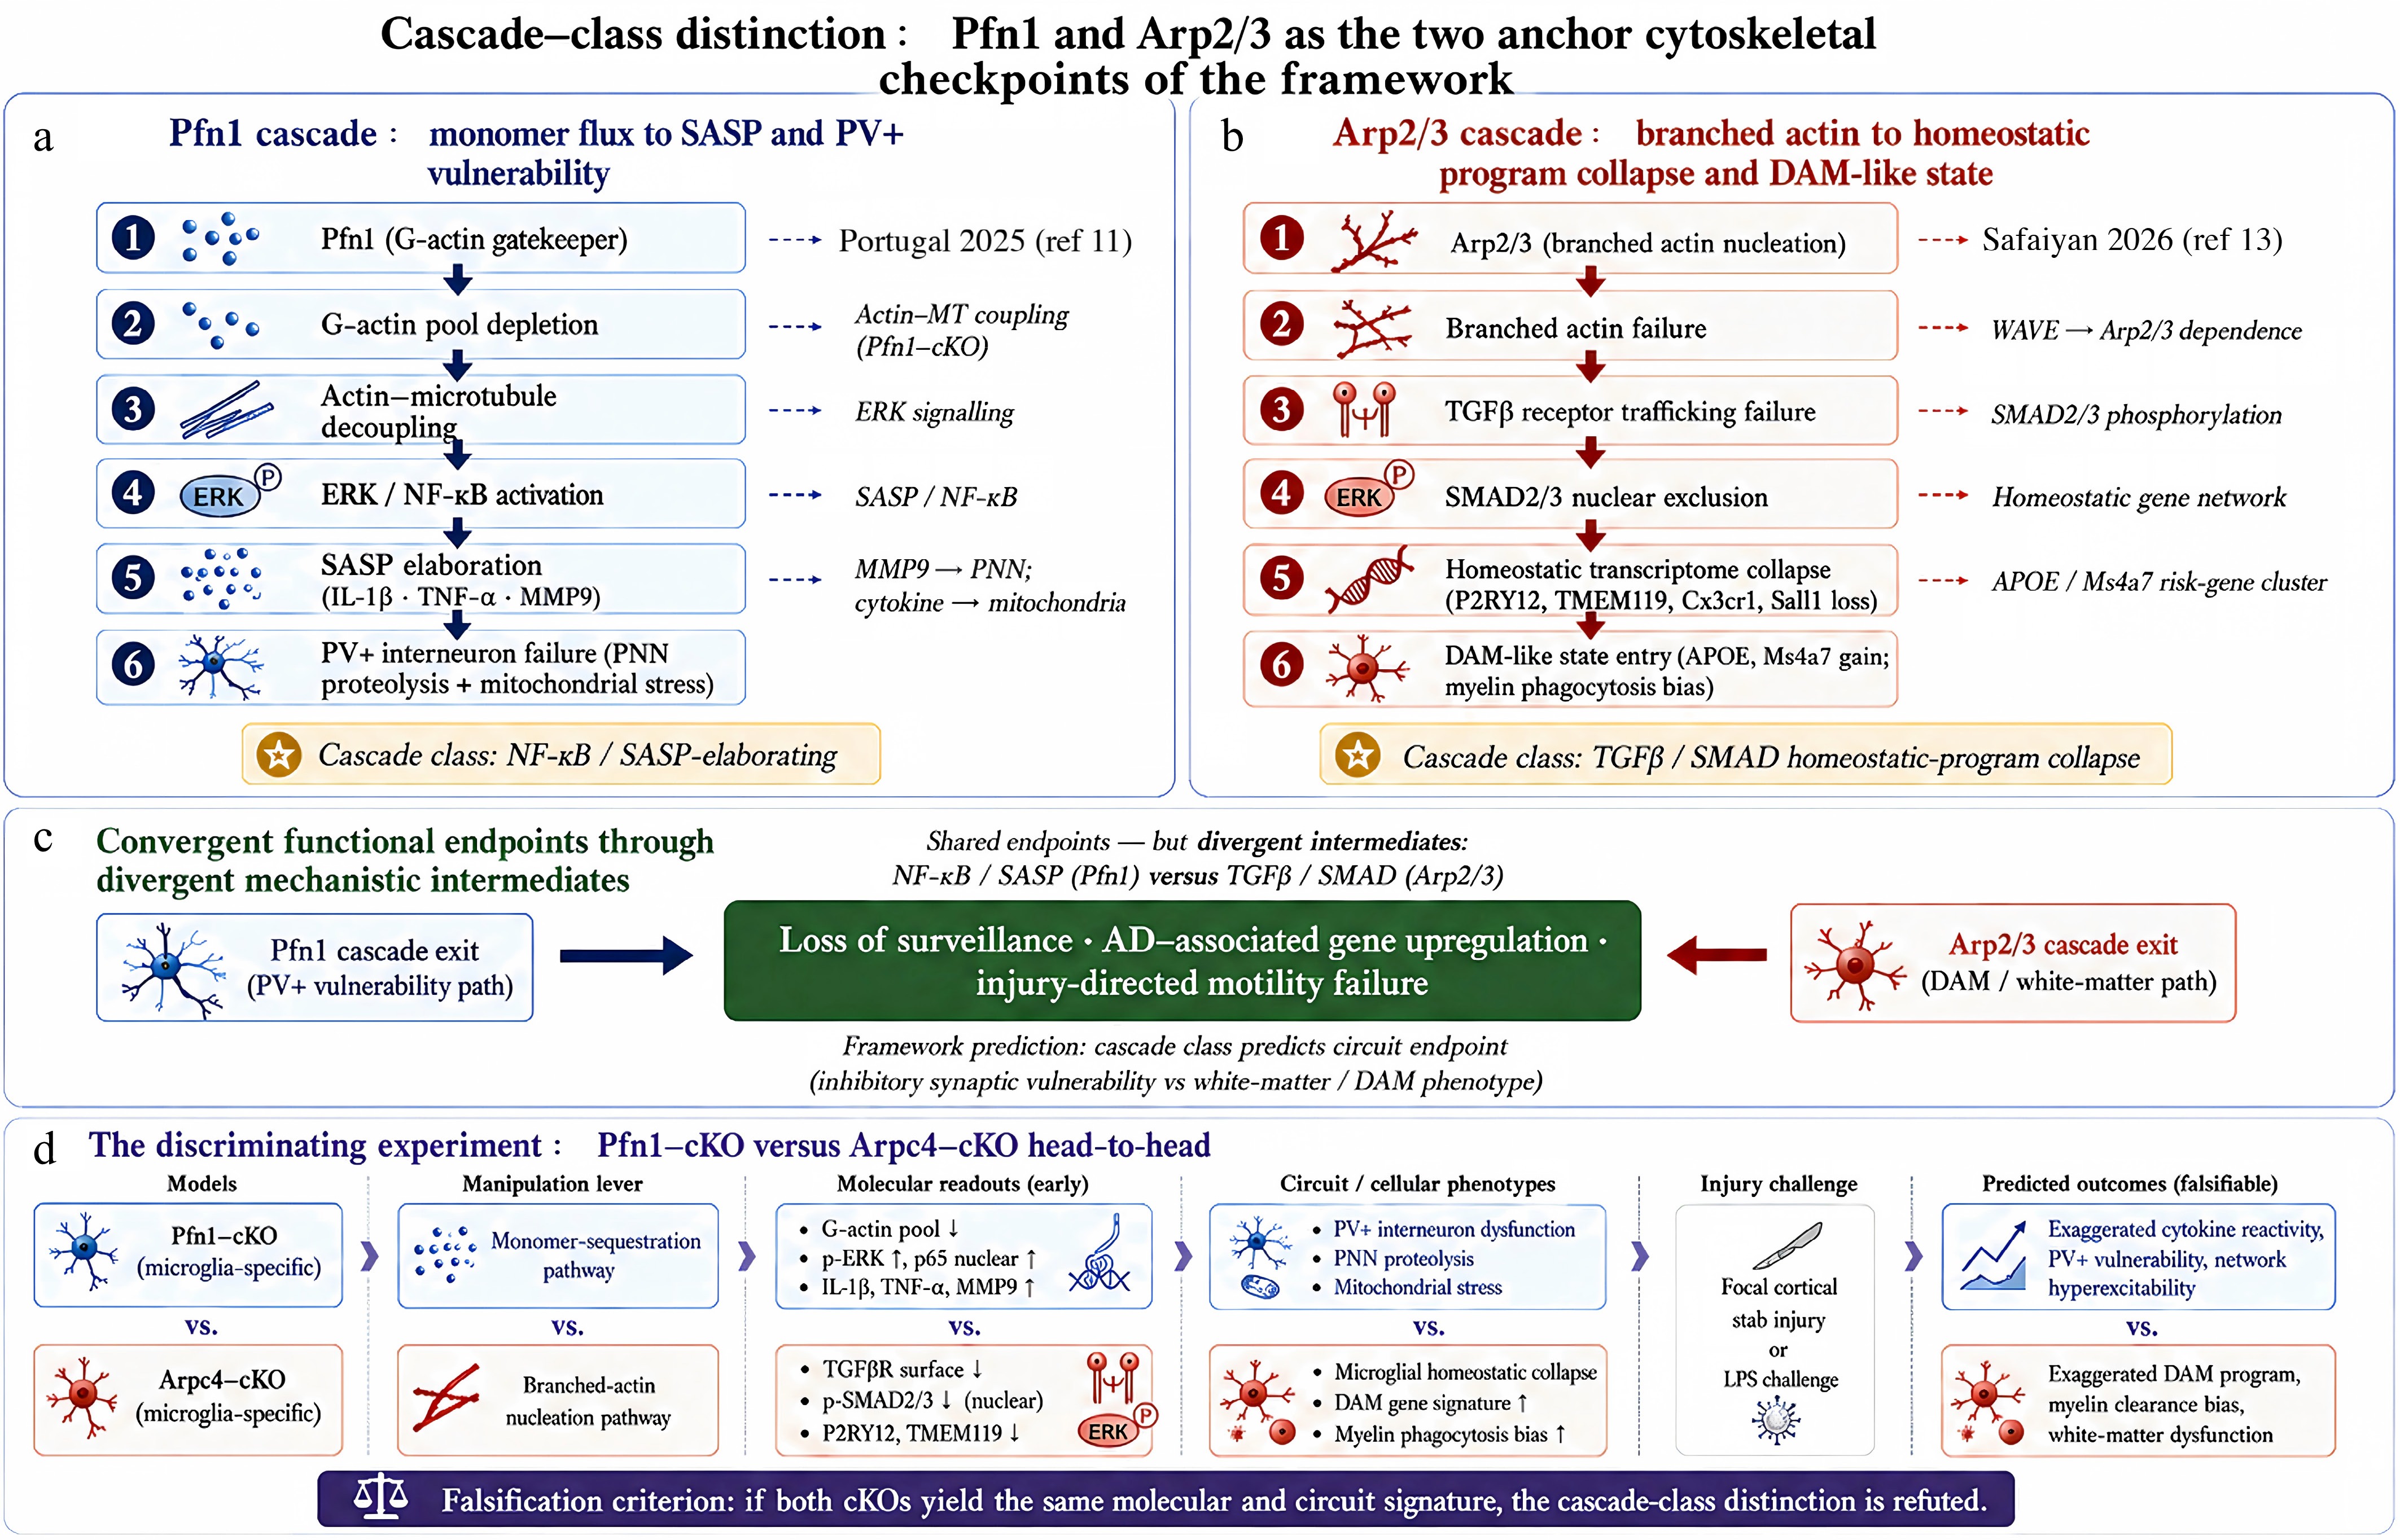
Figure 2.
Pfn1 and Arp2/3 as the two anchor cytoskeletal checkpoints of the cascade-class distinction framework. (a) The Pfn1 cascade: actin-monomer-handling failure drives sequential decoupling of actin-microtubule coordination, ERK/NF-κB activation, SASP elaboration (IL-1β, TNF-α, MMP9), and selective parvalbumin-positive (PV+) interneuron failure through combined MMP9-driven perineuronal-net proteolysis and cytokine-driven bioenergetic stress on fast-spiking interneurons; mechanistic anchors are the adult-onset microglia-specific Pfn1-cKO[11], microglial PNN proteolysis in AD brain[34], and PNN-buffered PV+ redox protection[35]. (b) The Arp2/3 cascade: branched-actin nucleation failure aborts TGFβ receptor trafficking, excludes phospho-SMAD2/3 from the nucleus, collapses the homeostatic transcriptional program (P2RY12, TMEM119, Cx3cr1, Sall1 loss), and drives DAM-like state entry with APOE/Ms4a7 gain and myelin-phagocytic bias; mechanistic anchor is conditional Arpc4-KO microglia[12]; constitutive Cx3cr1-Cre, so developmental and adult-onset contributions remain confounded, see Limitations. (c) The two cascades converge on shared functional endpoints, loss of surveillance, AD-associated gene upregulation, and injury-directed motility failure, through divergent mechanistic intermediates (NF-κB/SASP for Pfn1; TGFβ/SMAD for Arp2/3). The framework prediction is that cascade class, not the specific molecule, determines the circuit-level endpoint: inhibitory synaptic vulnerability for NF-κB/SASP-elaborating cascades, and white-matter/DAM phenotype for TGFβ/SMAD-collapsing cascades. (d) The discriminating experiment is a side-by-side adult-onset, microglia-specific Pfn1-cKO vs Arpc4-cKO comparison (sex-stratified) with five matched cortical readouts, MMP9 zymography, perineuronal-net integrity (WFA/aggrecan around PV+ cells), PV+ firing-fidelity together with mitochondrial respiration on PV-sorted cells, gamma-band local field potential power, and TGFβ/SMAD phosphorylation together with the homeostatic gene panel. The predicted-outcome matrix (cool blue = Pfn1-cKO cascade-positive; coral red = Arpc4-cKO cascade-positive) operationalises framework falsifiability: statistical equivalence of the two knockouts' multivariate readout profiles, tested within pre-specified margins under a genotype × sex model, would refute the cascade-class distinction. This experiment has not yet been performed.
-
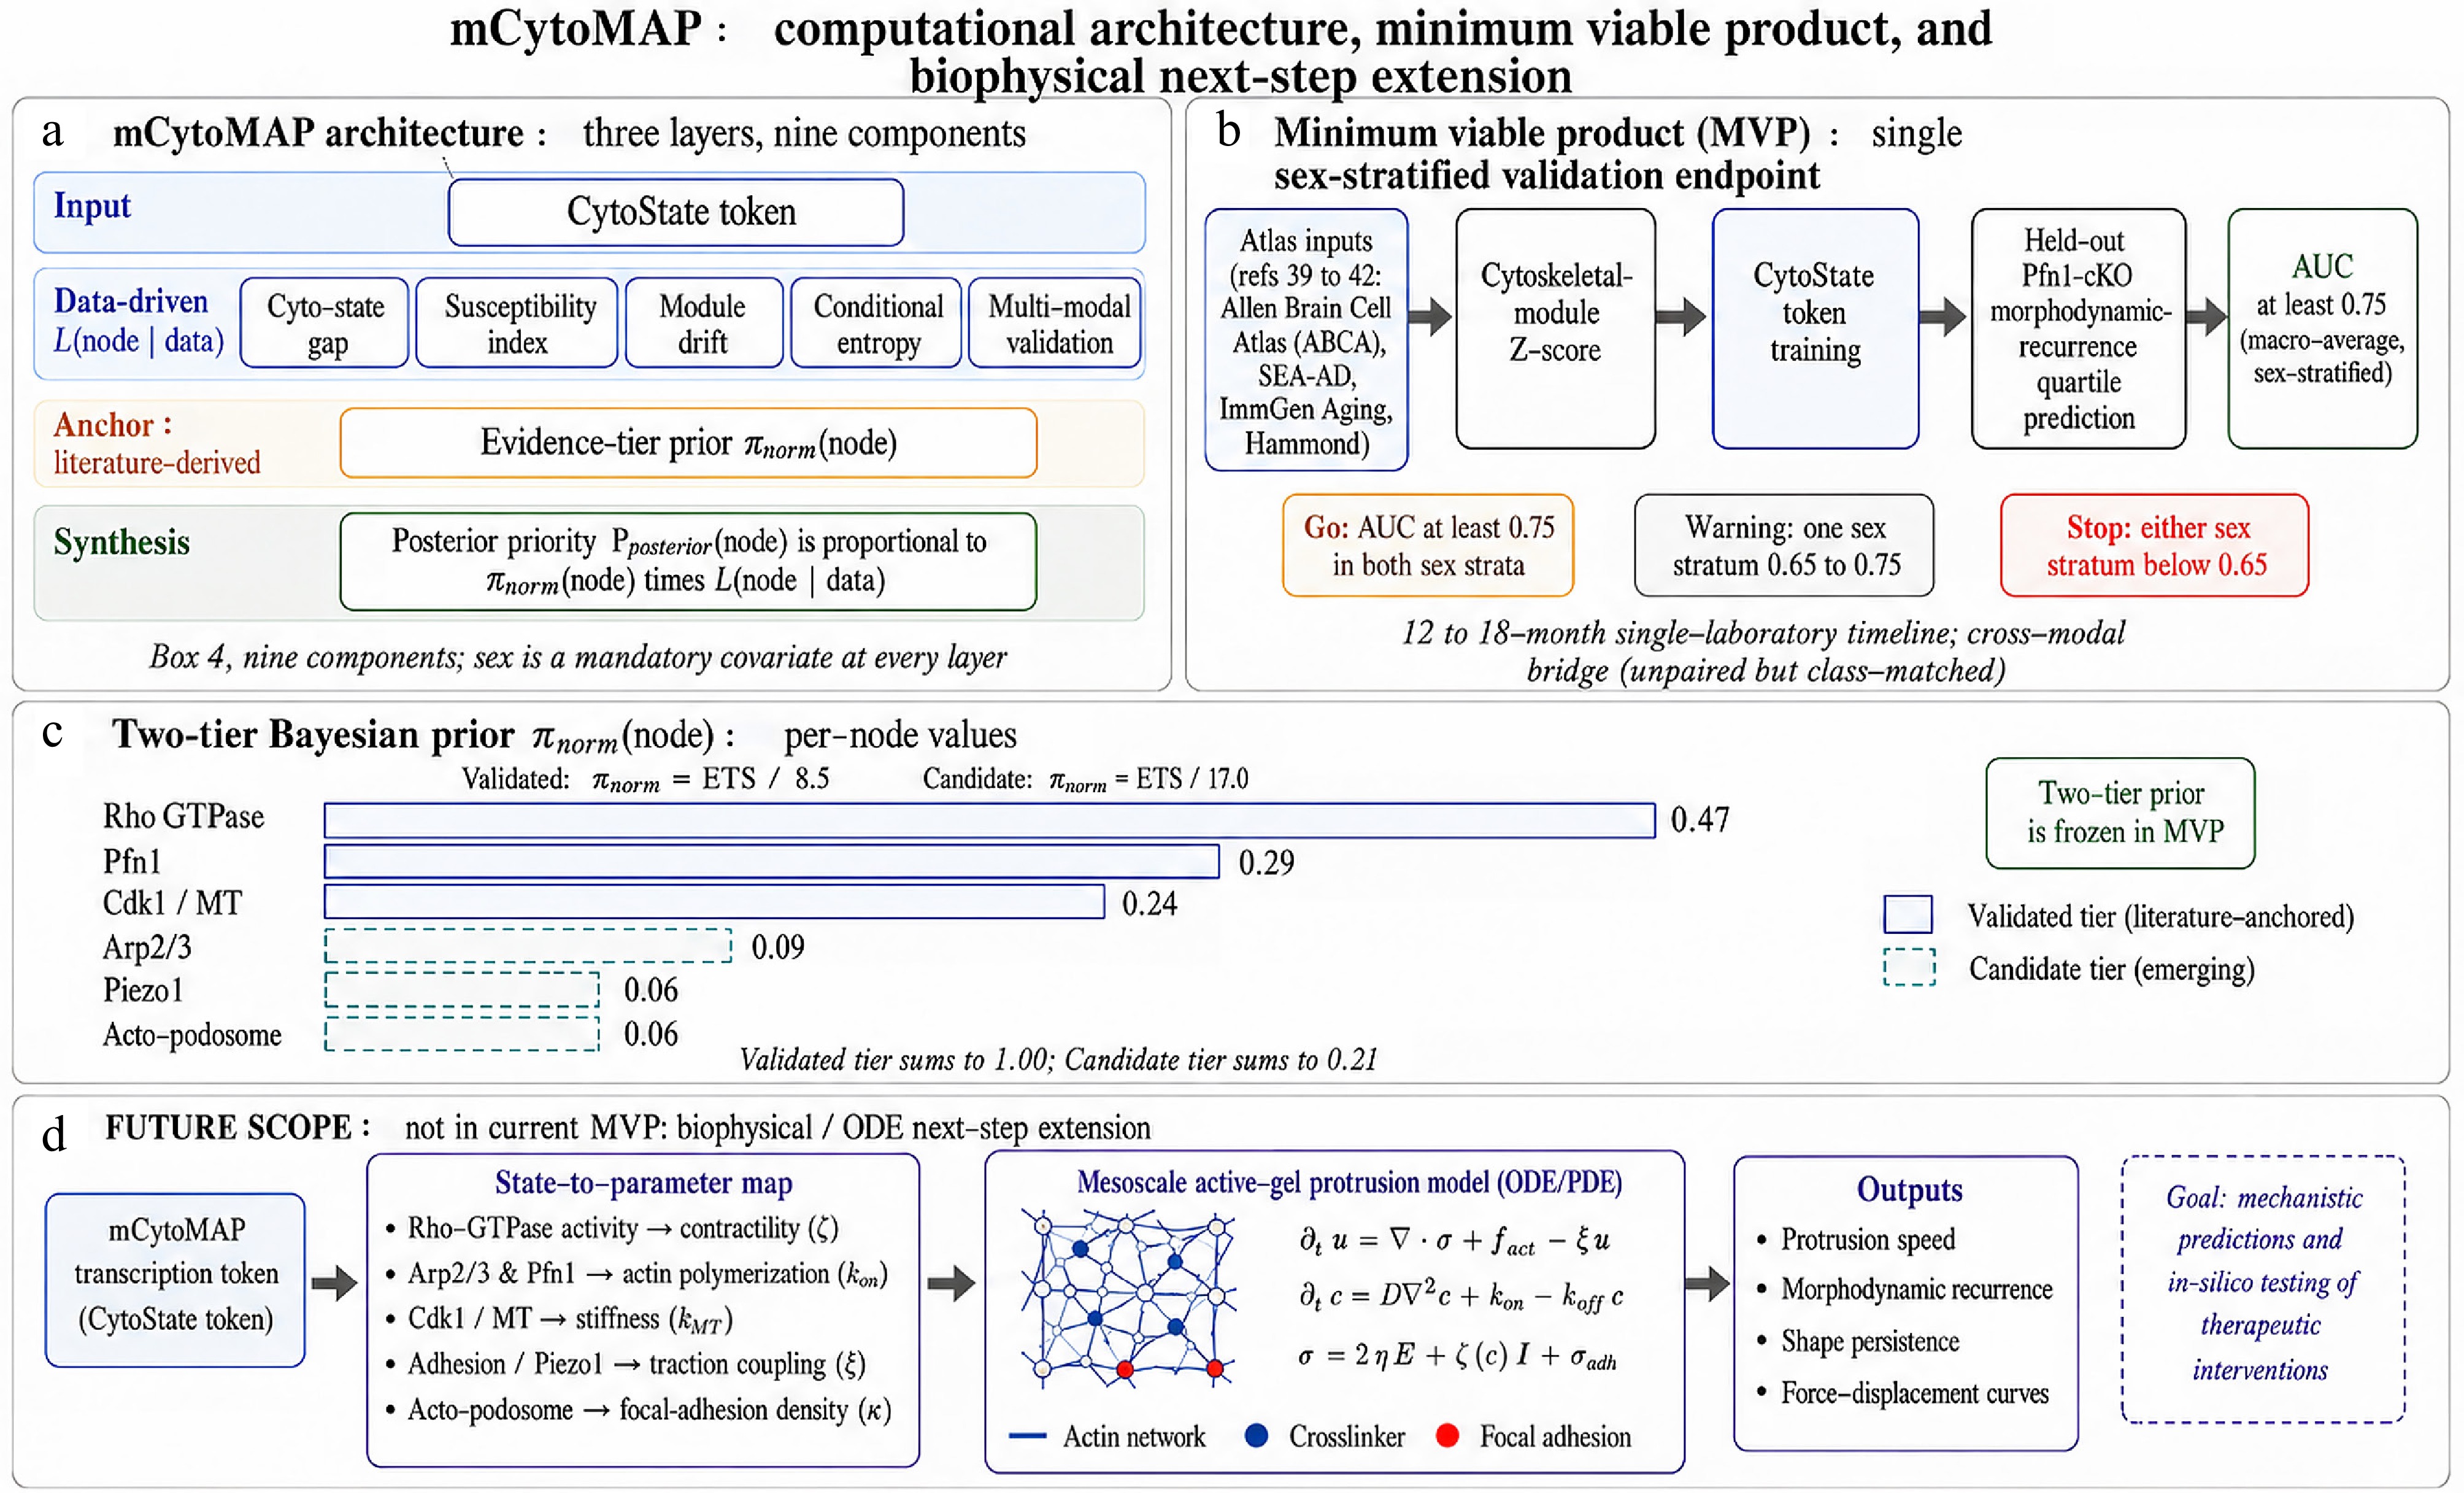
Figure 3.
Computational architecture, minimum viable product, and biophysical next-step extension of mCytoMAP. (a) mCytoMAP architecture organised in three layers and nine components (Supplementary Box 4). The Input layer carries the CytoState token (a learned multi-omic embedding of actin-microtubule coordination state). The Data-driven L(node|data) layer carries five components: cyto-state gap, susceptibility index, module drift, conditional entropy, and the multi-modal validation layer (live imaging + phosphoproteomics + electrophysiology). The Anchor layer carries the literature-derived Evidence-tier prior πnorm(node). The Synthesis layer carries the posterior priority Pposterior(node)
$\varpropto $ $\triangledown \cdot \sigma $ $\triangledown $ -
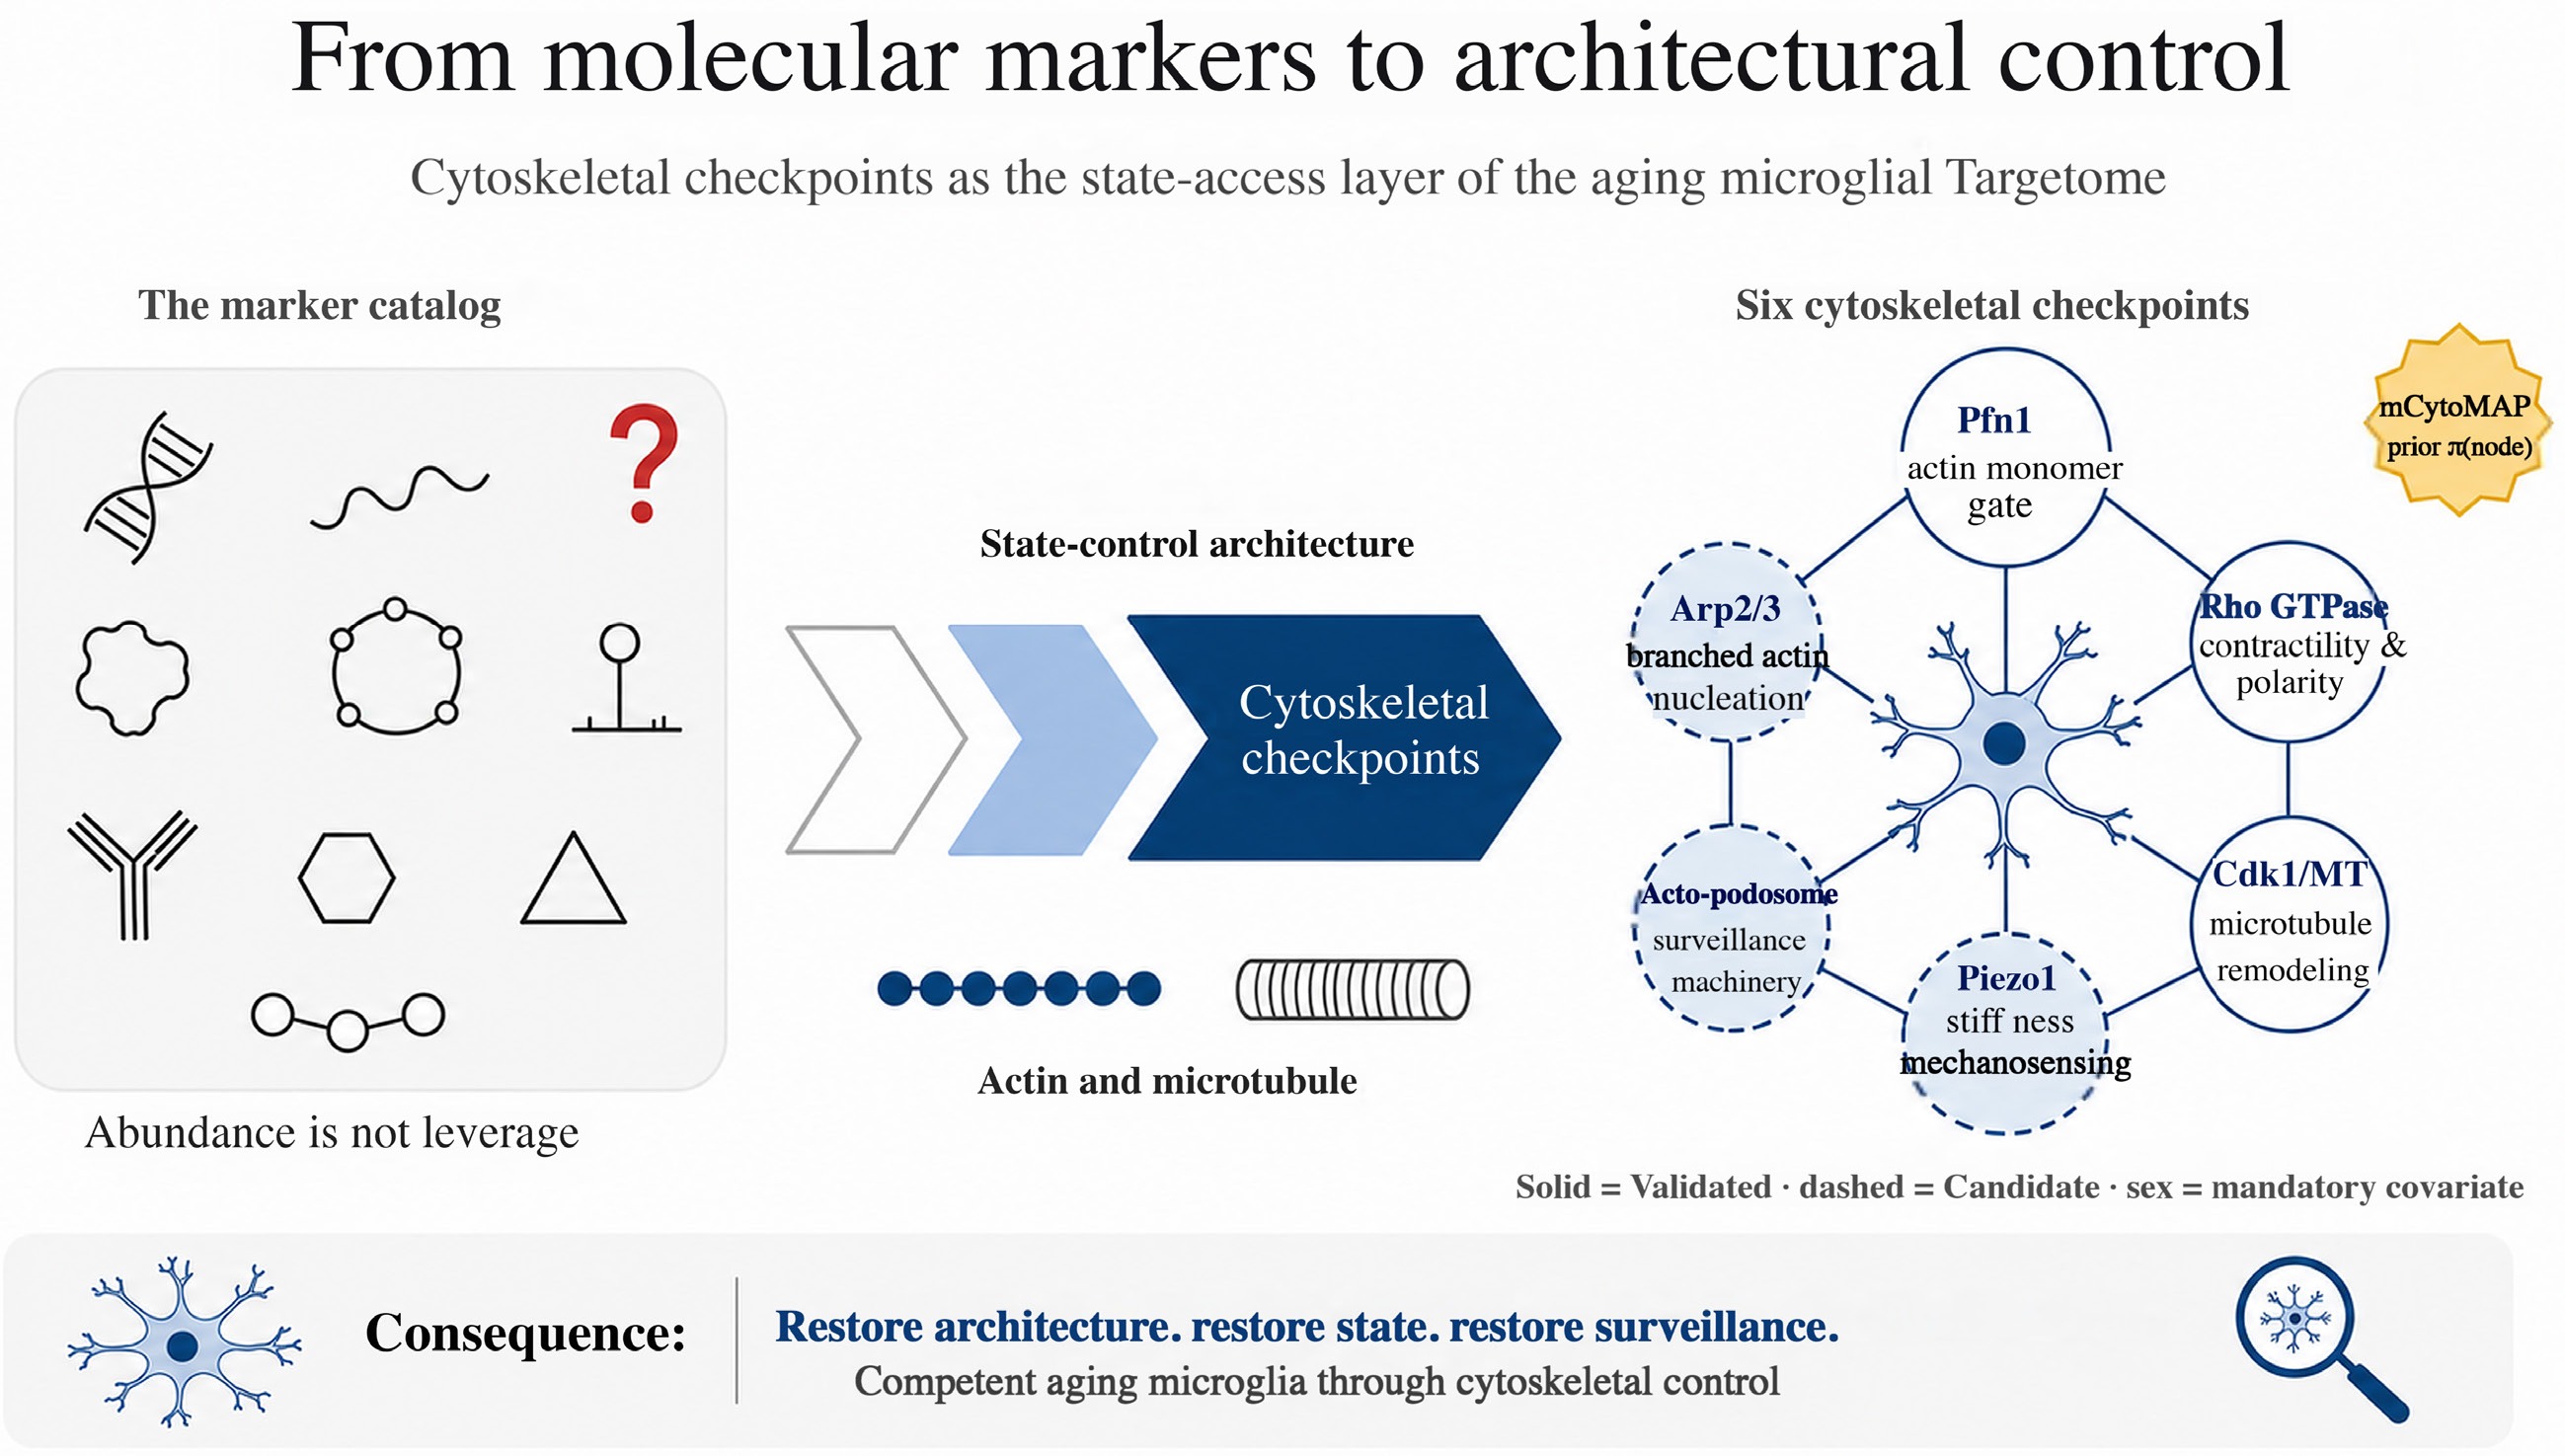
Figure 4.
From molecular markers to architectural control.
Figures
(4)
Tables
(0)