-
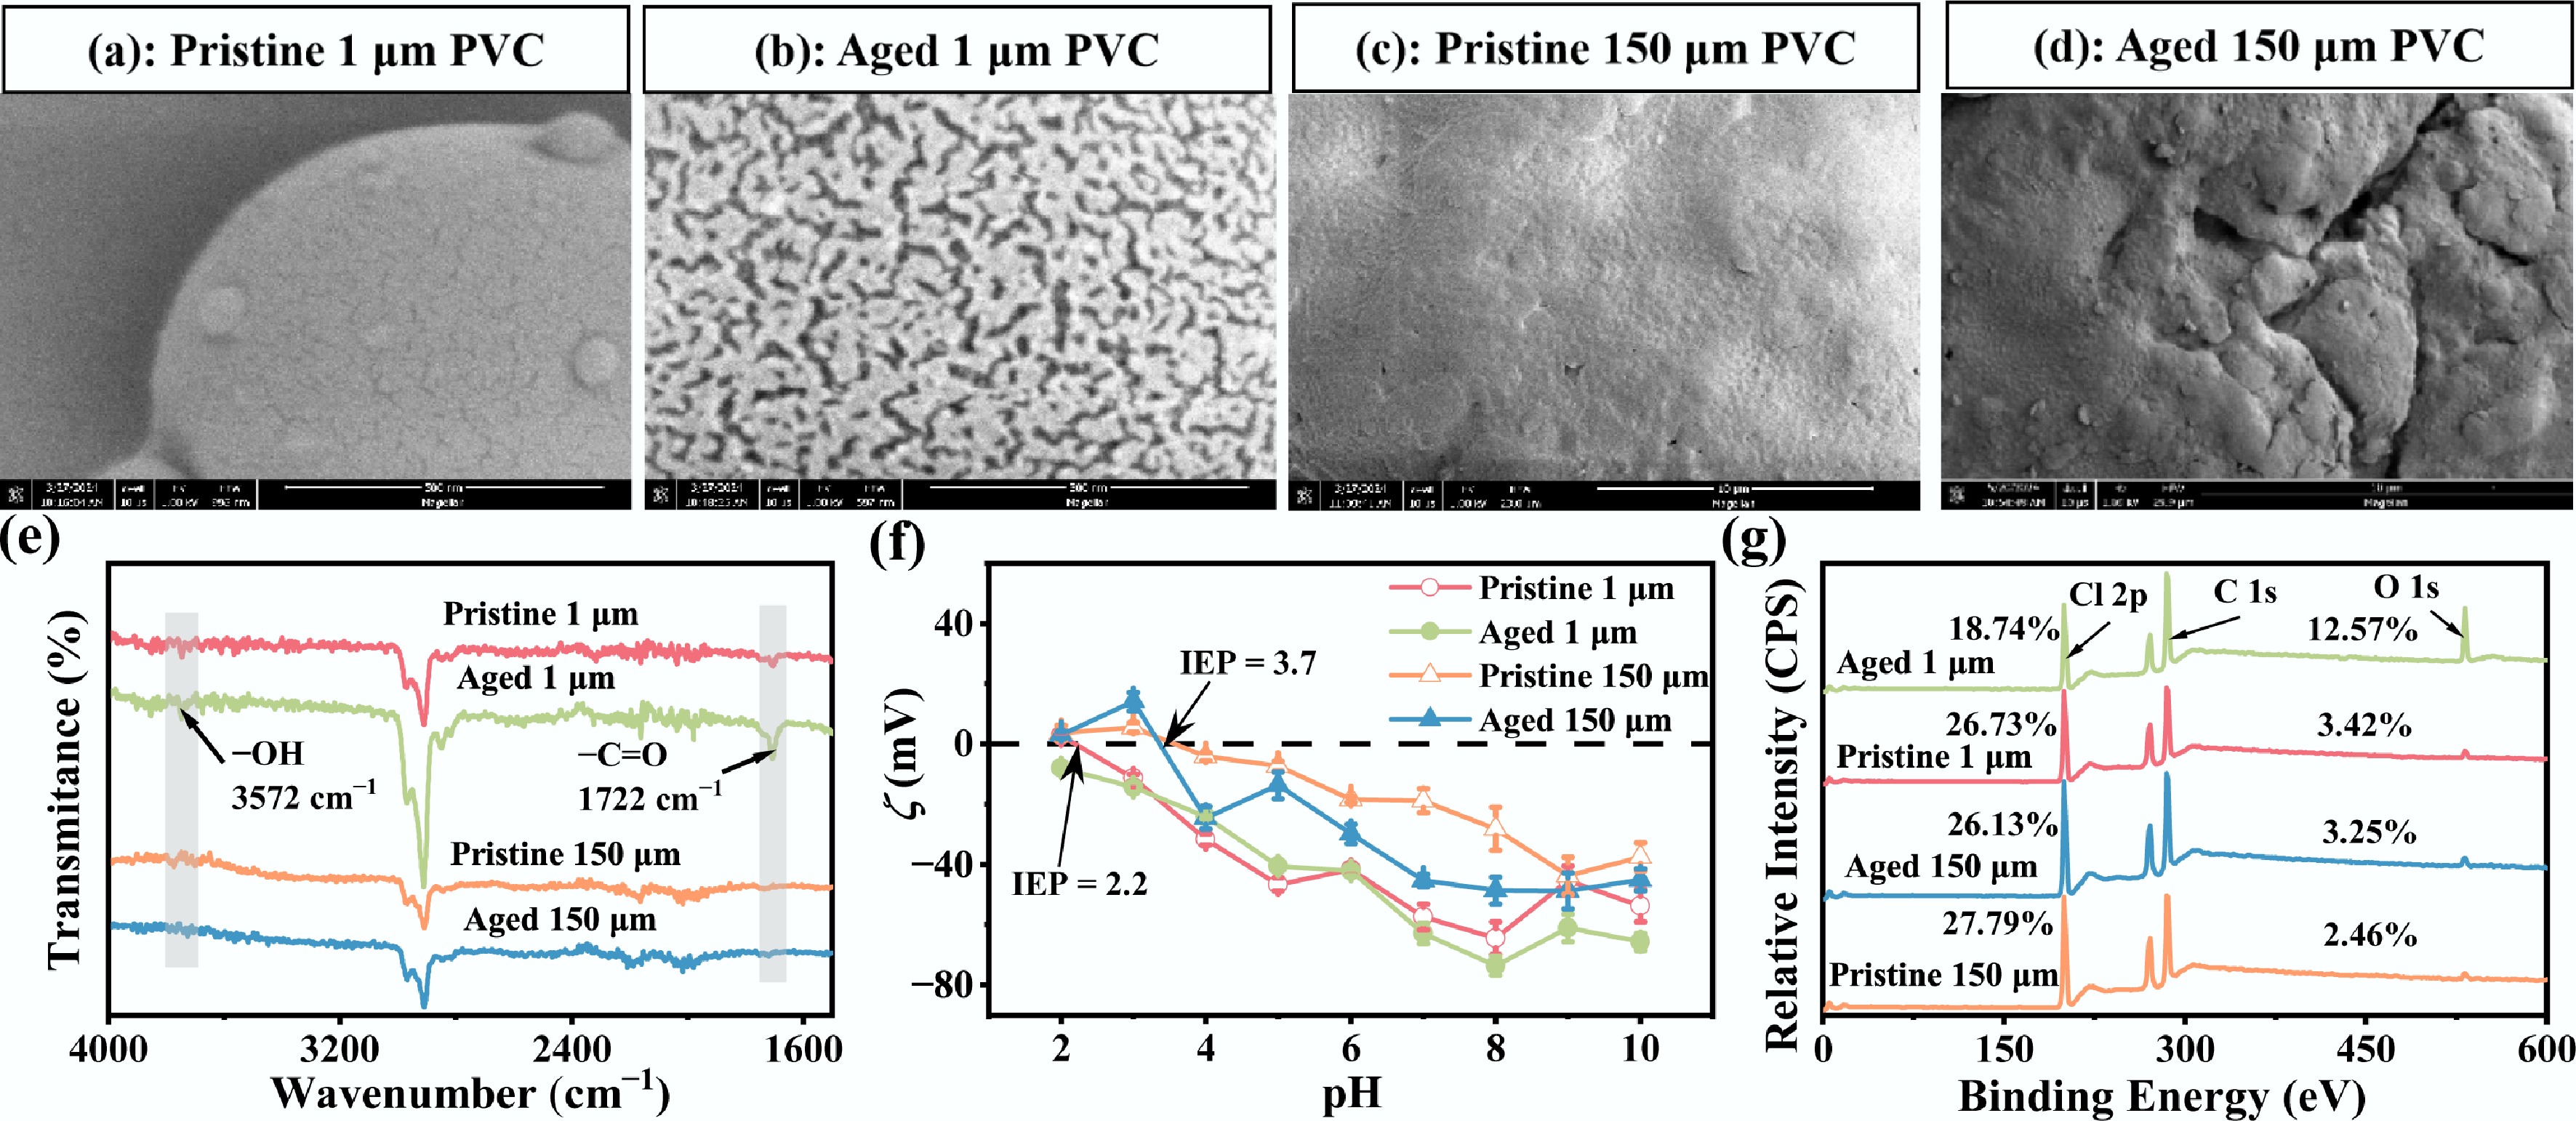
Figure 1.
Scanning electron microscopy images of (a) pristine 1 μm PVC, (b) aged 1 μm PVC, (c) pristine 150 μm PVC, and (d) aged 150 μm PVC. (e) FTIR spectra of pristine and aged PVC (1 and 150 μm). (f) Zeta potential showing the isoelectric point (IEP). (g) XPS wide-scan spectra.
-
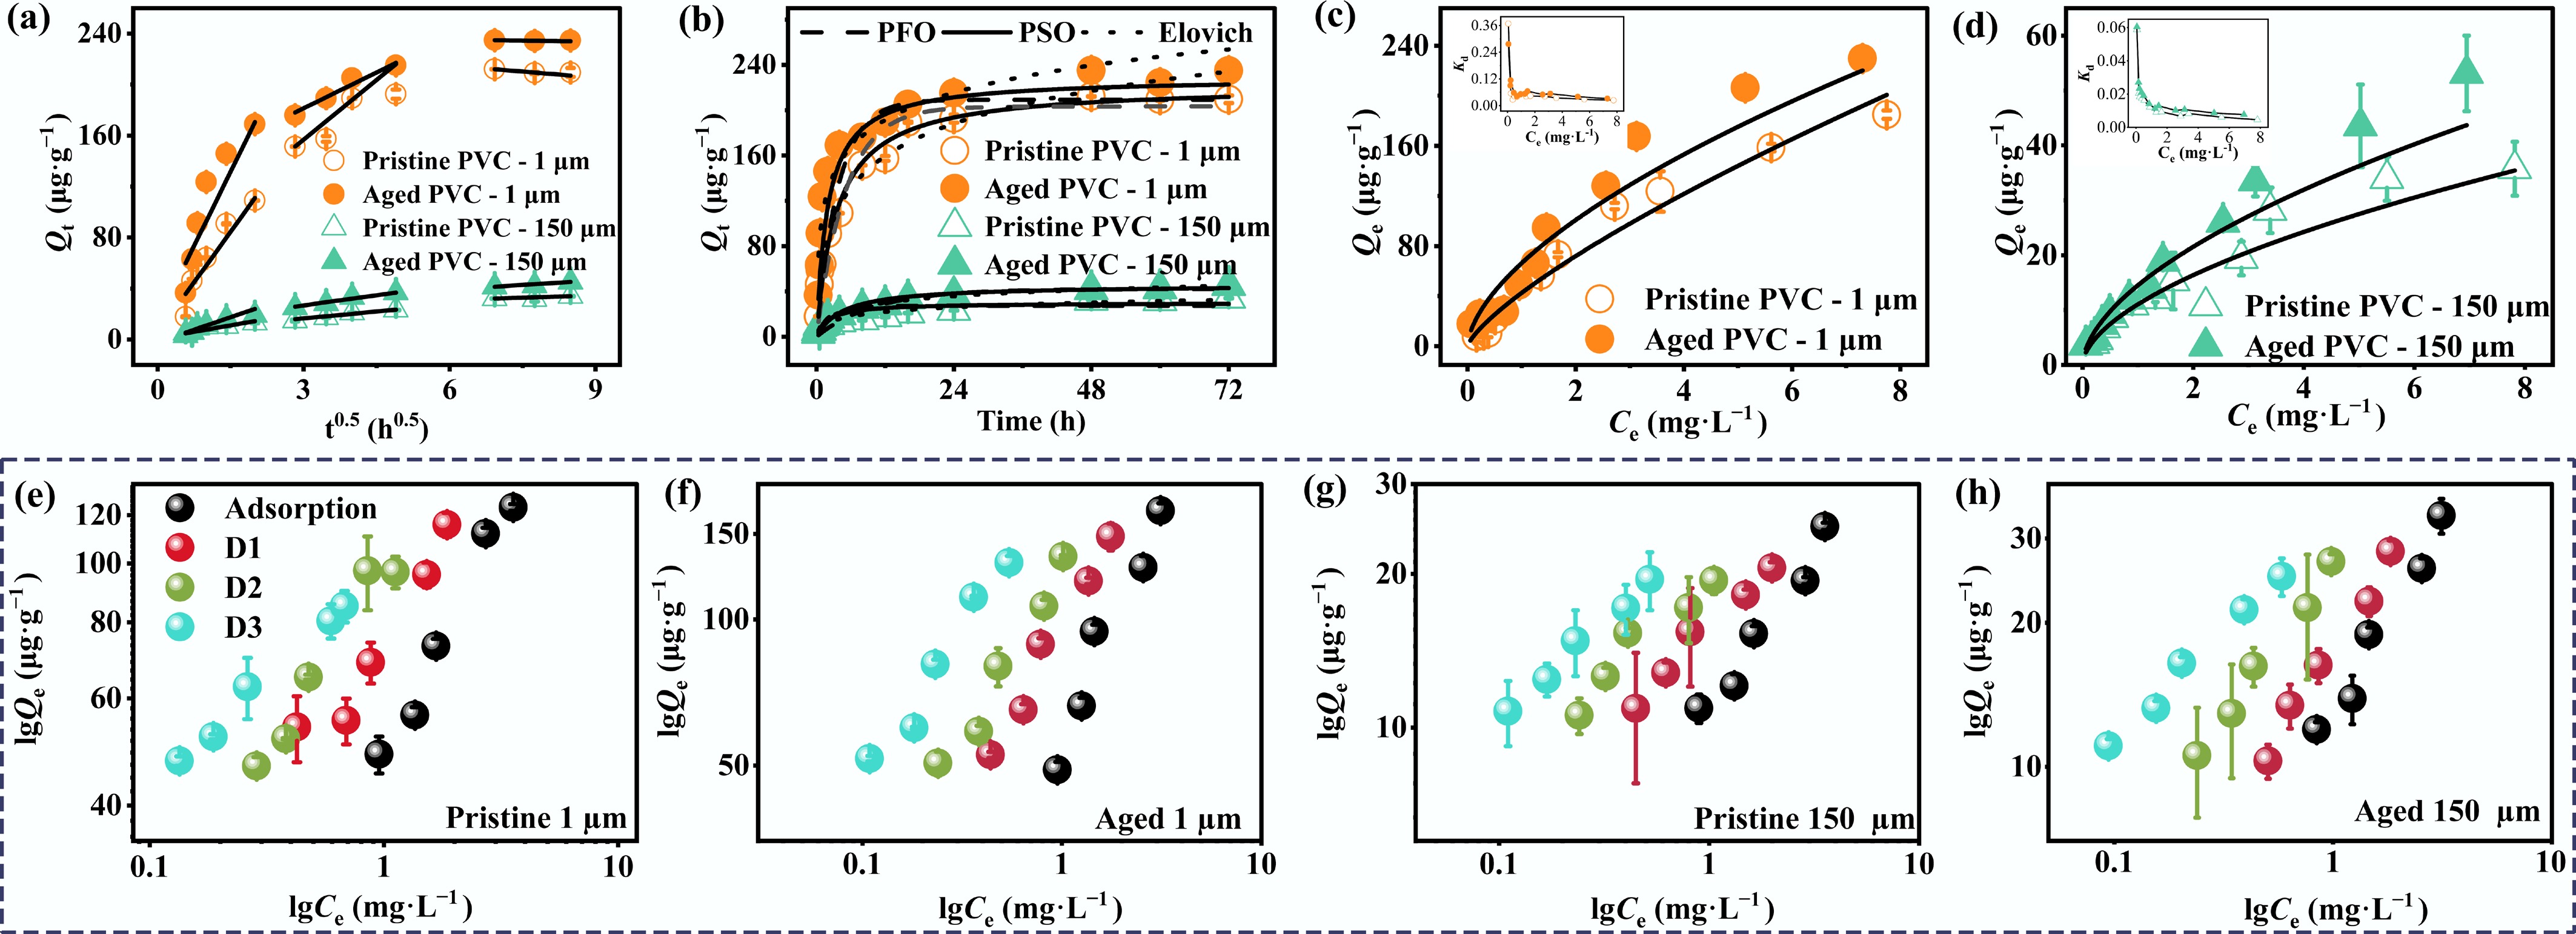
Figure 2.
(a) Sorption kinetics of FL onto PVC fitted using the intraparticle diffusion model, and (b) the pseudo-first-order, pseudo-second-order, and Elovich models. Adsorption isotherms of FL onto PVC based on Freundlich model fitting, along with distribution coefficient (Kd) values for (c) 1 µm PVC MPs and (d) 150 µm PVC MPs. Adsorption and desorption behavior of FL on (e) pristine 1 µm, (f) aged 1 µm, (g) pristine 150 µm, and (h) aged 150 µm PVC. The equilibrium time for all adsorption and desorption processes was 48 h. The initial concentration range for sorption isotherms was 0.24–9.6 mg·L−1, and the temperature was maintained at 25 ± 1 °C.
-
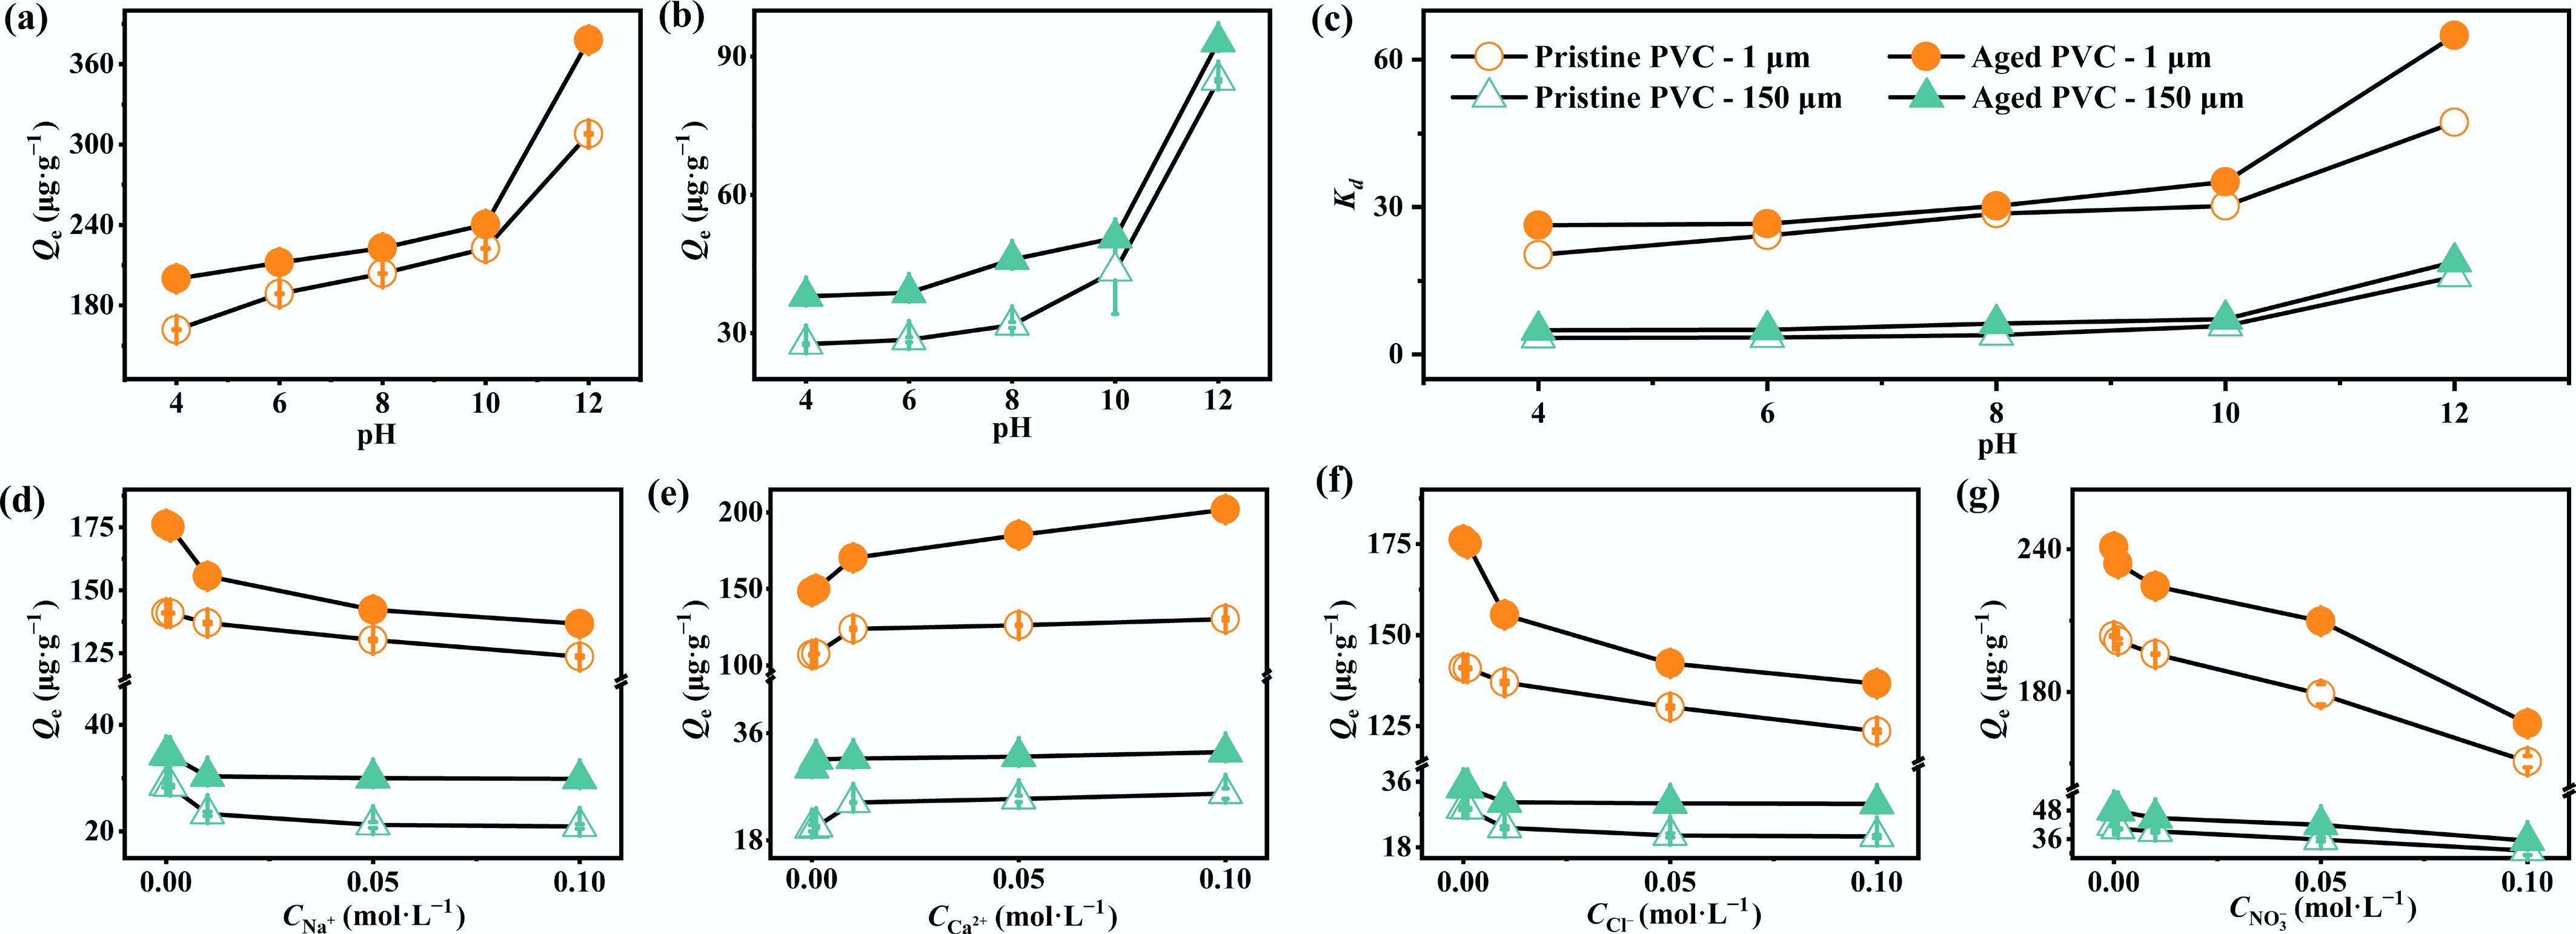
Figure 3.
Effect of pH on FL sorption by pristine and aged PVC MPs with (a) 1 µm, and (b) 150 µm particle size, and (c) corresponding distribution coefficients (Kd) as a function of pH. Effect of ionic conditions on FL sorption, including (d) Na+, (e) Ca2+, (f) Cl−, and (g) NO3−.
-
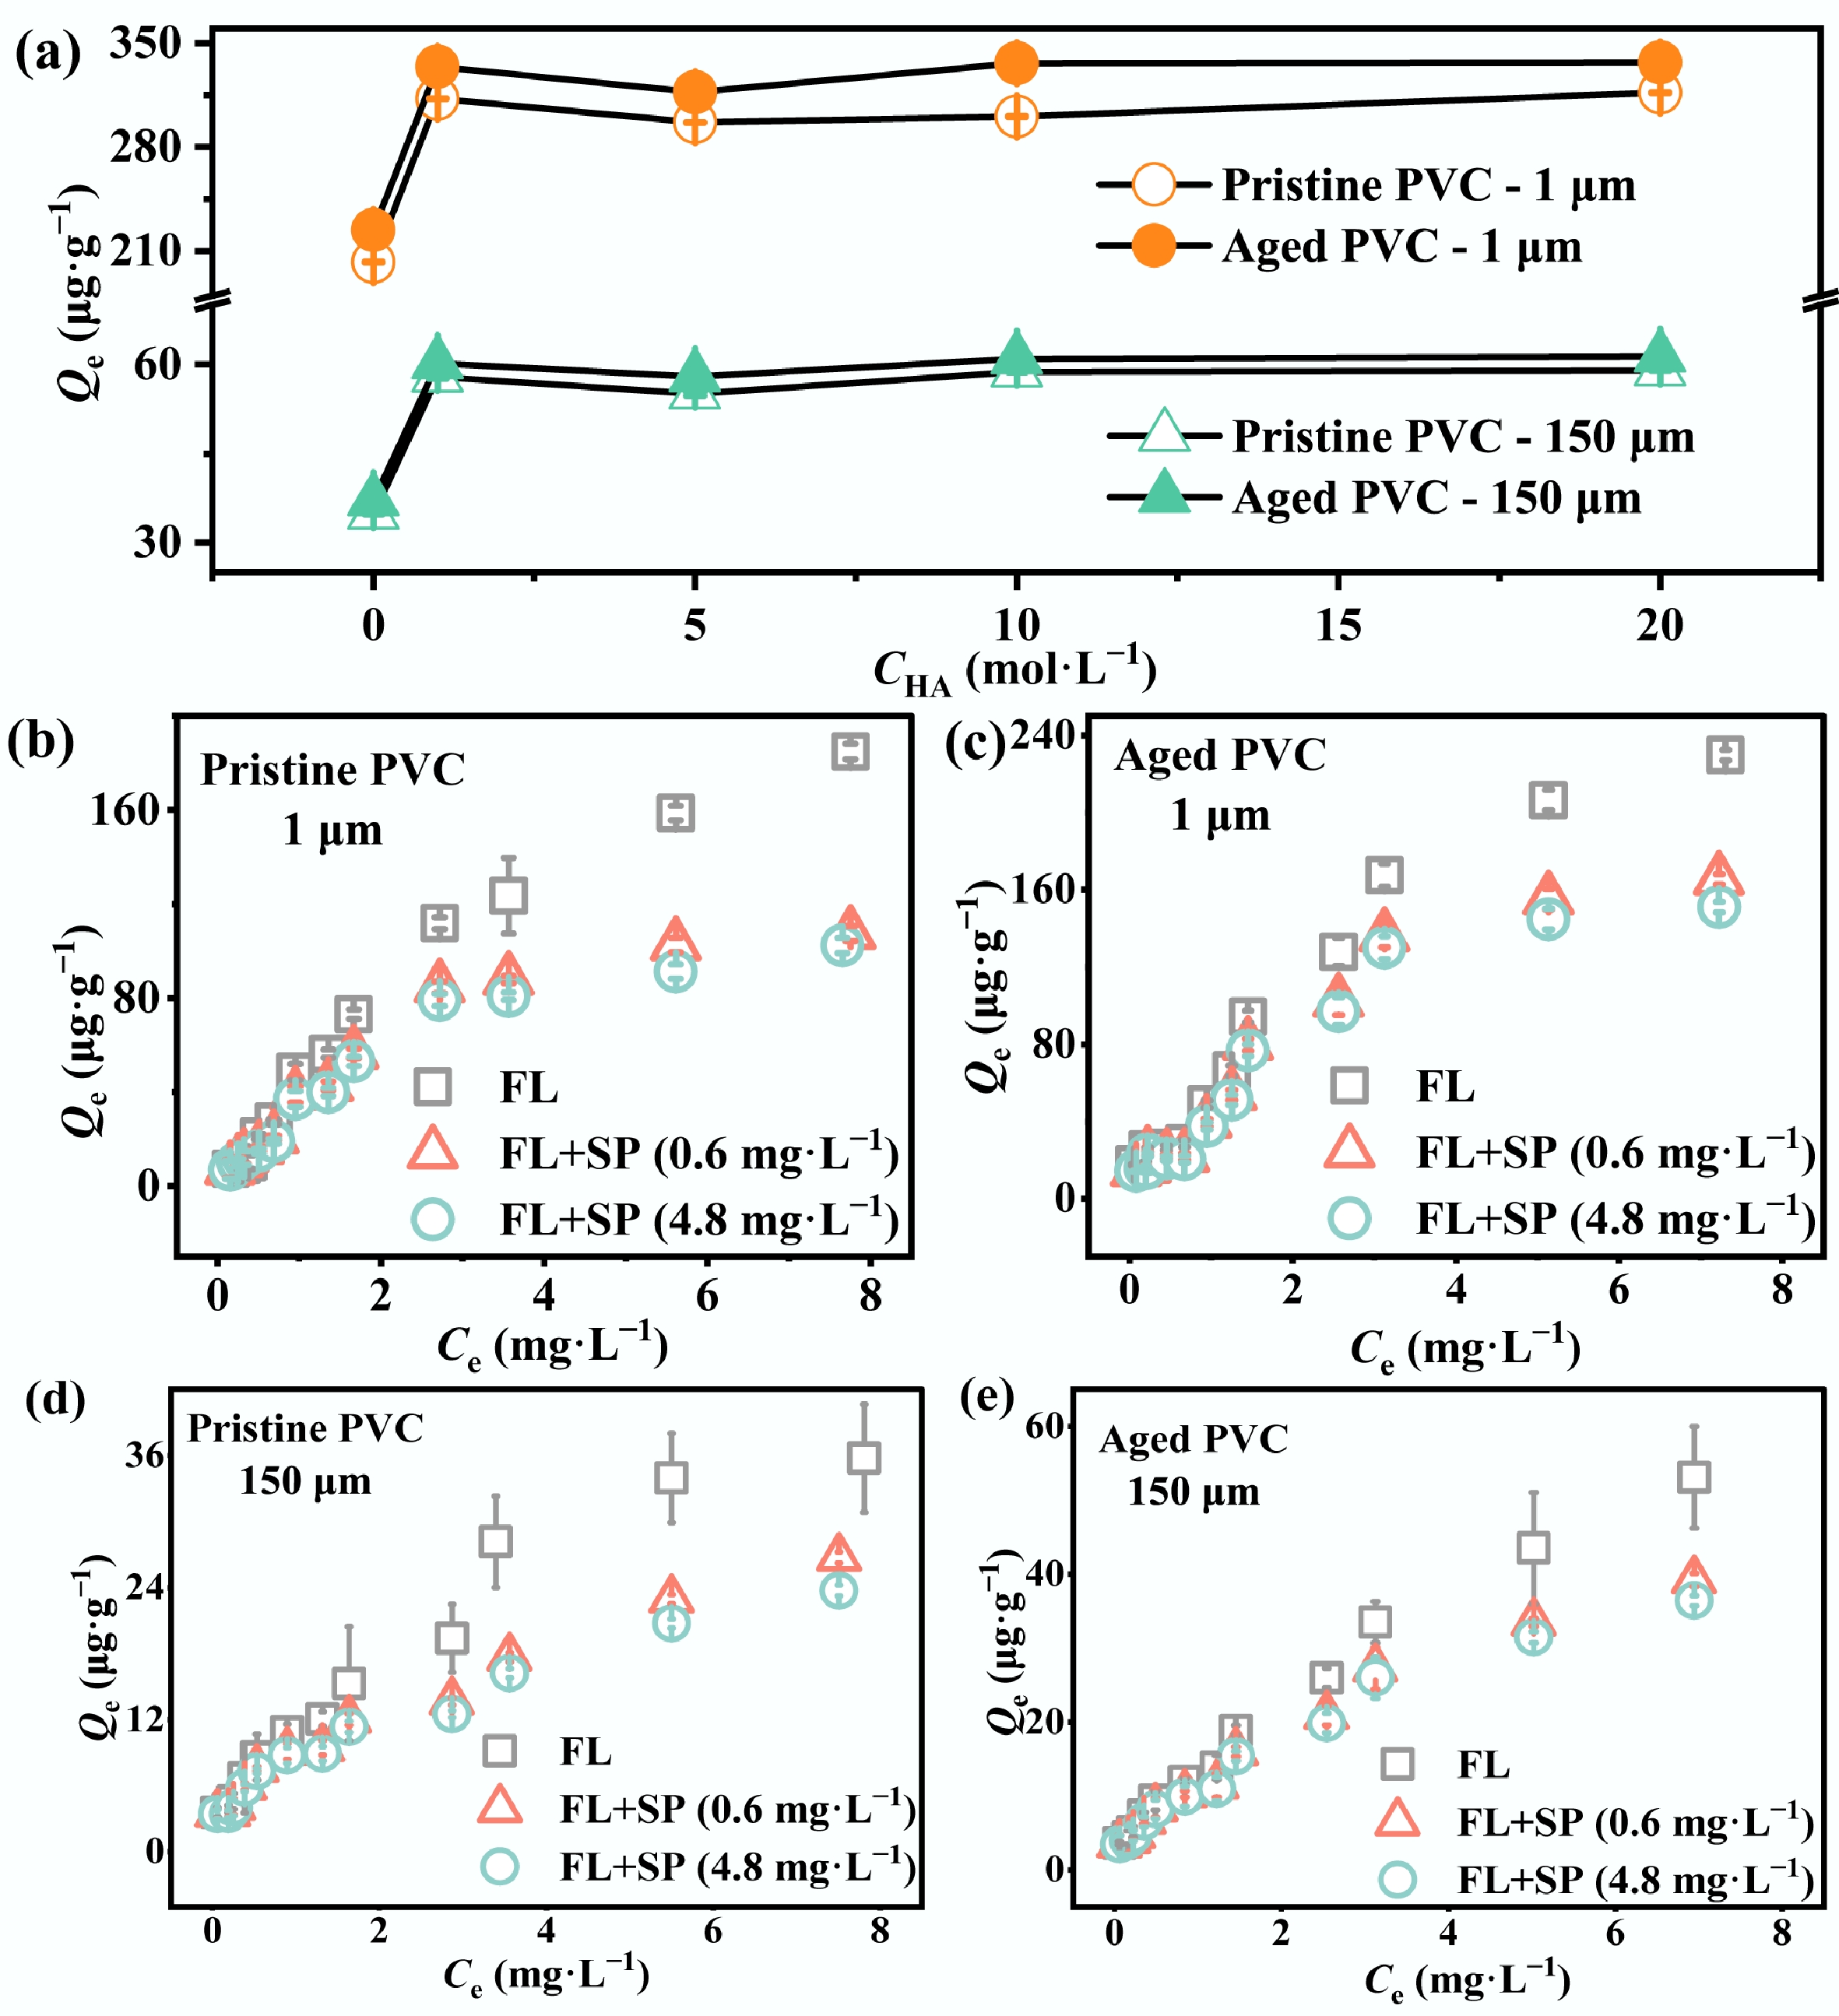
Figure 4.
Effects of humic acid (HA) and spirotetramat (SP) on FL sorption onto PVC MPs. (a) Effect of HA concentration. FL sorption in the absence and the presence of 0.6 and 4.8 mg·L−1 SP onto pristine (b) 1 µm PVC, (c) aged 1 µm PVC, (d) pristine 150 µm PVC, and (e) aged 150 µm PVC.
-
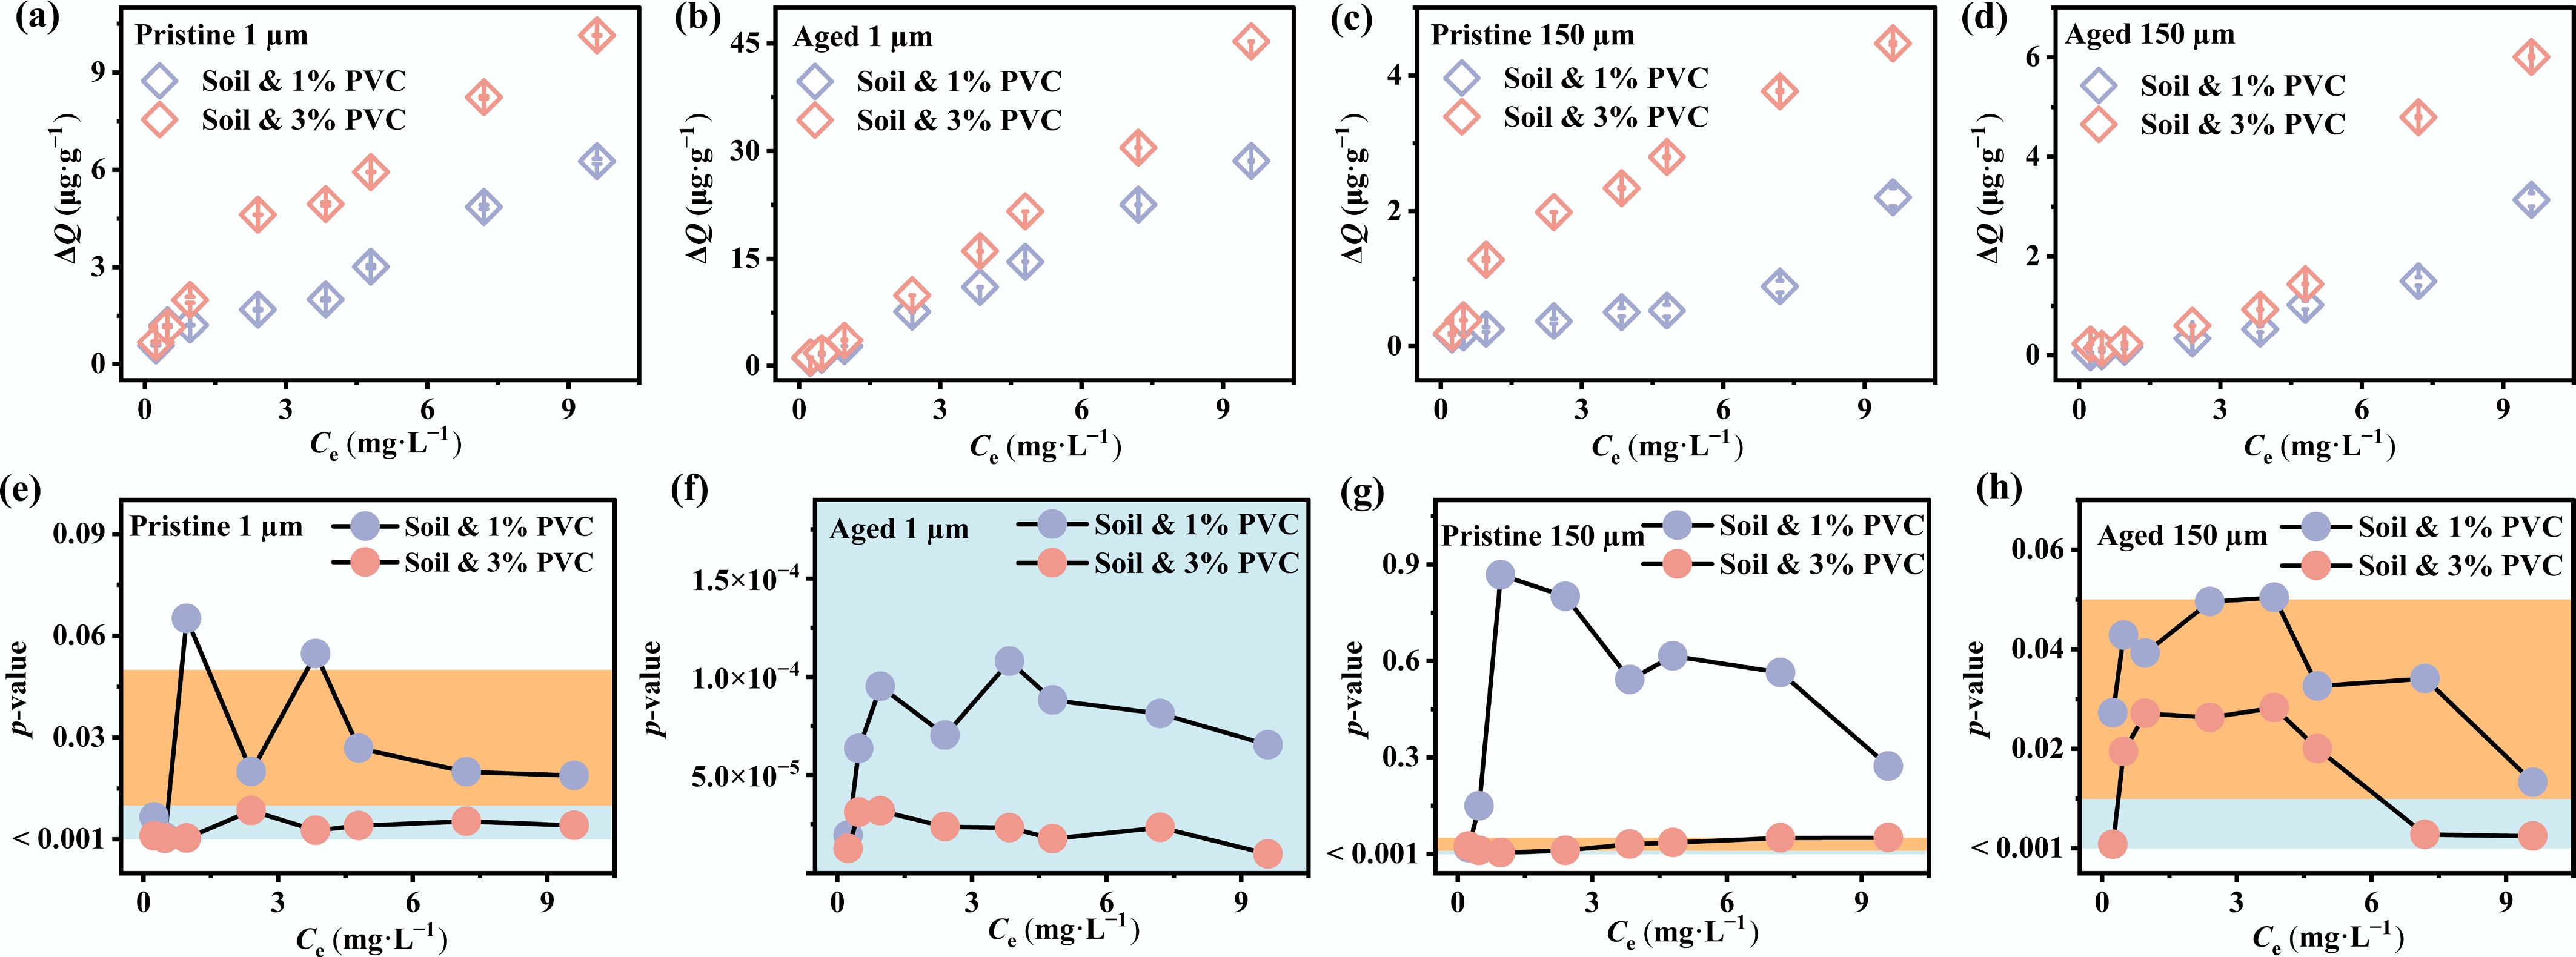
Figure 5.
Effect of PVC addition on FL sorption behavior in soil-PVC MPs system. Sorption enhancement of FL in soil with 1% and 3% additions of (a) pristine 1 µm PVC, (b) aged 1 µm PVC, (c) pristine 150 µm PVC, and (d) aged 150 µm PVC. (e)–(h) Statistical significance of sorption enhancement under the same conditions (Student's t-test). ΔQe represents the change in sorption capacity before and after PVC addition (ΔQe = Qe, before − Qe, after). p < 0.05 indicates significance, and p < 0.01 indicates extreme significance.
-
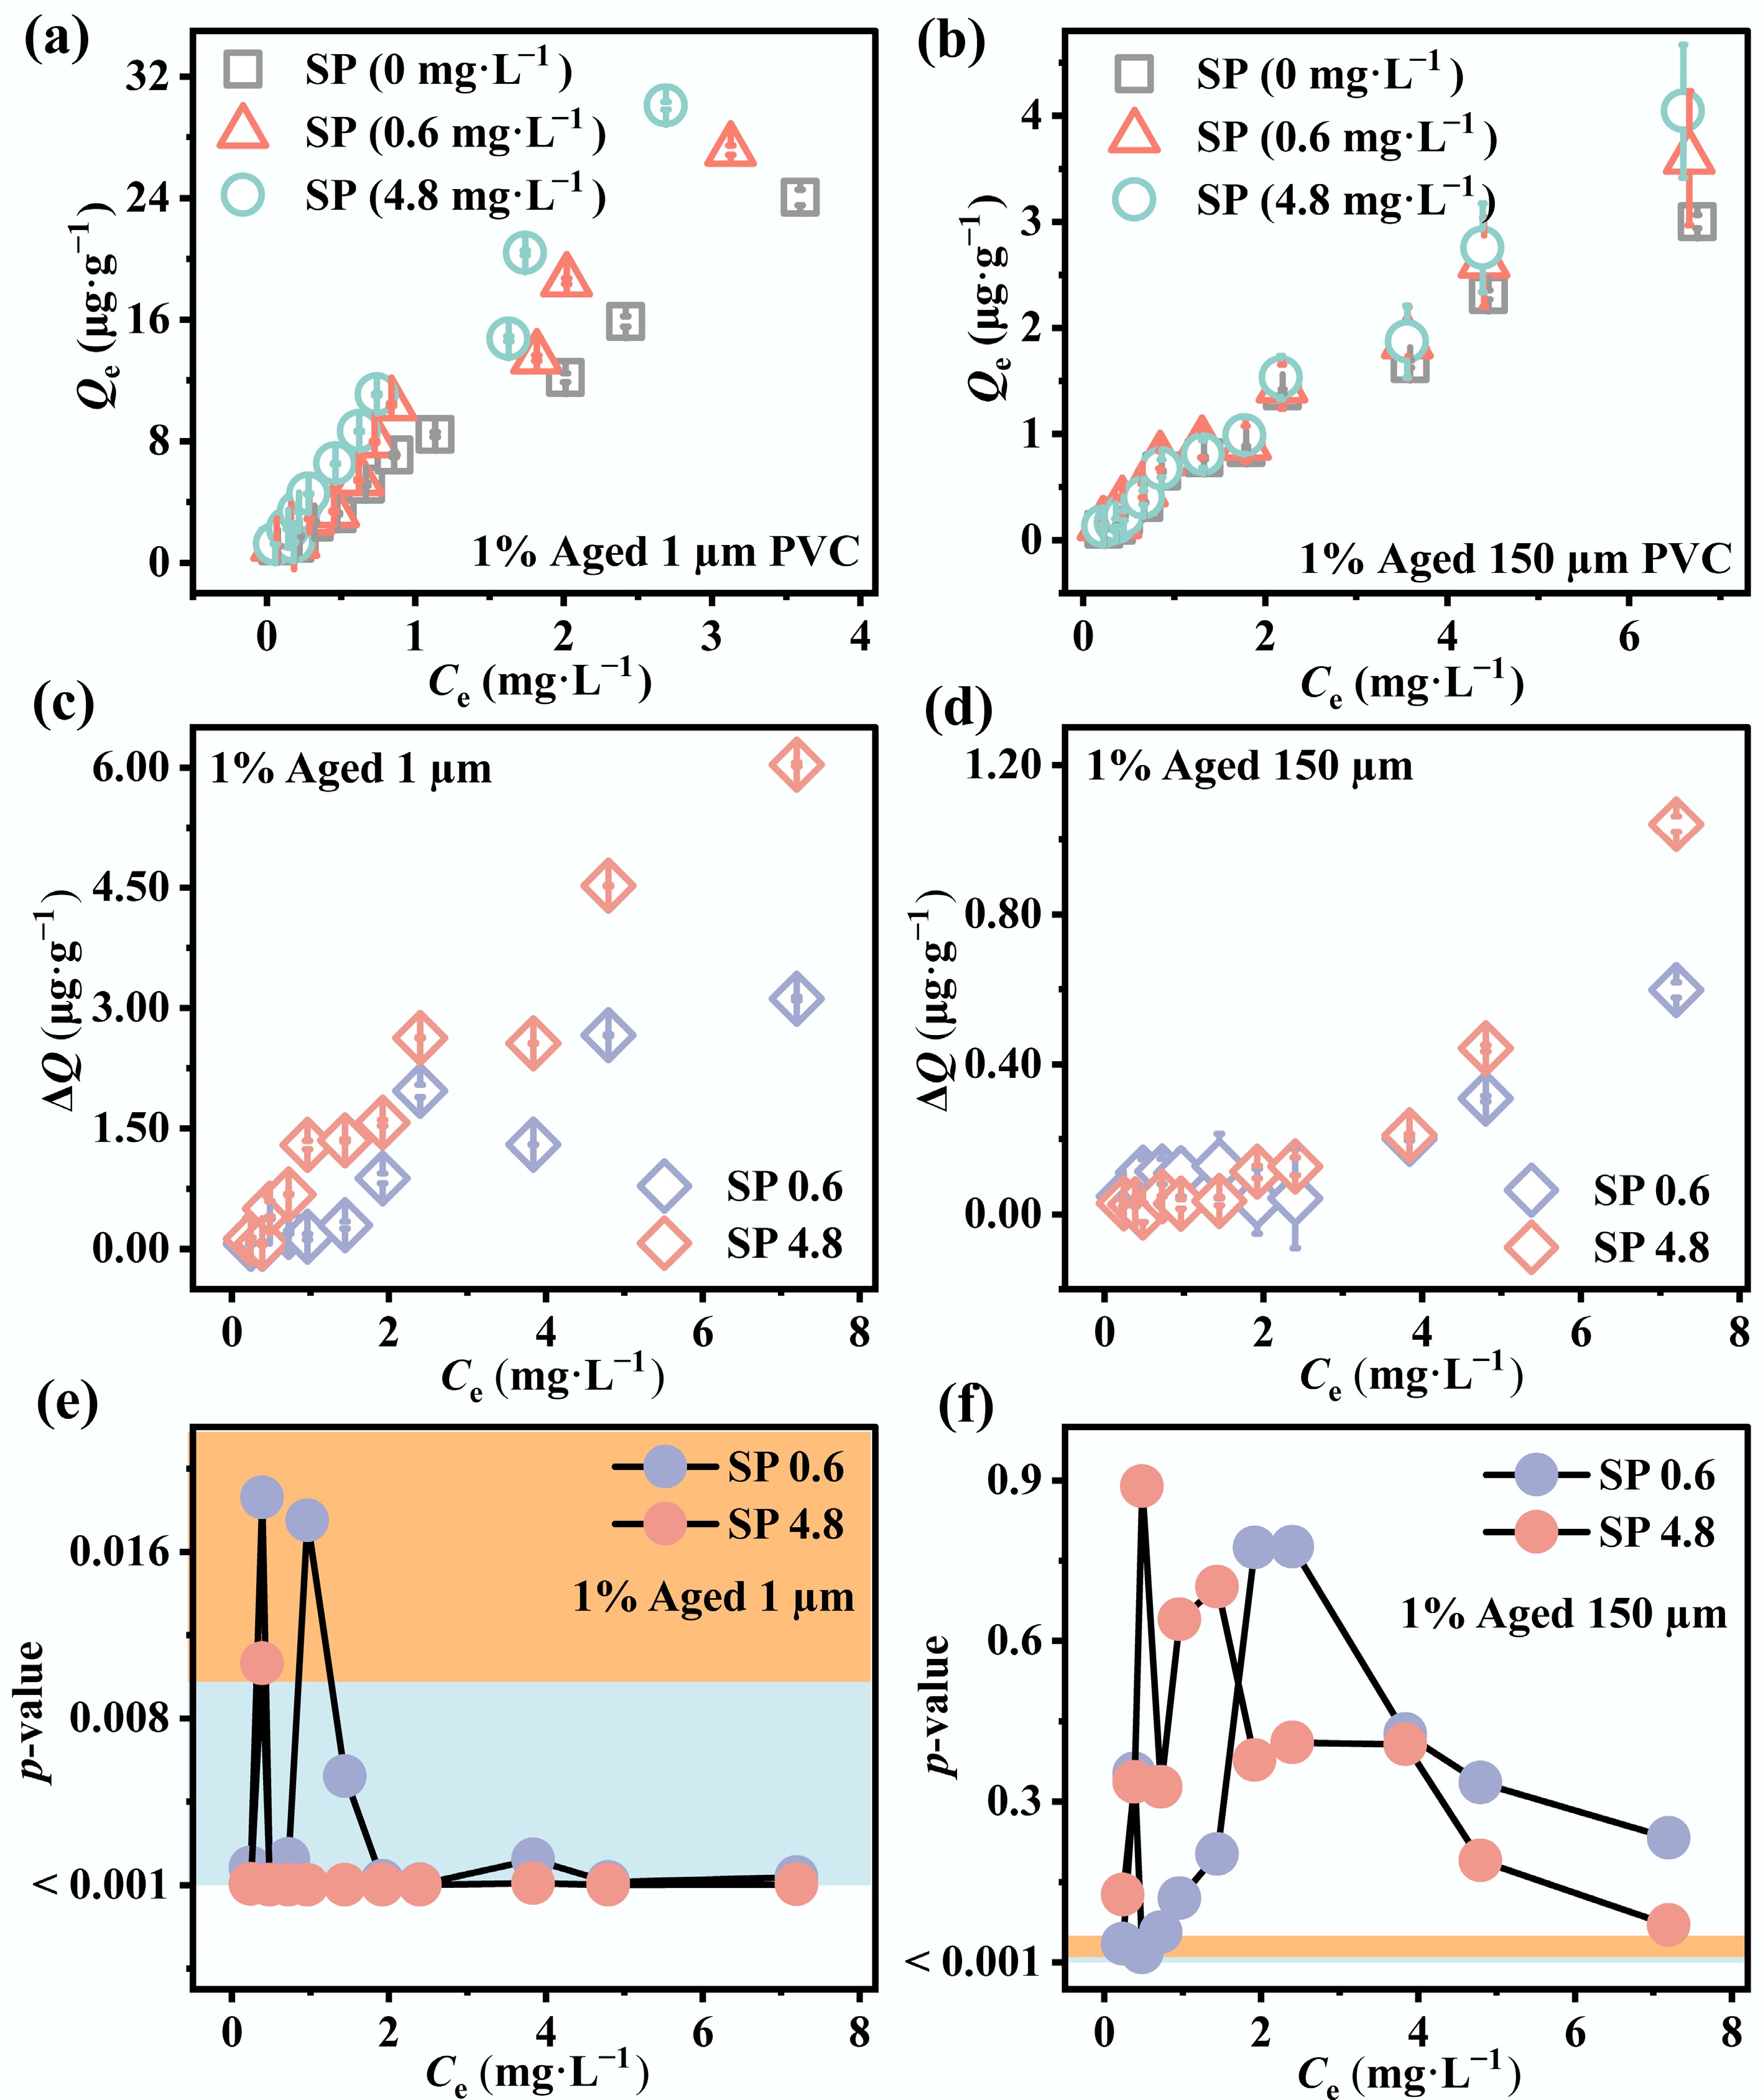
Figure 6.
Effect of coexisting SP on FL sorption in soil with 1% aged PVC MPs. FL sorption in the presence of SP at 0, 0.6, and 4.8 mg·L−1 for (a) 1 µm, and (b) 150 µm PVC. (c), (d) Net changes in sorption relative to the control. (e), (f) Statistical significance of these changes (Student's t-test).
Figures
(6)
Tables
(0)