-
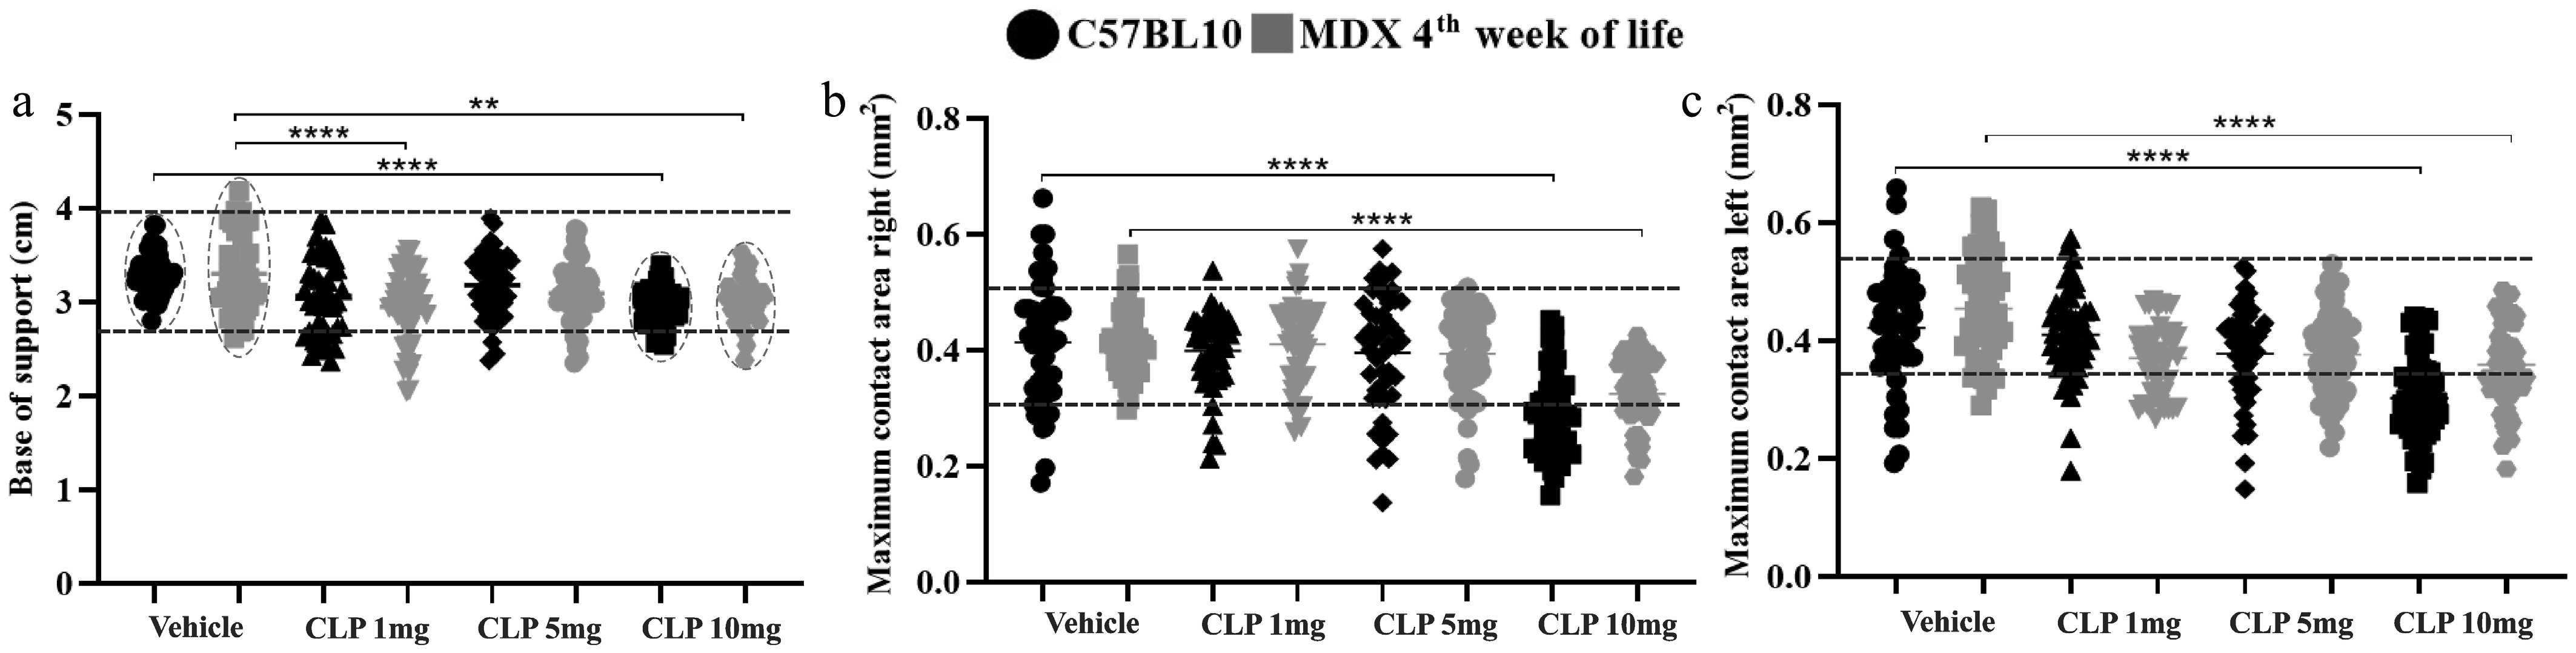
Figure 1.
(a) Posterior base of support; (b) left maximum contact area; and (c) right maximum contact area in C57BL/10 and MDX dystrophic mice following treatment with the prodrug CLP290. Statistical significance: ** P < 0.01, **** P < 0.0001. Data are presented as mean ± SEM, n = 6, and locomotor parameters were recorded repeatedly throughout the 7-day treatment period.
-
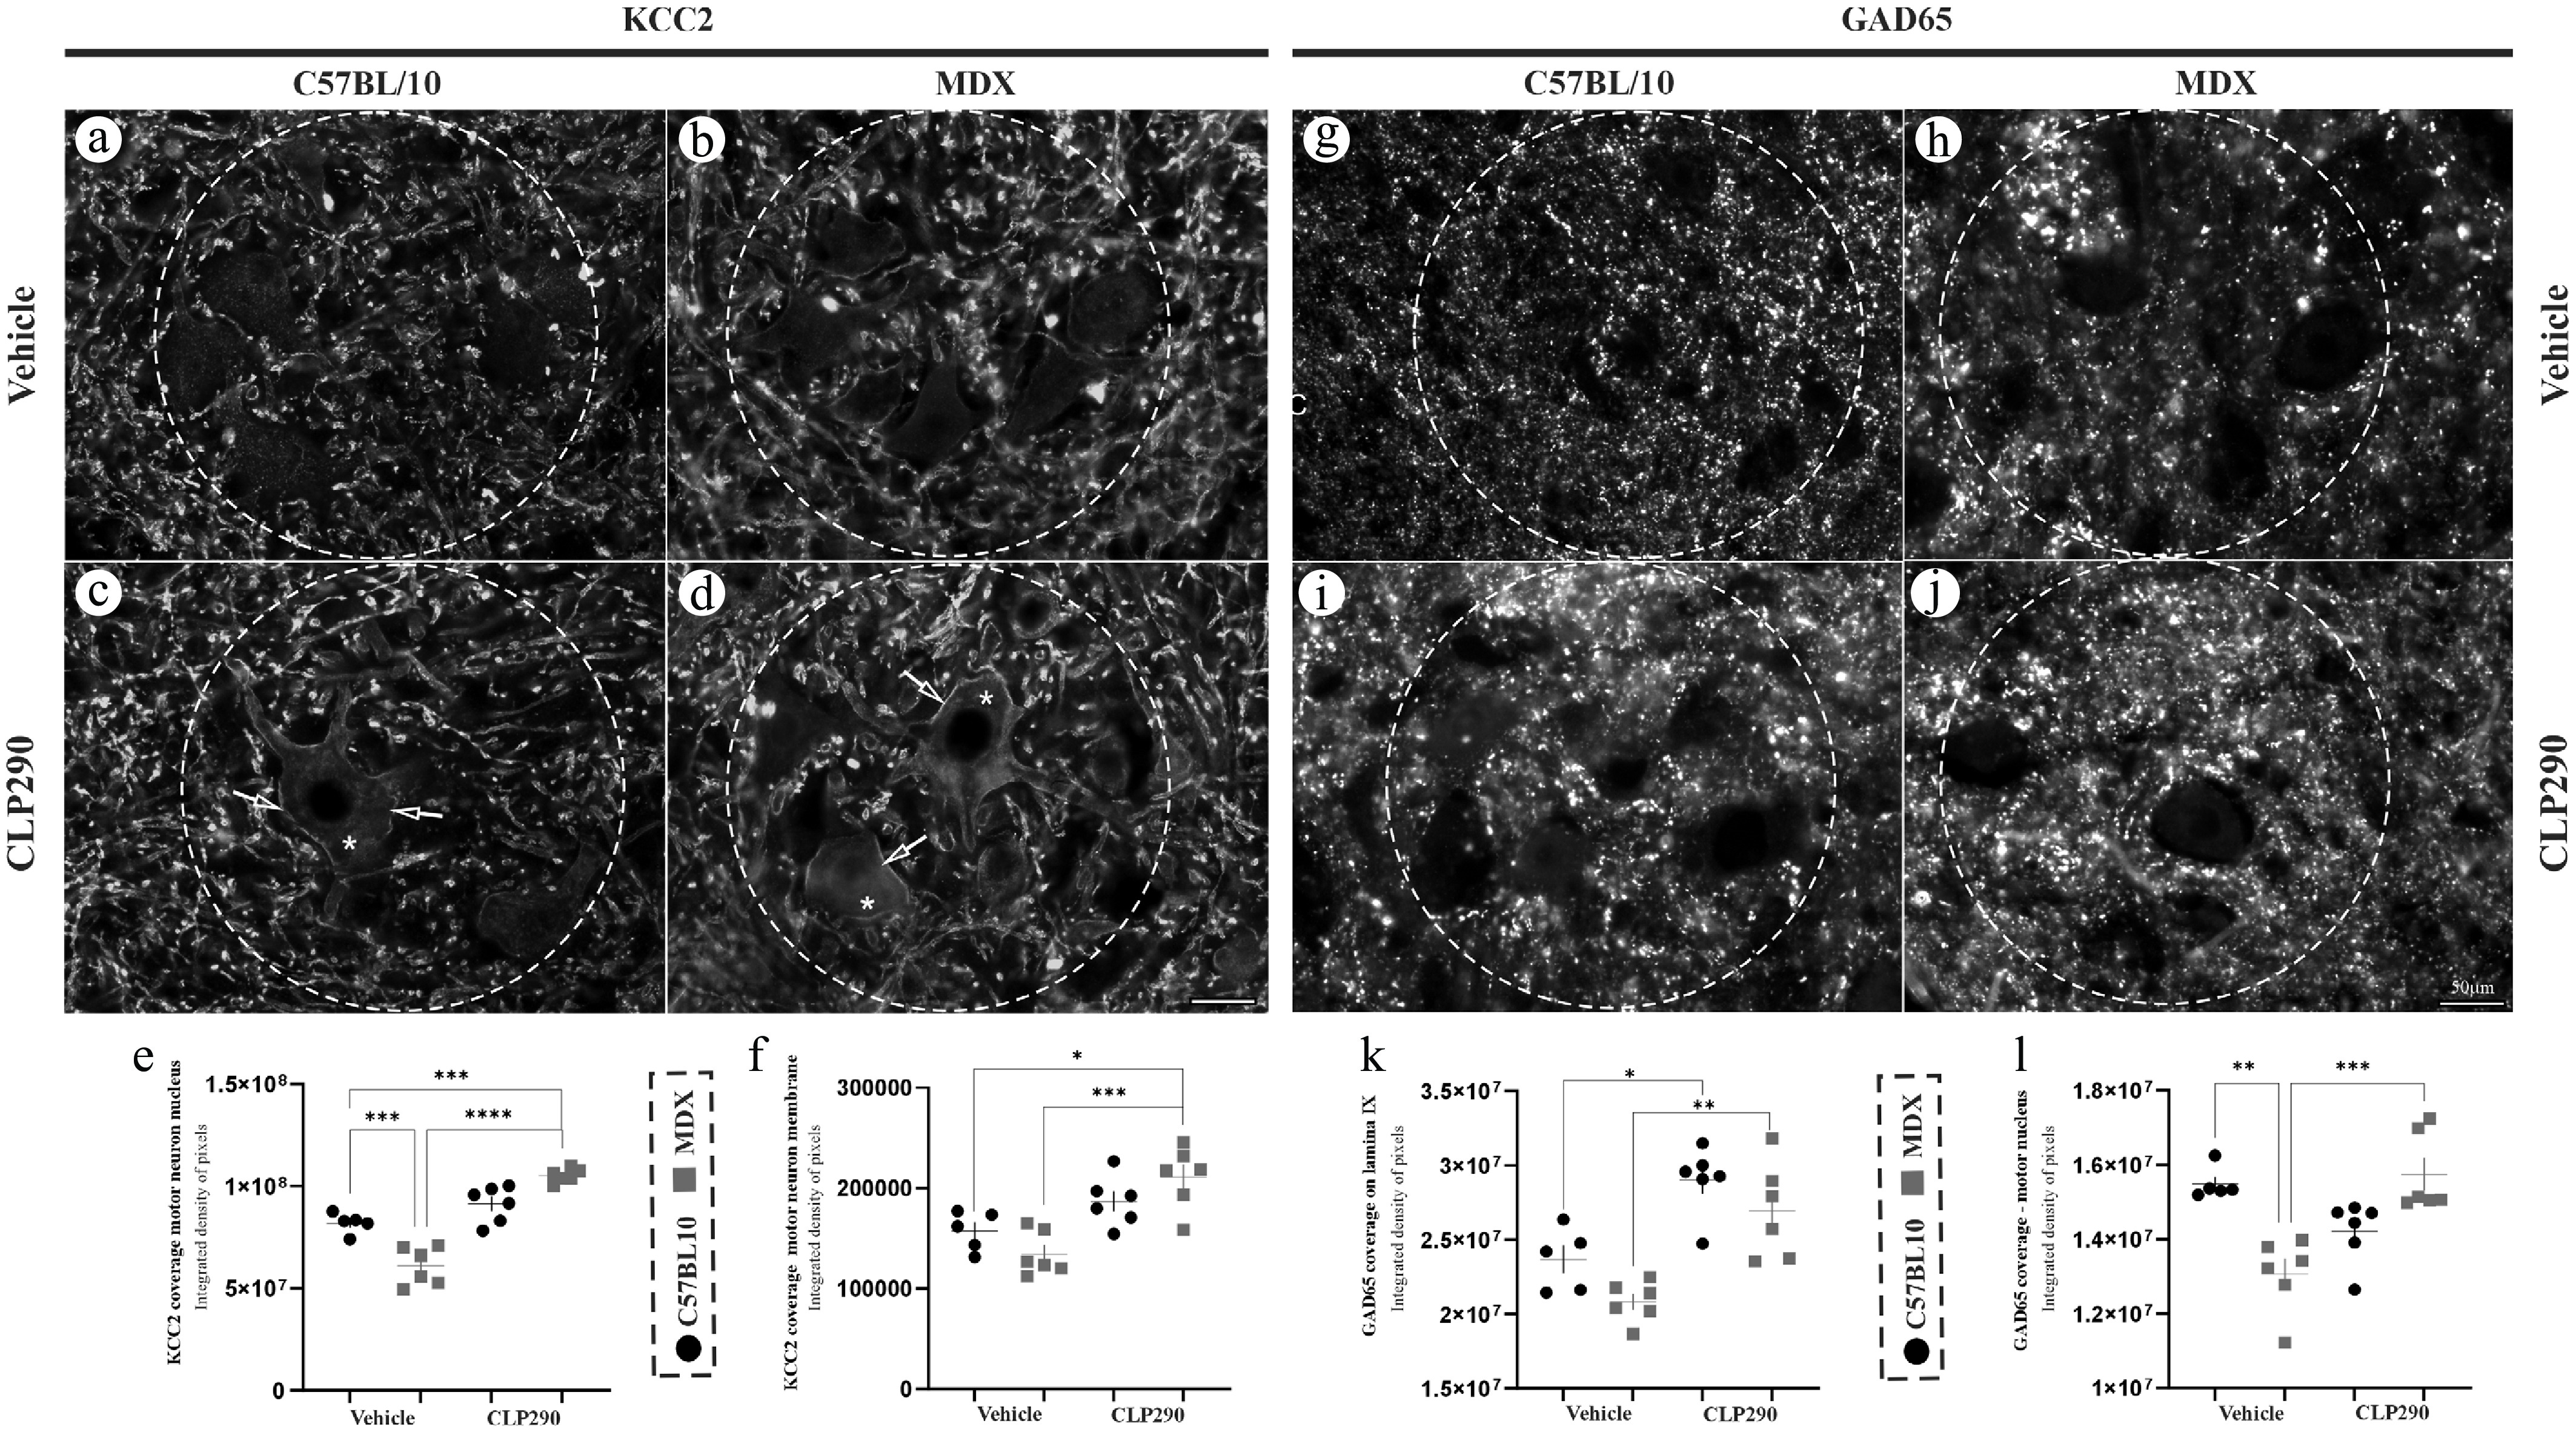
Figure 2.
(a)–(f) Anti-KCC2 immunostaining of lumbar spinal cord cross sections, showing increased staining intensity after 7 d of CLP290 treatment. (a)–(c) C57BL/10; (b)–(d) MDX; (e), (f) quantification of integrated pixel density and statistical significance of intergroup comparisons (*** P < 0.001; **** P < 0.0001). Motor nucleus (dotted circle), motoneuron plasma membrane (arrows), and motoneuron cytoplasm (*) exhibiting positive staining. (g)–(l) Anti-GAD65 immunostaining of lumbar spinal cord cross sections, showing increased staining intensity after 7 d of CLP290 treatment. (g)–(i) C57BL/10; (h)–(j) MDX. (k), (l) Quantification of integrated pixel density and statistical significance of intergroup comparisons (* P < 0.05; ** P < 0.01; *** P < 0.001). Rexed lamina IX and motoneuron nucleus (dotted circles). Scale bar: 50 μm. Data are presented as mean ± SEM, n = 6. Quantitative analyses were performed from multiple lumbar spinal cord sections containing motoneurons from each animal, as described in the Methods section.
-
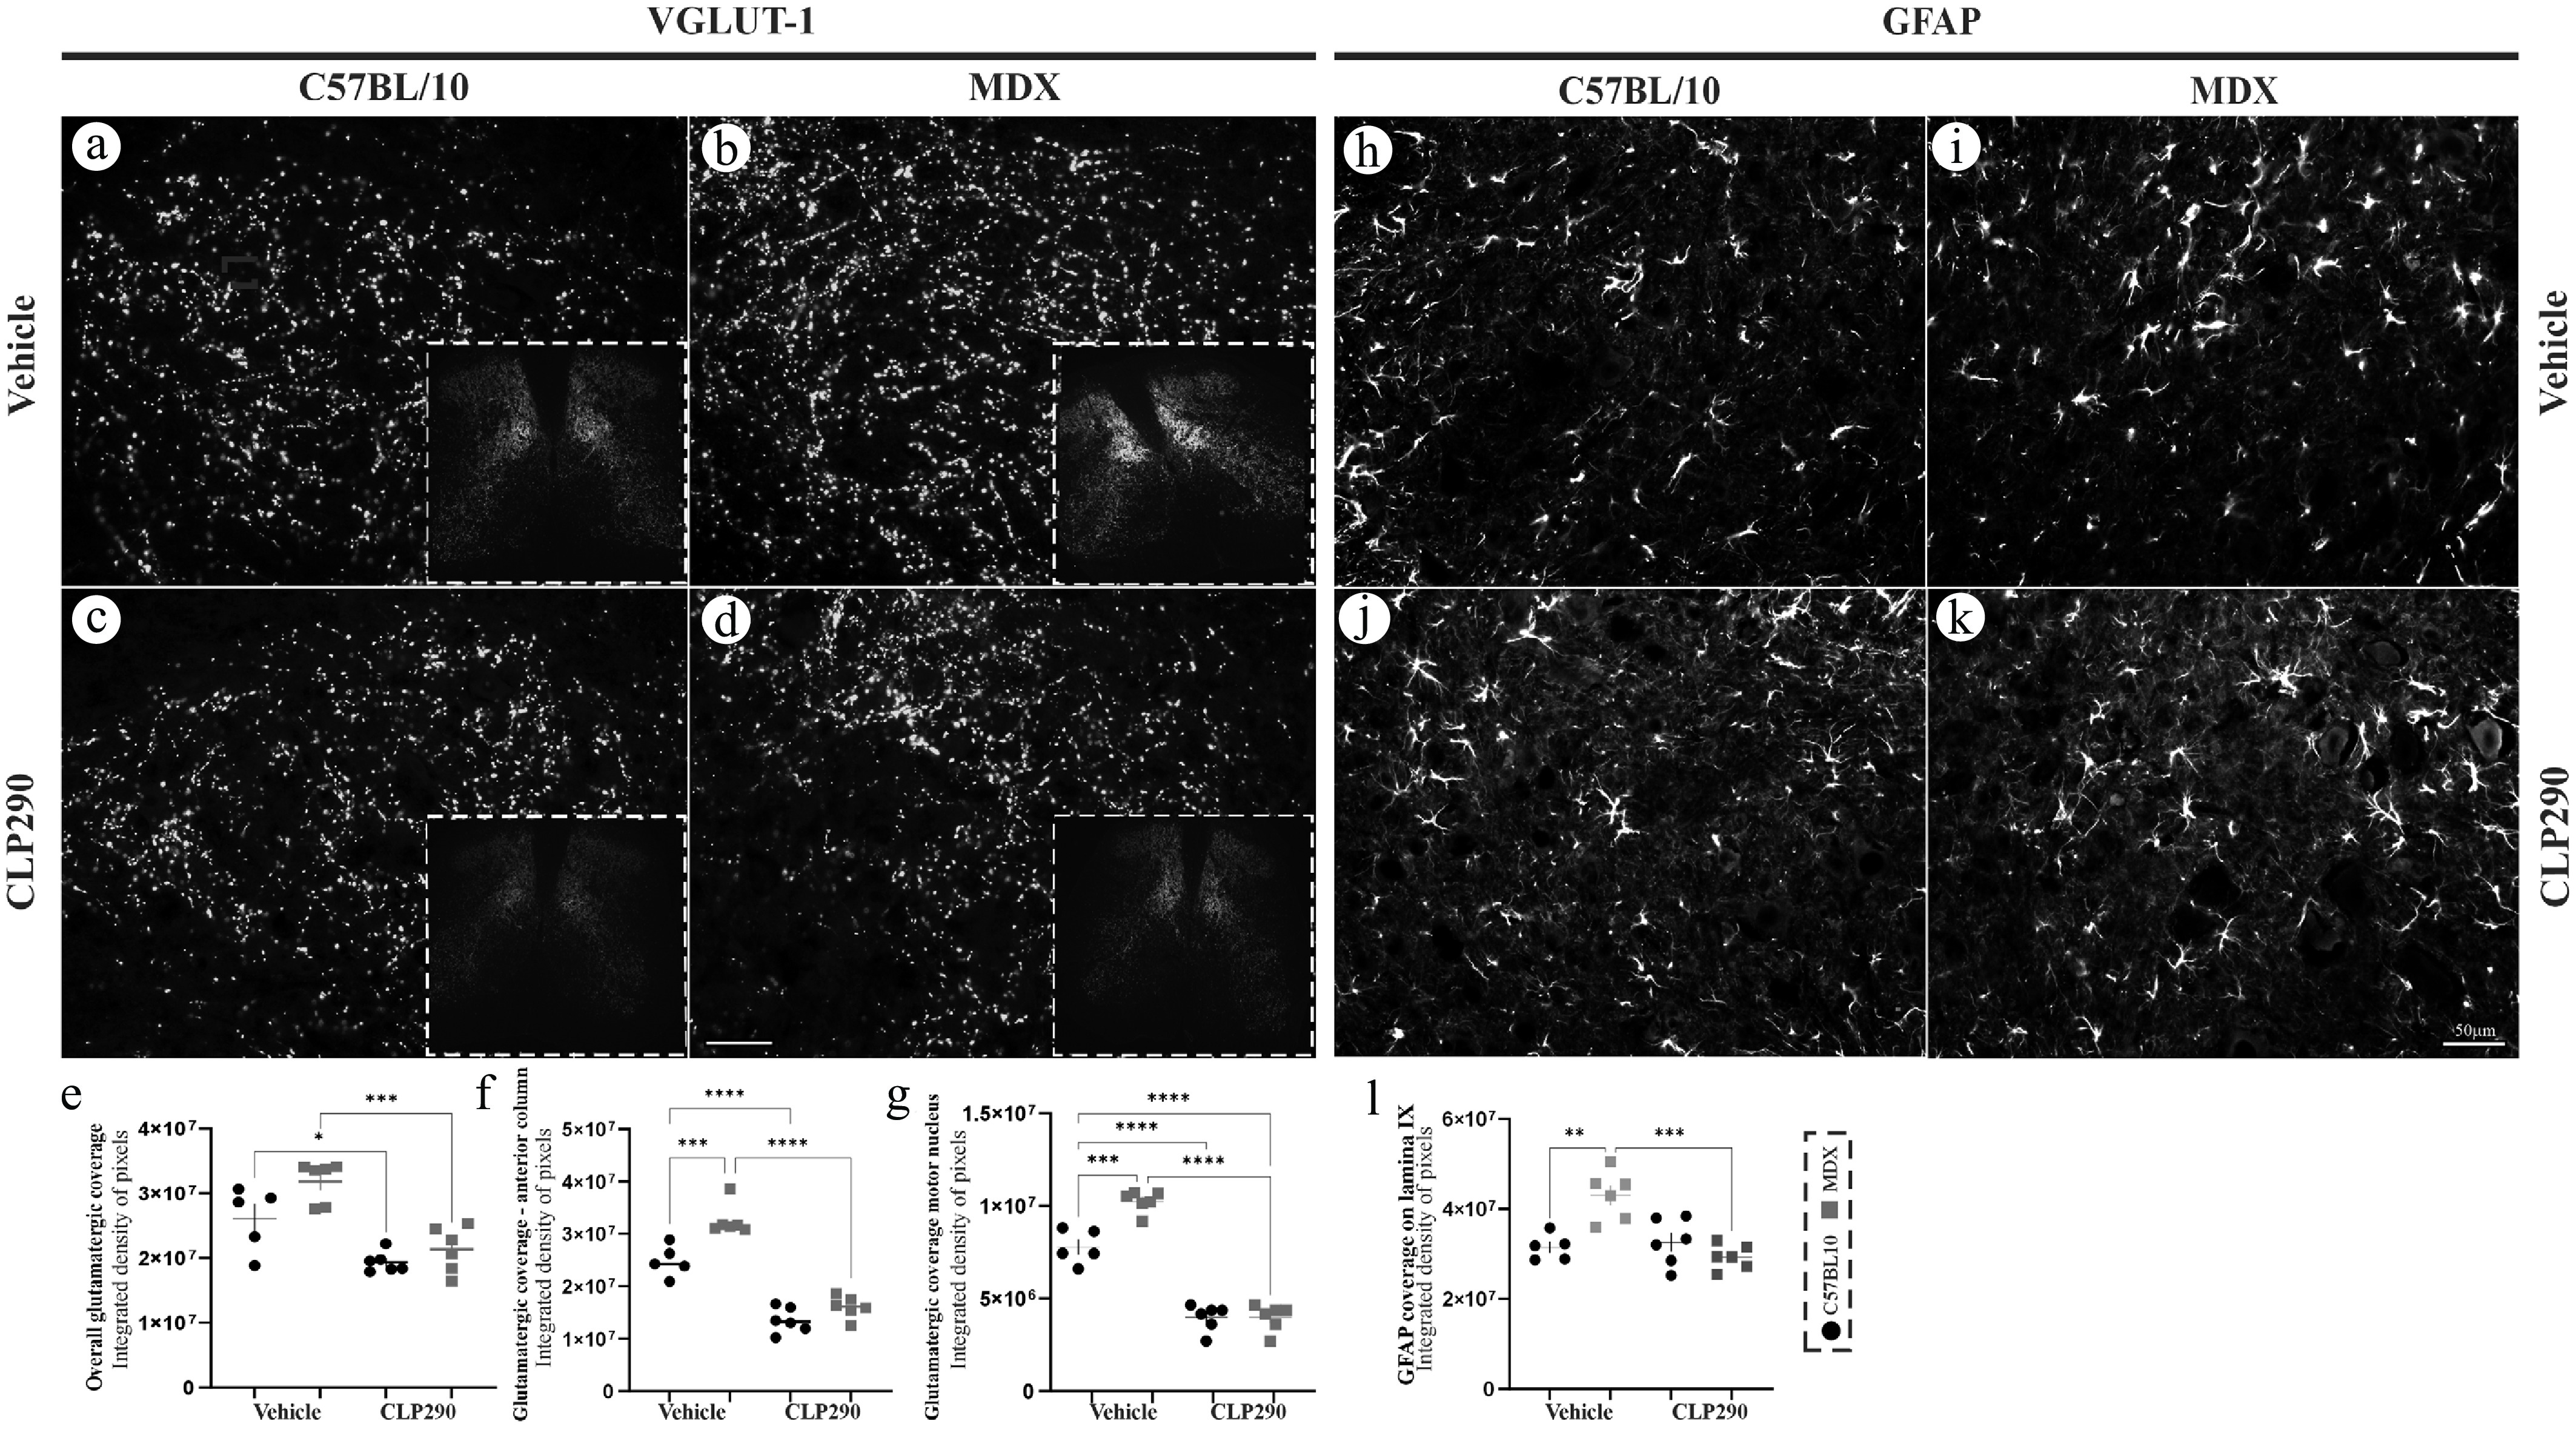
Figure 3.
(a)–(g) Anti-VGLUT1 immunohistochemistry of transverse sections of the lumbar spinal cord, showing reduced staining intensity after CLP290 administration. (e)–(g) Quantification of integrated pixel density and statistical significance of intergroup comparisons (* P < 0.05; *** P < 0.001; **** P < 0.0001). Scale bar: 50 μm. (h)–(l) Anti-GFAP (glial fibrillary acidic protein) immunohistochemistry, an astrocytic marker, revealed elevated expression in Rexed lamina IX of MDX vehicle mice compared to C57BL/10 vehicle controls (** P < 0.01; [h], [i]). Treatment with CLP290 (10 mg·kg−1) significantly reduced GFAP expression in MDX mice compared to the MDX vehicle group (*** P < 0.001; [i]–[k]). No statistically significant difference was observed between CLP290-treated MDX mice and the C57BL/10 group. (l) Quantification of integrated pixel density. Data are presented as mean ± SEM, n = 6. Quantitative analyses were performed from multiple lumbar spinal cord sections containing motoneurons from each animal, as described in the Methods section. Scale bar: 50 μm.
-
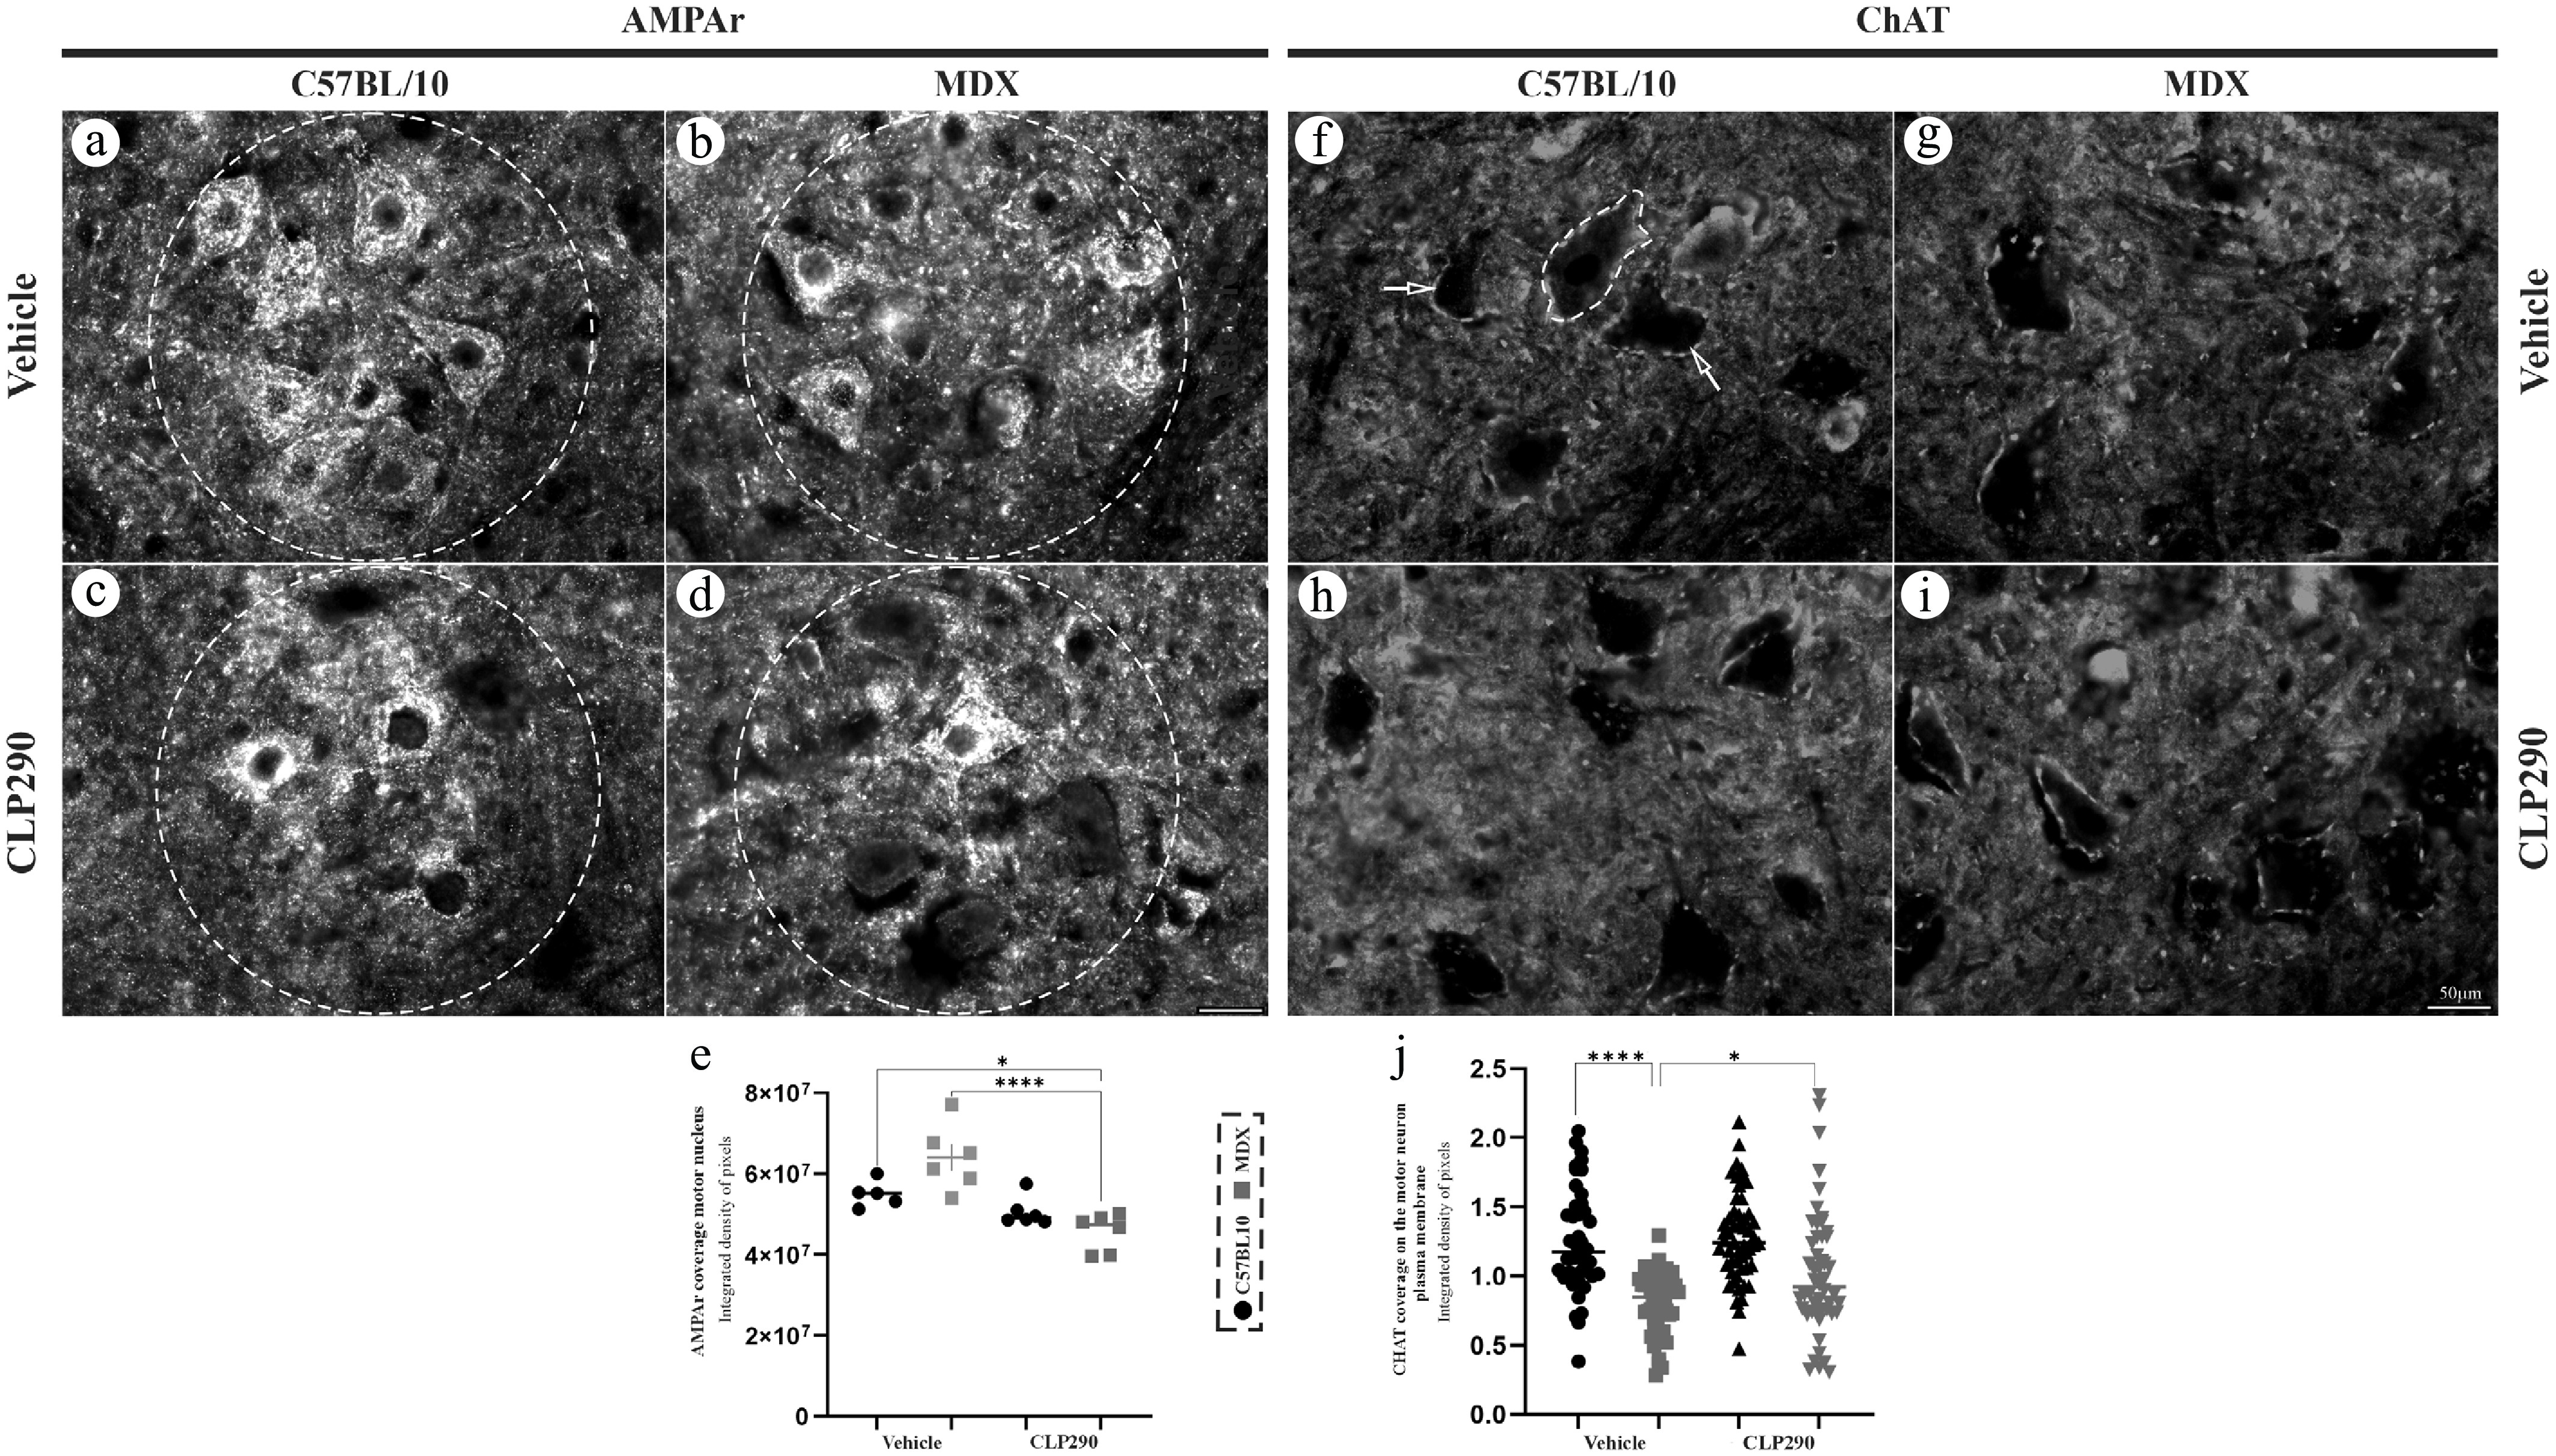
Figure 4.
(a)–(e) Anti-AMPAr immunostaining of lumbar spinal cord transverse sections showing reduced staining intensity in the motor nucleus of MDX mice after CLP290 treatment. (e) Quantification of integrated pixel density and statistical significance of intergroup comparisons (* P < 0.05; **** P < 0.0001). (f)–(j) Anti-ChAT immunostaining revealing increased motoneuron plasma membrane coverage (arrows) in MDX mice after CLP290 treatment. (j) Quantification of integrated pixel density of presynaptic ChAT+ membrane coverage and statistical significance of intergroup comparisons (* P < 0.05). Data are presented as mean ± SEM, n = 6. Quantitative analyses were performed from multiple lumbar spinal cord sections containing motoneurons from each animal, as described in the Methods section. Scale bar: 50 μm.
-
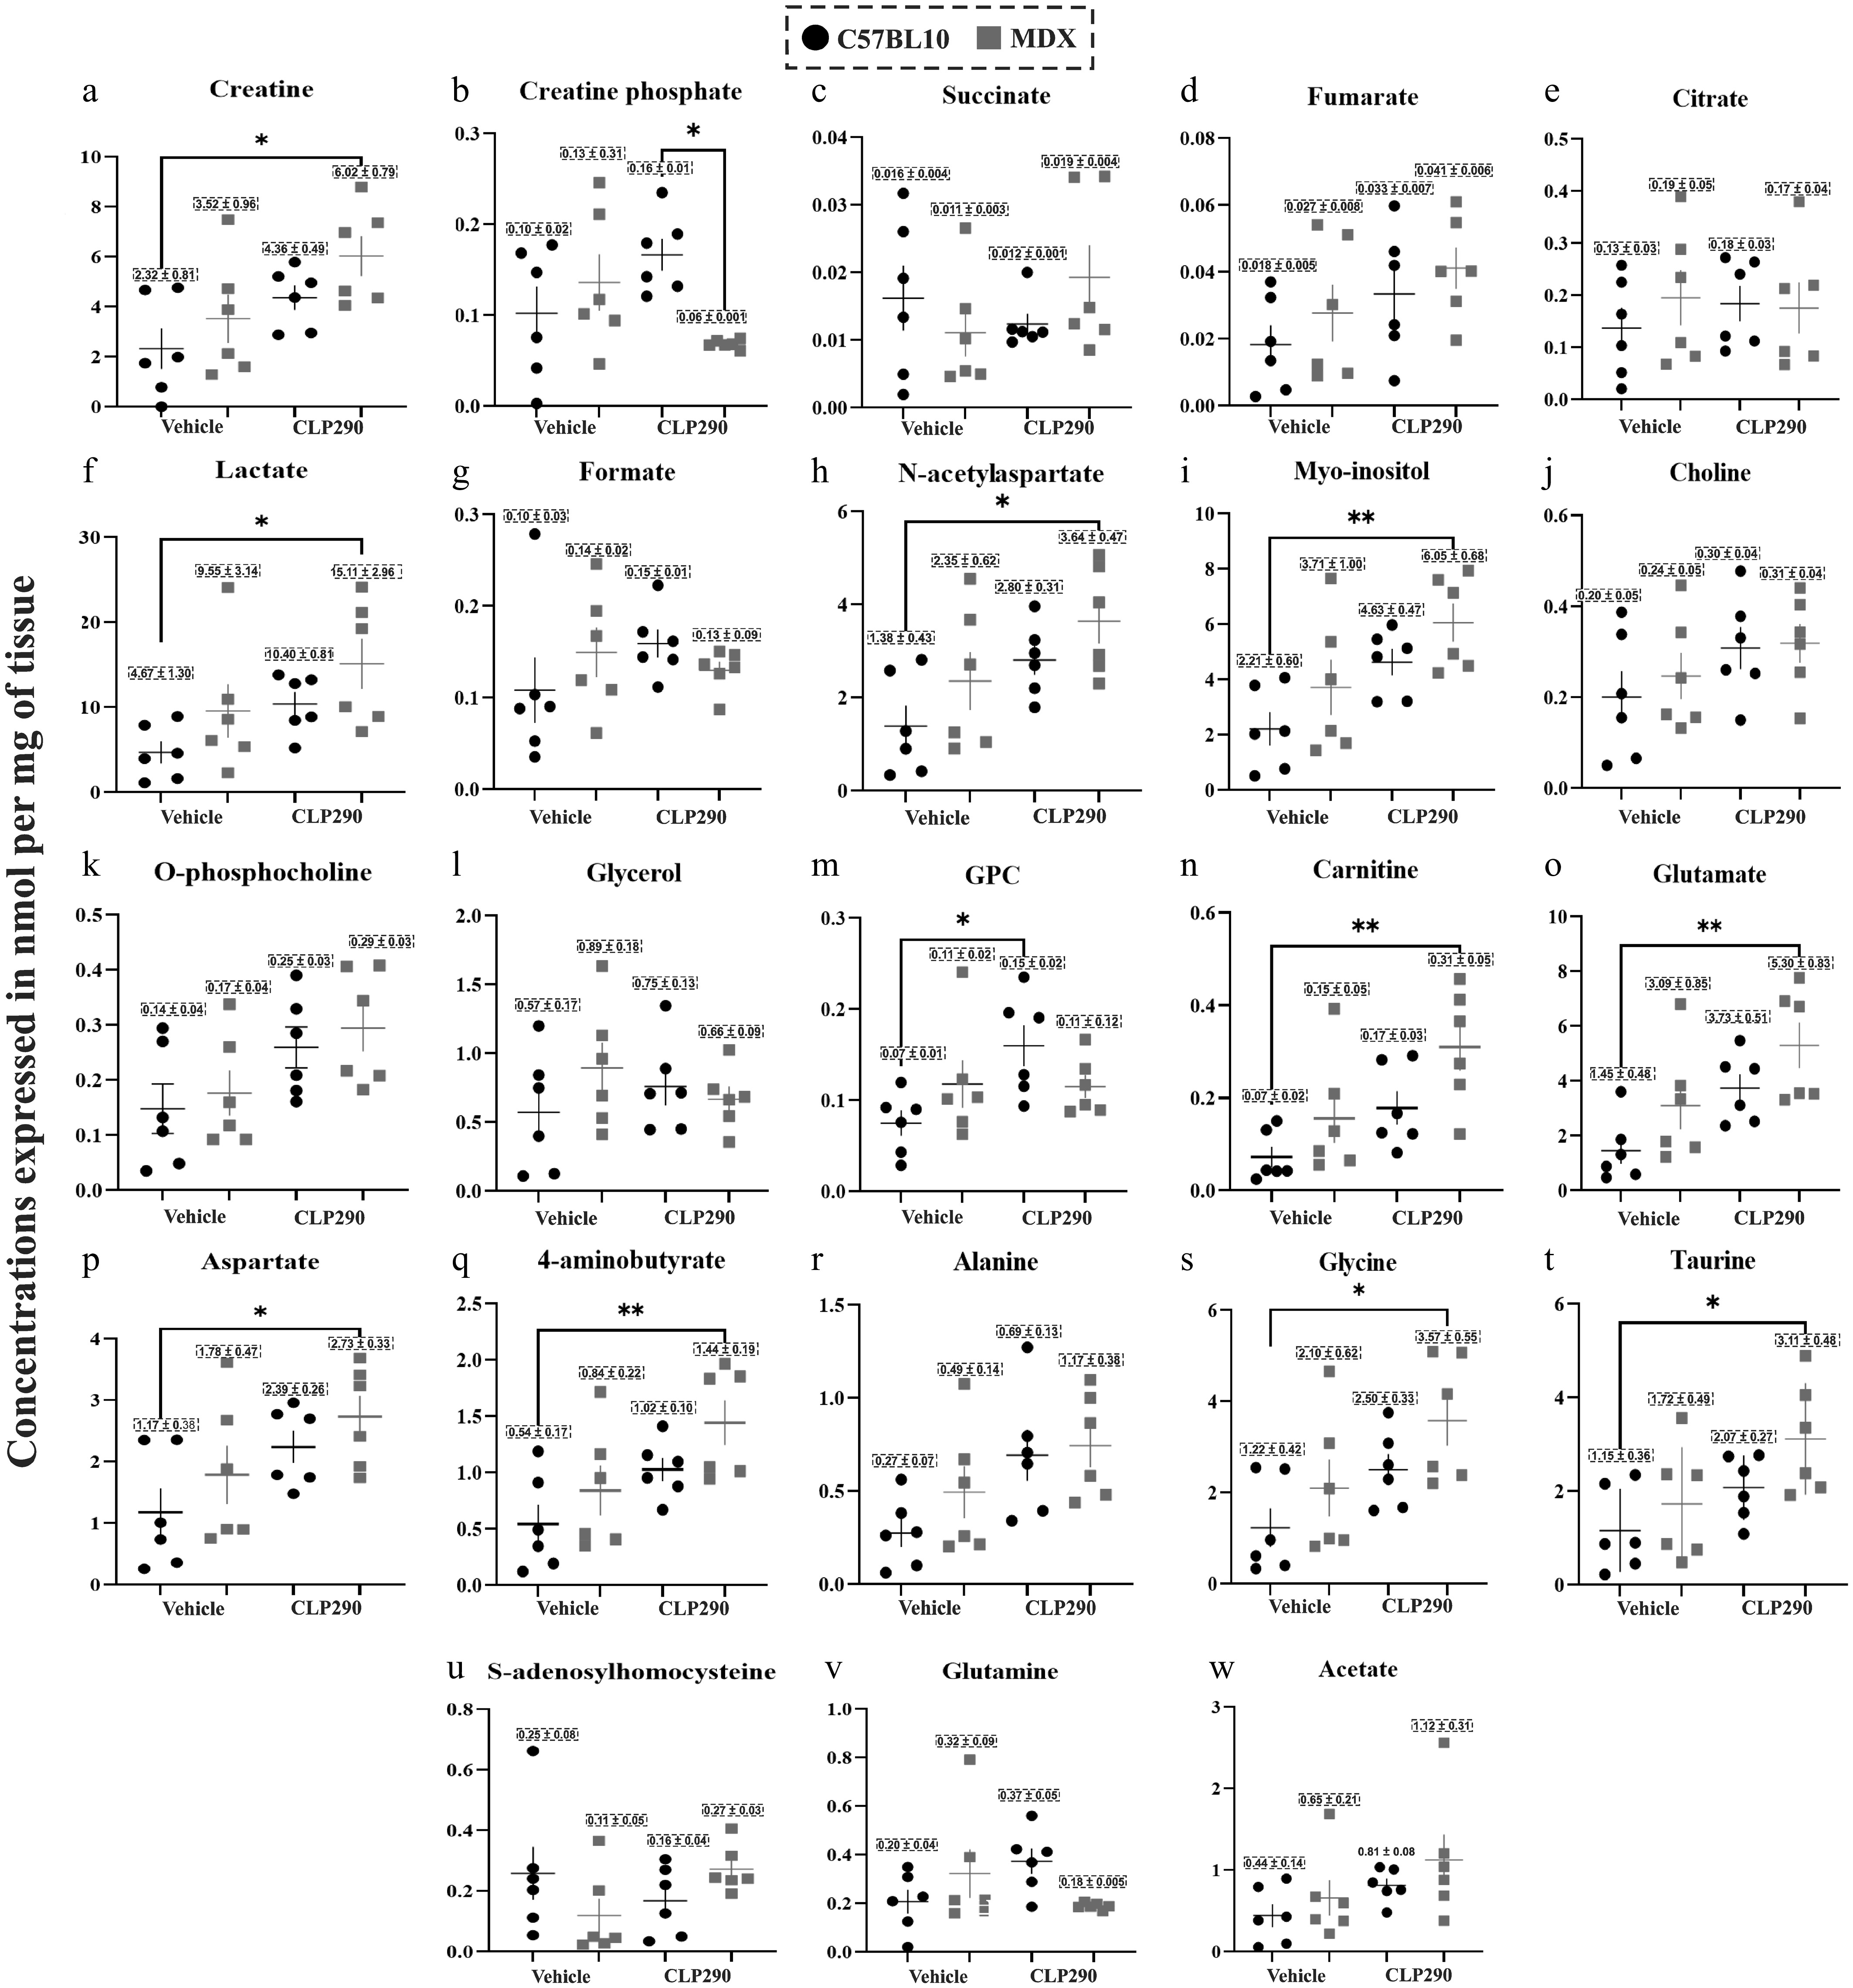
Figure 5.
Quantitative NMR-based analysis of lumbar spinal cord metabolites, expressed as nmol·mg−1 of tissue, in C57BL/10 and MDX mice treated with vehicle or CLP290 for 7 d. (a)–(h) Energy and phosphorylation-related metabolites: (a) creatine, (b) creatine phosphate, (c) succinate, (d) fumarate, (e) citrate, (f) lactate, (g) formate, and (h) N-acetylaspartate. Significant differences between MDX–CLP290 and C57BL/10 vehicle groups were observed for (a) creatine, (f) lactate, and (h) N-acetylaspartate. (c) Succinate and (d) fumarate increased without reaching statistical significance; (e) citrate and (g) formate were unchanged. (i)–(n) Osmoregulation and membrane-related metabolites: (i) myo-inositol, (j) choline, (k) O-phosphocholine, (l) glycerol, (m) glycerophosphocholine (GPC), and (n) carnitine. CLP290 increased (i) myo-inositol and (n) carnitine in both genotypes. GPC increased only in (m) C57BL/10 mice; (j) choline, (k) O-phosphocholine, and (l) glycerol were not significantly altered. (o)–(t) Amino acids: (o) glutamate, (p) aspartate, (q) 4-aminobutyrate, (r) alanine, (s) glycine, and (t) taurine. Significant differences between MDX–CLP290 and C57BL/10 vehicle groups were detected for (o) glutamate, (p) aspartate, (q) 4-aminobutyrate, (s) glycine, and (t) taurine, while (r) alanine remained unchanged. (u)–(w) Nitrogen metabolism-related metabolites: (u) adenosylhomocysteine, (v) glutamine, and (w) acetate, with no statistically significant differences. Data are presented as mean ± SEM, n = 6. Statistical significance: * P < 0.05; ** P < 0.01.
-
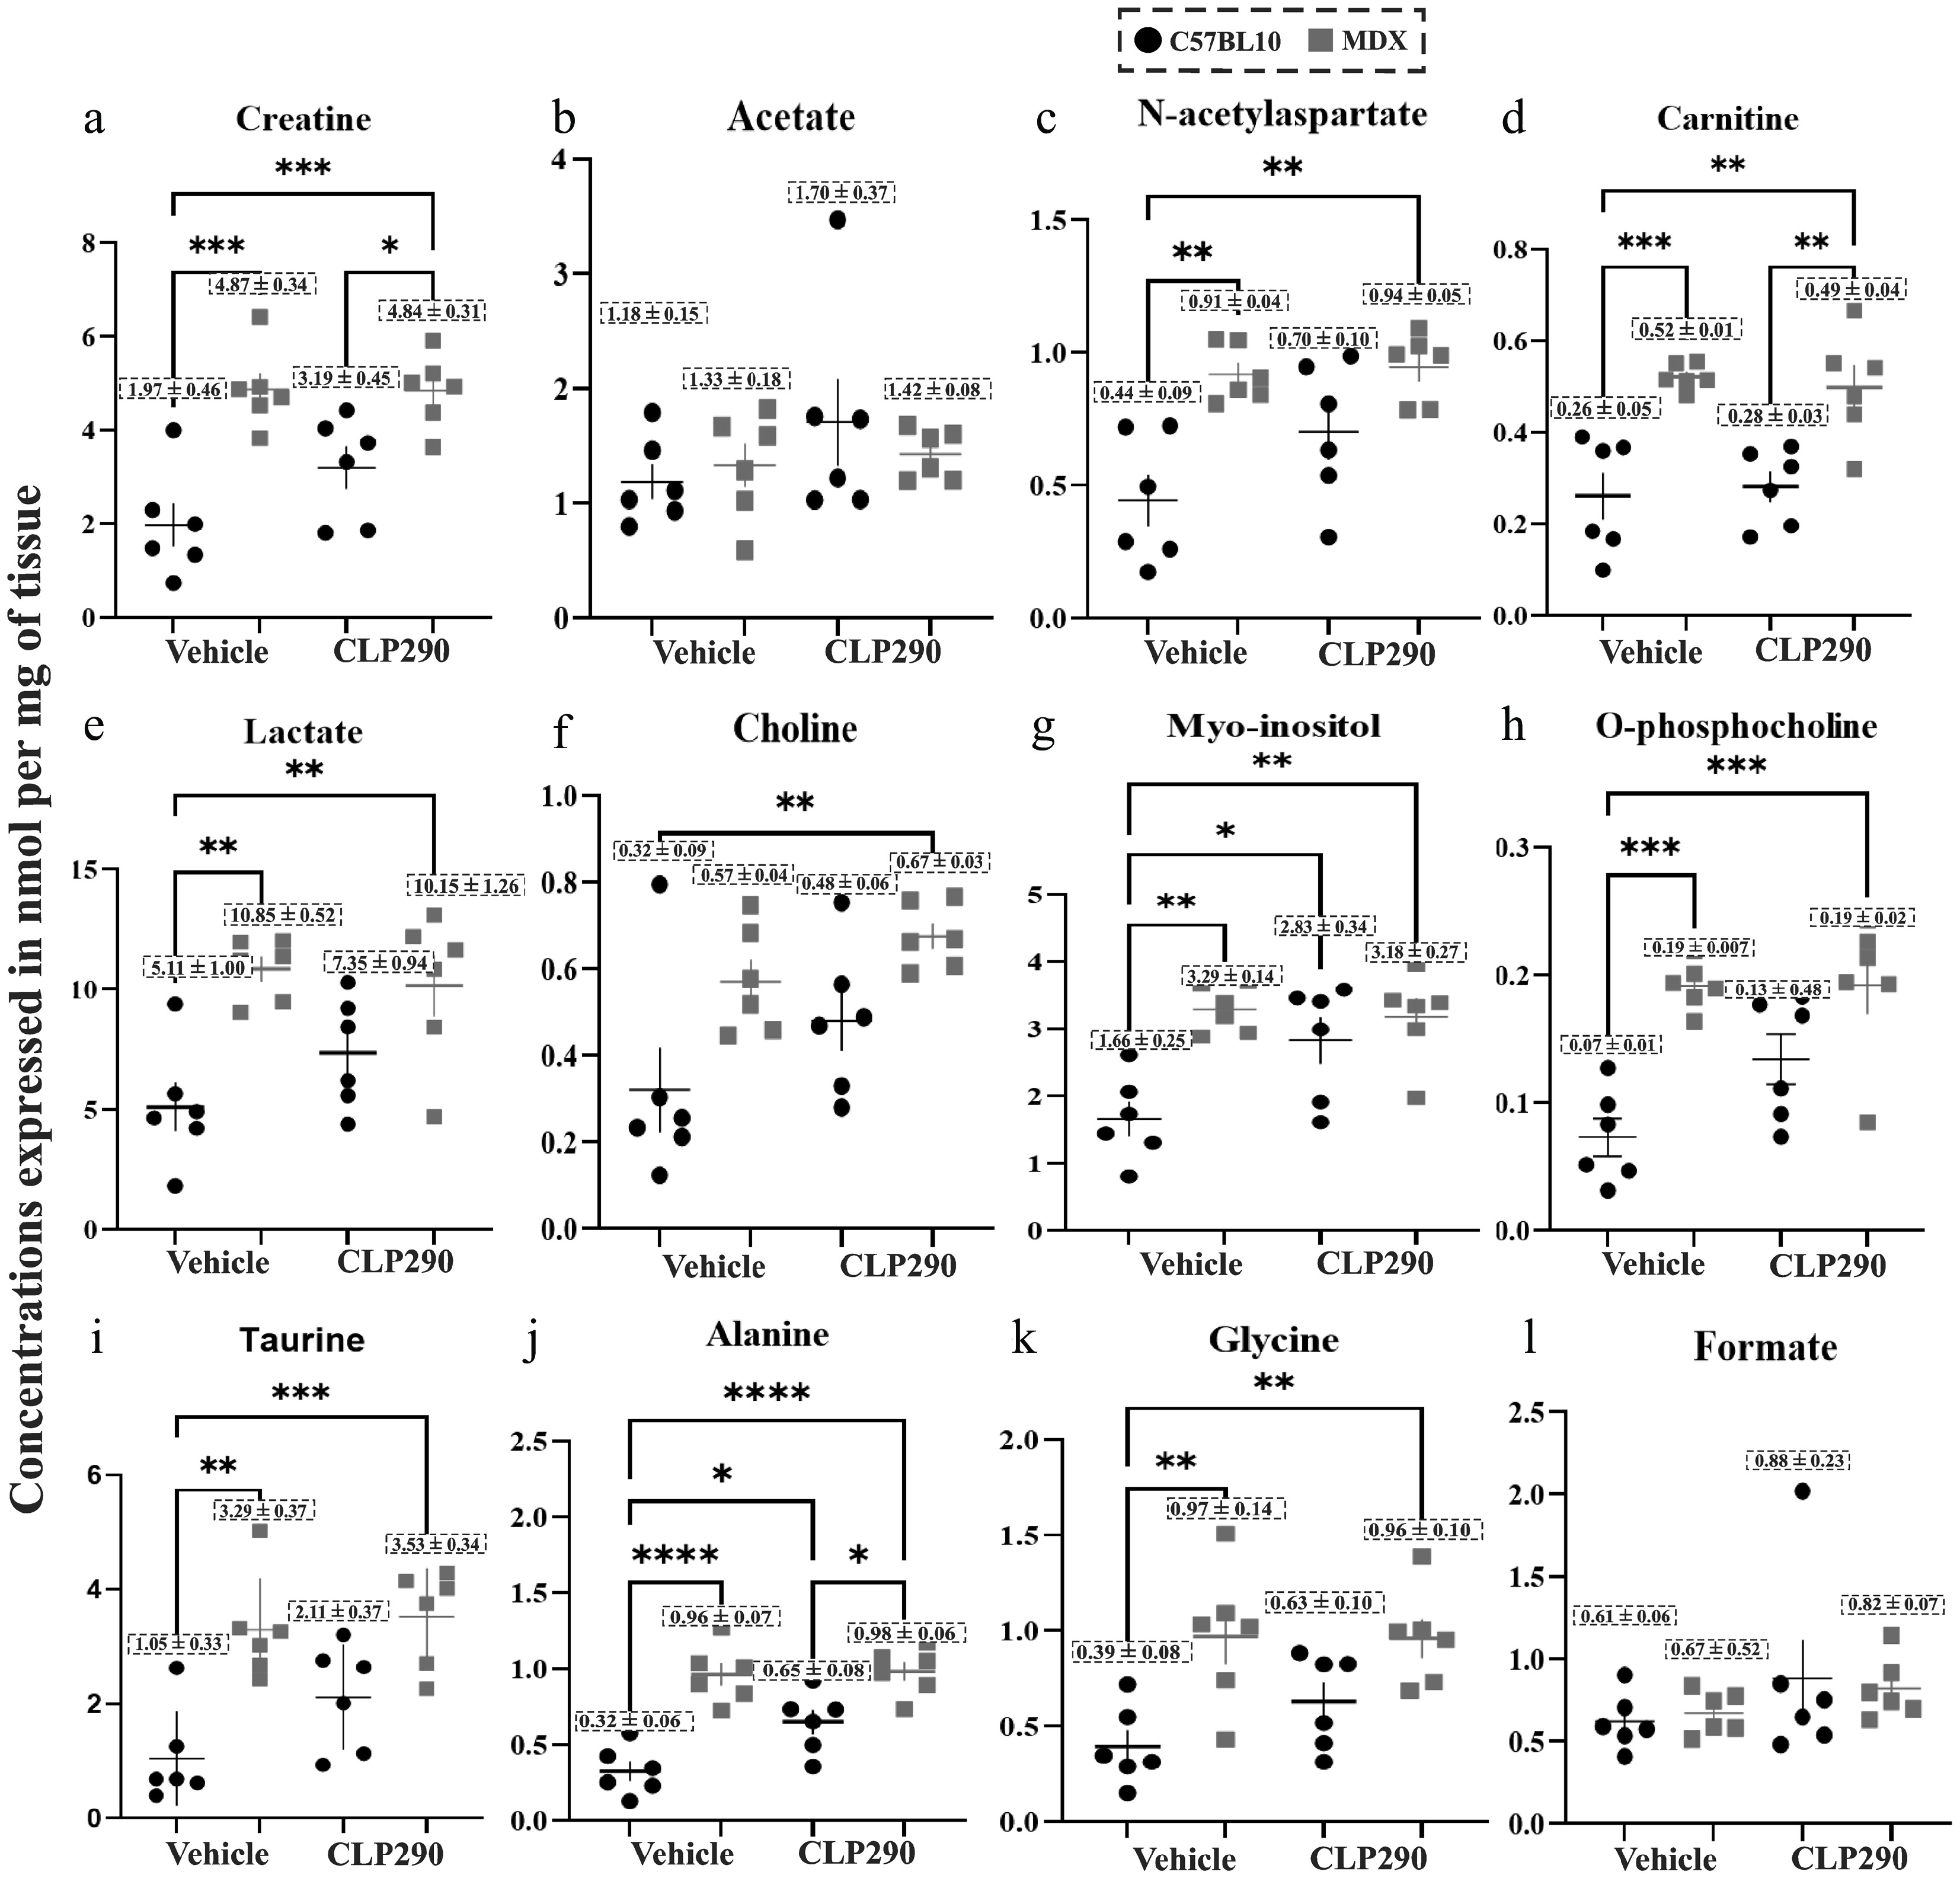
Figure 6.
Quantitative NMR-based analysis of sciatic nerve metabolites (nmol·mg−1 of tissue) in C57BL/10 and MDX mice treated with vehicle or CLP290 for 7 d. Energy and phosphorylation-related metabolites: (a) creatine, (b) acetate, (c) N-acetylaspartate, (d) carnitine, and (e) lactate. Significant differences between MDX and C57BL/10 mice were observed for (a) creatine, (c) N-acetylaspartate, (d) carnitine, and (e) lactate, with CLP290 reducing these differences (a), (d). No statistically significant treatment effect was detected within C57BL/10 mice, although consistent modulation of creatine, N-acetylaspartate, and lactate was observed. Acetate was not modulated: * P < 0.05; ** P < 0.01; *** P < 0.001. (f)–(h) Osmoregulation and membrane-related metabolites: (f) choline, (g) myo-inositol, and (h) O-phosphocholine. MDX mice exhibited higher concentrations under both conditions. CLP290 increased choline and O-phosphocholine and significantly elevated myo-inositol in C57BL/10 mice: * P < 0.05; ** P < 0.01; *** P < 0.001. (i)–(k) Excitatory and inhibitory amino acids: (i) taurine, (j) alanine, and (k) glycine. Under vehicle-treated conditions, MDX mice showed higher concentrations. CLP290 did not significantly affect taurine or glycine but differentially modulated alanine, increasing it in C57BL/10 mice and reducing it in MDX mice, while remaining elevated in MDX mice: * P < 0.05; ** P < 0.01; *** P < 0.001; **** P < 0.0001. (l) Nitrogen metabolism and methylation: formate concentrations showed no statistically significant differences. Data are presented as mean ± SEM, n = 6.
-
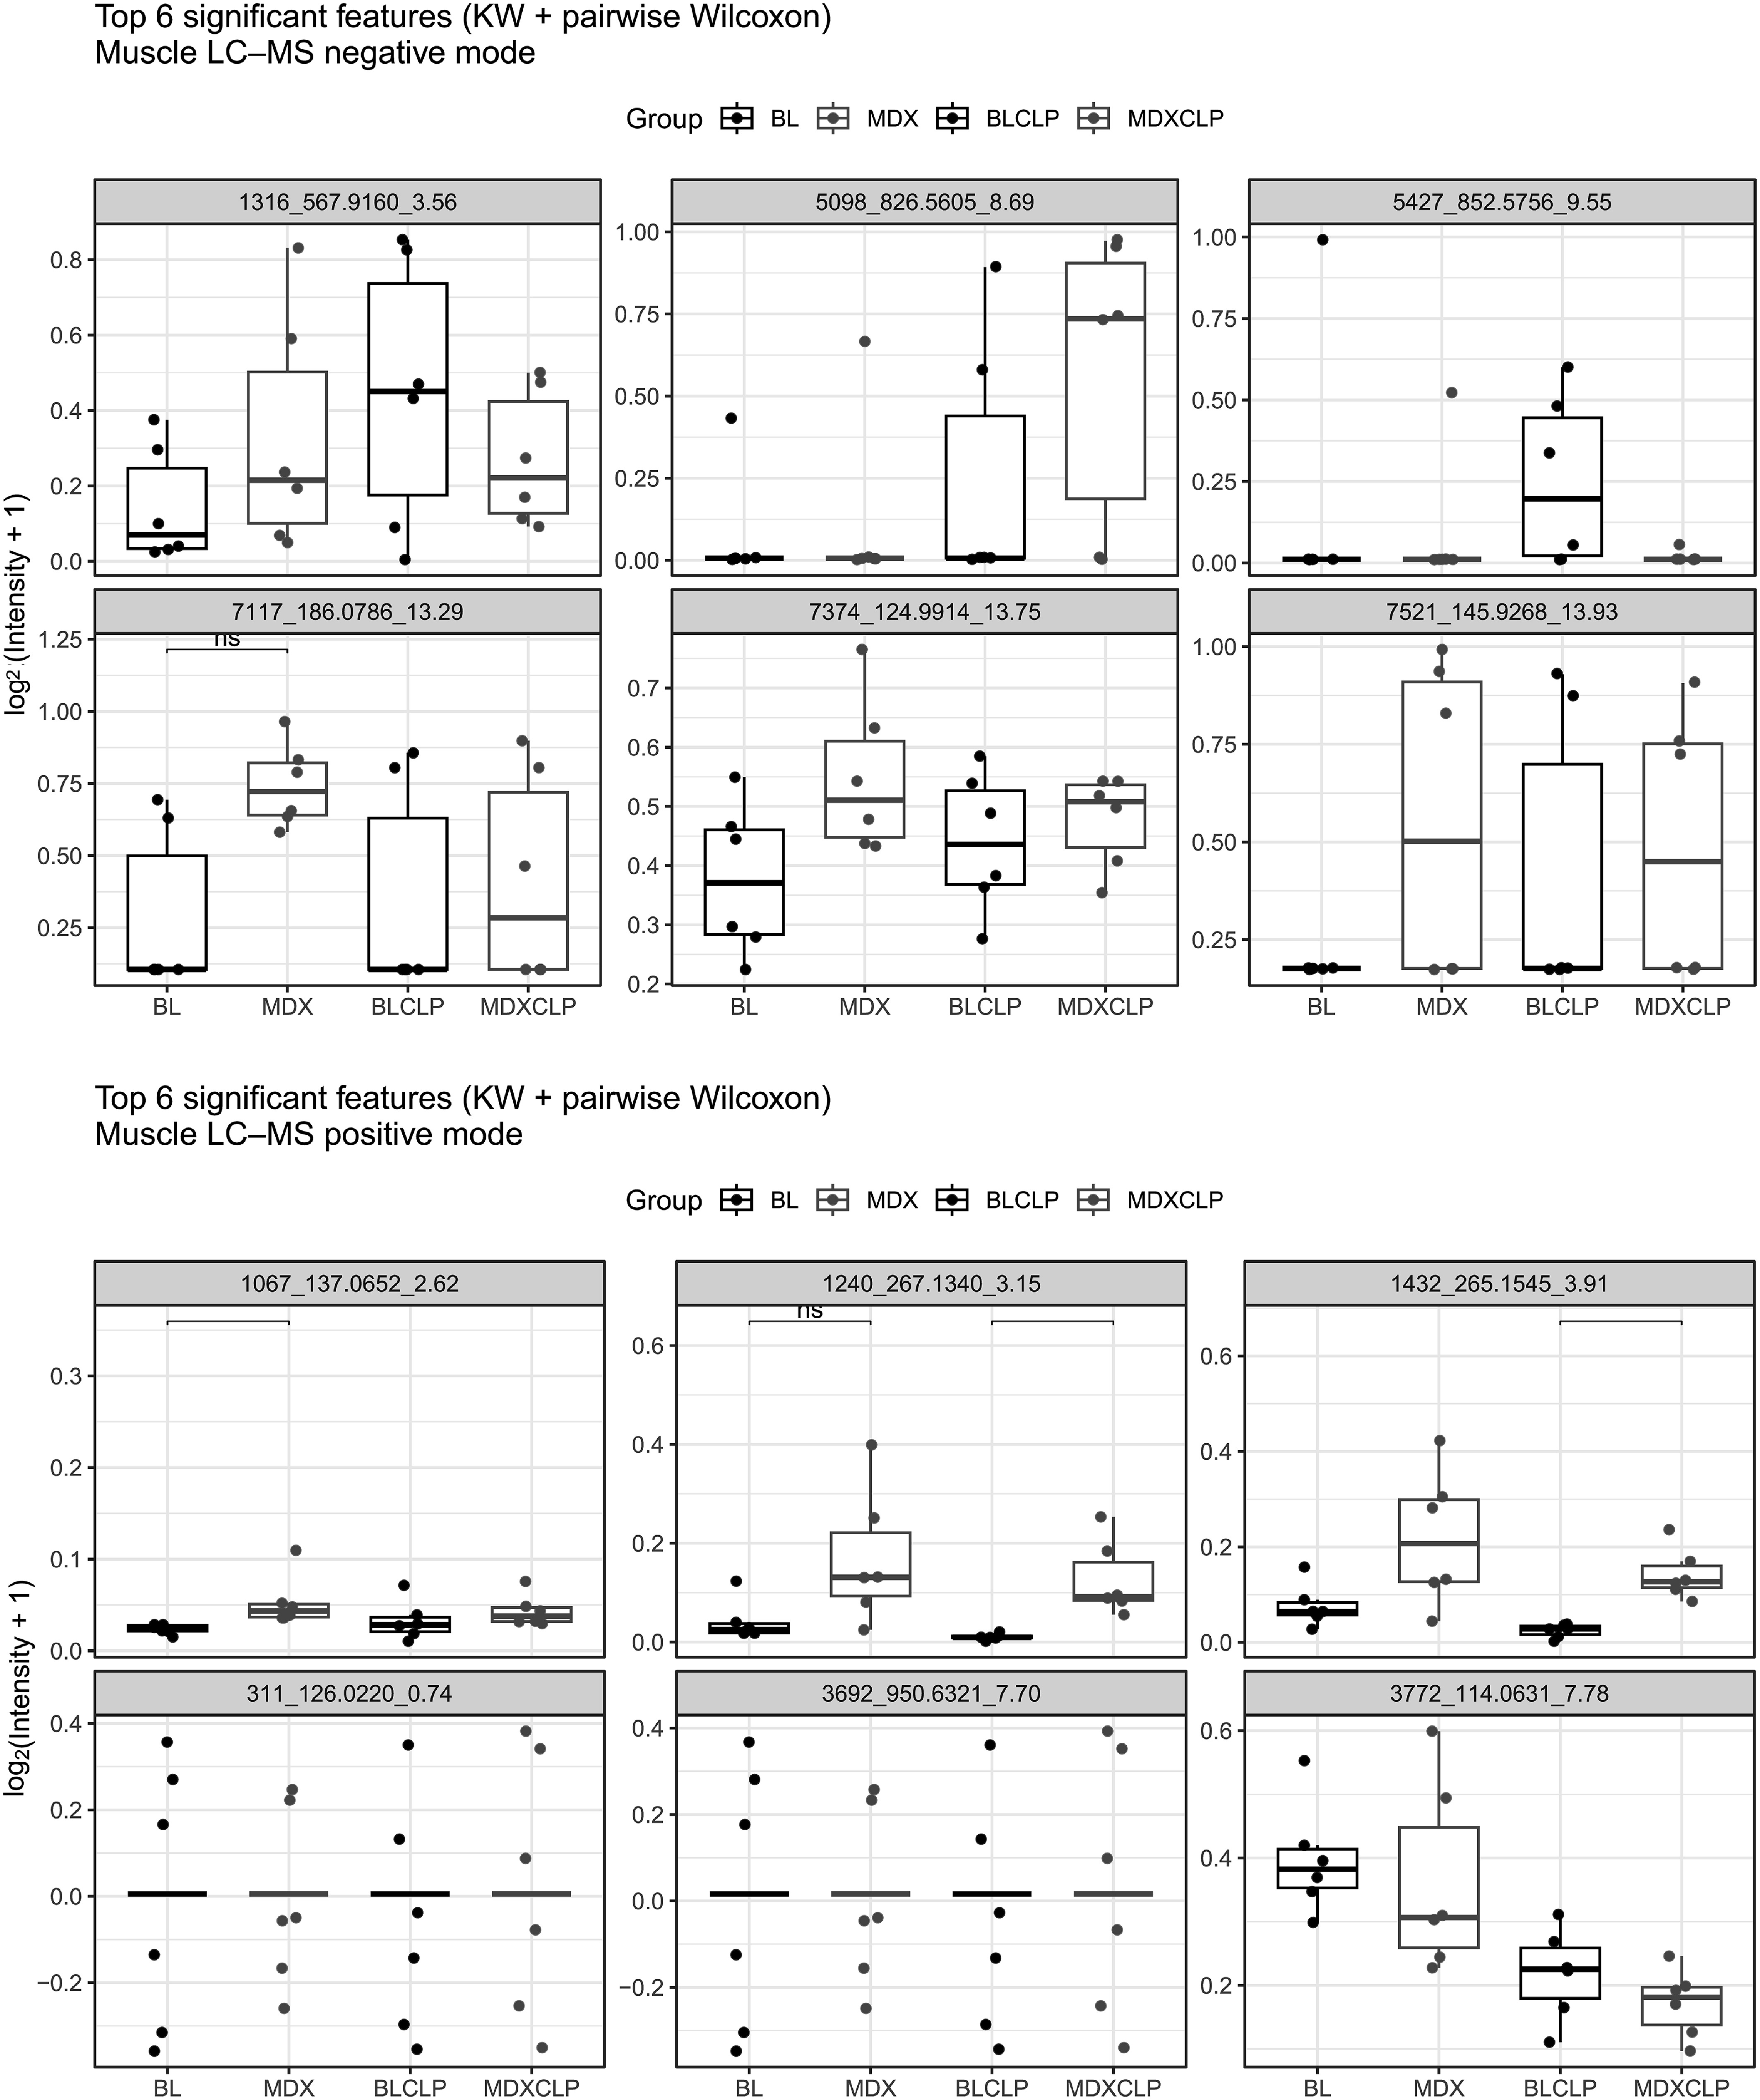
Figure 7.
Boxplots in positive and negative ion modes, respectively, show the distribution of normalized intensities [log2(intensity + 1)] for the six most significant features selected based on the Kruskal–Wallis analysis across the BL, MDX, BLCLP, and MDXCLP groups. Each panel corresponds to a specific feature (m/z and retention time), with individual points representing biological replicates. The plots reveal consistent differences between control and MDX muscle samples, as well as additional modulation associated with CLP290 treatment. Predefined pairwise comparisons (BL vs MDX and BLCLP vs MDXCLP) were performed using the non-parametric Wilcoxon test with Benjamini–Hochberg correction for multiple testing, and statistically significant differences are indicated directly on the boxplots.
-
Groups Catwalk analysis Immuno histochemistry Western blotting NMR Metabolomics C57BL/10JUnib-Vehicle 6 5* 6* 6 6 C57BL/10Unib-CLP290 18§ 6* 5* 6 6 C57BL/10-Dmd<mdx>/PasUnib-Vehicle 6 6* 6* 6 6 C57BL/10-Dmd<mdx>/PasUni-CLP257 18§ 6* 6* 6 6 § Two groups with (n = 18) and two groups with (n = 6), tested at doses of 1, 5, and 10 mg·kg−1. * The same mice were used for the different techniques. Table 1.
Experimental groups, mouse strains, treatments, and evaluation methos used throughout the study.
-
Antibody/neurotoxin Manufacturer Host Cat. number Concentration KCC2 Millipore Rabbit 07-432 1:500 VGLUT1 Synaptic systems Rabbit 135,303 1:1,000 GAD65 Abcam Mouse ab26113 1:750 AMPA Abcam Rabbit ab31232 1:750 CHAT Abcam Sheep Ab18736 1:500 GFAP Abcam Rabbit ab7260 1:1,000 DYSTROPHIN§ Invitrogen Rabbit PA589628 1:1,000 § Antibody used for Western blotting. Table 2.
Primary antibodies used for immunohistochemistry and Western blotting analysis.
-
Assay CatWalk Groups BLVehicle MDXVehicle BLCLP290 MDXCLP290 Base of support 3.30 ± 0.03 3.30 ± 0.06 2.90 ± 0.03 3.00 ± 0.03 Max contact area left 0.42 ± 0.01 0.45 ± 0.01 0.30 ± 0.01 0.36 ± 0.01 Max contact area right 0.41 ± 0.01 0.41 ± 0.01 0.30 ± 0.01 0.33 ± 0.01 Table 3.
Functional improvement with CLP290 treatment, 10 mg/kg/d, during the 4th week of life of dystrophic MDX mice and C57BL/10 controls.
Figures
(7)
Tables
(3)