-
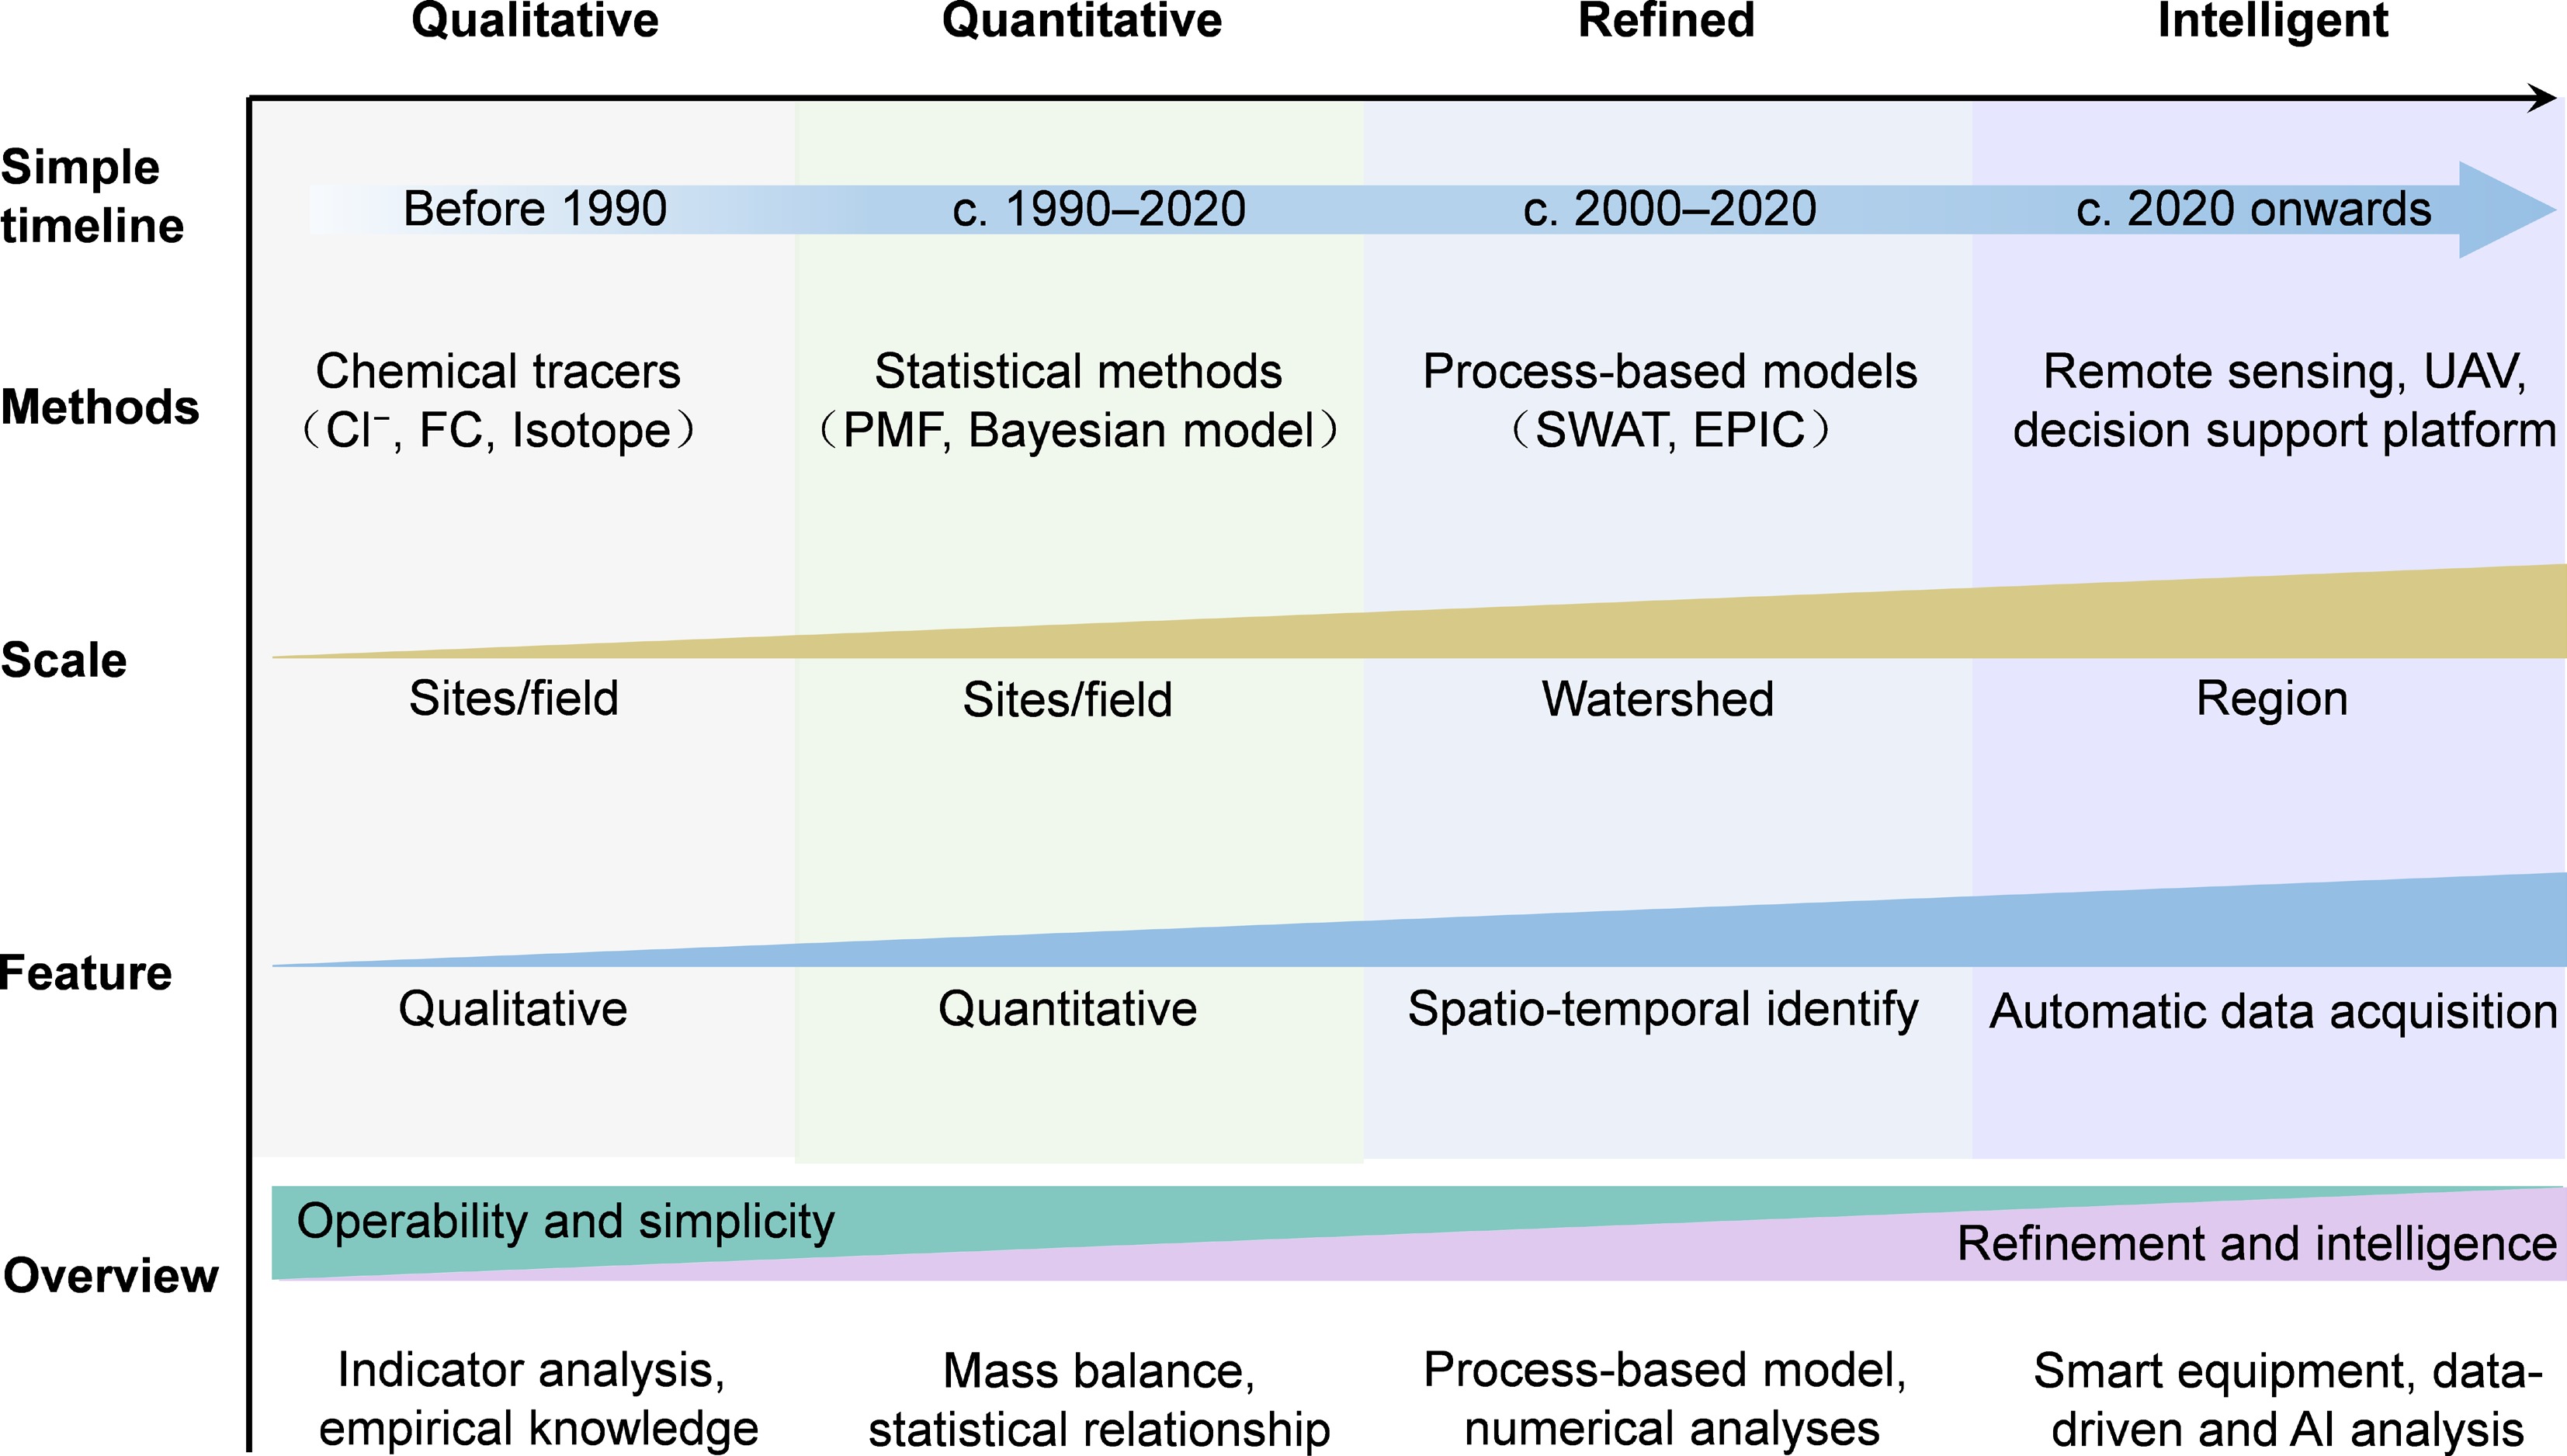
Figure 1.
Classification and overview of methods for watershed nitrogen source apportionment. These methods are classified into four categories according to their objectives: qualitative approaches, quantitative approaches, spatiotemporally refined approaches, and intelligent technologies. Their corresponding methodological principles, applicability, and characteristics are described. FC, fecal coliform; PMF, positive matrix factorization; SWAT, soil and water assessment tool; EPIC, environmental policy integrated climate; UAV, unmanned aerial vehicle.
-
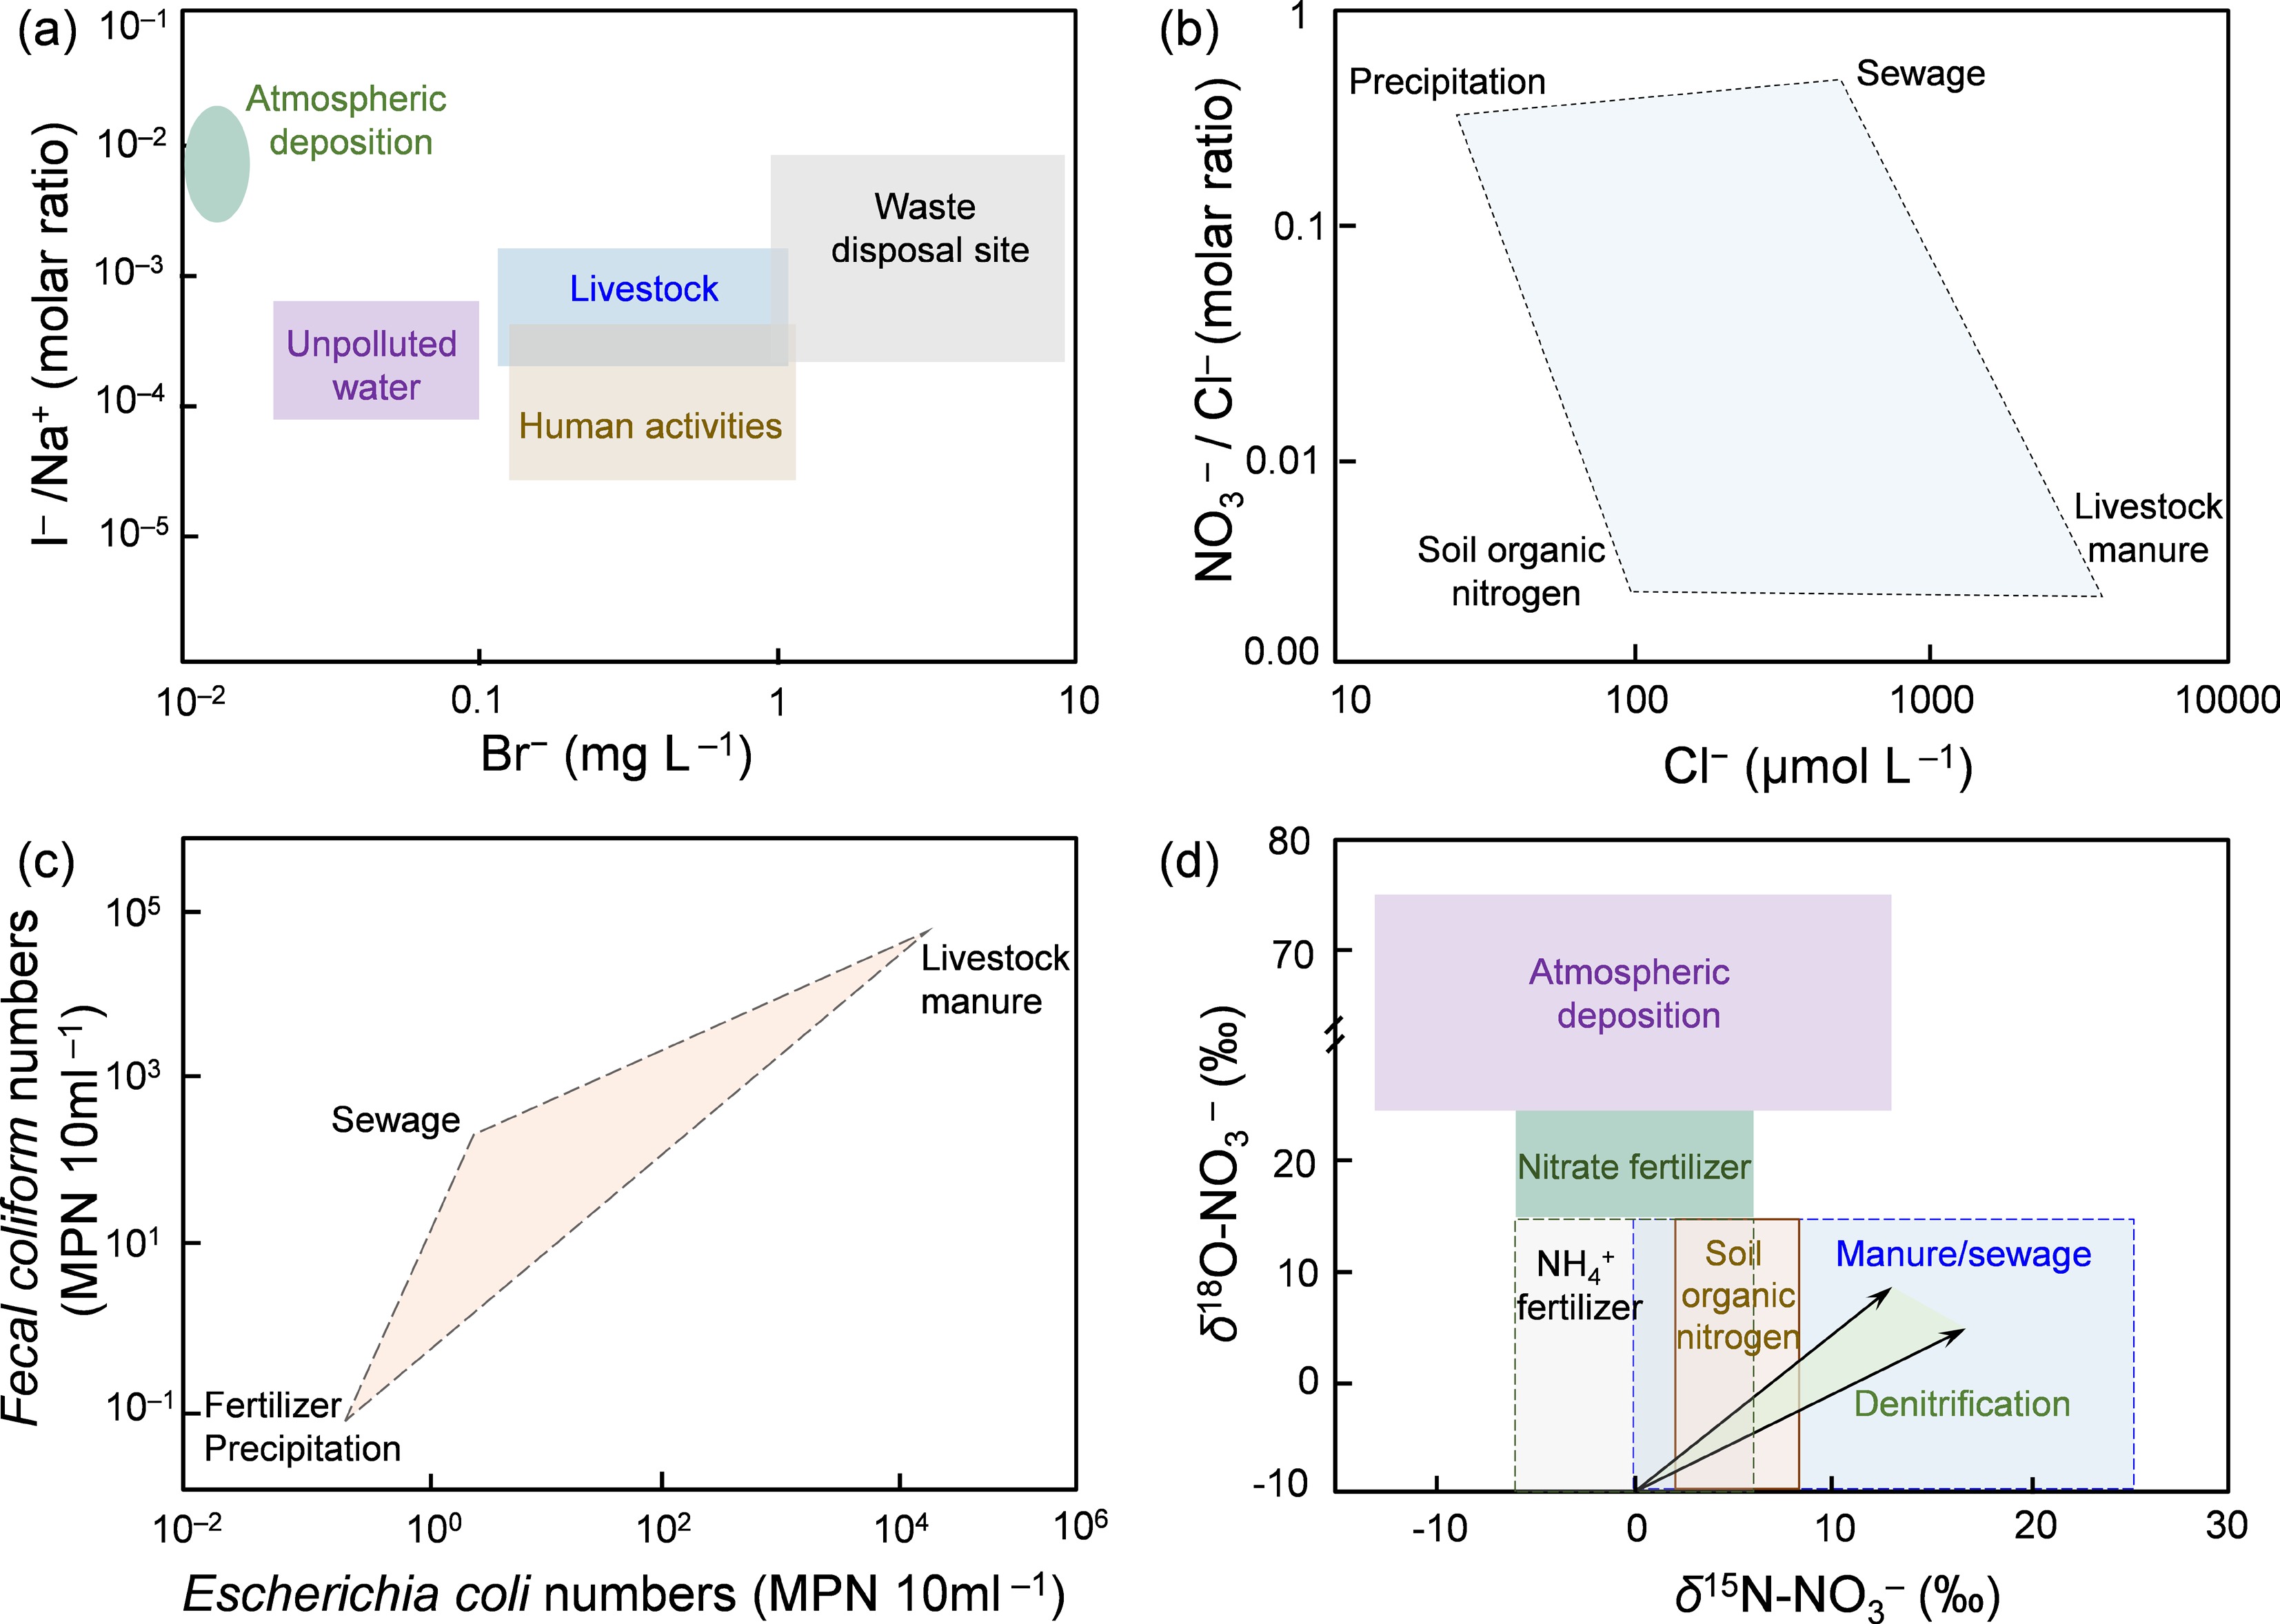
Figure 2.
Representative qualitative methods for watershed nitrogen source apportionment. Different shades and positions represent the concentration and distribution characteristics of tracers from different sources.
-
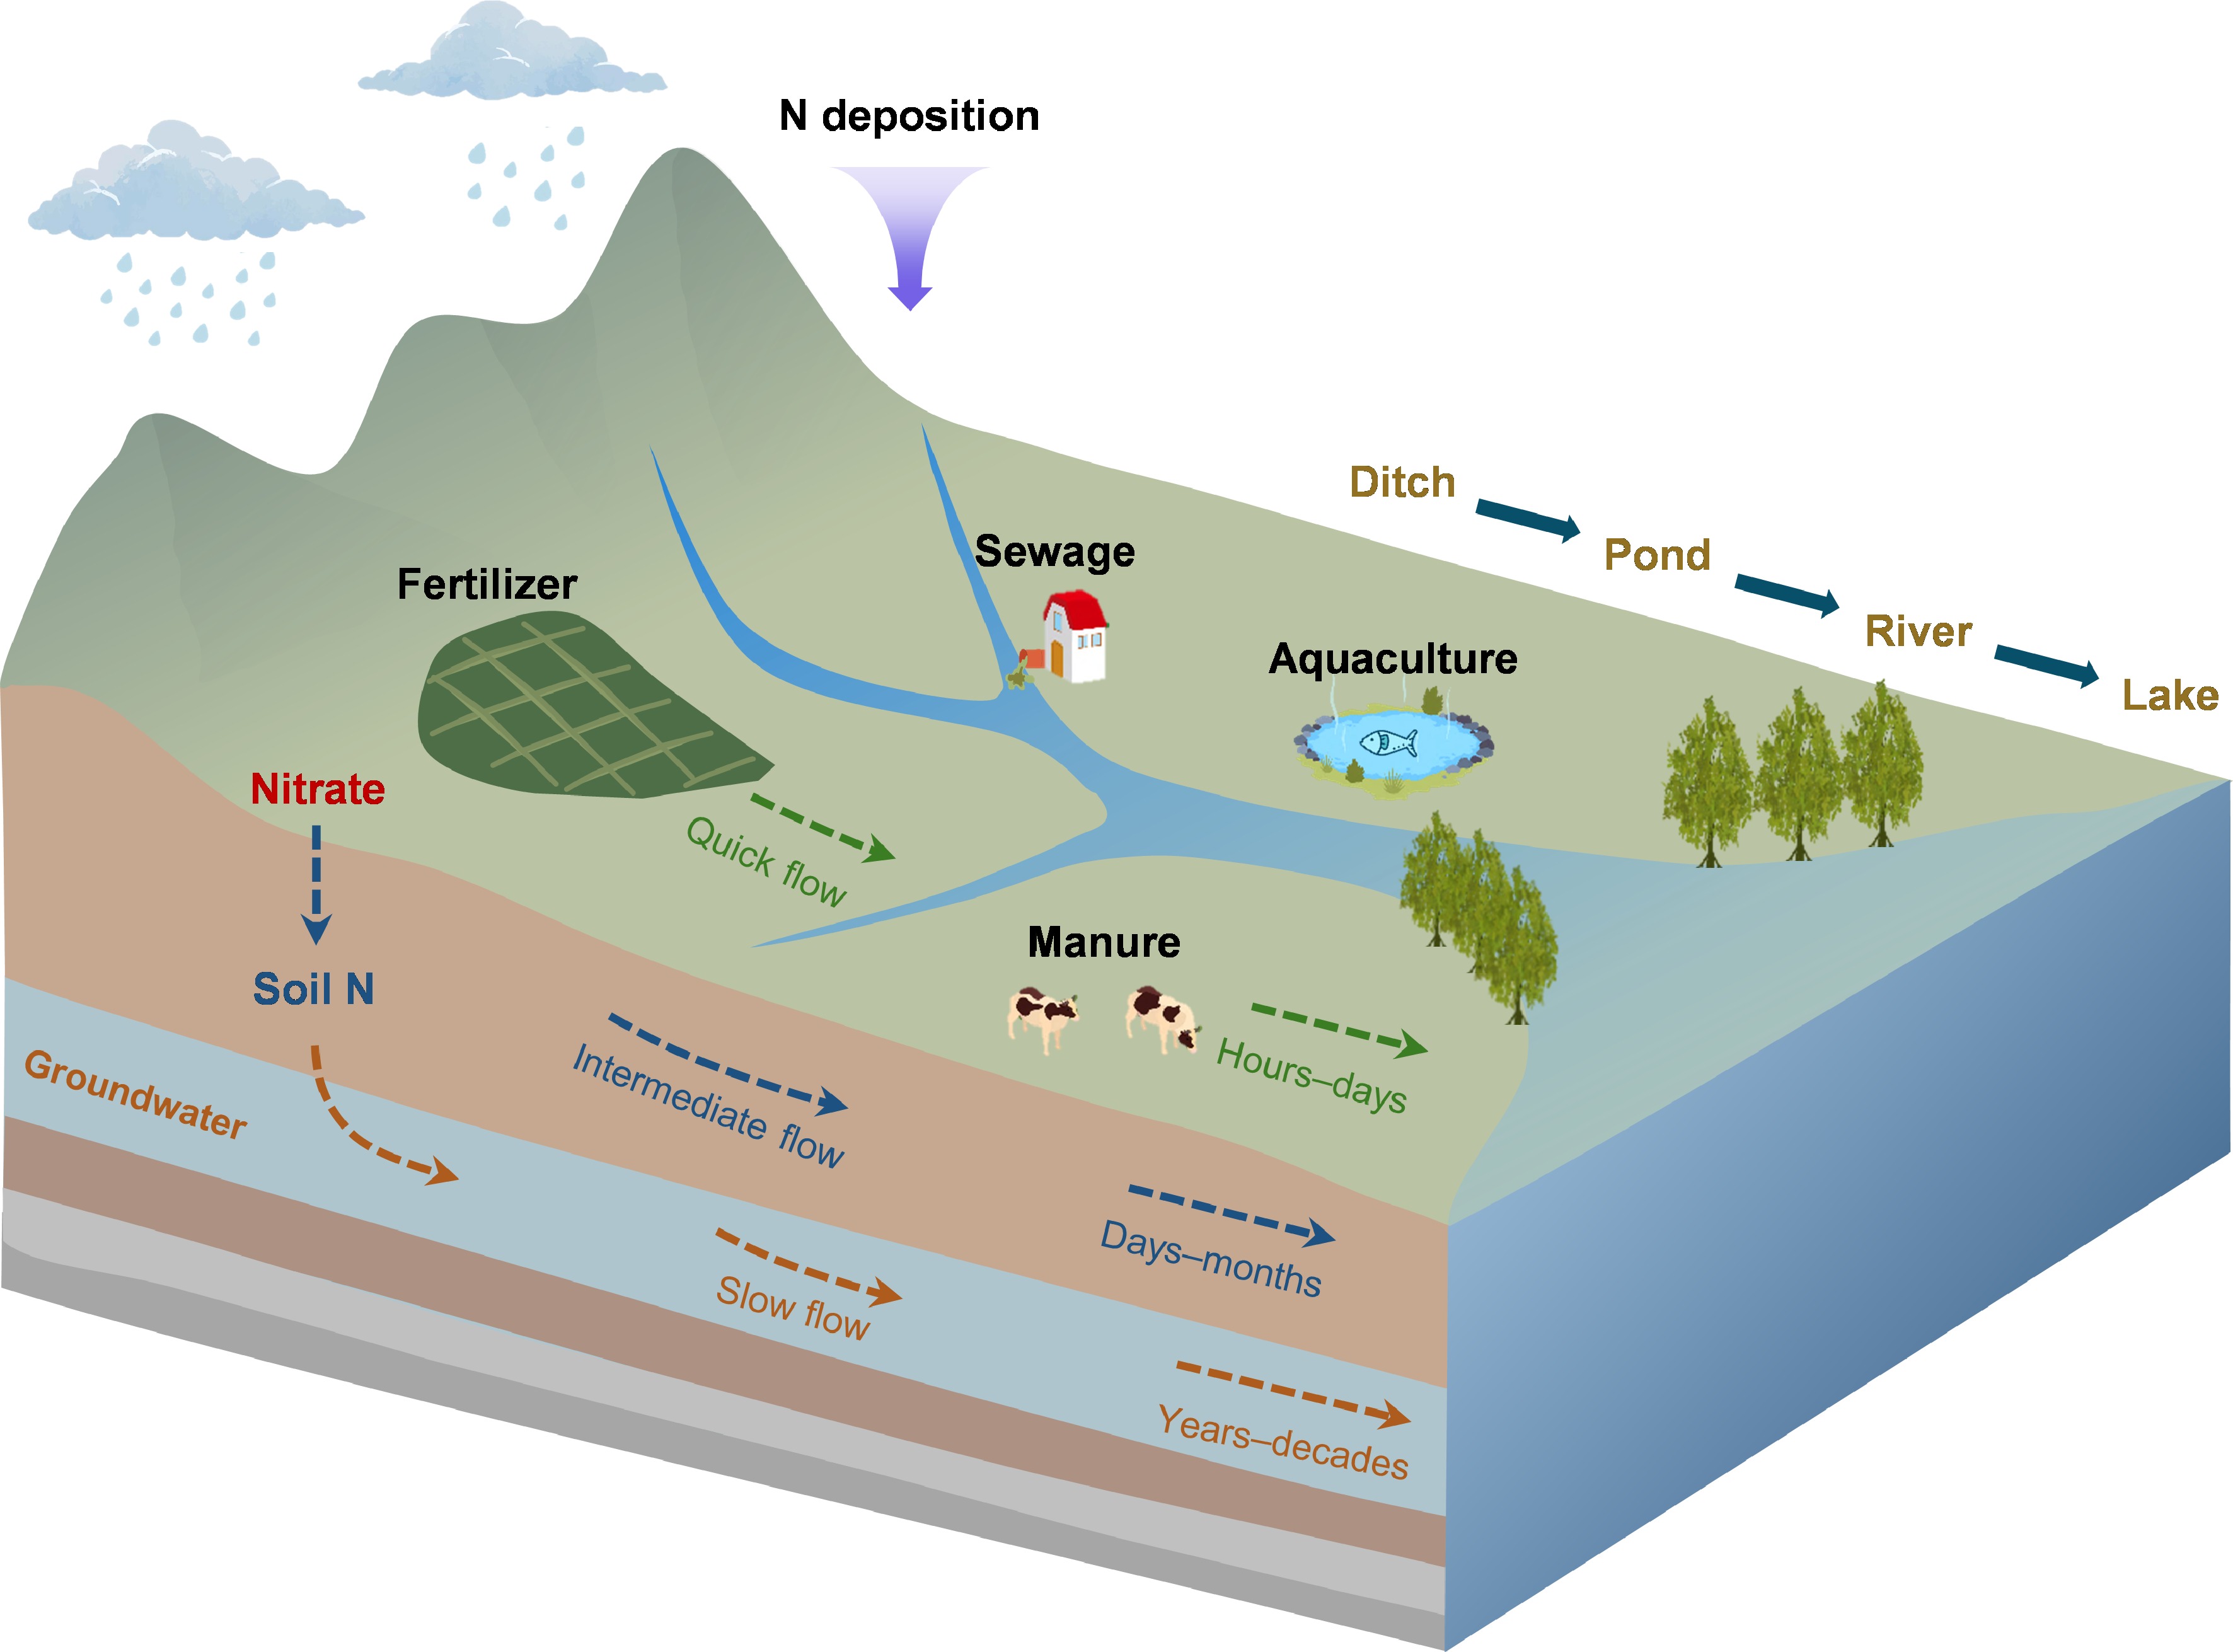
Figure 3.
Processes and spatiotemporal characteristics of nitrogen transport in watersheds. Watersheds' non-point sources of nitrogen typically include fertilizer, livestock waste, rural domestic sewage, atmospheric deposition, and aquaculture. These pollutants are transported into water bodies through the surface, vadose zone, and groundwater as quick, intermediate, and slow flow, with travel times spanning from days to months and decades.
-
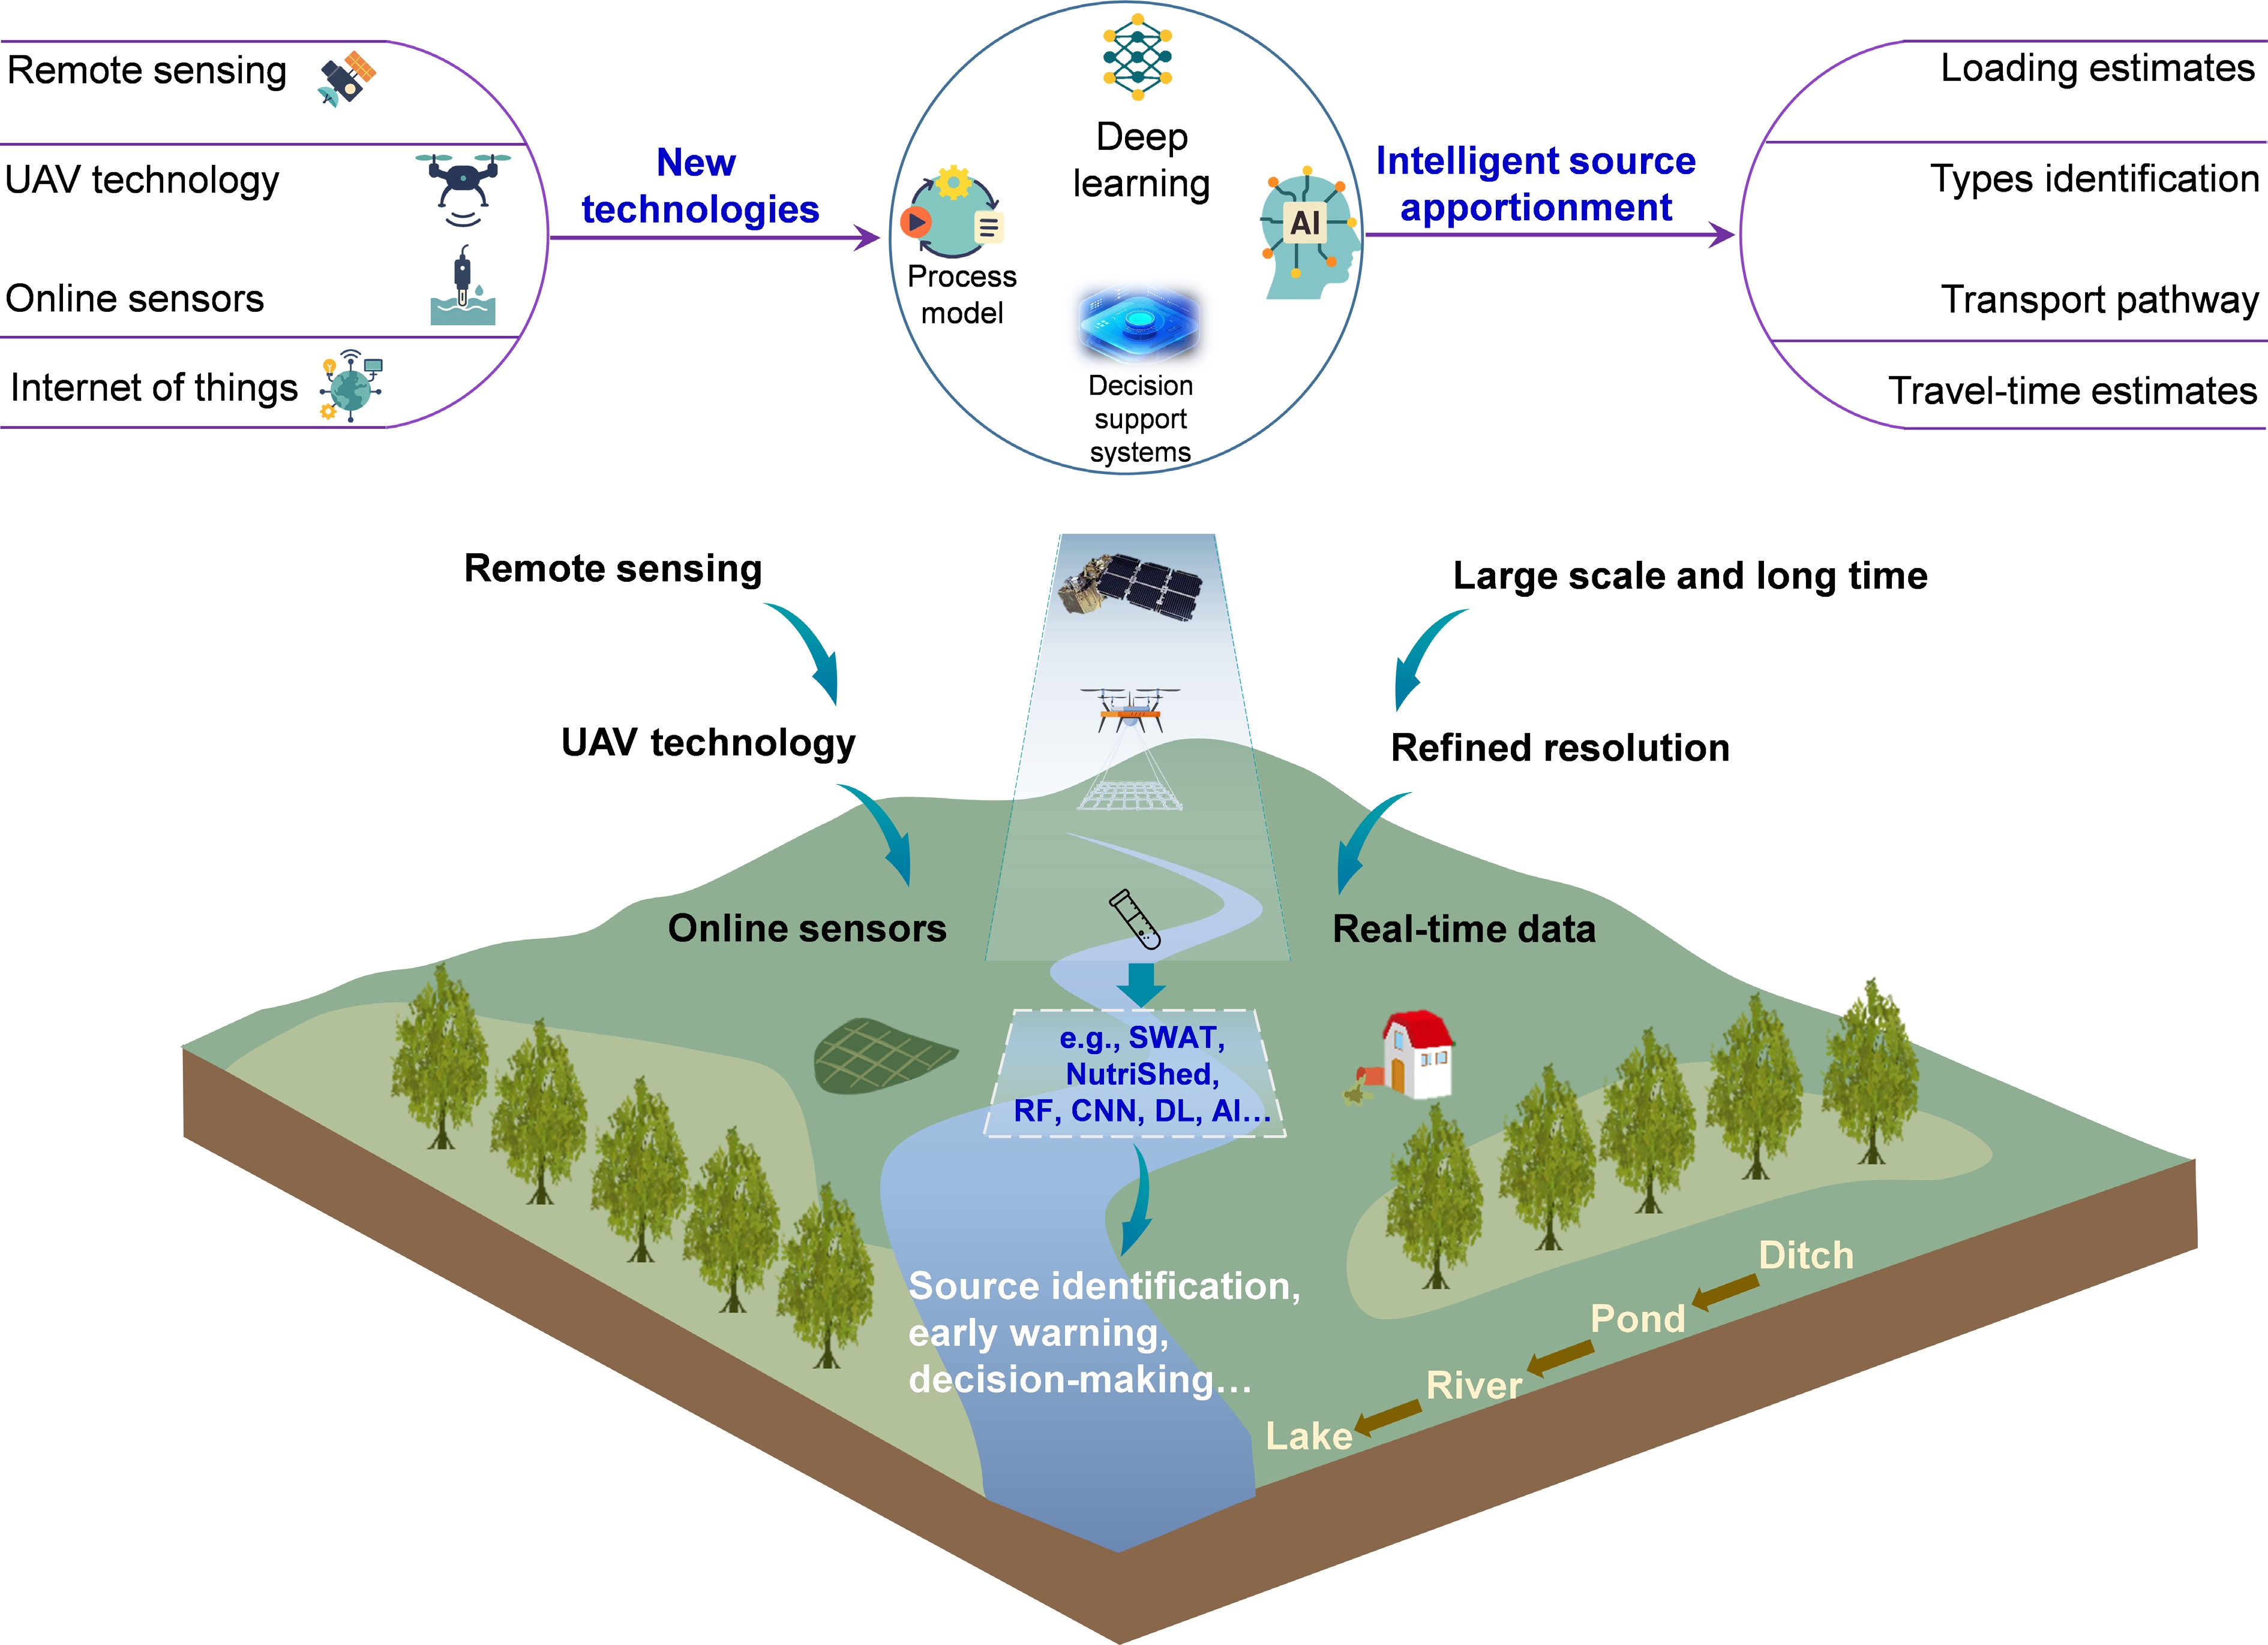
Figure 4.
Intelligent technology and prospects of watershed nitrogen source apportionment. The intelligent source apportionment system acquires data via remote sensing, UAV, and sensor technologies, integrating process-based models with AI-driven data processing to characterize the dynamics of pollutant transport. This system has the advantages of large-scale monitoring and high-resolution spatiotemporal analysis, as well as providing targeted decision-making support for watershed management.
-
Qualitative Quantitative Spatiotemporally refined Intelligent technologies Representative techniques Cl− and NO3−/Cl− ratio Bayesian isotope models Process-based model Remote sensing N species involved NH4+, NO3− NO3− Total nitrogen (TN), NO3− TN Uncertainty range High
(environmental variability; e.g., rainfall dilution, temperature, pH decay)Moderate to high
(overlapping isotopic signatures and fractionation (e.g., when the source error increases from 2‰ to 4‰, the standard error of apportionment results increases by 50% for the single isotope, dual-end-member model)Moderate
(extensive parameter estimation, simplification of complex physical mechanisms, and data scarcity in unmonitored regions)Low to moderate
(remote sensing resolution, sensor calibration, cloud cover, algorithmic biases, and insufficient mechanistic representation in complex conditions)Applicable scale Sites, field Sites, sub-basin Sub-basin, watershed Regional, large-scale basins Applicable N source types Sewage, livestock, runoff, groundwater Atmospheric deposition, fertilizer, soil nitrogen, manure/sewage Cropland, rural life, urban area, atmospheric deposition Landscape-scale agricultural NPS, dynamic pathway tracking, hydrological components separation Typical data requirements Chemical ion concentrations Isotopic ratios Meteorological data, land-use maps, soil properties, fertilizer intensity, water quality data Satellite imagery, unmanned aerial vehicle-based high-resolution images, real-time in situ sensor networks, big data Advantages Rapid qualitative identification, operability, and simplicity Quantifies fractional contributions and uncertainty ranges Provides explicit spatial (pathways) and temporal patterns; enables scenario assessment and policy evaluation High spatiotemporal resolution over large scales, automated data collection in real time Limitations Cannot quantify fractional contributions Lacks spatiotemporal tracking, high uncertainty Requires extensive model parameters/data; complex to calibrate High infrastructure/deployment costs, inadequate mechanistic representation, challenges in integrating disparate departmental databases Application examples Differentiating sewage (high Cl−) vs fertilizer runoff (low Cl−)[26,27] Quantifies rainfall, sewage, fertilizer, and soil N in Taihu (China), Naugatuck River (USA), and Flanders (Belgium)[28−30] Widespread application of the SWAT model globally[31] DPeRS predicting agricultural pollution dynamically; Sentinel-2 mapping river water quality transport pathways[32,33] Table 1.
A comprehensive comparison of representative techniques of different methods
-
Typical model Fully process-based models Semiempirical and process models SWAT HSPF NutriShed SPARROW Spatial scale Hydrologic response unit (HRU), sub-basin HRU, sub-basin, catchment segment Grid-cell resolution (e.g., 30 m × 30 m) Regional, basin, continental scale Temporal scale Daily, monthly, annual Subhourly to daily Rainfall event, annual Steady-state long-term annual or seasonal mean Typical input data requirements Topography (DEM), land-use, soil properties, daily weather data, agricultural management practices High-frequency meteorological data, land use, detailed channel cross-section geometries Spatially explicit pollutant
source inputs, DEM for flow routing, retention coefficientsSpatially distributed nutrient sources, land-to-water delivery efficiency, digital stream network topology Advantages Comprehensively simulates biogeochemical processes; high accuracy Captures highly detailed in-stream hydrologic and water quality dynamics (e.g., storm events); adjustable HRU Balancing data requirements
and accuracy; grid-spatially explicit source and retention identificationSimple to implement; easily targets large-scale or continental sources Limitations High data/parameter demand; complex calibration process; fails to simulate flood events High data/parameter demand; high uncertainty associated with the empirical formulas and parameters Simplifies complex biogeochemical processes; sacrifices some accuracy compared with full process models Fails to capture short-term dynamic variations; relies heavily on high-quality monitoring networks for calibration Table 2.
Comparison of representative fully process-based and semiempirical and process models for watershed N source apportionment
-
Strategic direction Priority research questions Actionable steps Expected outcomes 1. Space–air–ground data collection and integration 1. How can we ensure the data quality of automated monitoring networks?
2. How can we harmonize multiscale spatial and temporal data from satellites, UAVs, and sensors?1. Implement algorithms such as text recognition to identify anomalous data, followed by manual inspection.
2. Establish standardized database protocols to unify multisource data formats and databases.A reliable, high-resolution, and continuous data foundation for regional and watershed model inputs. 2. Model mechanisms and coupling for source apportionment 1. How can we improve models' performance for extreme events to face climate change?
2. How can we improve simulations under complex watershed conditions?
3. How can we balance models' accuracy with high data/parameter demand?1. Integrate high-frequency sensor data into nonlinear processes to capture nitrogen transport during peak storm runoff.
2. Integrate multitracers and pathway modeling to identify hydrological and biogeochemical processes across mountainous, plain, and karst terrains.
3. Construct hybrid semiempirical modules to simplify parameters while preserving the core mechanismsA robust and easy-to-use framework achieving high precision for extreme events and complex catchments. 3. Construction of smart decision support systems 1. How can we build systems integrating massive datasets with source apportionment models?
2. How can source apportionment guide watershed management, such as source control and wetland restoration?
3. How can we operationalize these platforms for practical watershed management?1. Accelerate development of a platform that integrates source tracking, mechanistic explanation, and decision support.
2. Leverage artificial intelligence for user-friendly interfaces to lower the entry barrier.
3. Incorporate cost–benefit analysis to maximize investment returns.
4. Cultivate collaboration among government, scientists, the public, and farmers for implementation.An operational and economically viable platform enabling rapid source apportionment and watershed management decision support. Table 3.
A short list of priority research questions and actionable steps for advancing future watershed N source apportionment
Figures
(4)
Tables
(3)