-
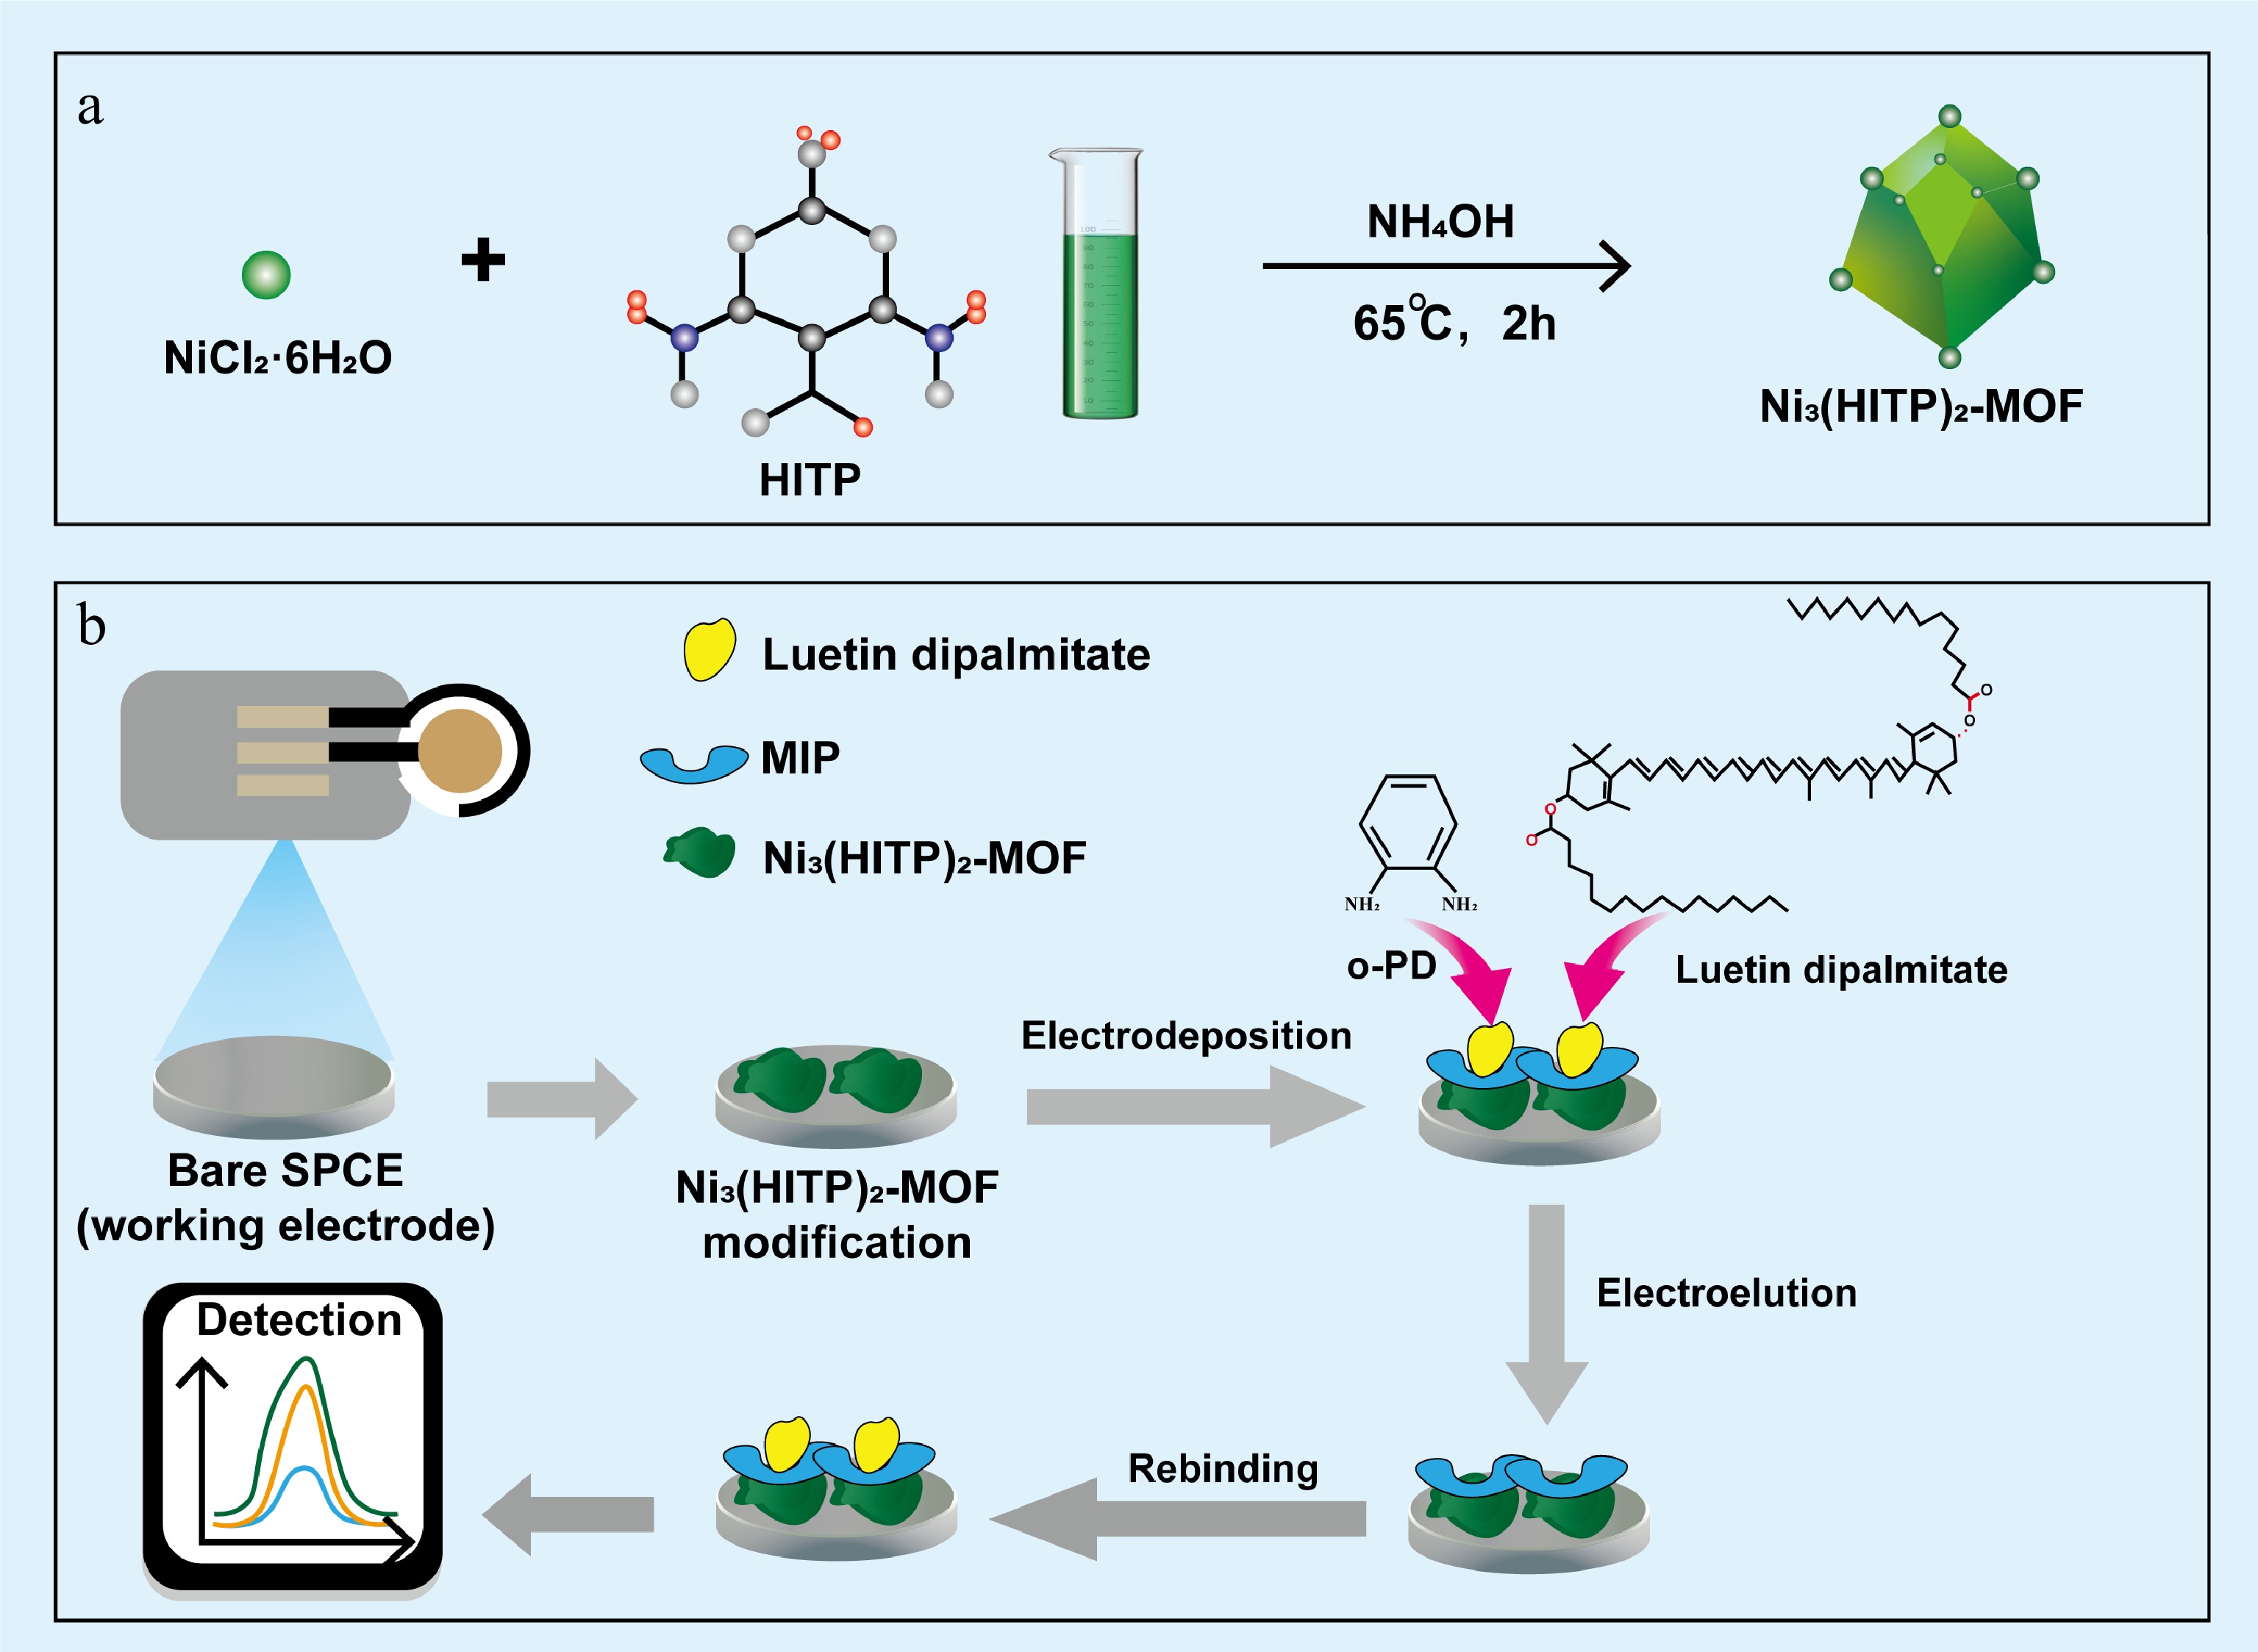
Figure 1.
Fabrication procedure and sensing mechanism of the Ni₃(HITP)₂-MOF-based molecularly imprinted electrochemical sensor for selective lutein dipalmitate detection: (a) preparation procedure of Ni₃(HITP)₂-MOF; (b) fabrication procedure of the molecularly imprinted electrochemical sensor for selective lutein dipalmitate detection.
-
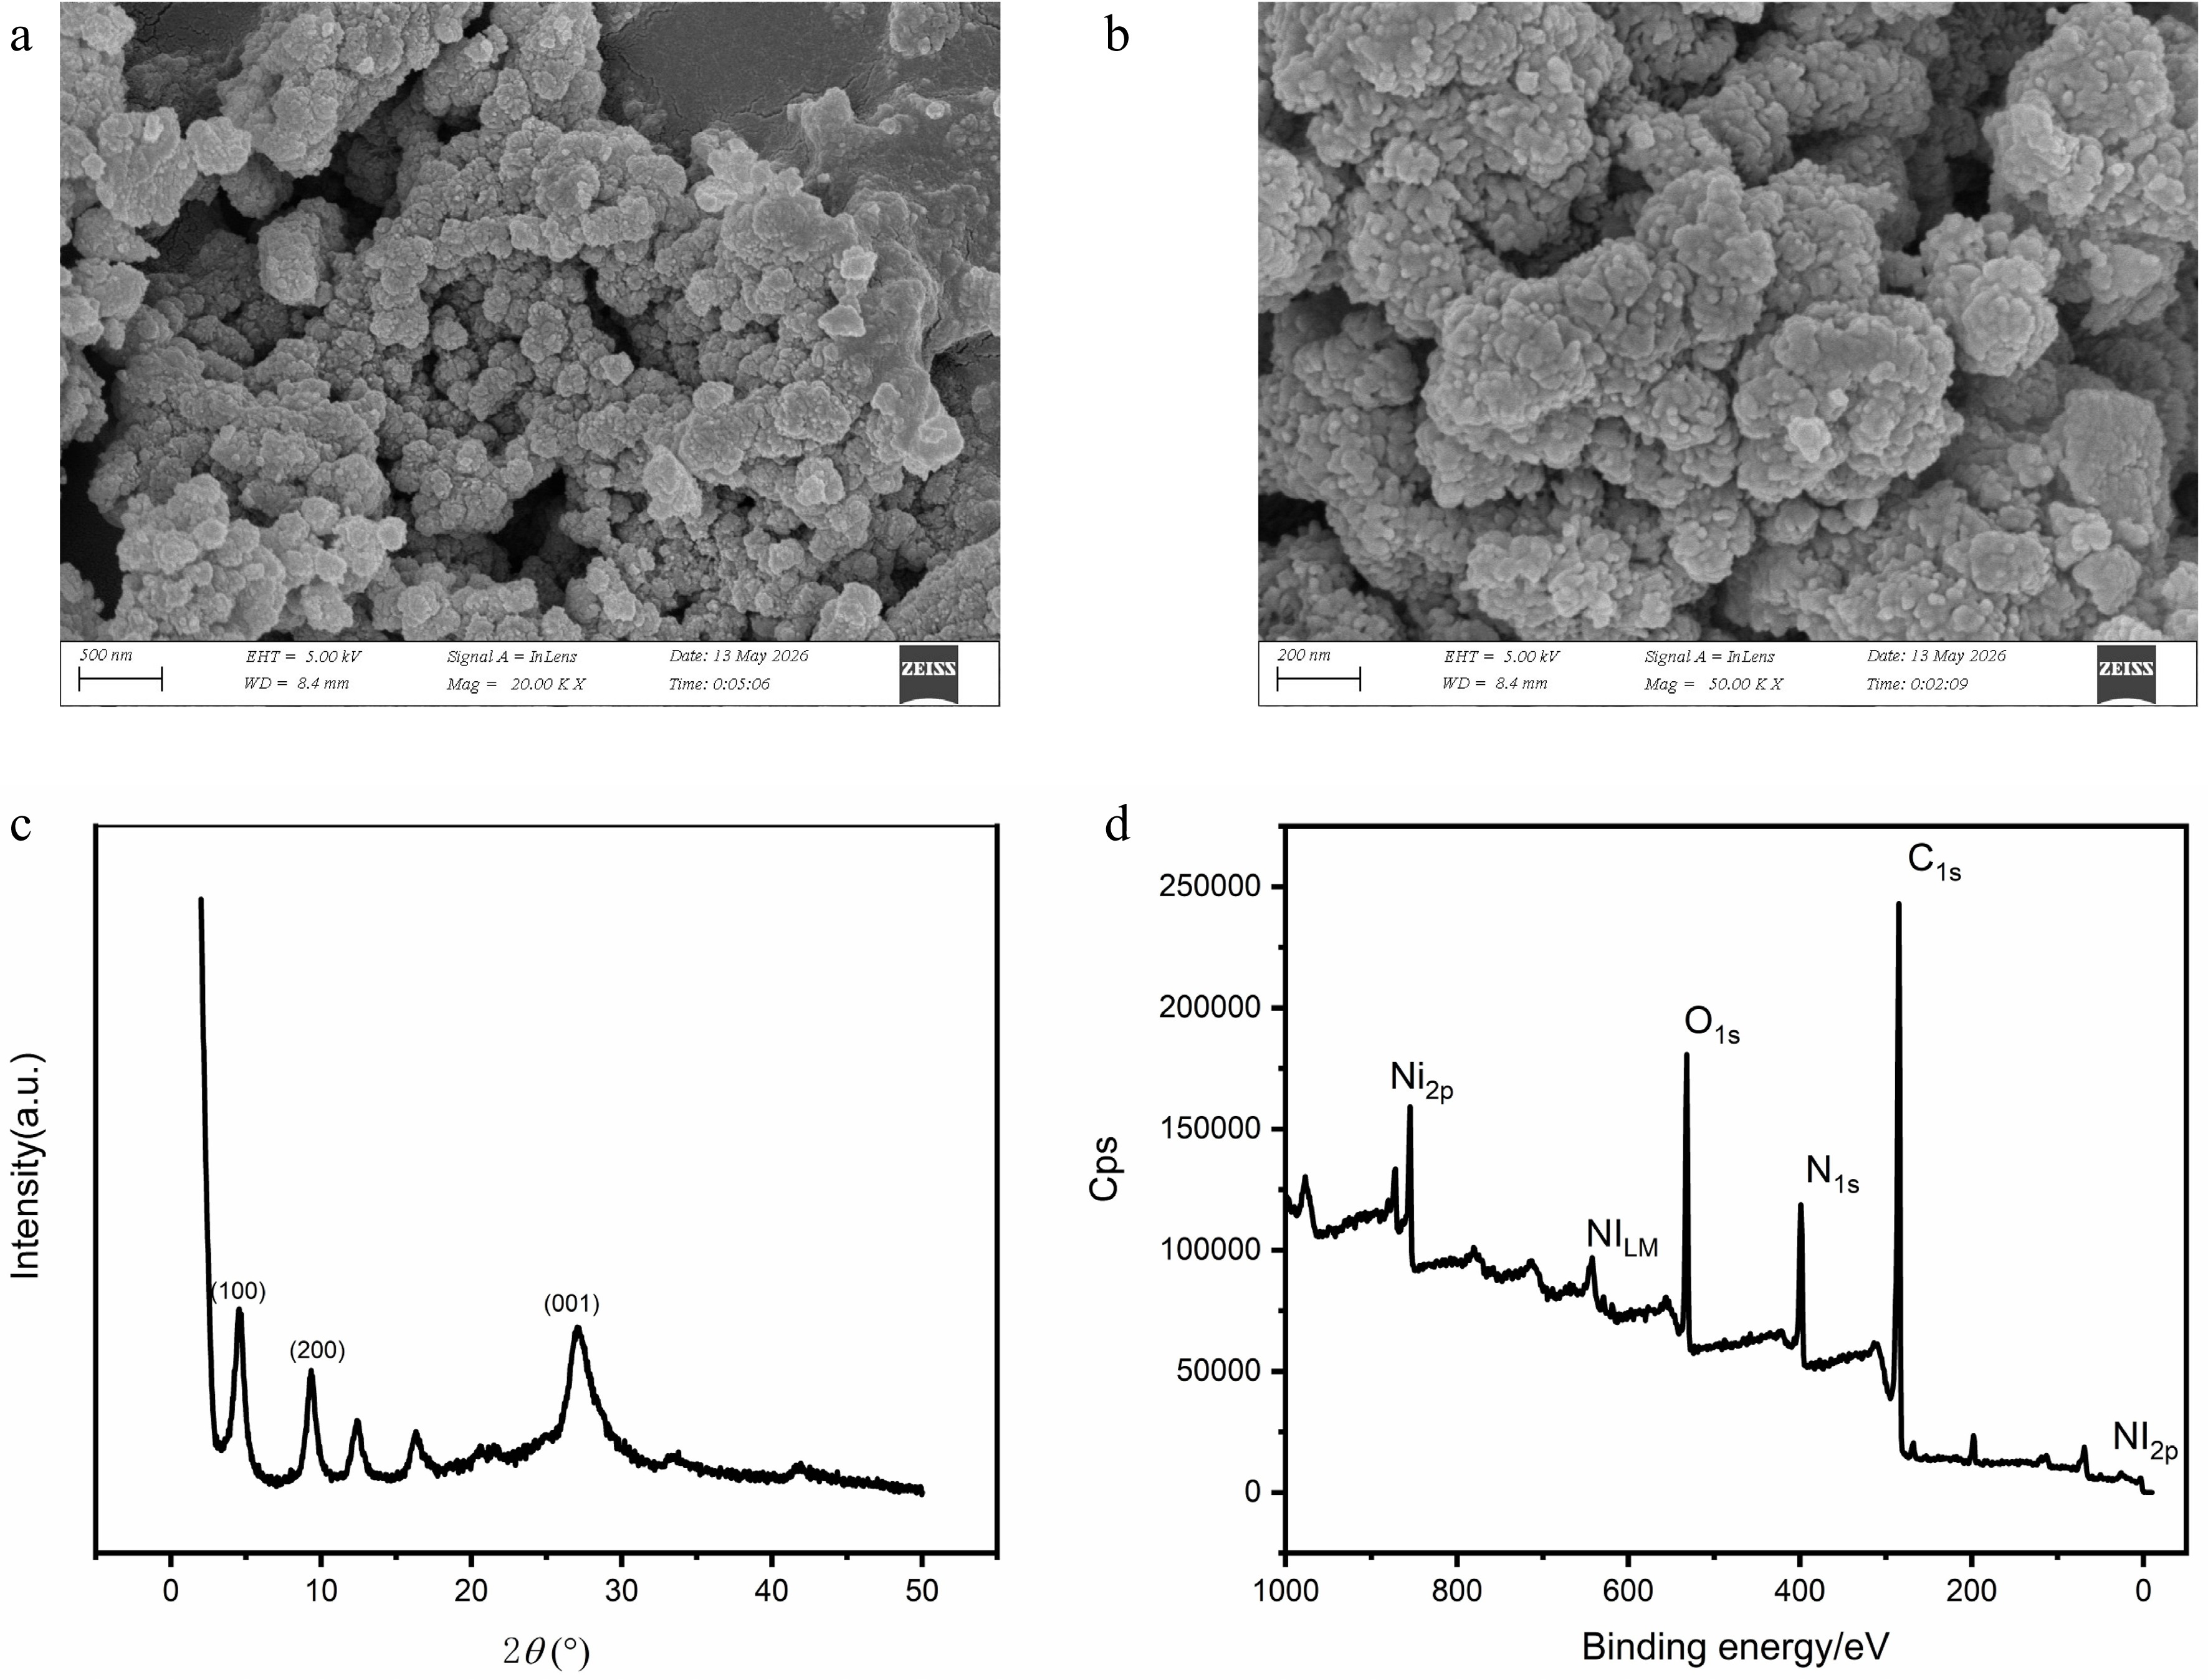
Figure 1.
Characterization of Ni3(HITP)2-MOF. (a) SEM image of Ni3(HITP)2-MOF at a magnification of 20,000×. (b) SEM image of Ni3(HITP)2-MOF at a magnification of 50,000×. (c) XRD pattern of Ni3(HITP)2-MOF. (d) XPS survey spectrum of Ni3(HITP)2-MOF.
-
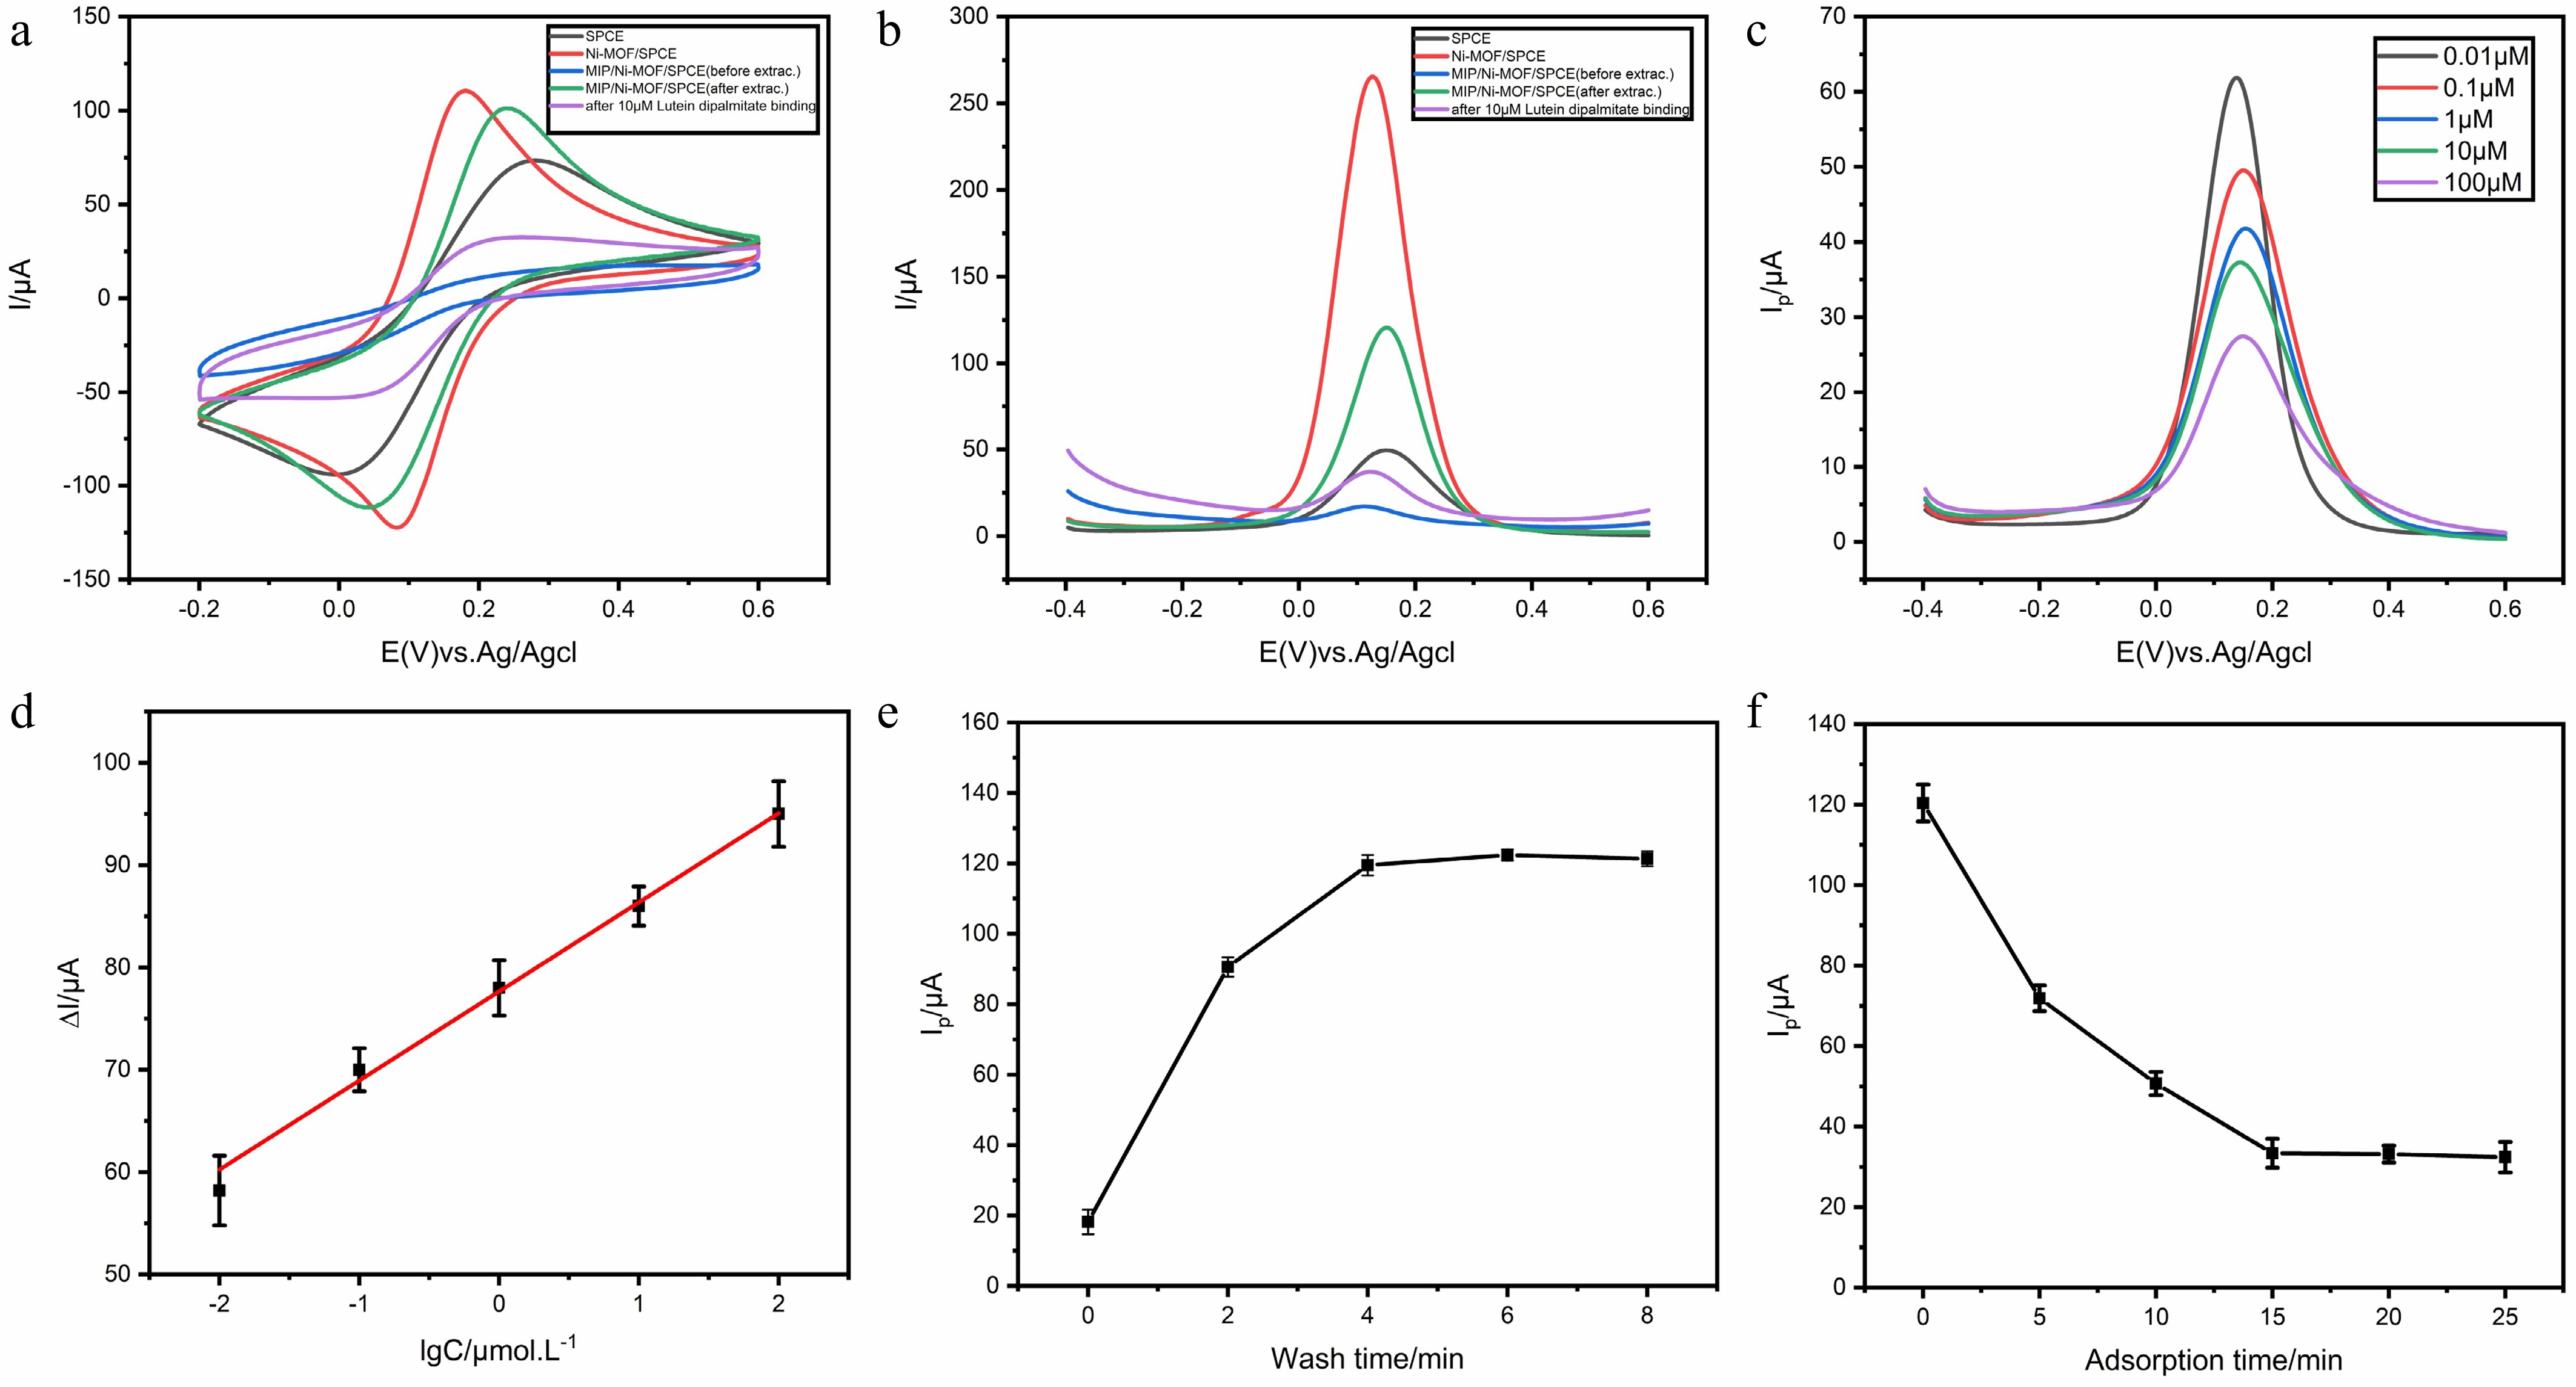
Figure 2.
Fabrication, optimization and analytical performance of the MIP/Ni3(HITP)2-MOF/SPCE sensor. (a) Cyclic voltammetry (CV) responses of SPCE, Ni3(HITP)2-MOF/SPCE, MIP/Ni3(HITP)2-MOF/SPCE before template removal, MIP/Ni3(HITP)2-MOF/SPCE after template removal, and the sensor after rebinding with 10 μM lutein dipalmitate. (b) DPV responses corresponding to different stages of sensor fabrication and target rebinding. (c) DPV responses of the MIP/Ni3(HITP)2-MOF/SPCE sensor toward different concentrations of lutein dipalmitate (0.01–100 μM). (d) Linear relationship between the current change (ΔI) and the logarithm of lutein dipalmitate concentration. (e) Optimization of template removal time. (f) Optimization of adsorption (rebinding) time. The results demonstrate the successful construction of the MIP/Ni3(HITP)2-MOF/SPCE sensor, with enhanced recognition capability toward lutein dipalmitate and favorable analytical performance after optimization.
-
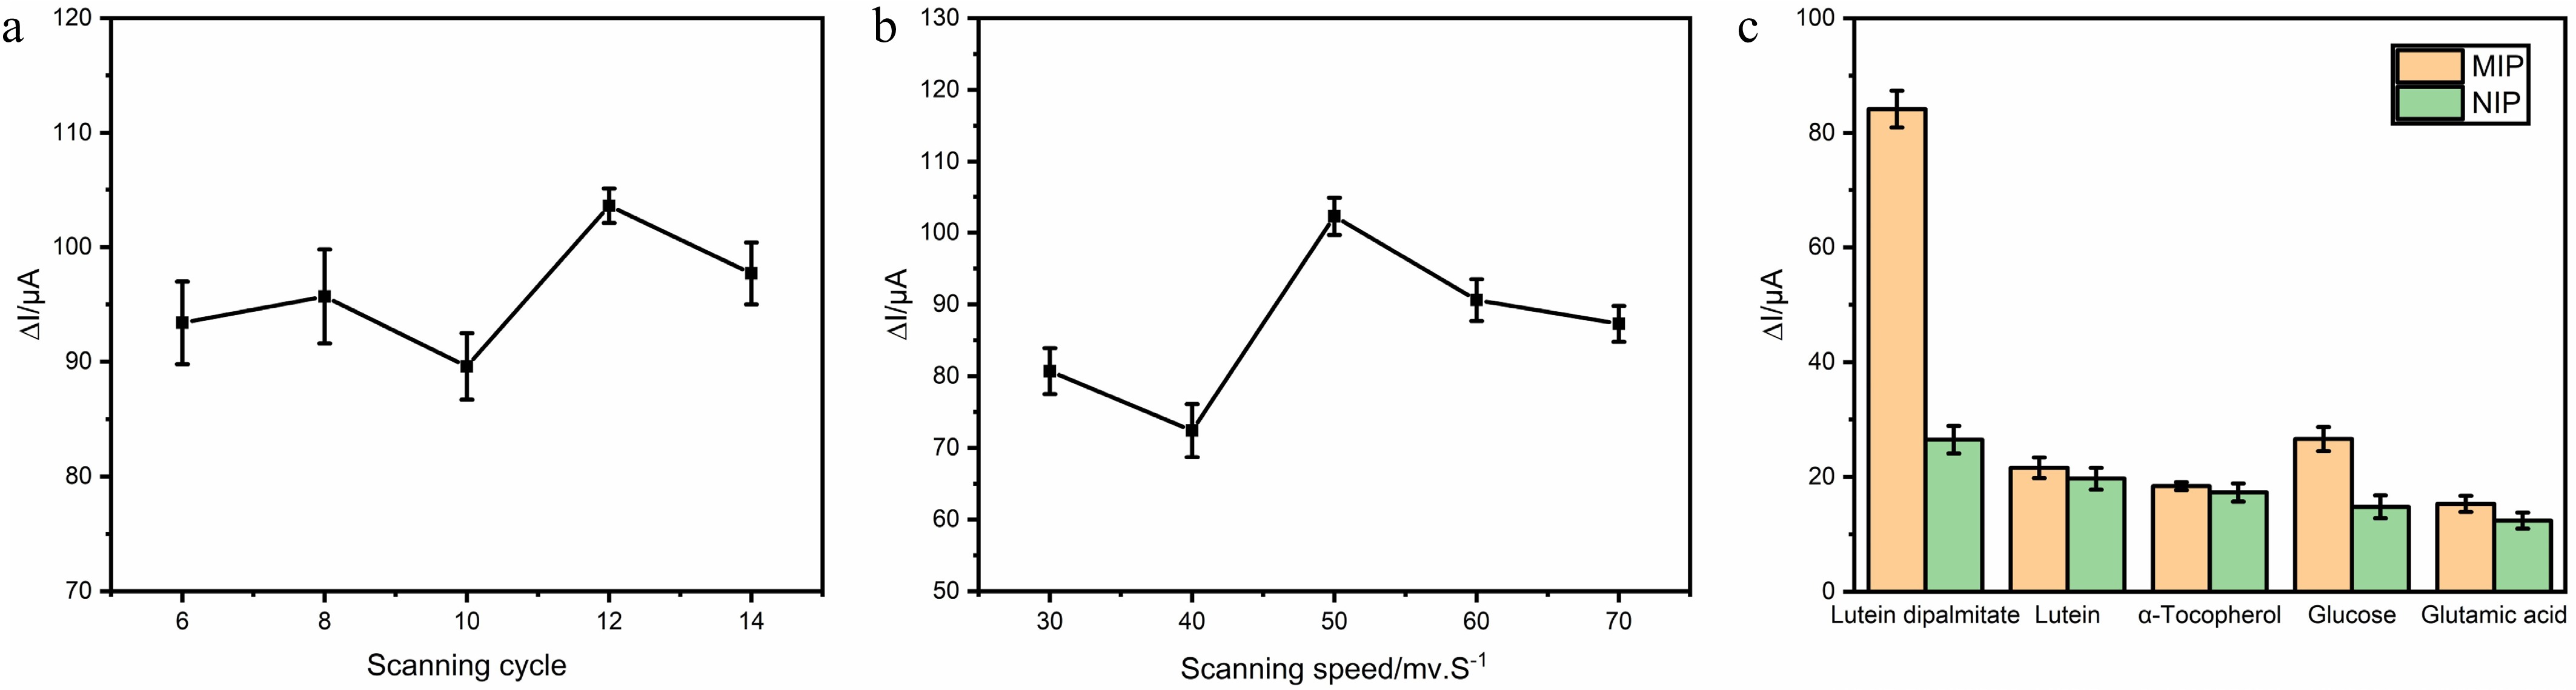
Figure 3.
Optimization and selectivity evaluation of the MIP/Ni3(HITP)2-MOF/SPCE sensor. (a) Optimization of electropolymerization cycles for fabrication of the MIP/Ni3(HITP)2-MOF/SPCE sensor. (b) Optimization of scan rate during electropolymerization of the MIP/Ni3(HITP)2-MOF/SPCE sensor. (c) Selectivity evaluation of the MIP/Ni3(HITP)2-MOF/SPCE sensor. Current responses of MIP and NIP sensors toward lutein dipalmitate and potential interfering compounds, including lutein, α-tocopherol, glucose, and glutamic acid, at the same concentration. The MIP sensor exhibited a significantly higher response toward lutein dipalmitate than toward the interfering substances, demonstrating the successful formation of specific molecular recognition sites. Error bars represent the standard deviation of three independent measurements (n = 3).
-
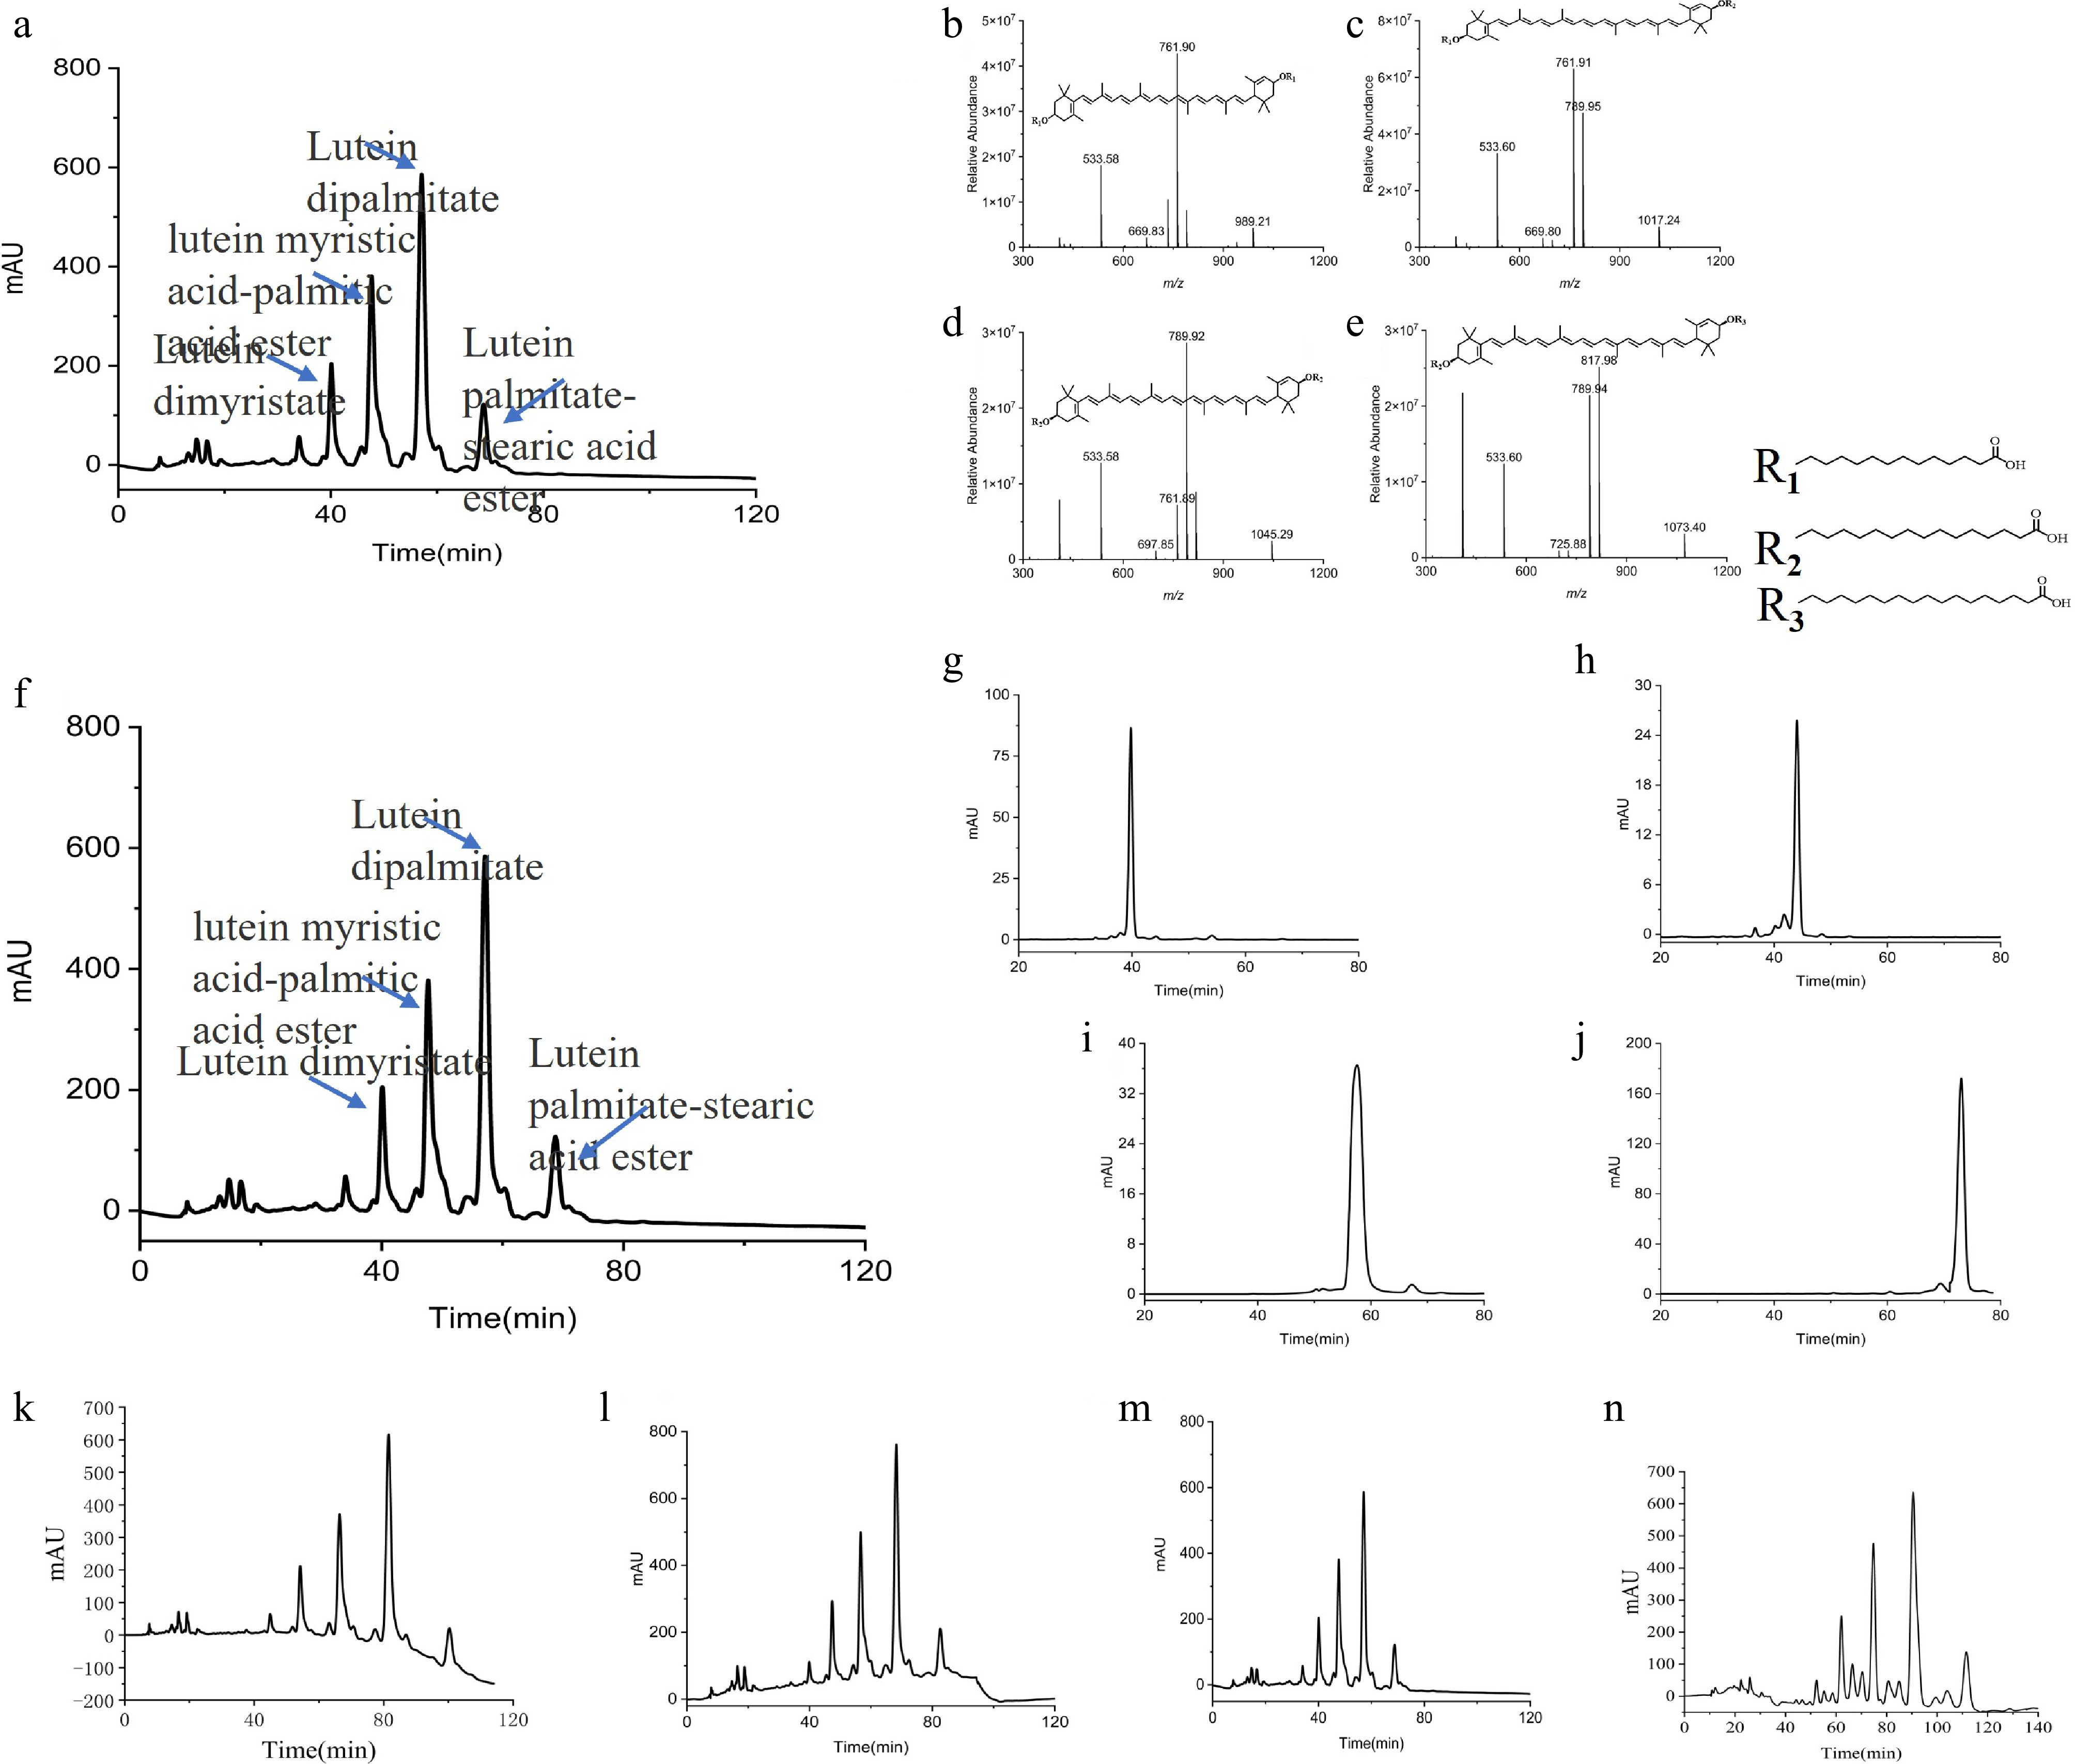
Figure 4.
HPLC and HPLC-MS characterization of lutein esters and evaluation of chromatographic conditions. (a) HPLC chromatogram of marigold extract. (b) HPLC-MS ion fragment spectrum of lutein dimyristate. (c) HPLC-MS ion fragment spectrum of lutein myristic acid–palmitic acid ester. (d) HPLC-MS ion fragment spectrum of lutein dipalmitate. (e) HPLC-MS ion fragment spectrum of lutein palmitate–stearic acid ester. (f) HPLC chromatogram of marigold extract. (g) HPLC chromatogram of lutein dimyristate. (h) HPLC chromatogram of lutein myristic acid–palmitic acid ester. (i) HPLC chromatogram of lutein dipalmitate. (j) HPLC chromatogram of lutein palmitate–stearic acid ester. (k)–(m) HPLC chromatograms obtained using different mobile phases: (k) mobile phase A, (l) mobile phase B, and (m) mobile phase C. (n) Detection chromatogram obtained using the C30 chromatographic column.
-
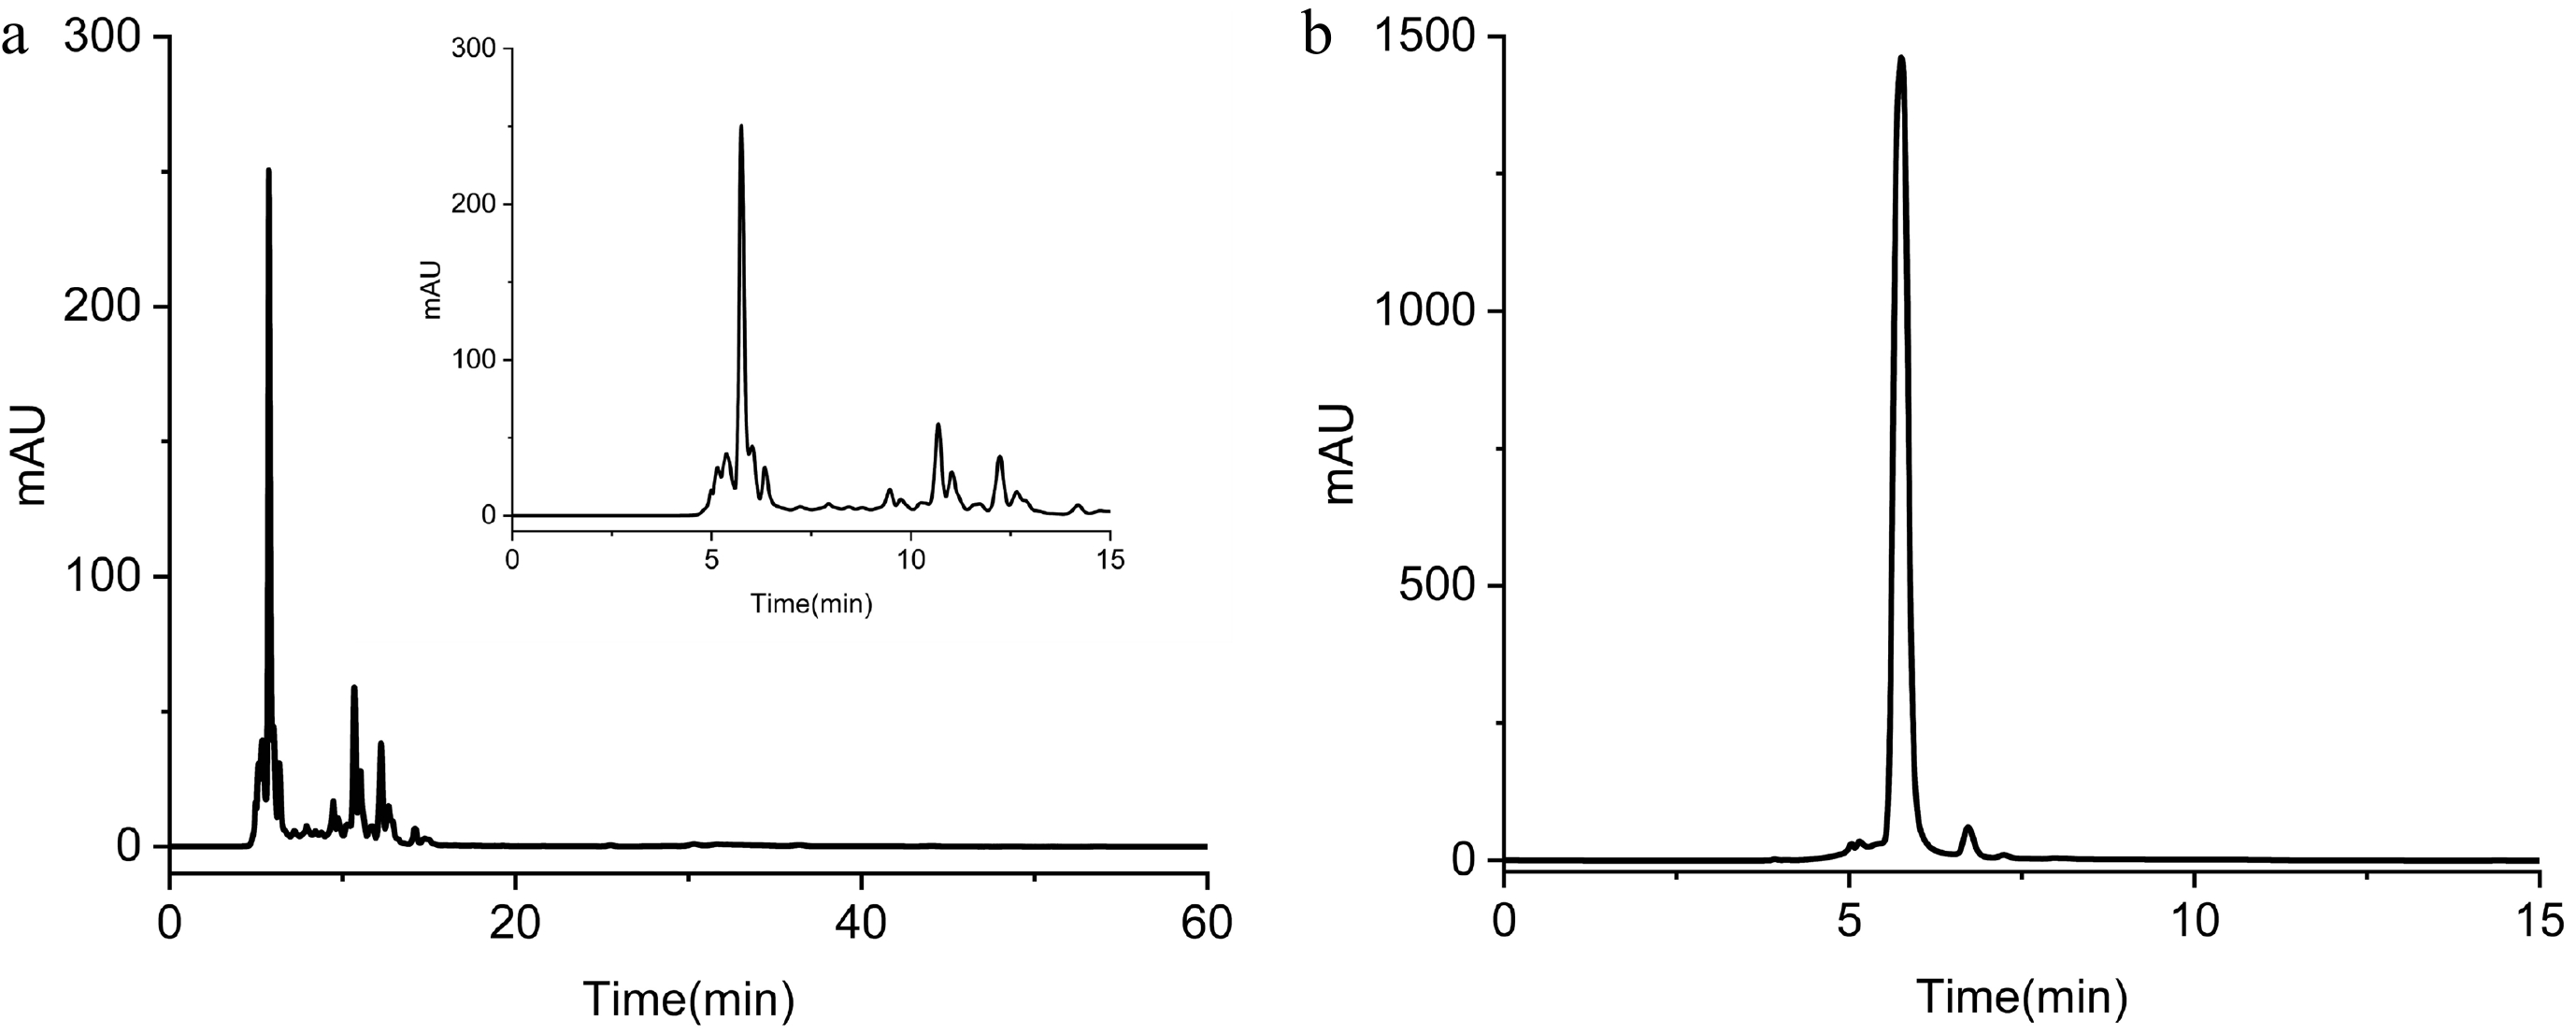
Figure 5.
HPLC chromatograms of free lutein detection. (a) Saponification sample; the inset shows an enlarged view of the chromatogram from 0 to 15 min. (b) Lutein reference standard.
-
Number Quantitative method Merits/demerits Ref. 1 Lutein equivalent calculation of lutein ester Other substances with the same absorption value are covered, and the calculated value is high [35] 2 Lutein standard curve calculation of lutein ester The molecular weight difference is significant, and the detection is interfered by other substances, which is easy to cause large error in the calculated value [36] 3 Lutein equivalent calculation of lutein ester Other substances with the same absorption value are covered, and the calculated value is high [37] 4 Saponified lutein ester, calculate lutein content Saponification causes large loss of lutein [38] 5 Only one major lutein ester content was calculated Detection of material is too little; the error is too large [39] 6 Saponified lutein ester, calculate lutein content Saponification causes large loss of lutein [40] 7 Only carotenoid esters were quantified; no specific lutein esters were quantified, and lutein content was quantified The detection substance is not clear, and the calculation content error is large [41] 8 MIP/Ni3(HITP)2-MOF electrochemical sensing-conversion factor T strategy Direct detection of lutein esters, simultaneous and accurate quantification of a variety of major lutein esters, simplified operation, high detection efficiency This work Table 1.
Comparison of existing methods and new methods for quantitative detection of lutein esters.
Figures
(6)
Tables
(1)