-
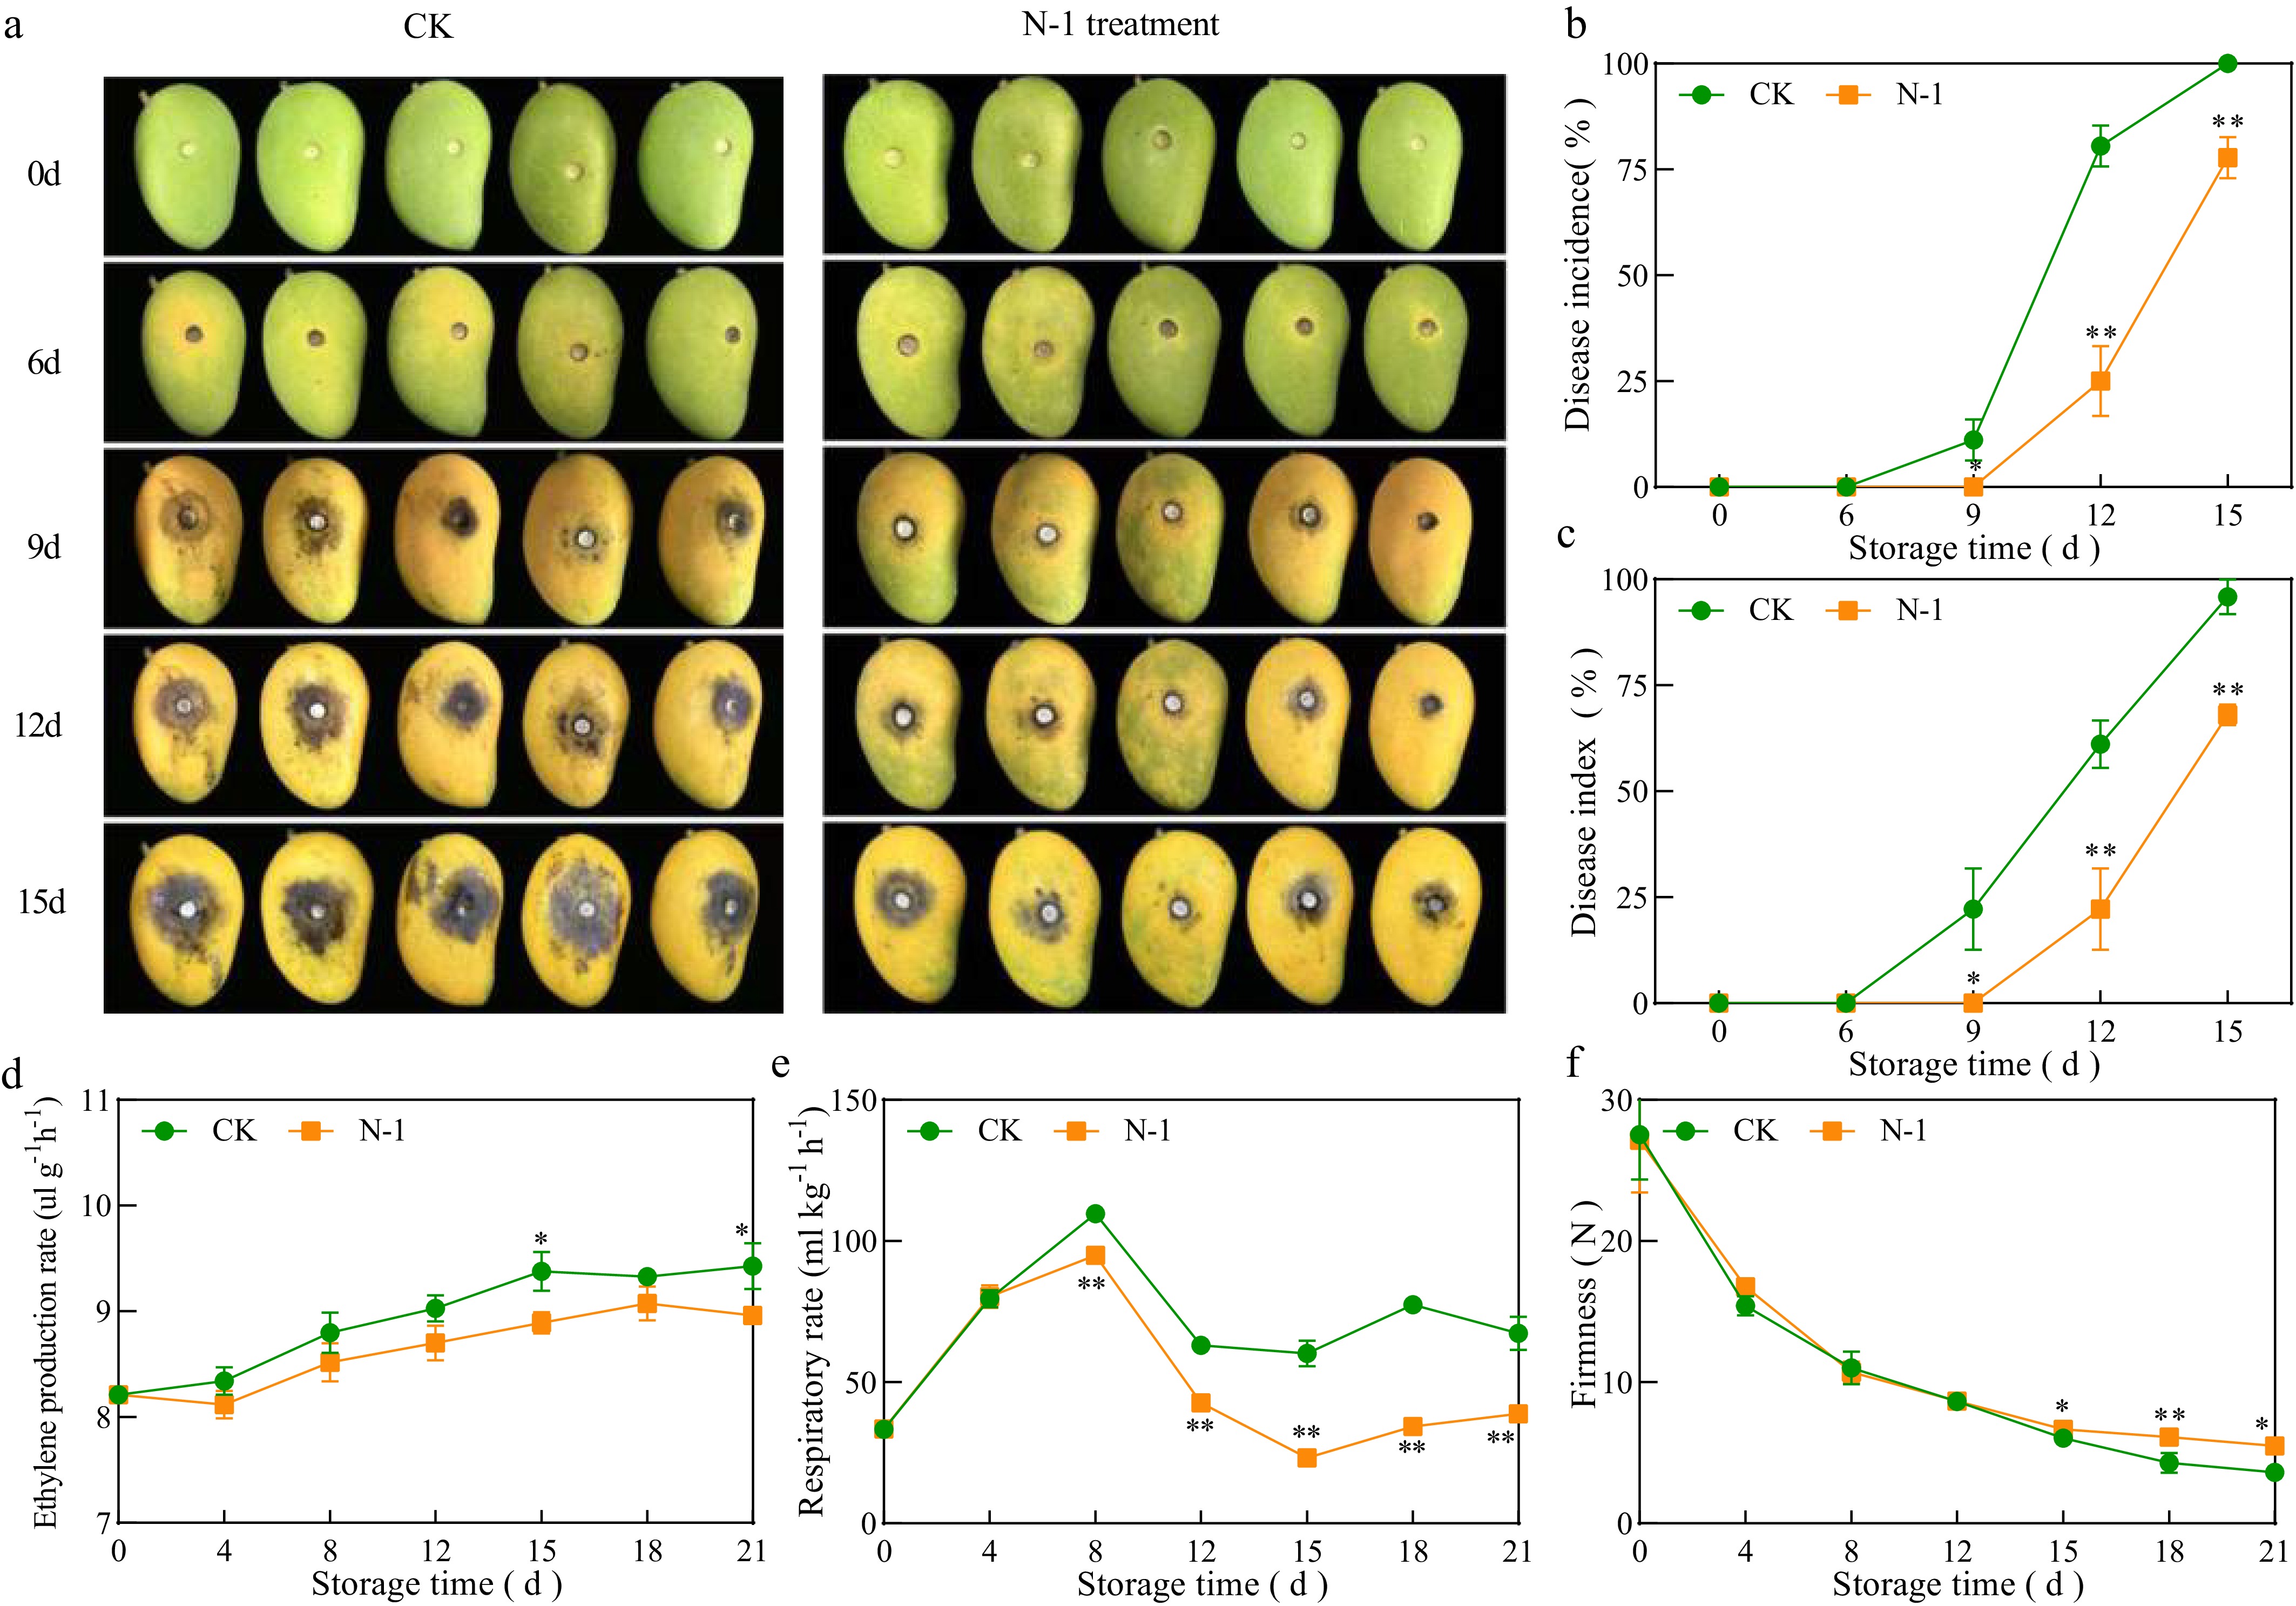
Figure 1.
Changes in (a) fruit appearance, (b) disease incidence, (c) disease index, (d) respiratory rate, (e) ethylene production rate, and (f) firmness of mango fruit after inoculation at 25 °C. Vertical bars represent the standard error of the mean, and the asterisks indicate a significant difference between two groups at the corresponding sampling point (* p < 0.05, ** p < 0.01).
-
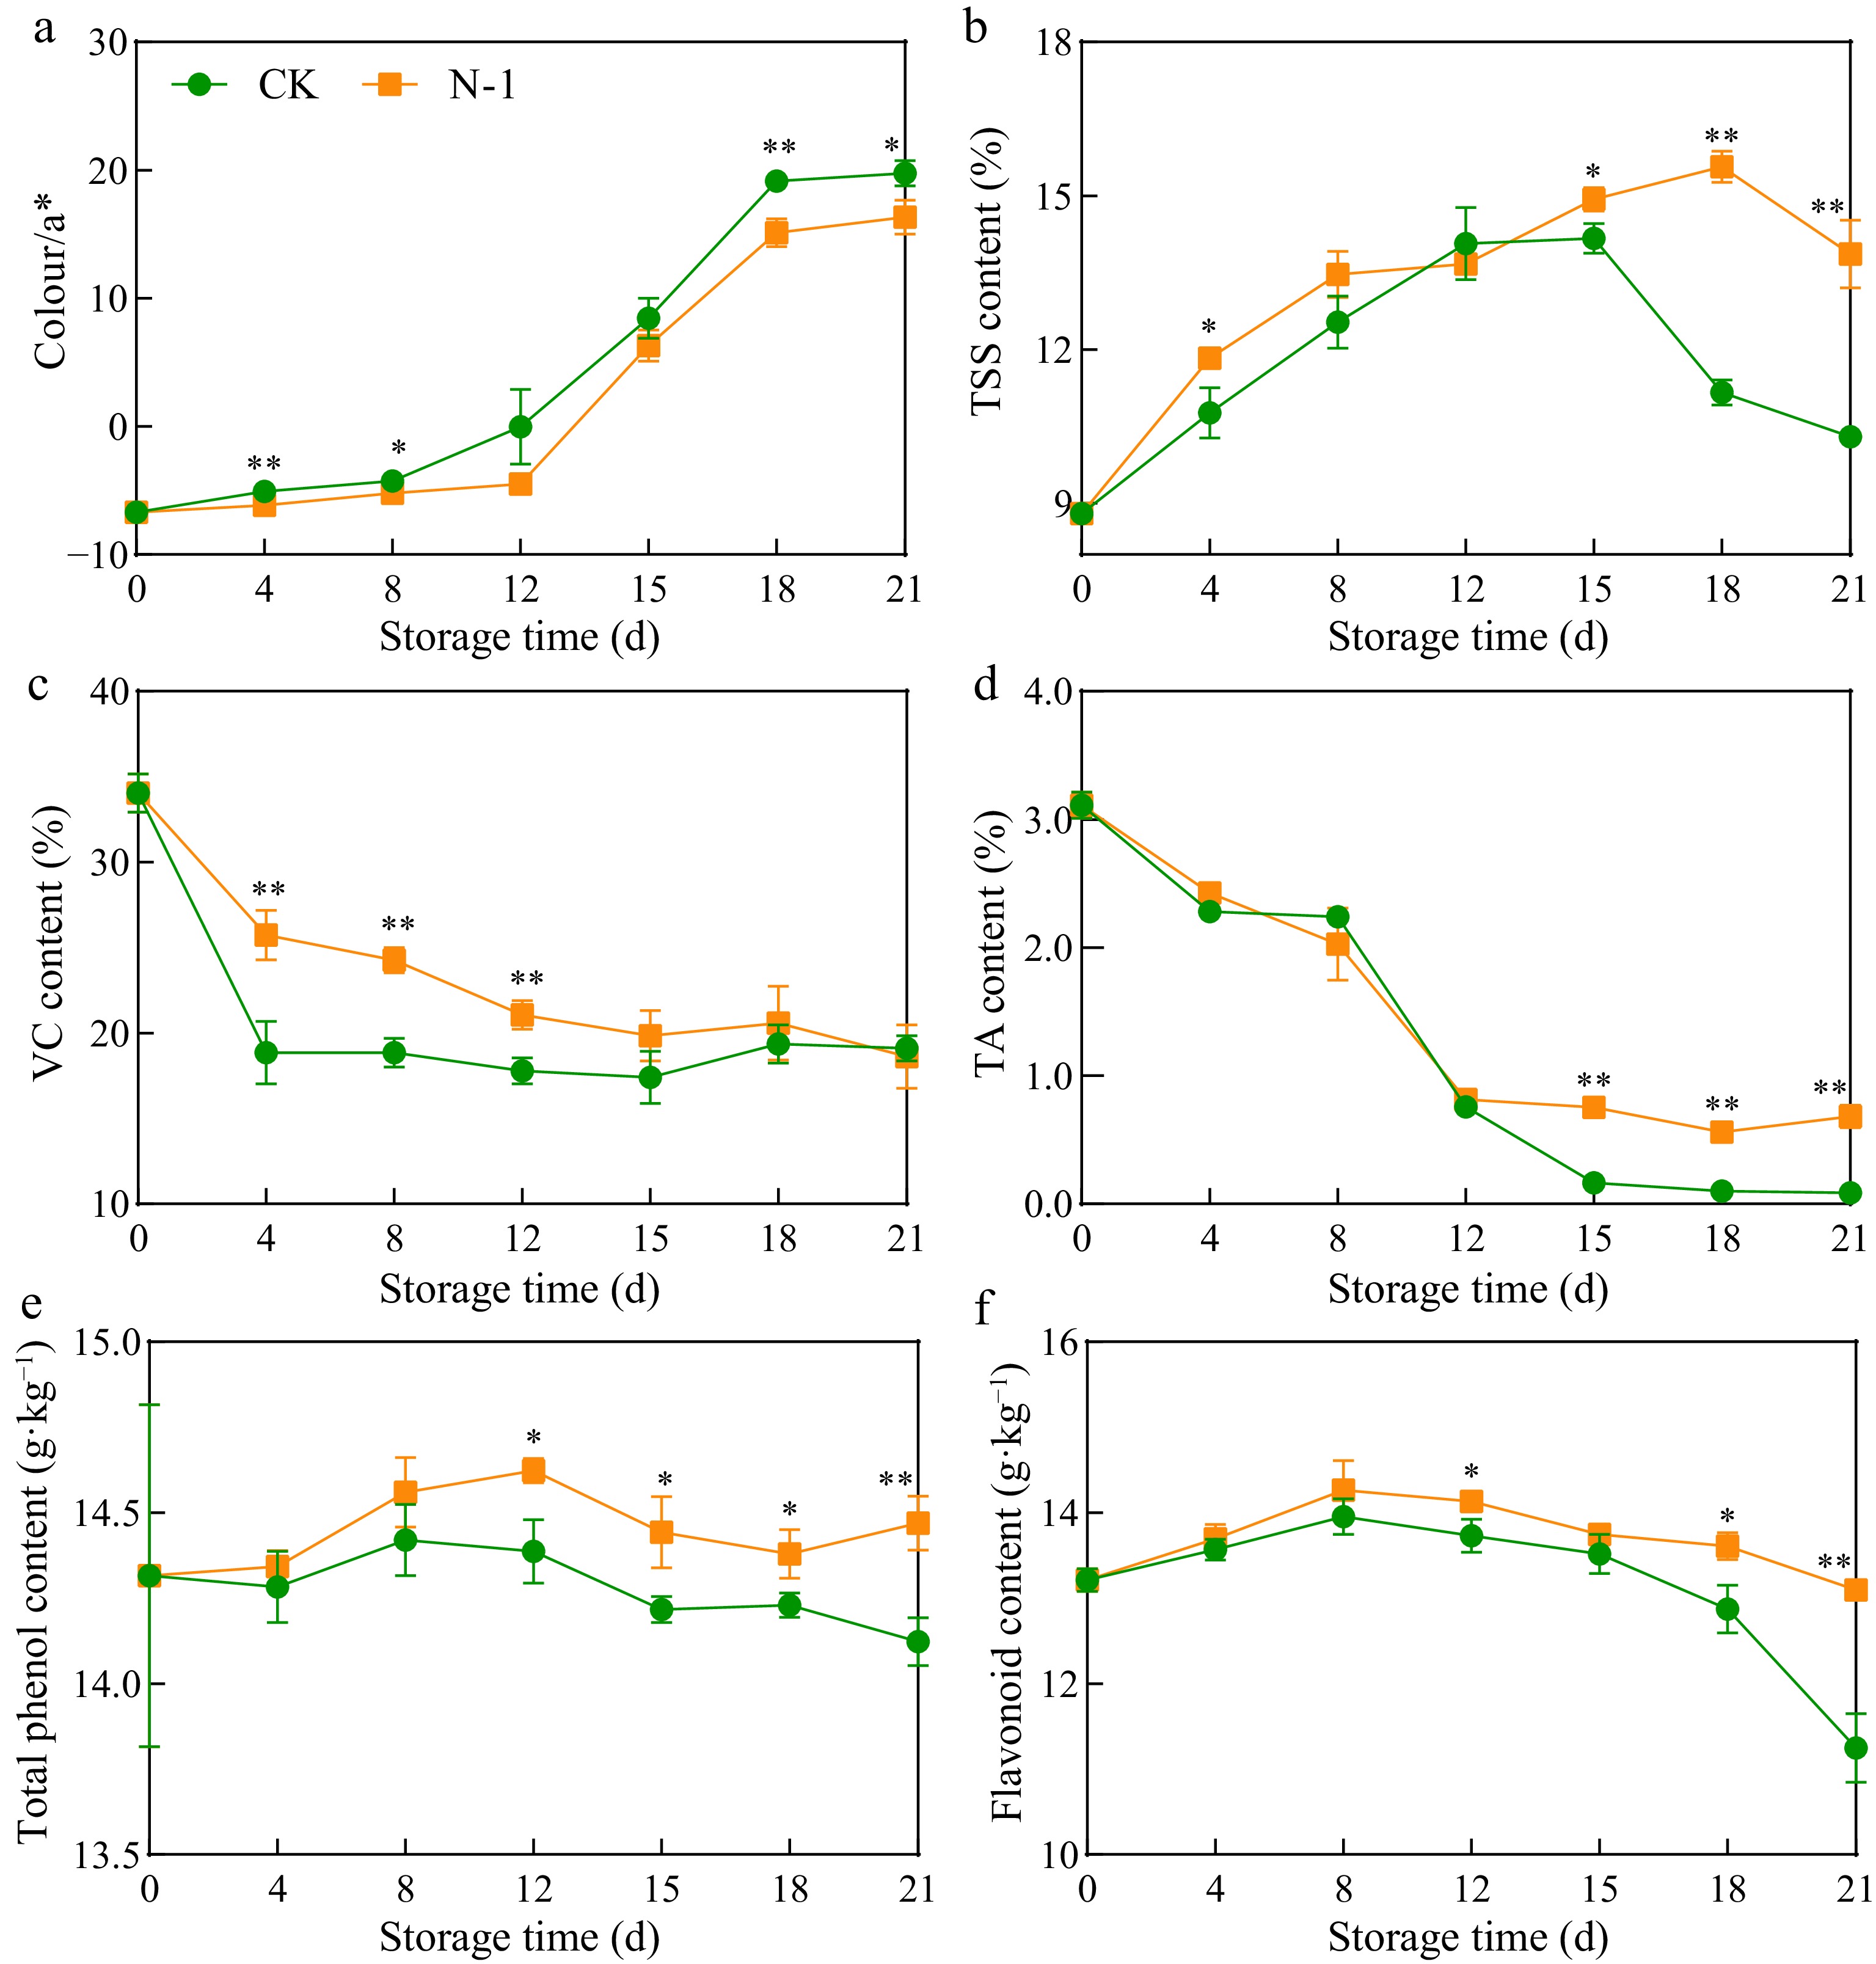
Figure 2.
Changes in (a) color, (b) TSS content, (c) AsA content, (d) TA content, (e) total phenol, and (f) flavonoid contents of mango fruit during storage at 25 °C. Vertical bars represent the standard error of the mean, and the asterisks indicate a significant difference between the two groups at the corresponding sampling point (* p < 0.05, ** p < 0.01).
-
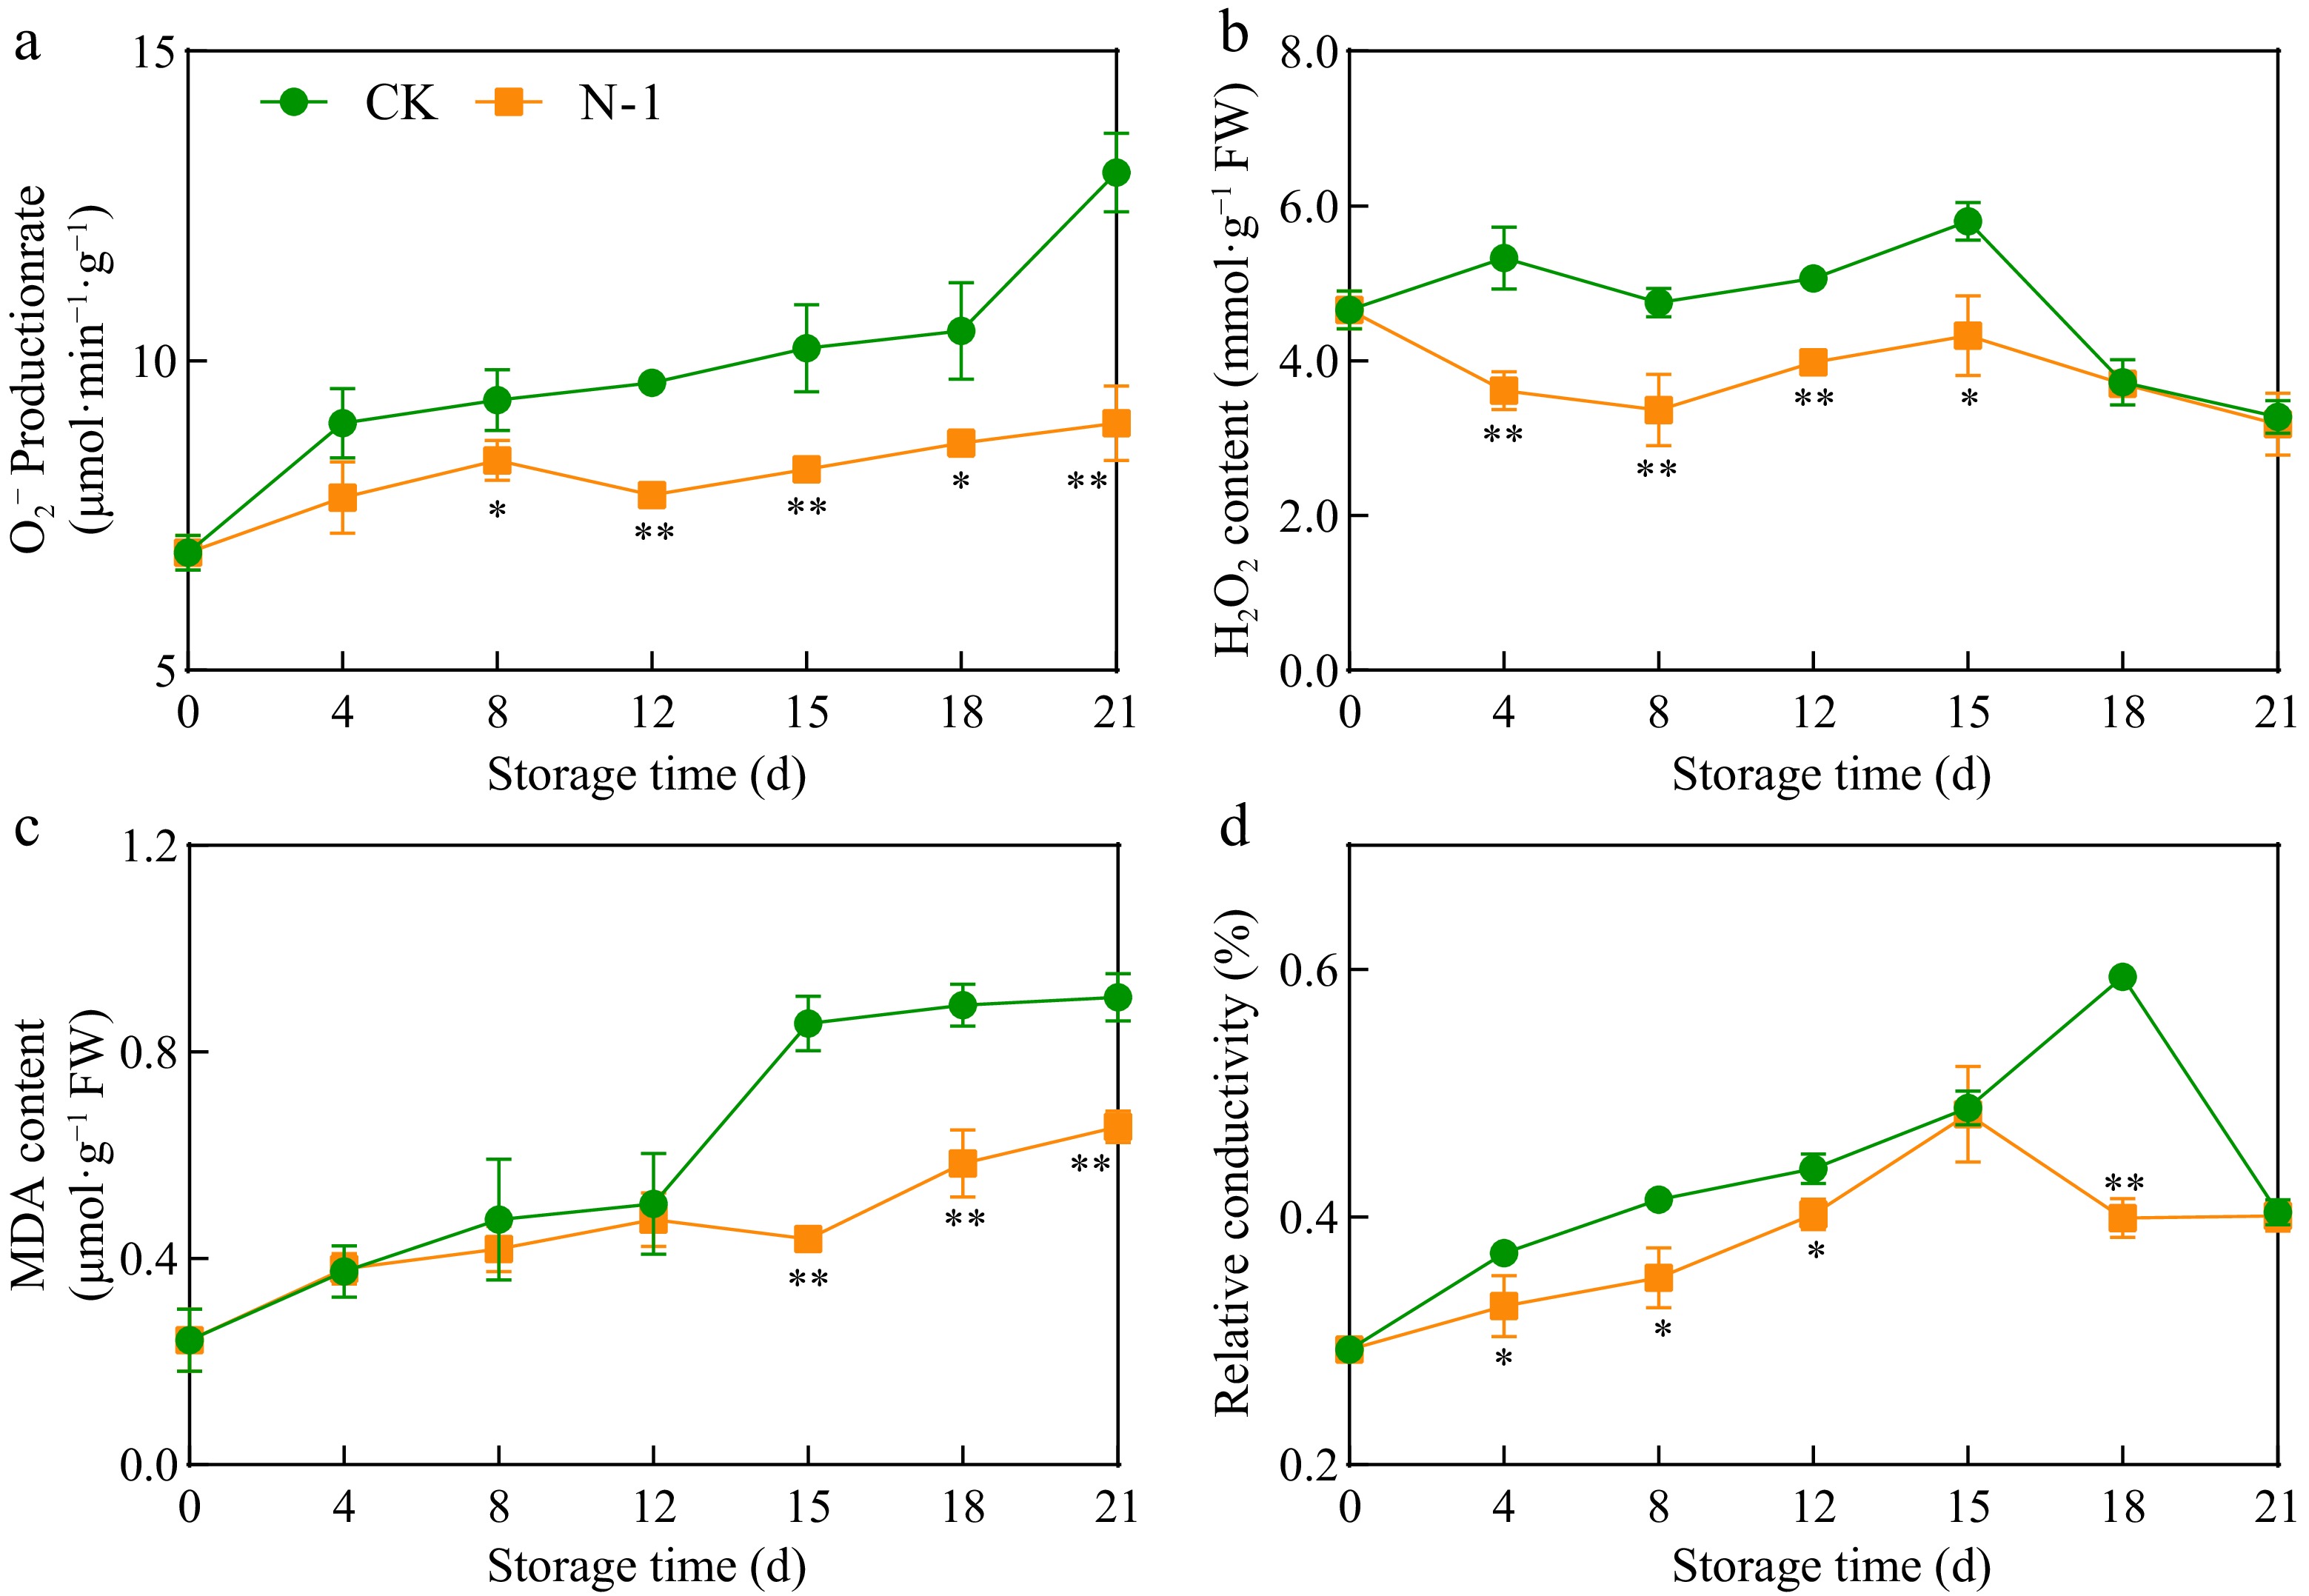
Figure 3.
Changes in (a) O2− production rate, (b) H2O2 content, (c) MDA content, and (d) relative conductivity in mango fruit during storage at 25 °C. Vertical bars represent the standard error of the mean, and the asterisks indicate a significant difference between two groups at the corresponding sampling point (* p < 0.05, ** p < 0.01).
-
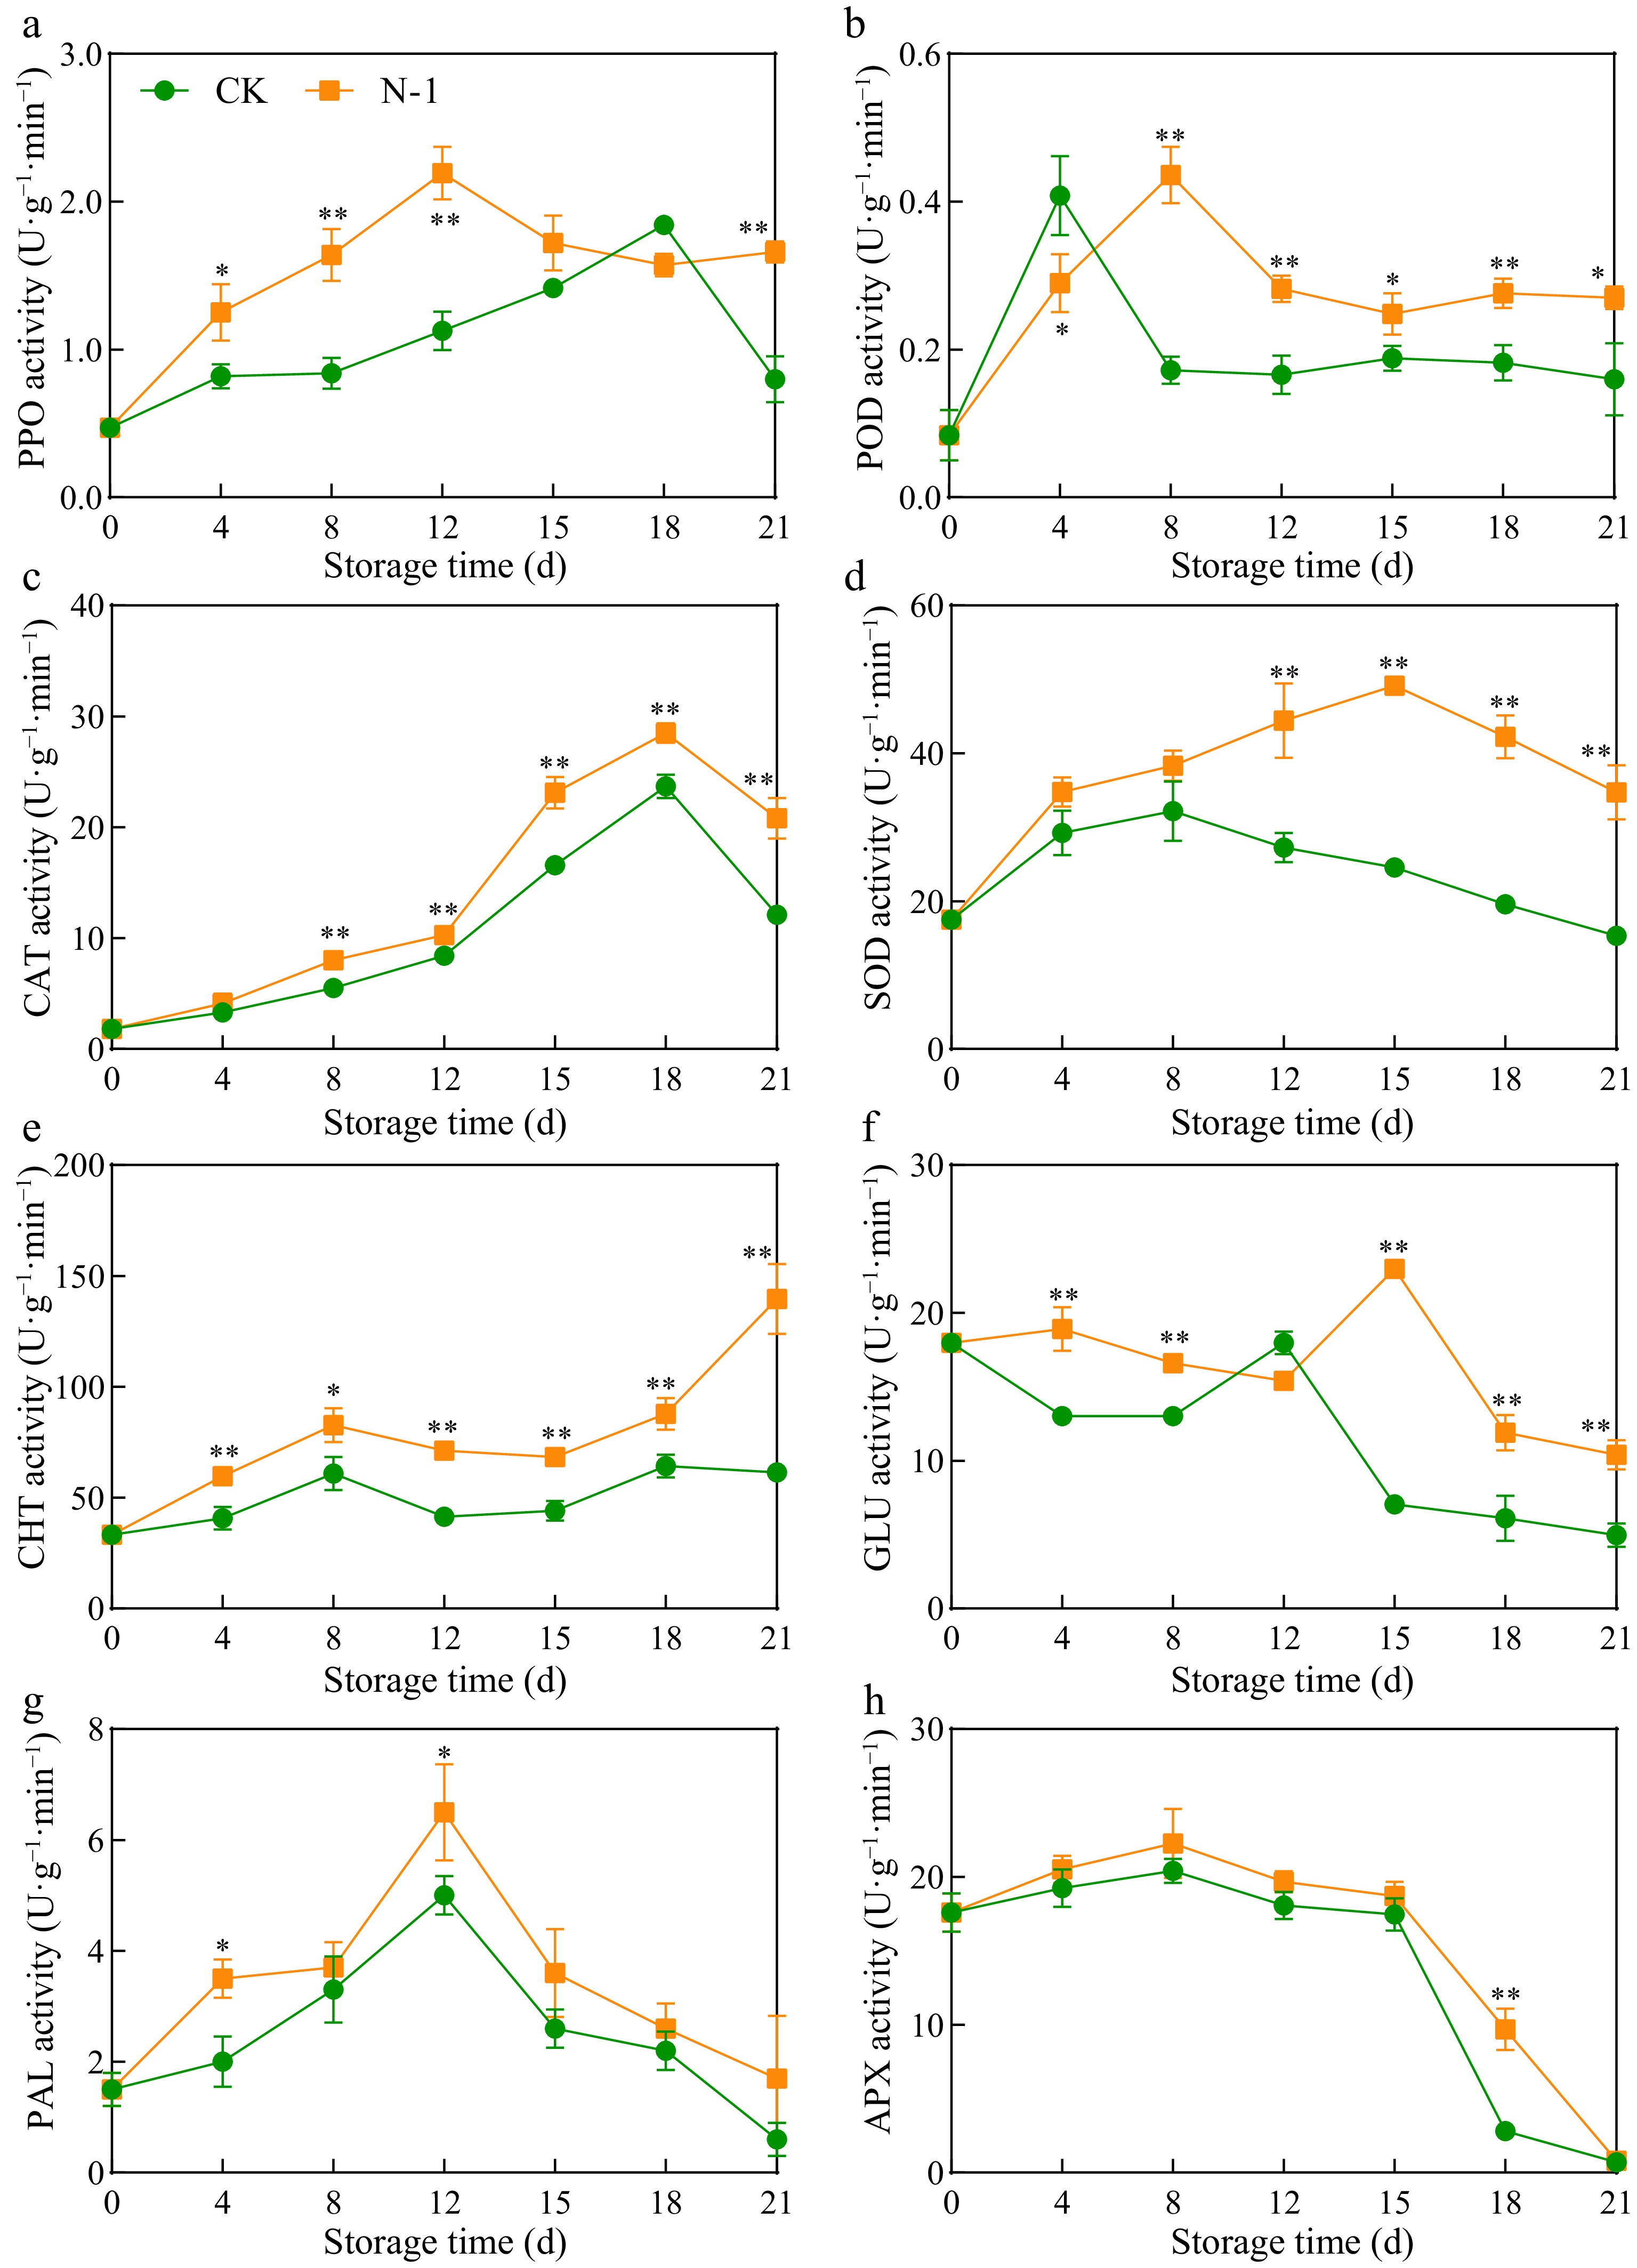
Figure 4.
Activities of (a) PPO, (b) POD, (c) CAT, (d) SOD, (e) CHT, (f) GLU, (g) PAL, and (h) APX in mango fruit during storage at 25 °C. Vertical bars represent the standard error of the mean, and the asterisks indicate a significant difference between two groups at the corresponding sampling point (* p < 0.05, ** p < 0.01).
-
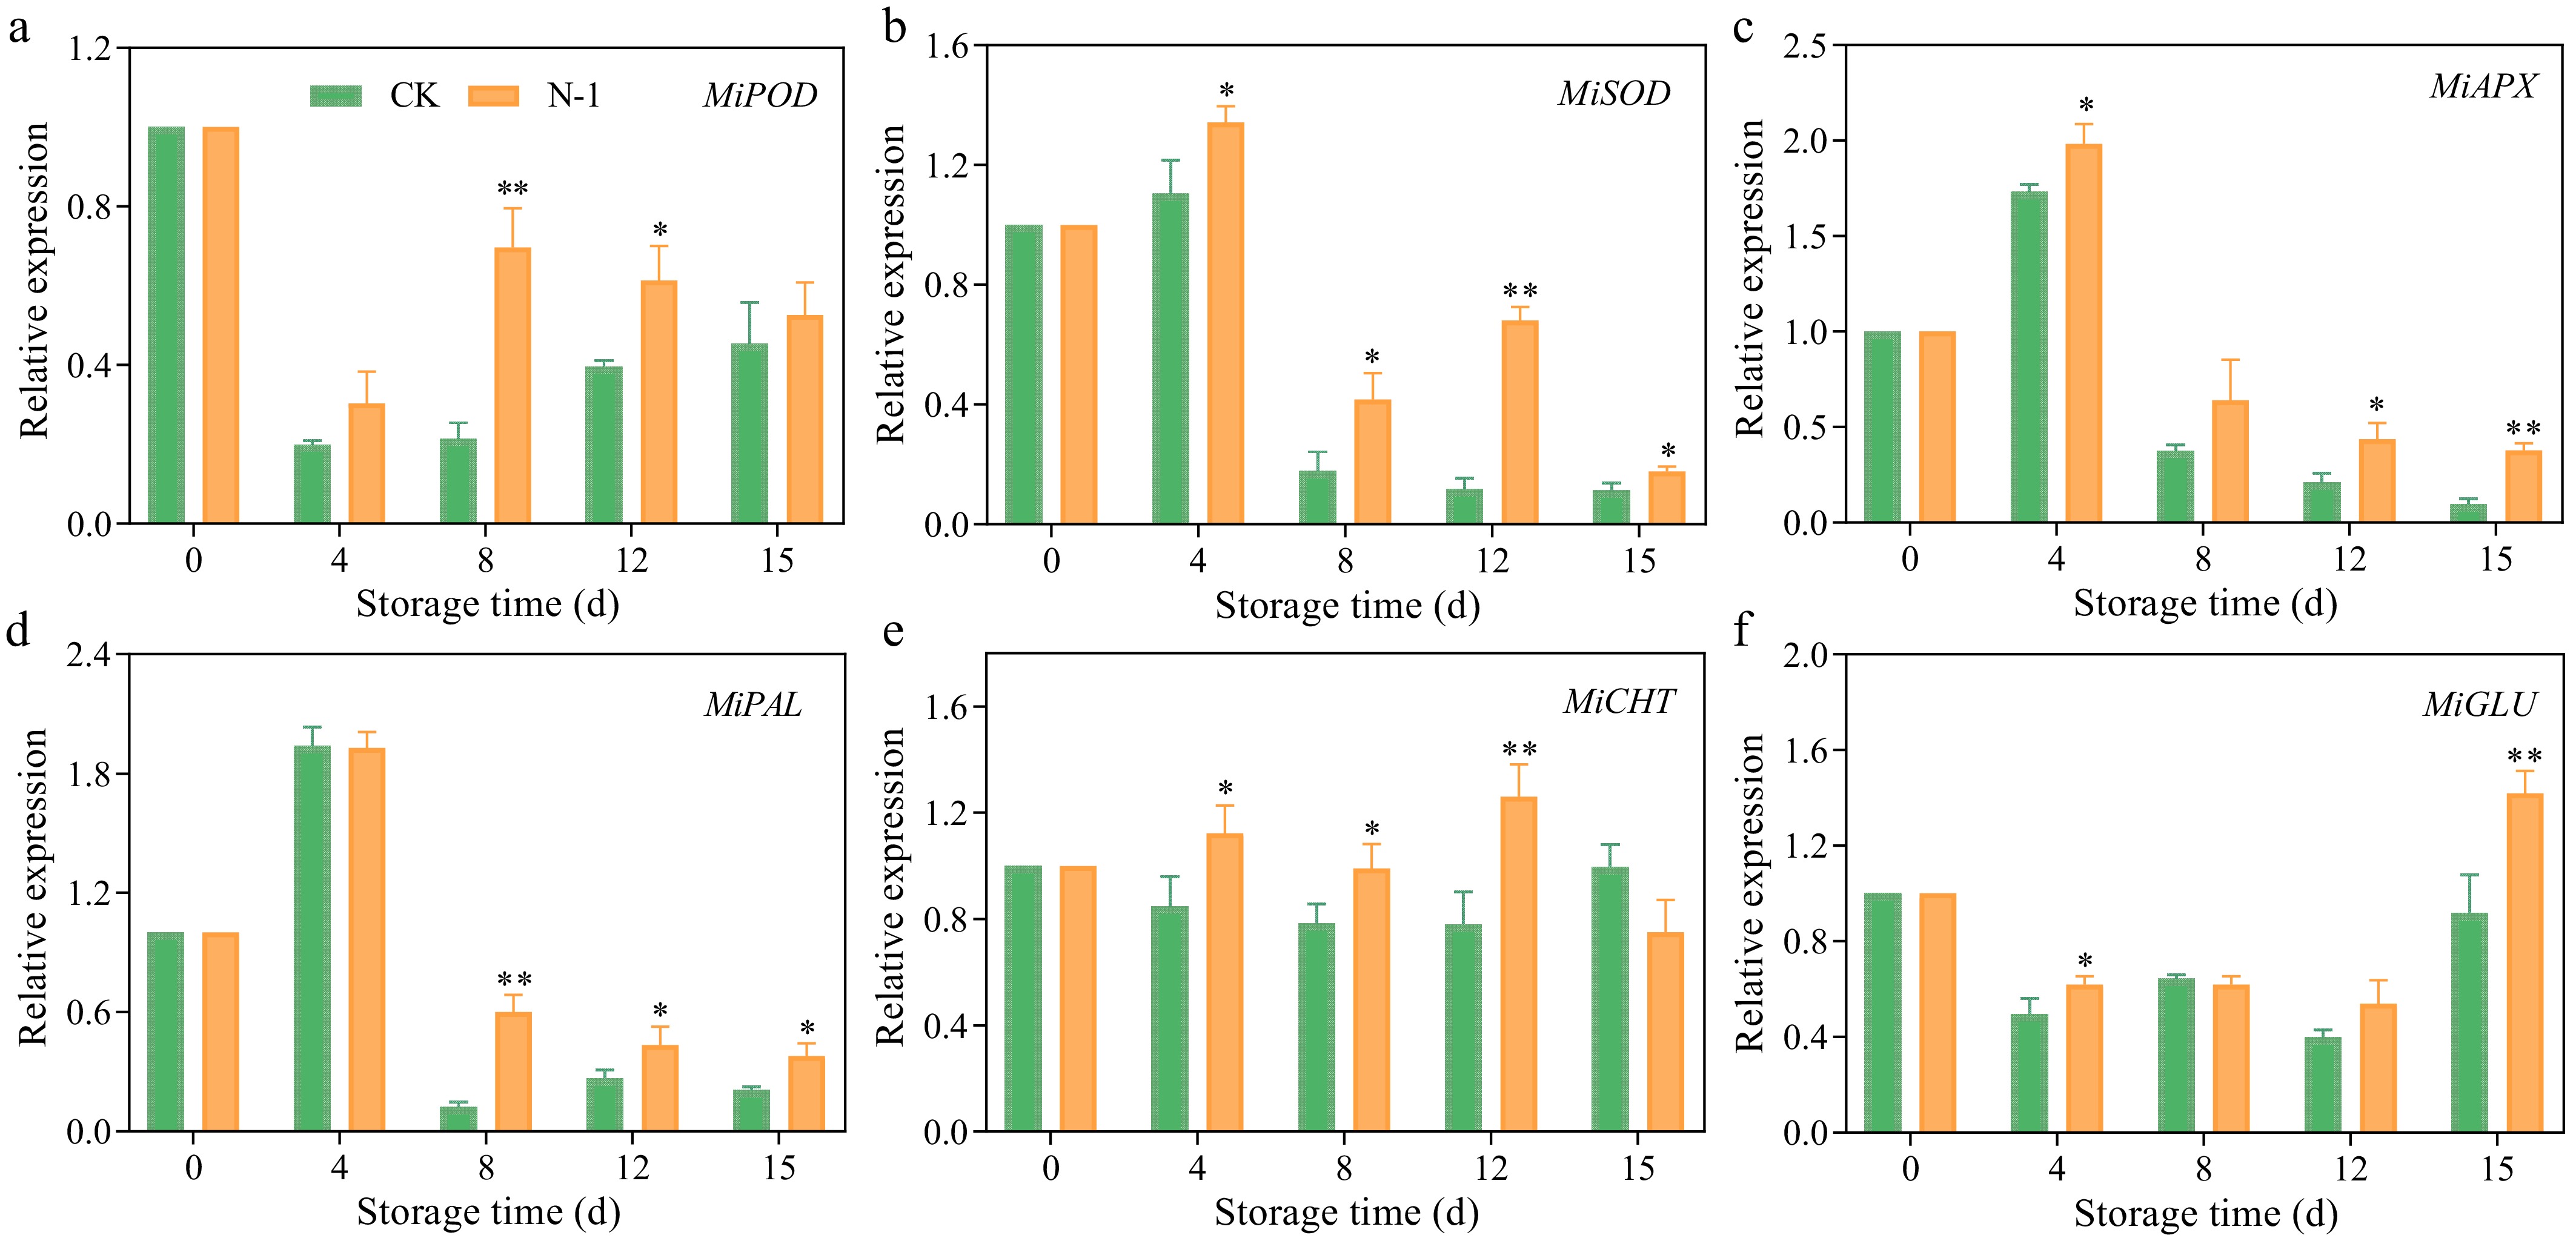
Figure 5.
Relative expressions of (a) MiPOD, (b) MiSOD, (c) MiAPX, (d) MiPAL, (e) MiCHT, (f) MiGLU in mango fruit during storage at 25 °C. Vertical bars represent the standard error of the mean, and the asterisks indicate a significant difference between the two groups at the corresponding sampling point (* p < 0.05, ** p < 0.01).
-
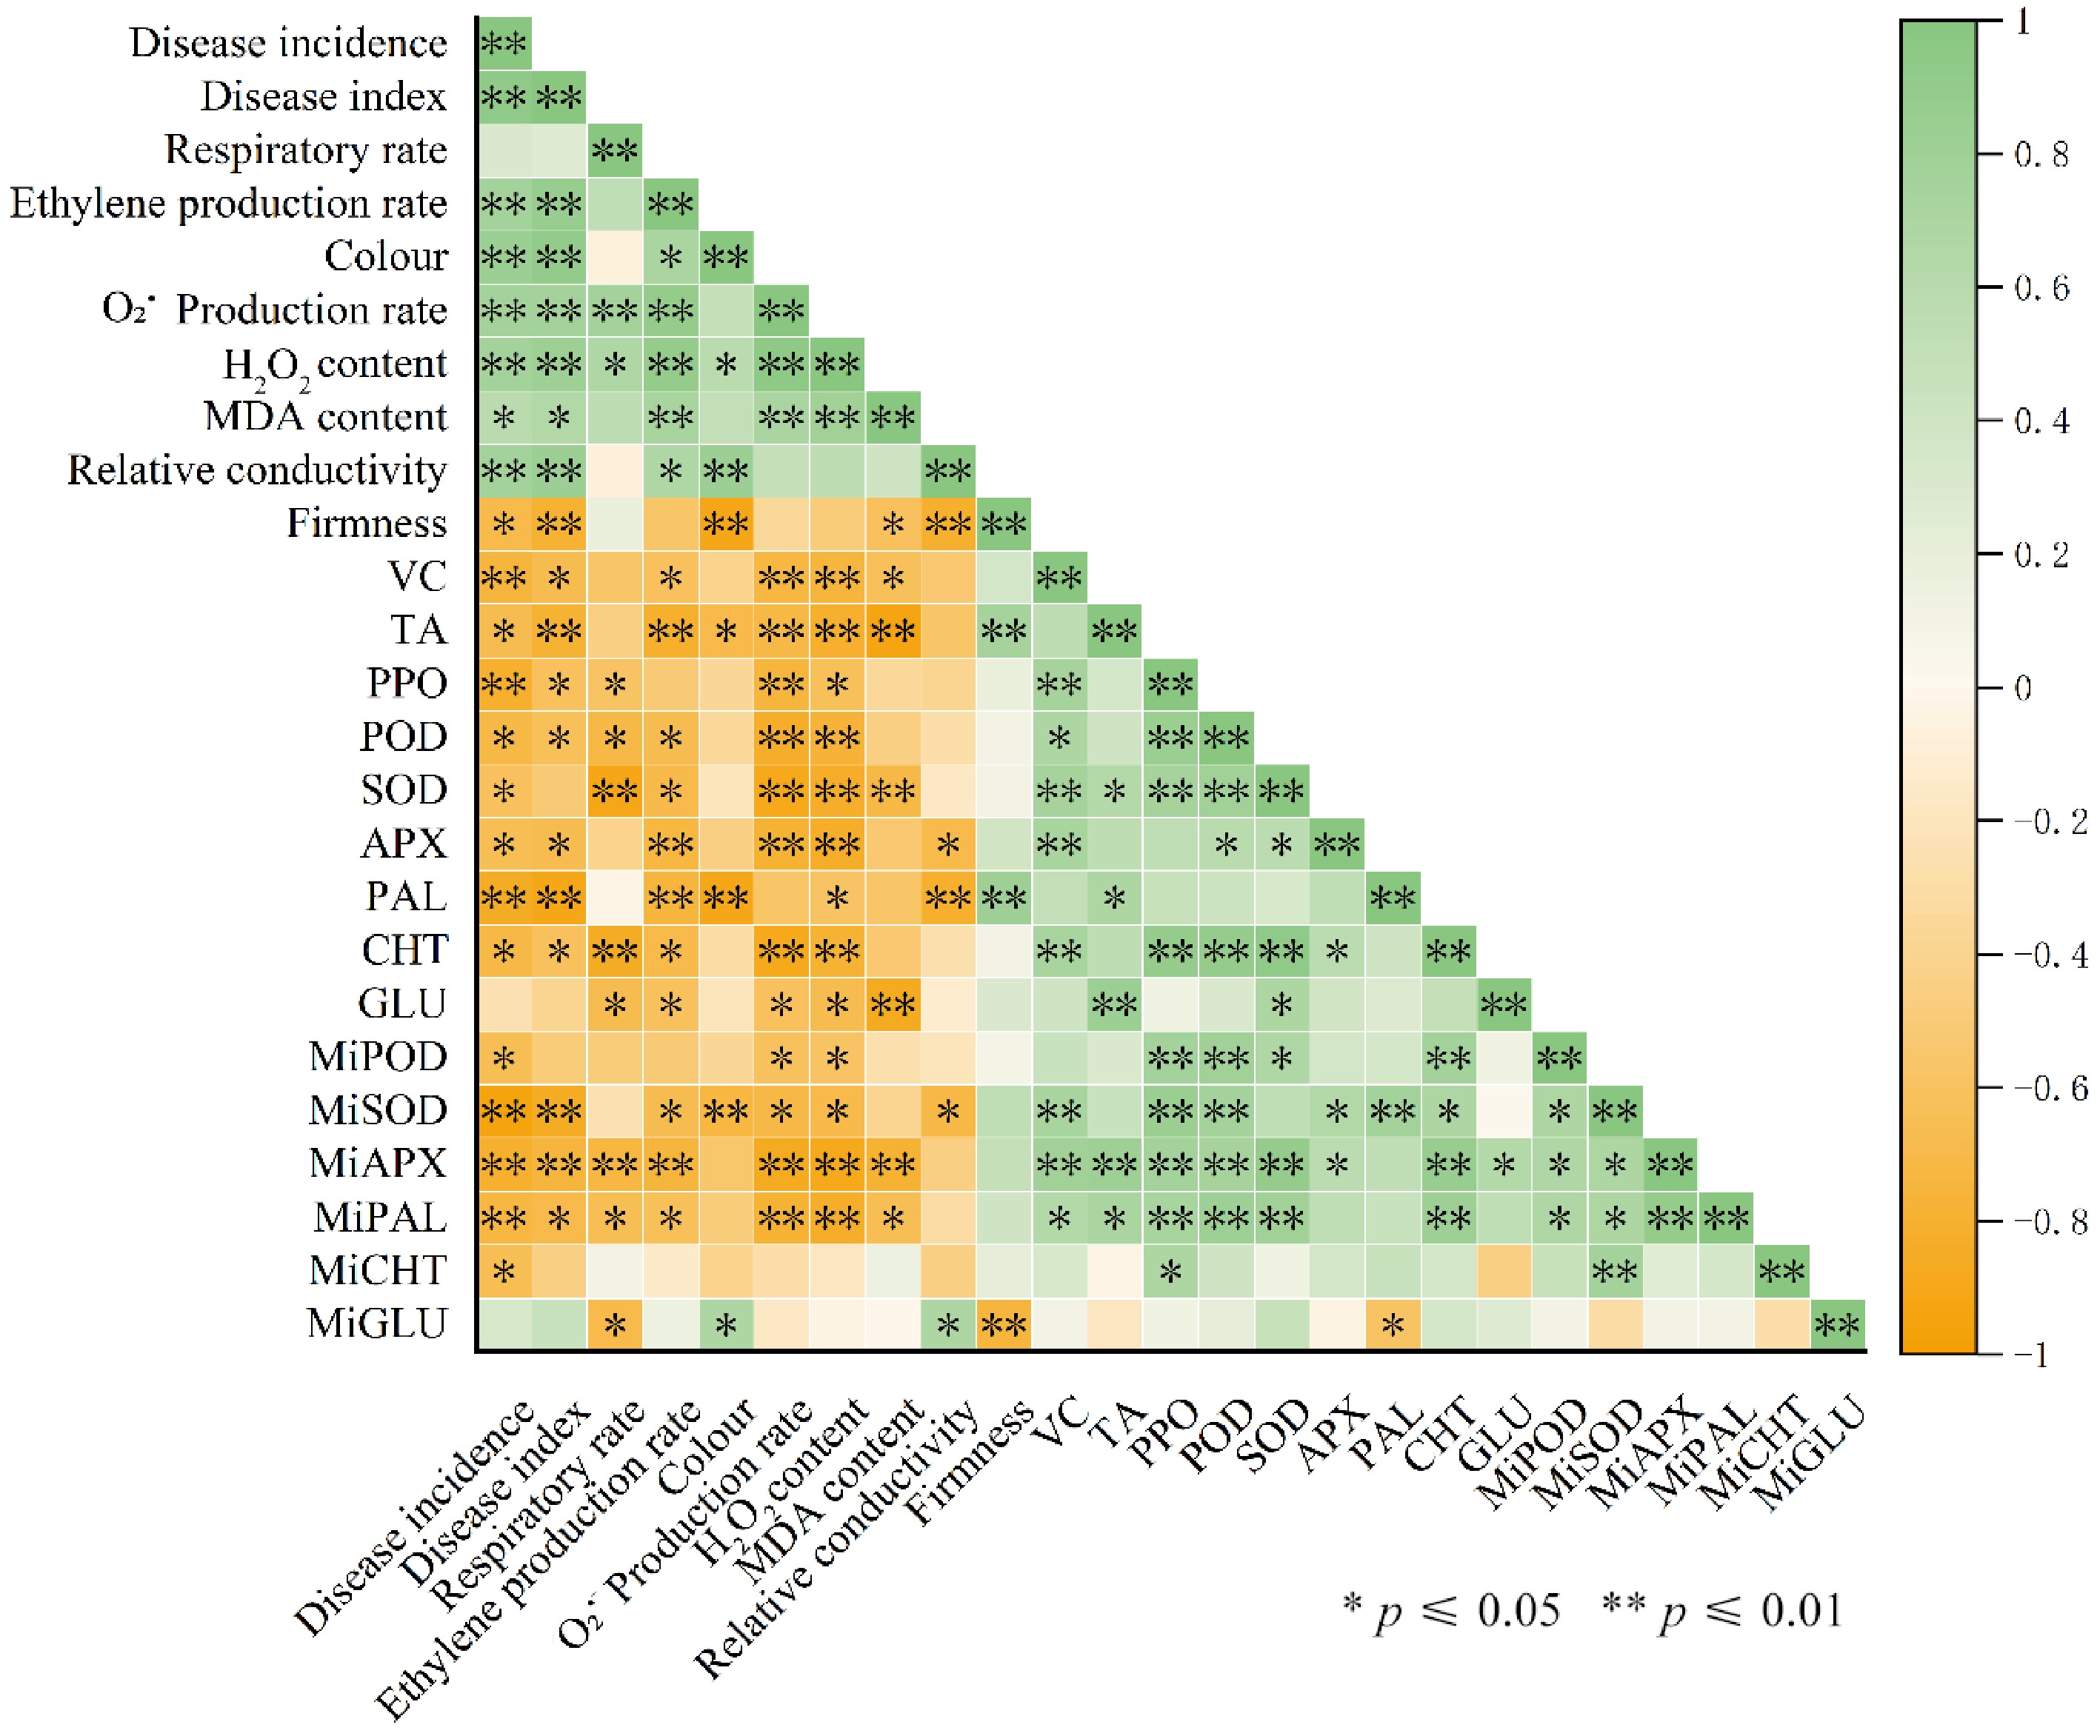
Figure 6.
Correlation analysis between disease incidence, ROS accumulation, enzyme activities, and gene expressions.
-
Gene Forward primer(5'-3') Reverse primer(5'-3') MiPOD TTTCCAGCAAACCAATCAGCG TCCCTTAGCATCCTTGACGG MiSOD CAAGCCCTTCGTTGTTGTCG CTTCACAGTTGTGGGACCATC MiAPX GCTGAGAAGAACTGTCTCCTATC CAACAATATCCTGGTCACTGAGTCC MiPAL GACGTCGCATAGGAGAACGA TCCAGCATTCAAGAACCTTATGA MiCHT CAAGCTGTGCTGGAAAGAGC TTCCACAGGCACCGTAGTTG MiGLU TATTCAGTAACAGGGCGTGGA AATCCGCAACTCTTGGTCTC MiActin ATCTGCTGGAAGGTGCTGAG CCAAGCAGCATGAAGATCAA Table 1.
Primer sequences used in qRT-PCR.
Figures
(6)
Tables
(1)