-
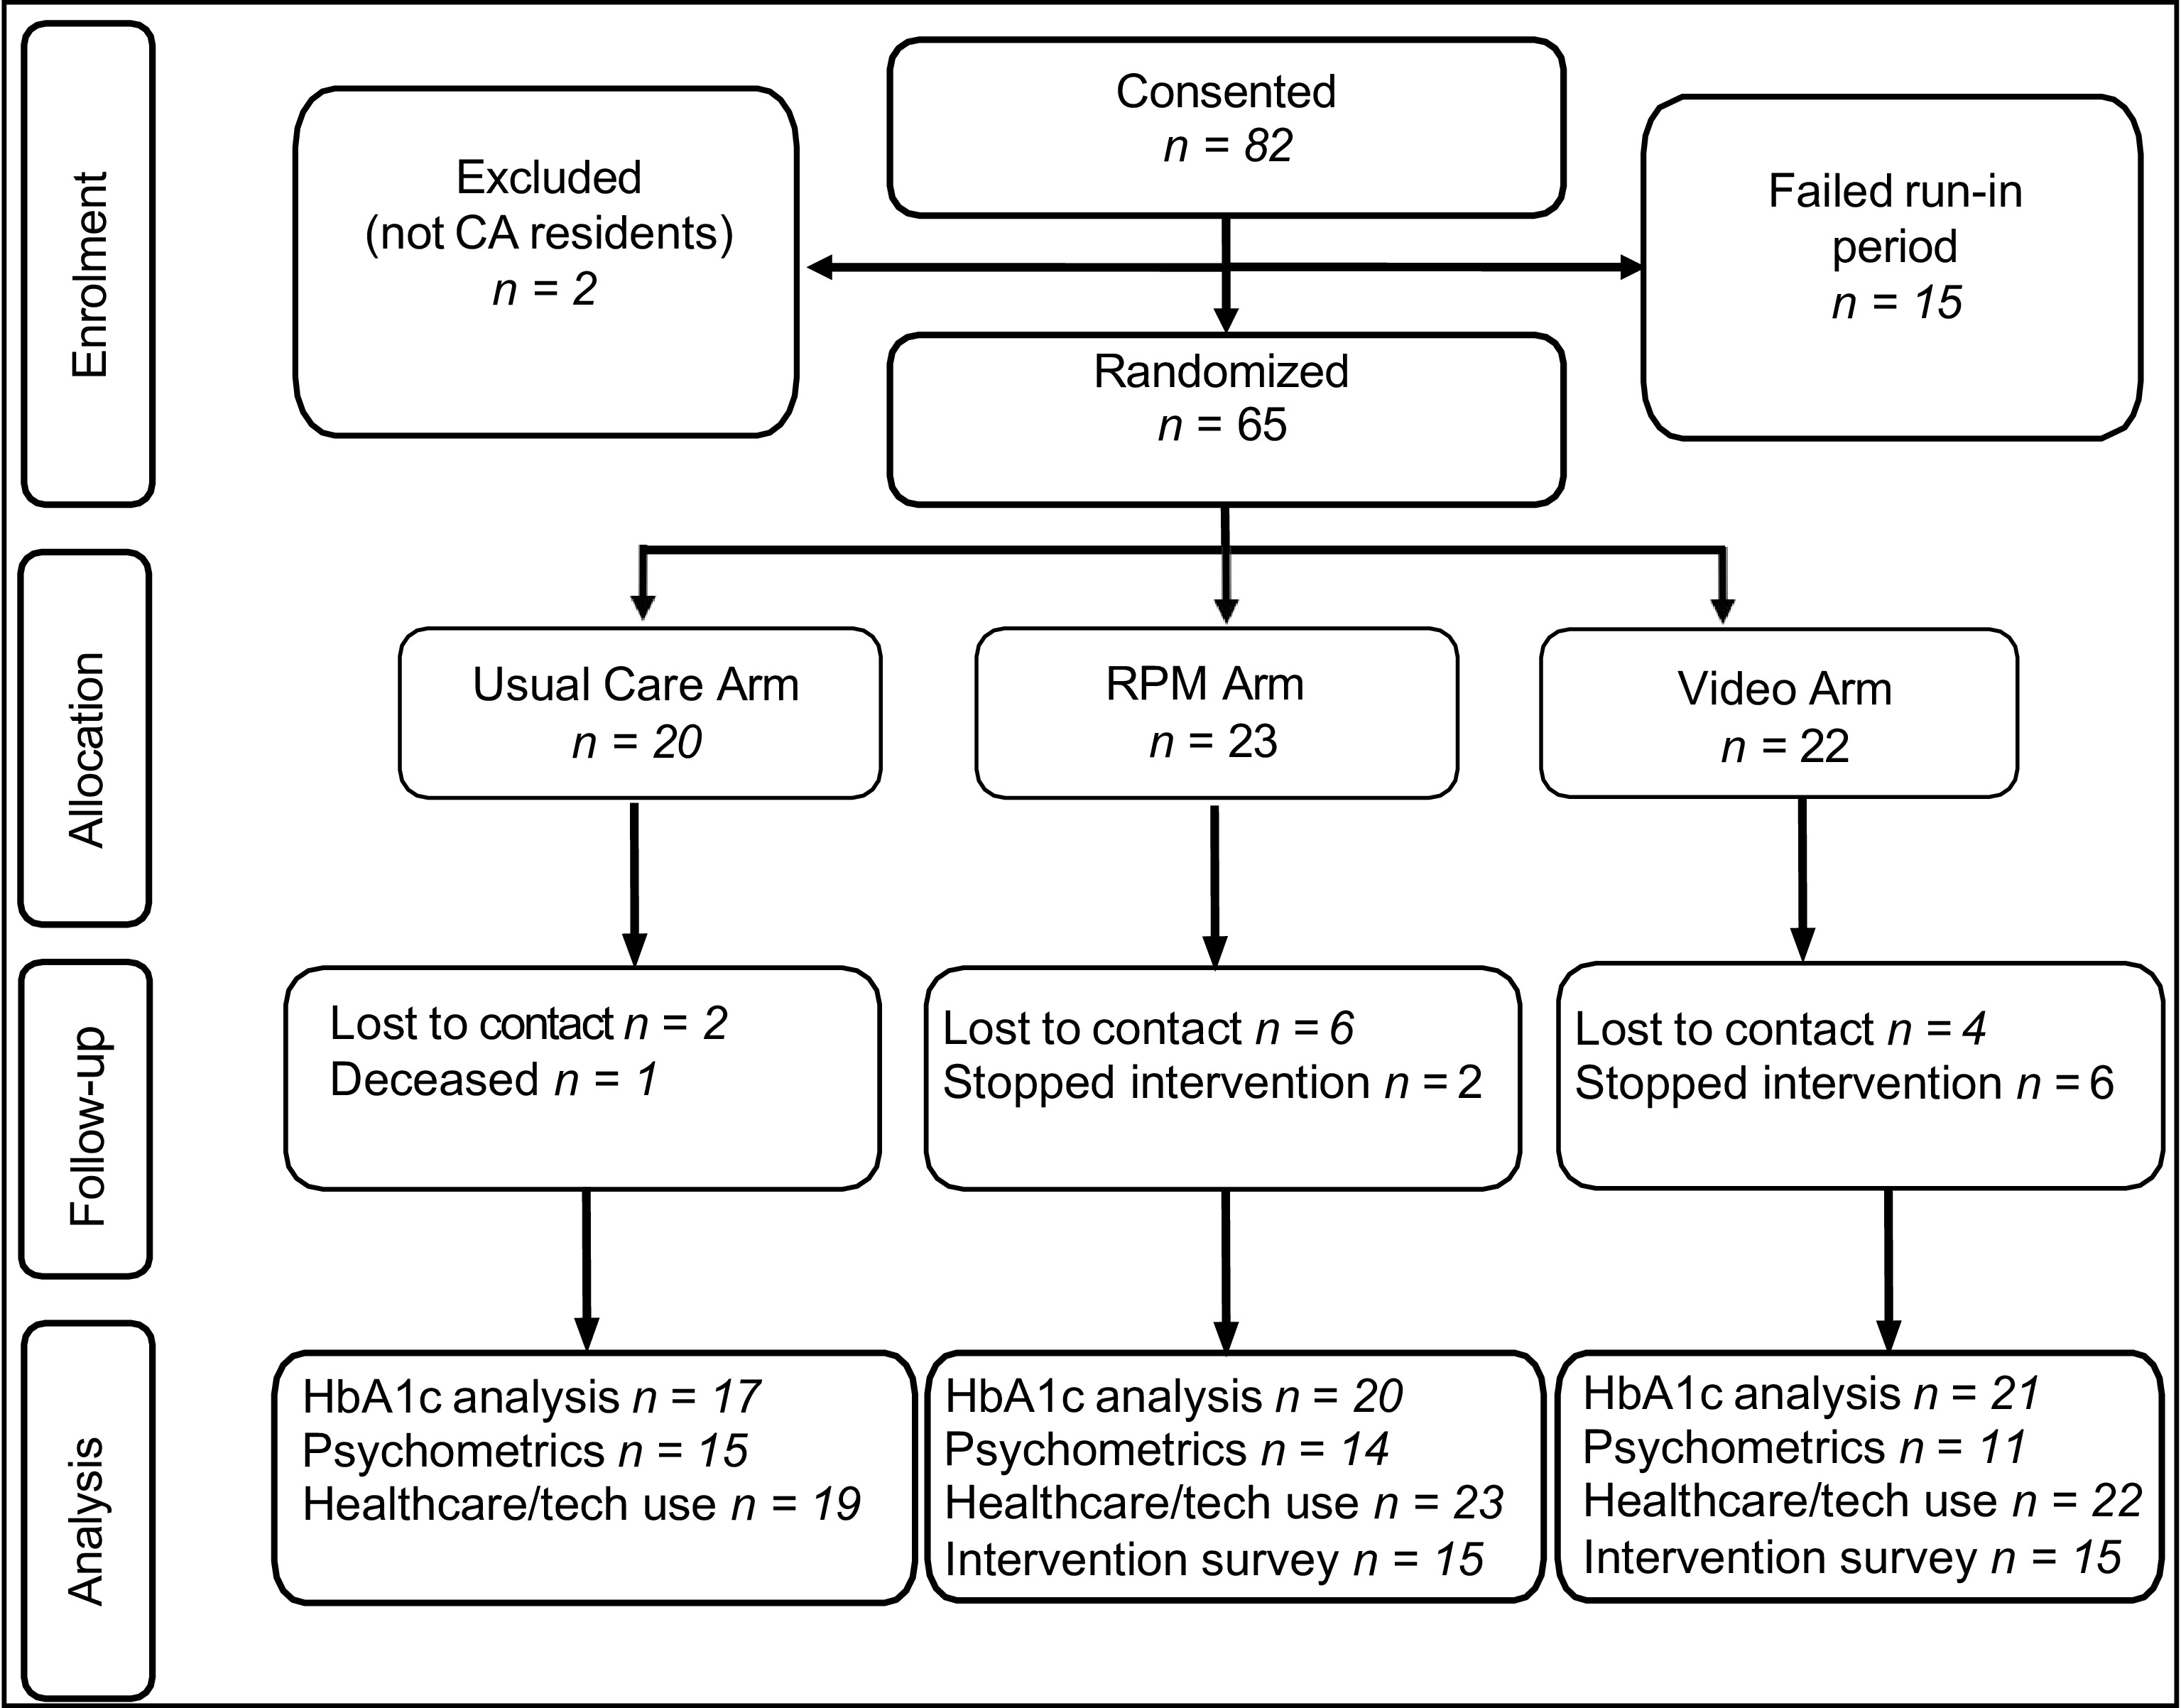
Figure 1.
Consolidated Standards of Reporting Trials (CONSORT) diagram depicting study participation.
-
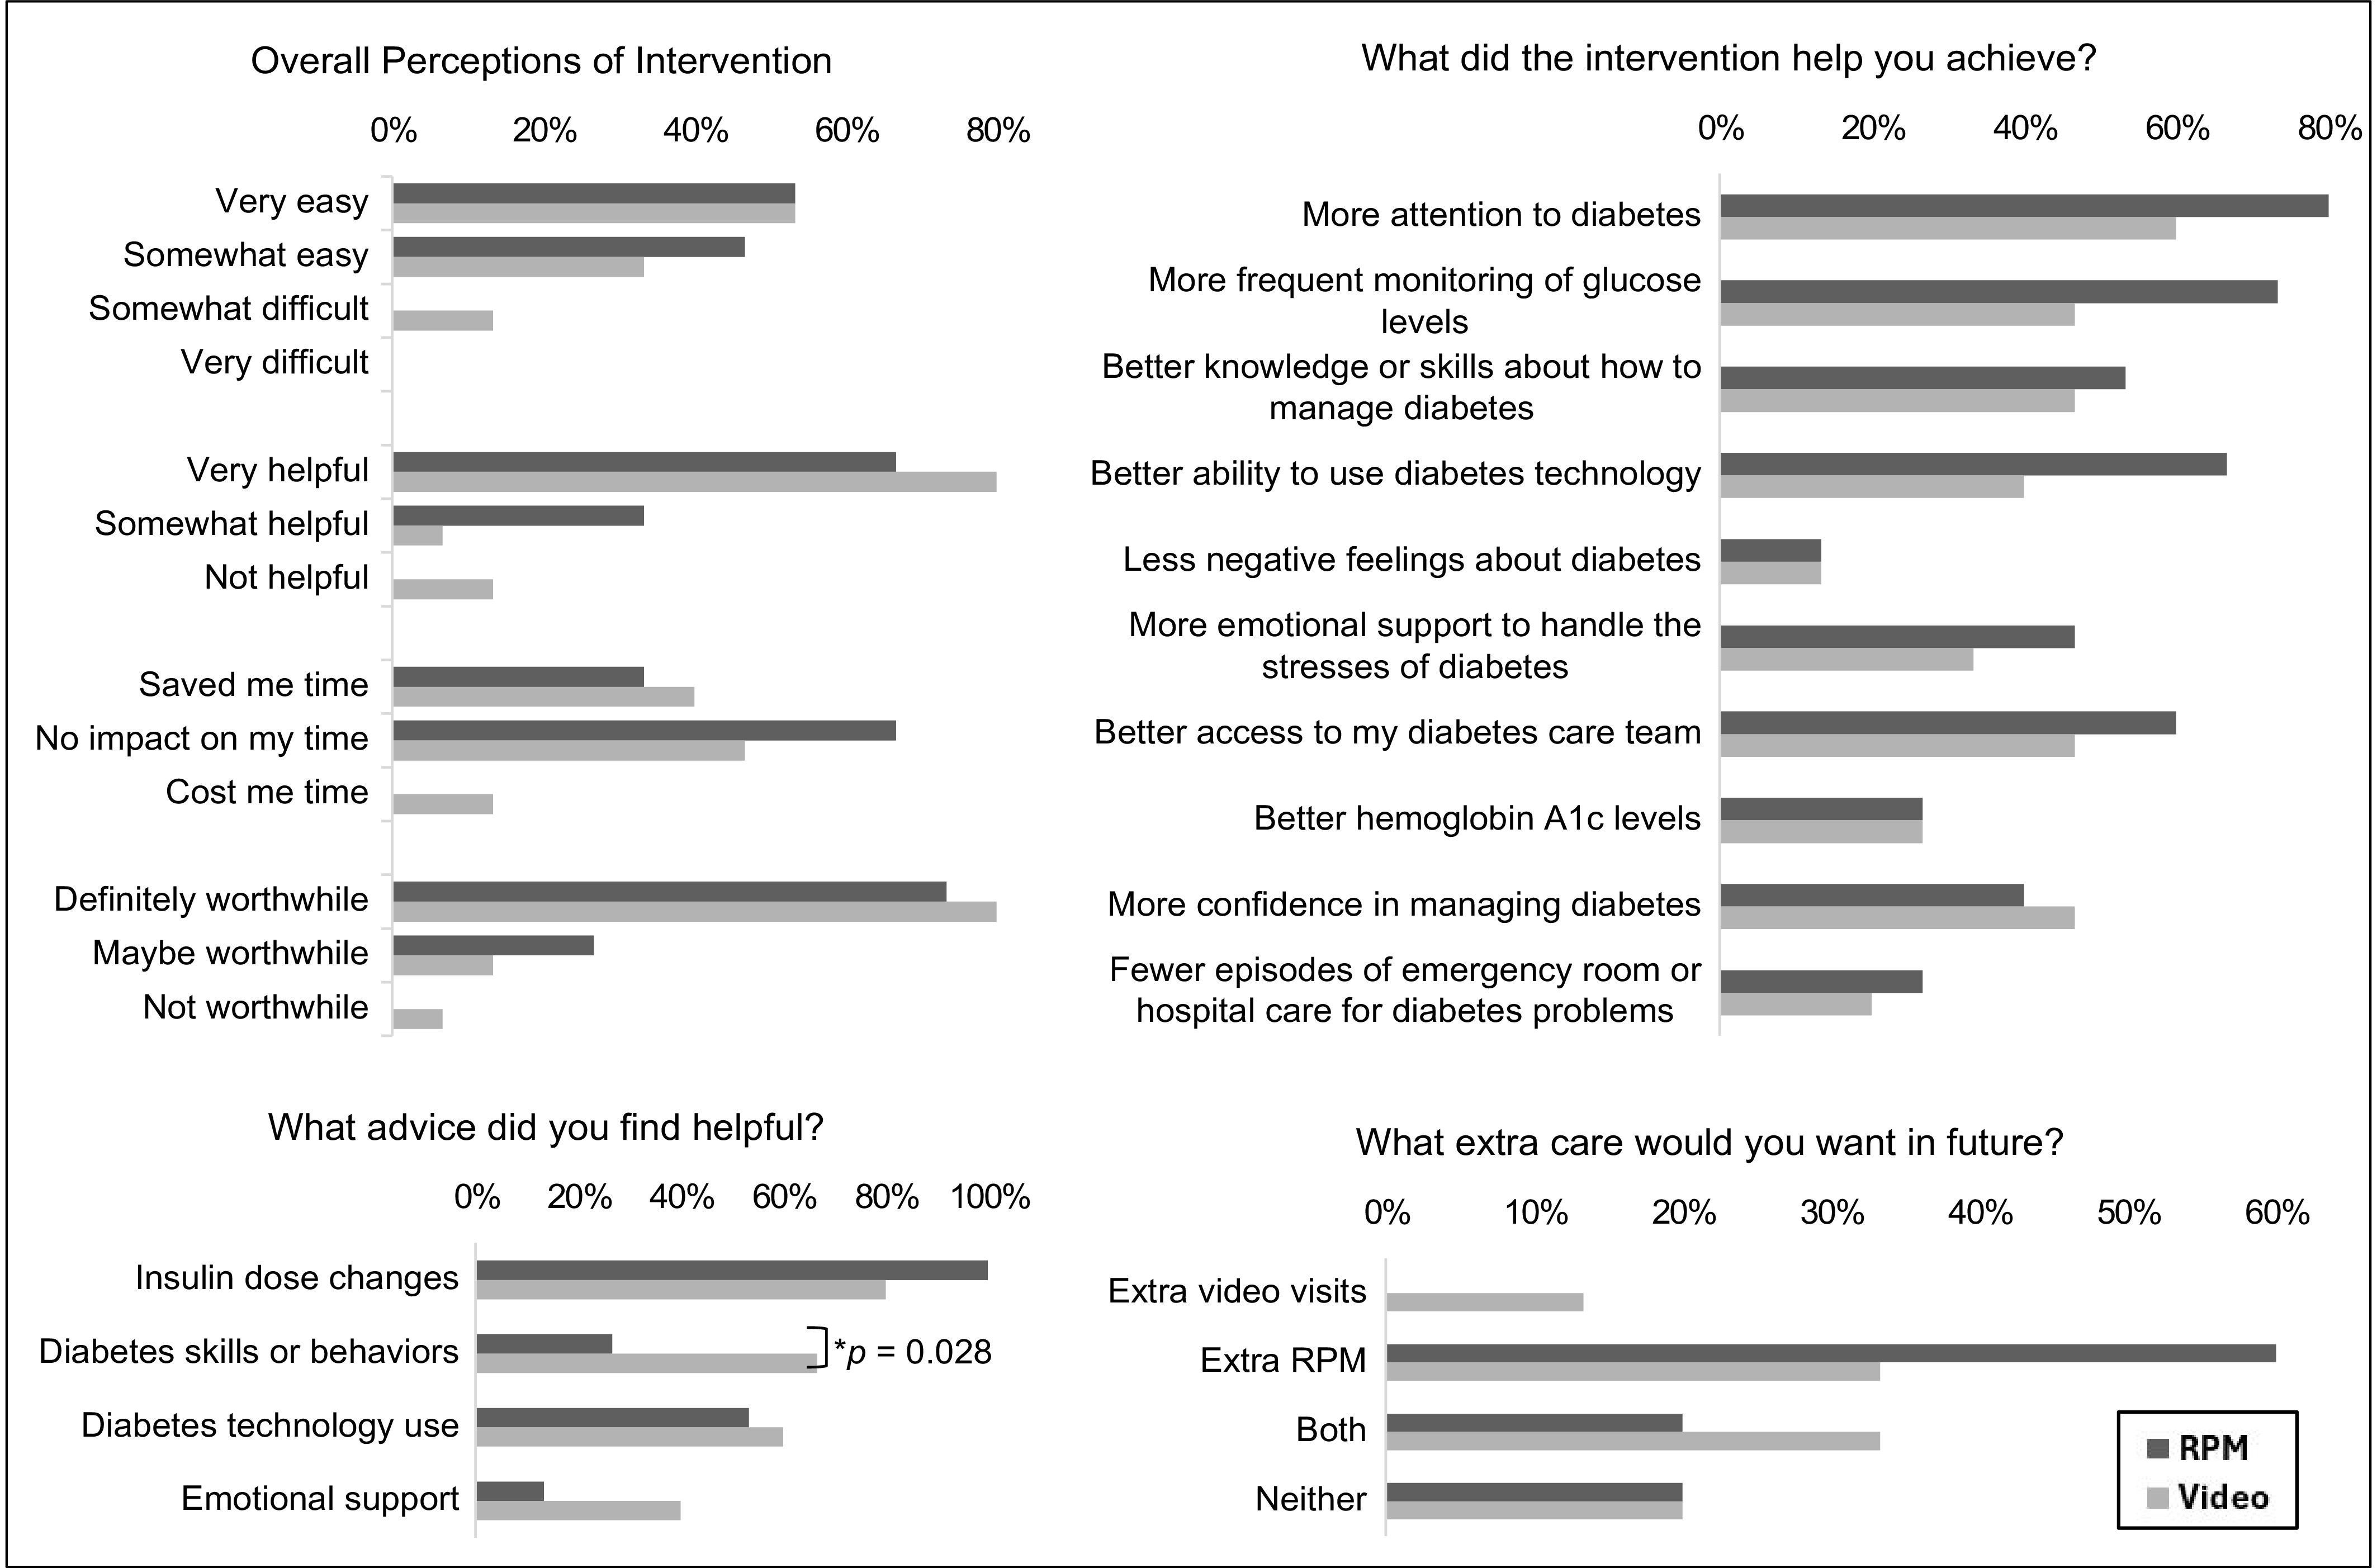
Figure 2.
Participants' feedback about the RPM and video interventions. * Between-arm comparison was performed using the χ2-test for this and all other responses. No other p-values < 0.05.
-
Usual care (n = 20) RPM (n = 23) Video (n = 22) Total (N = 65) p-Value Age (years), mean (SD) 14.6 (2.8) 12.5 (3.3) 13.2 (3.1) 13.4 (3.2) 0.1121 Female gender, n (%) 5 (25%) 14 (60.9%) 9 (40.9%) 28 (43.1%) 0.0592 Race, n (%) 0.6702 Asian 0 (0%) 1 (4.3%) 0 (0%) 1 (1.5%) Black or African American 2 (10%) 2 (8.7%) 4 (18.2%) 8 (12.3%) Other/unknown 3 (15%) 5 (21.7%) 7 (31.8%) 15 (23.1%) Two or more races 3 (15%) 2 (8.7%) 1 (4.5%) 6 (9.2%) White 12 (60%) 13 (56.5%) 10 (45.5%) 35 (53.8%) Hispanic/Latino ethnicity, n (%) 7 (35%) 3 (13%) 7 (31.8%) 17 (26.2%) 0.2002 Public insurance, n (%) 12 (60%) 10 (43.5%) 15 (68.2%) 37 (56.9%) 0.2332 Miles from clinic, mean (SD) 51.2 (54.9) 85.7 (84.9) 83.1 (104.6) 74.2 (84.8) 0.4111 T1D duration (years), mean (SD) 5.9 (4.3) 6.1 (4.2) 5.5 (3.6) 5.8 (4.0) 0.9631 CGM use, n (%) 20 (100%) 23 (100%) 21 (95.5%) 64 (98.5%) 0.3712 Insulin pump use, n (%) 15 (75%) 20 (87%) 15 (68.2%) 50 (76.9%) 0.3182 Baseline HbA1c (%), mean (SD) 9.9 (2.0) 9.9 (1.9) 9.4 (1.3) 9.7 (1.7) 0.6901 Baseline 30-day TIR (%), mean (SD)3 38.9 (14.1) 35.7 (15.3) 34.3 (12.5) 36.2 (13.9) 0.4411 Baseline pump TDD, mean (SD)4 1.0 (0.28) 1.1 (0.35) 1.0 (0.37) 1.0 (0.33) 0.4451 1 Kruskal–Wallis p-value; 2 χ2 p-value; 3 Data only available for n = 53; 4 Data only available for n = 37. SD, standard deviation; RPM, remote patient monitoring; T1D, type 1 diabetes; CGM, continuous glucose monitoring; HbA1c, hemoglobin A1c; TIR, time in range 70−180 mg/dL; TDD, total daily insulin dose in units per kg of body weight. Table 1.
The study population's characteristics.
-
Visit metrics Video RPM p-value1 Mean (SD), min 29.8 (10.9) 17.2 (12.1) < 0.001 Topics covered Insulin doses 51% 55% 0.495 Diabetes skills/behaviors 89% 68% 0.001 Diabetes technology use 78% 52% <0.001 Emotional support 34% 10% <0.001 Recommendations used 0.008 All 13% 13% Some 65% 42% None 22% 45% 1 p-values using the t-test or χ2-test, as appropriate Table 2.
Clinician-reported data from study encounters.
-
Measured mean
HbA1c (%)Mean diabetes visits in
the prior 6 monthsMean SEDM1-
youth scoreMean SEDM1-
parent scoreMean PAID2-
youth scoreMean PAID2-
parent scoreVIDEO Baseline 9.40 1.68 6.10 7.80 38.50 39.50 Final 8.80 1.36 6.70 8.20 38.00 39.60 Δ −0.53 −0.32 0.64 0.82 3.54 3.40 (95% CI) (−0.93, –0.12) (−0.73, 0.10) (−1.03, 2.30) (−0.83, 2.48) (−10.91, 17.98) (−14.92, 21.71) p-value 0.01 0.13 0.41 0.30 0.60 0.69 Outcome compared with usual care3 −1.00 −0.50 0.40 0.10 4.20 −1.40 (95% CI) (−2.07, 0.06) (−1.05, 0.03) (−0.82, 1.60) (−1.15, 1.33) (−13.72, 22.07) (−20.57, 17.78) p-value 0.06 0.04 0.52 0.88 0.64 0.88 RPM Baseline 9.90 1.70 6.30 7.80 37.20 47.90 Final 9.60 1.96 6.70 7.80 30.90 49.30 Δ −0.43 0.26 0.56 −0.20 −6.70 0.28 (95% CI) (−1.23, 0.38) (−0.16, 0.68) (−0.35, 1.48) (−0.94, 0.55) (−18.62, 5.22) (−10.49, 11.06) p-value 0.28 0.21 0.21 0.58 0.24 0.96 Outcome compared with usual care3 −0.10 0.20 0.60 −0.30 −8.90 3.60 (95% CI) (−1.21, 1.04) (−0.35, 0.74) (−0.55, 1.79) (−1.56, 0.89) (−26.49, 8.66) (−15.85, 23.14) p-value 0.88 0.47 0.29 0.58 0.31 0.71 Usual care Baseline 9.90 1.55 6.30 8.00 47.50 49.10 Final 9.80 1.74 6.50 8.40 33.10 42.70 Δ −0.05 0.21 0.15 0.56 −10.86 −8.39 (95% CI) (−0.81, 0.72) (−0.44, 0.86) (−0.78, 1.09) (−0.12, 1.25) (−22.40, 0.67) (−20.54, 3.75) p-value 0.90 0.51 0.73 0.10 0.06 0.16 1 Mean per item score on a 10-point scale; 2 Total score on a 100-point scale; 3 ANCOVA comparison of the final values wth adjustment for baseline values, age, gender, race/ethnicity, insurance type, and baseline pump use. Table 3.
Within-arm and between-arm comparisons of changes in continuous study outcomes.
Figures
(2)
Tables
(3)