-
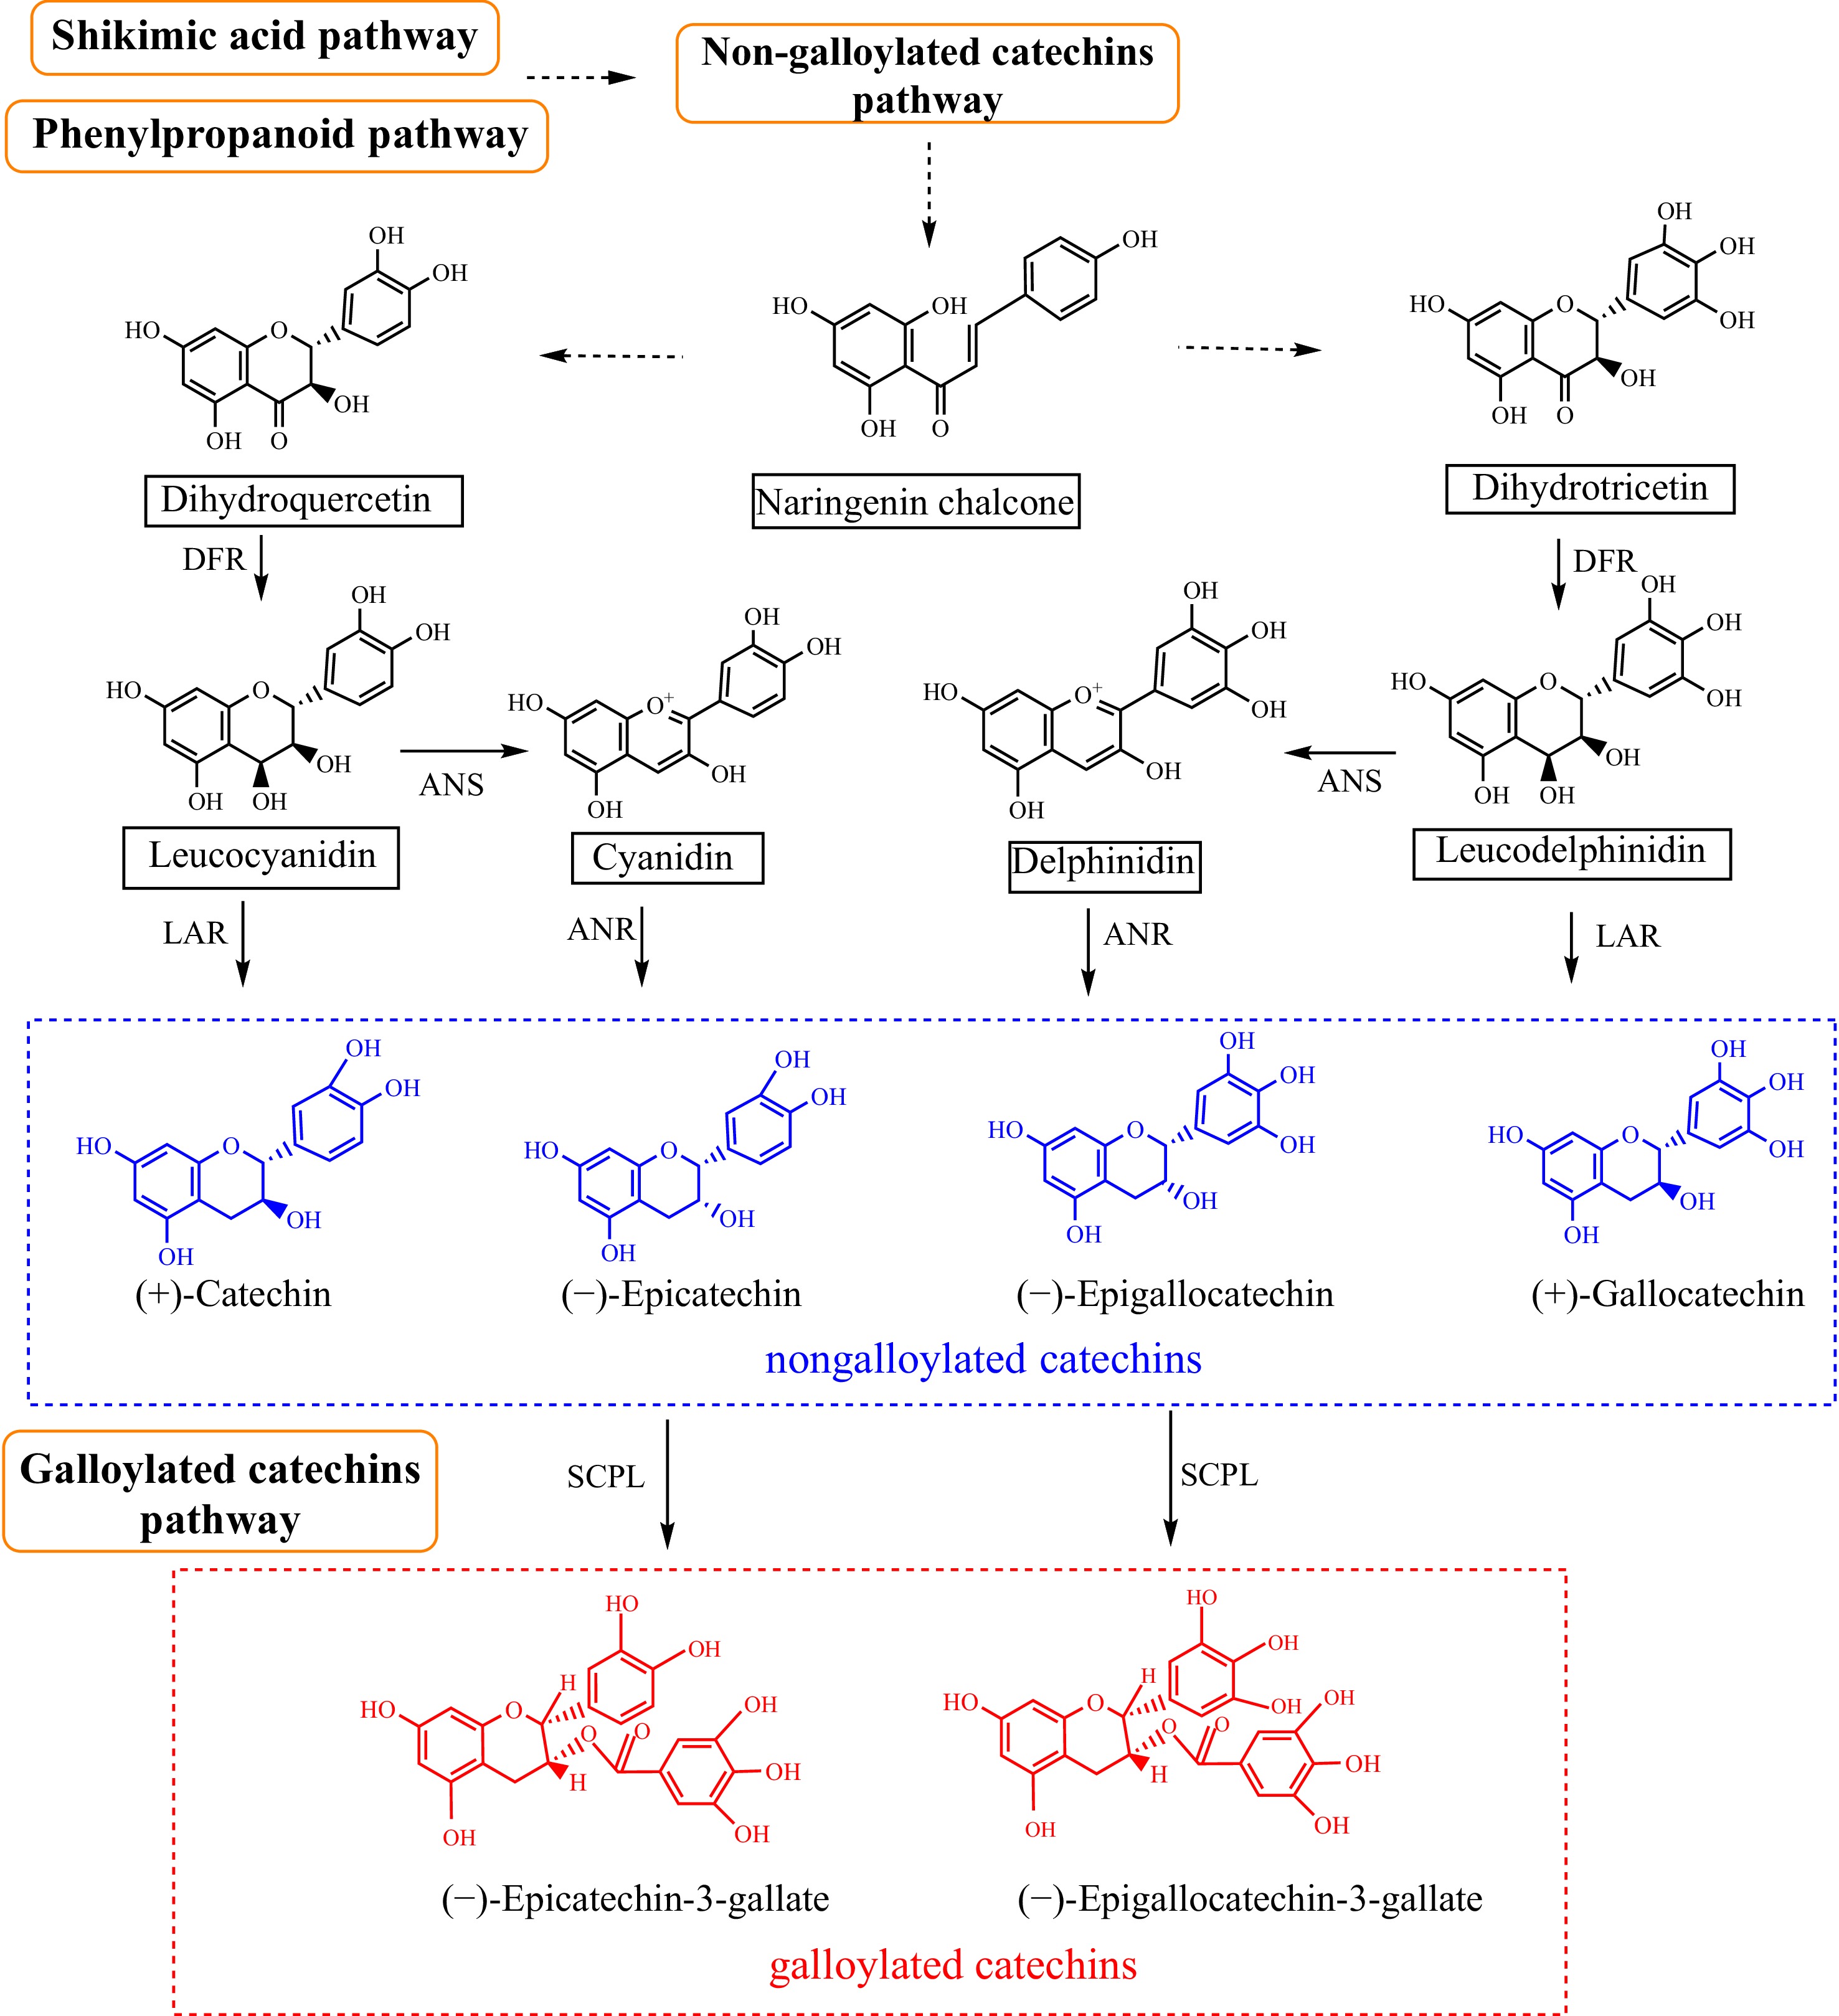
Figure 1.
The biosynthetic pathways underlying different types of catechins. DFR, dihydroflavonol 4-reductase; LAR, leucoanthocyanidin reductase; ANS, anthocyanidin synthase; SCPL, serine carboxypeptidase-like. Blue dashed box: nongalloylated catechins; black dashed box: galloylated catechins.
-
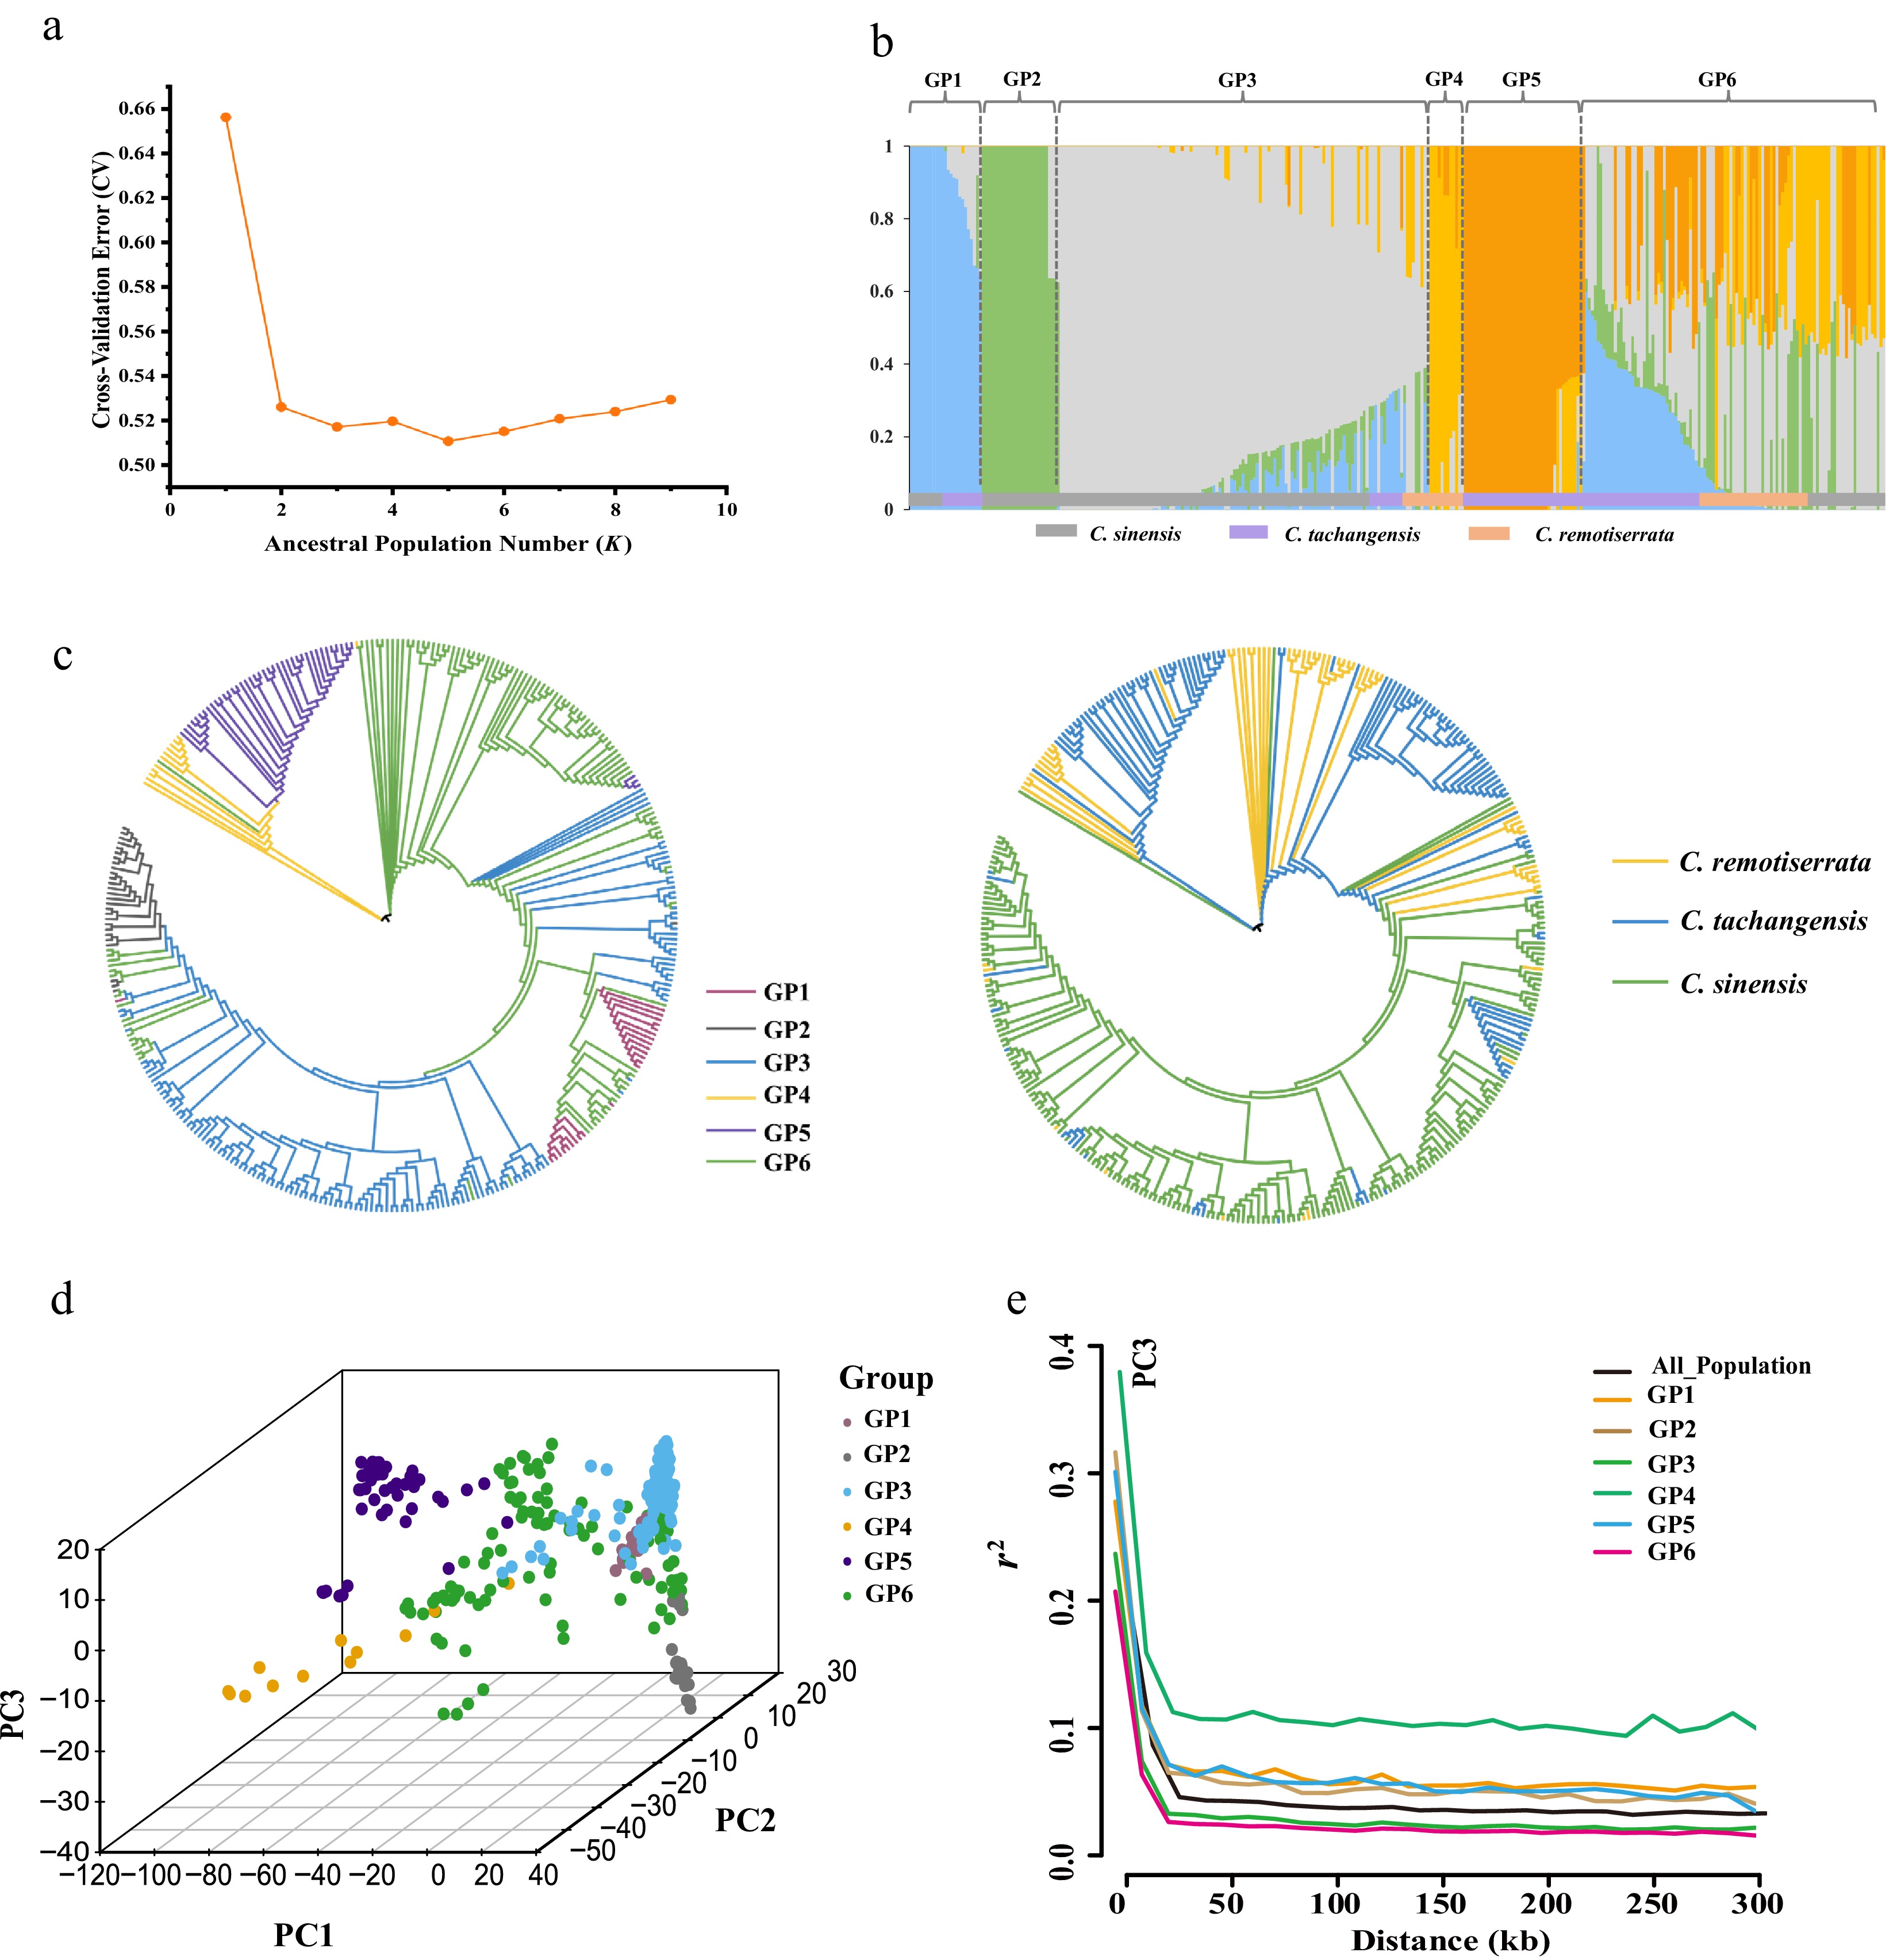
Figure 2.
Population structure, PCA, and NJ tree of the 329 tea accessions: (a) Cross-validation line chart, the lowest CV error (0.51075) was observed at K = 5; (b) K = 5 membership function bar graph (one color represents one ancestor); (c) NJ phylogenetic tree of 329 tea germplasm resources and evolutionary trees; (d) principal component analysis of tea germplasm resources; (e) LD decay of 329 accessions.
-
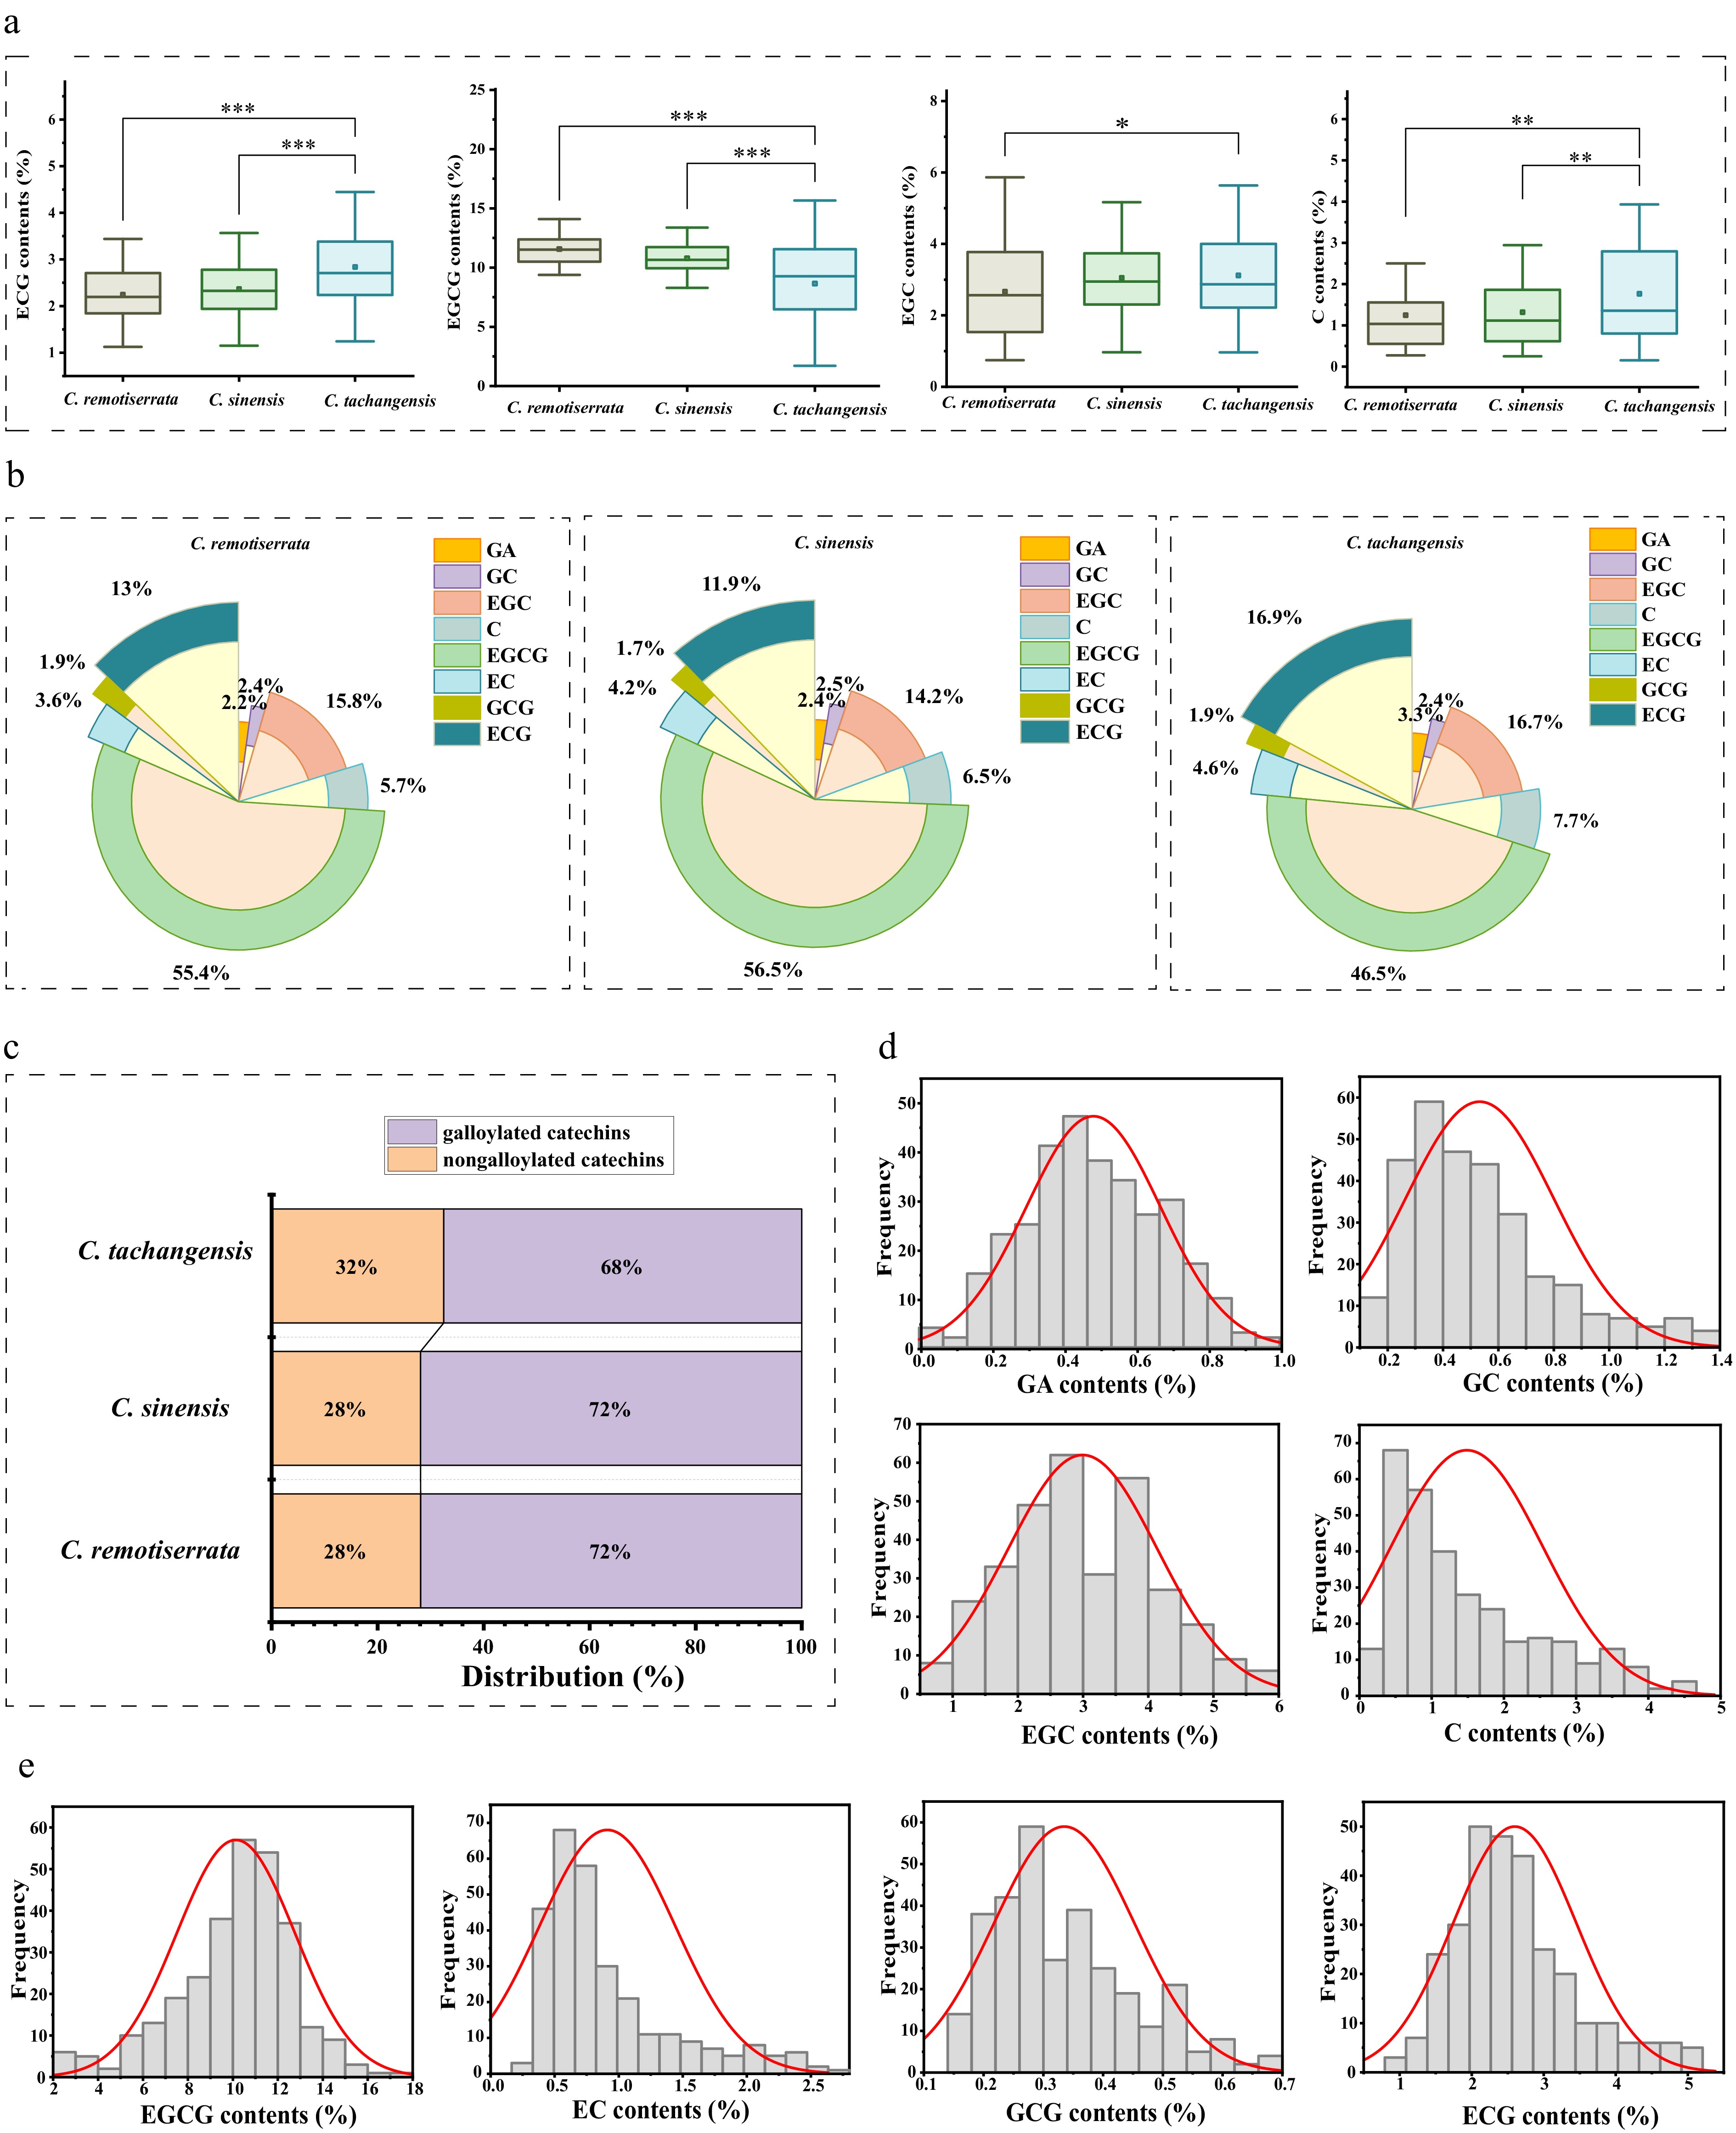
Figure 3.
Differences in catechin composition and distribution among three tea groups and phenotype of catechin components and frequency distribution: (a) Box plot comparison of catechin components among the three tea groups, *, **, and *** indicate statistically significant differences at p < 0.05, p < 0.01, and p < 0.001, respectively; (b) comparison of the catechin composition of three Camellia species using pie charts; (c) proportion diagram of nongalloylated catechins and galloylated catechins in three tea groups; (d) histogram of GA, GC, EGC, and C; (e) histogram of EGCG, EC, GCG, and ECG.
-
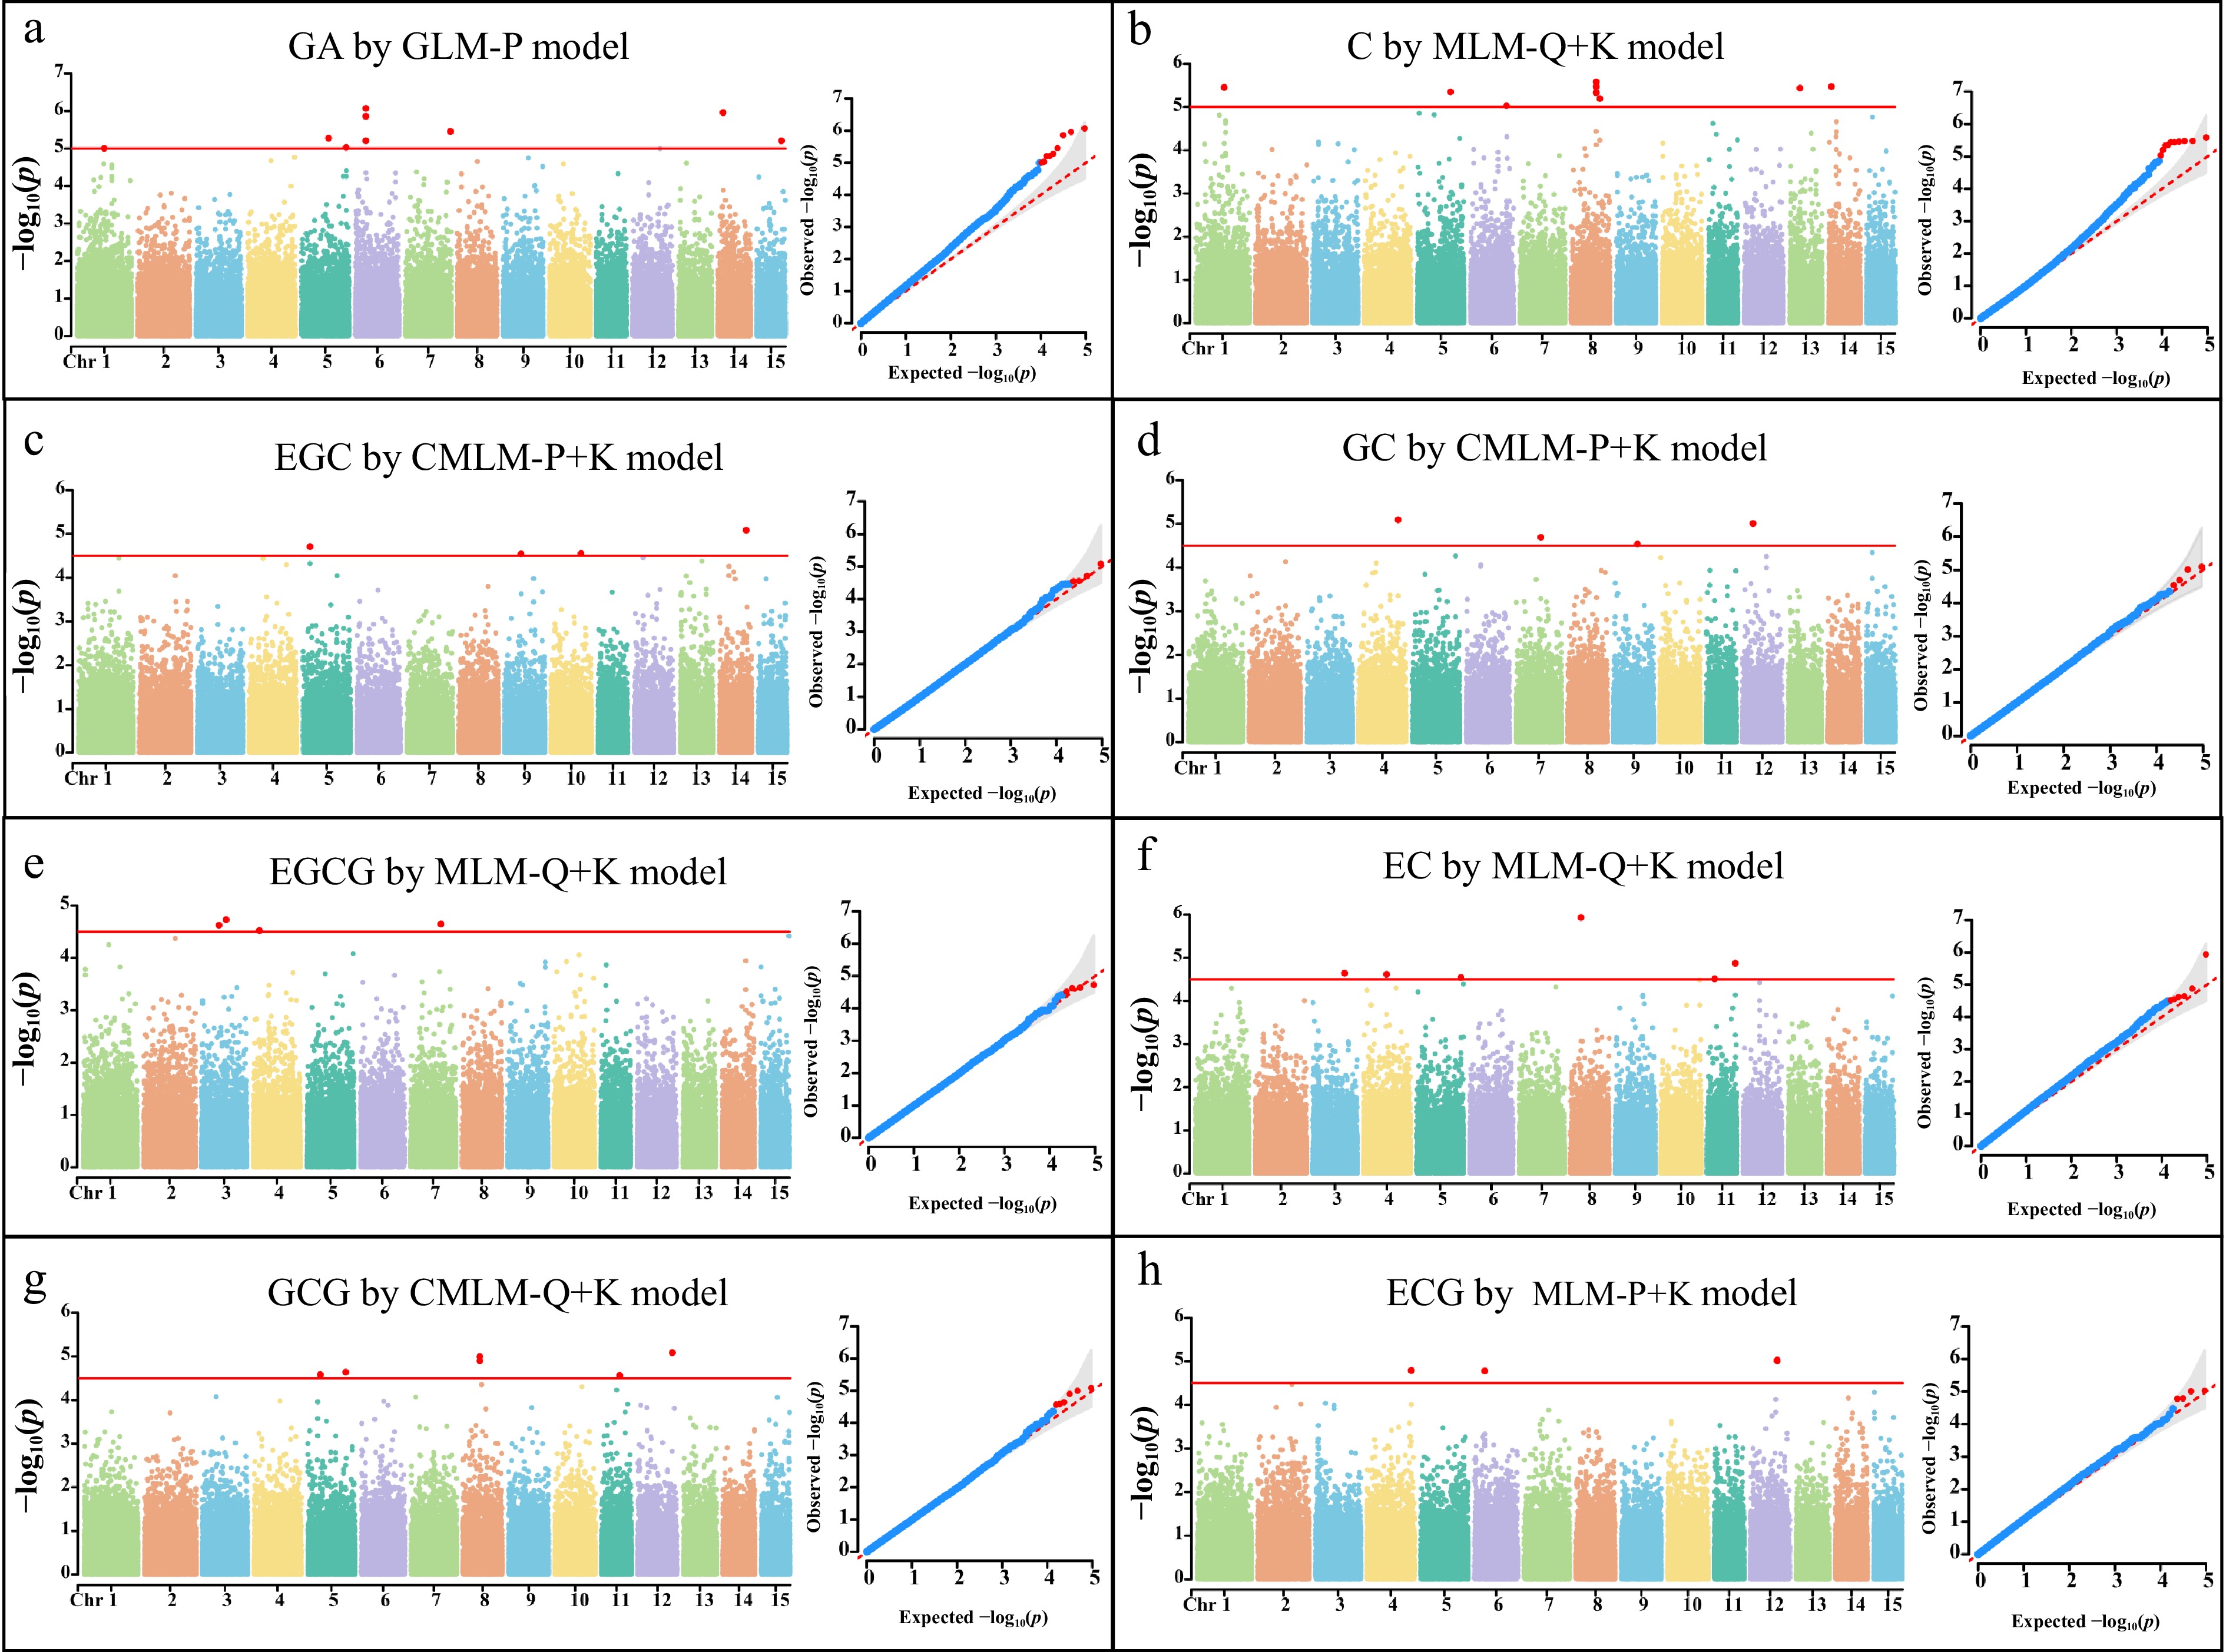
Figure 4.
Genome-wide association analysis of GA, C, GC, EGC, EC, EGCG, GCG, and ECG: (a) Manhattan plots and Q–Q plots of GA; (b) Manhattan plots and Q–Q plots of C; (c) Manhattan plots and Q–Q plots of EGC; (d) Manhattan plots and Q–Q plots of GC; (e) Manhattan plots and Q–Q plots of EGCG; (f) Manhattan plots and Q–Q plots of EC; (g) Manhattan plots and Q–Q plots of GCG; (h) Manhattan plots and Q–Q plots of ECG.
-
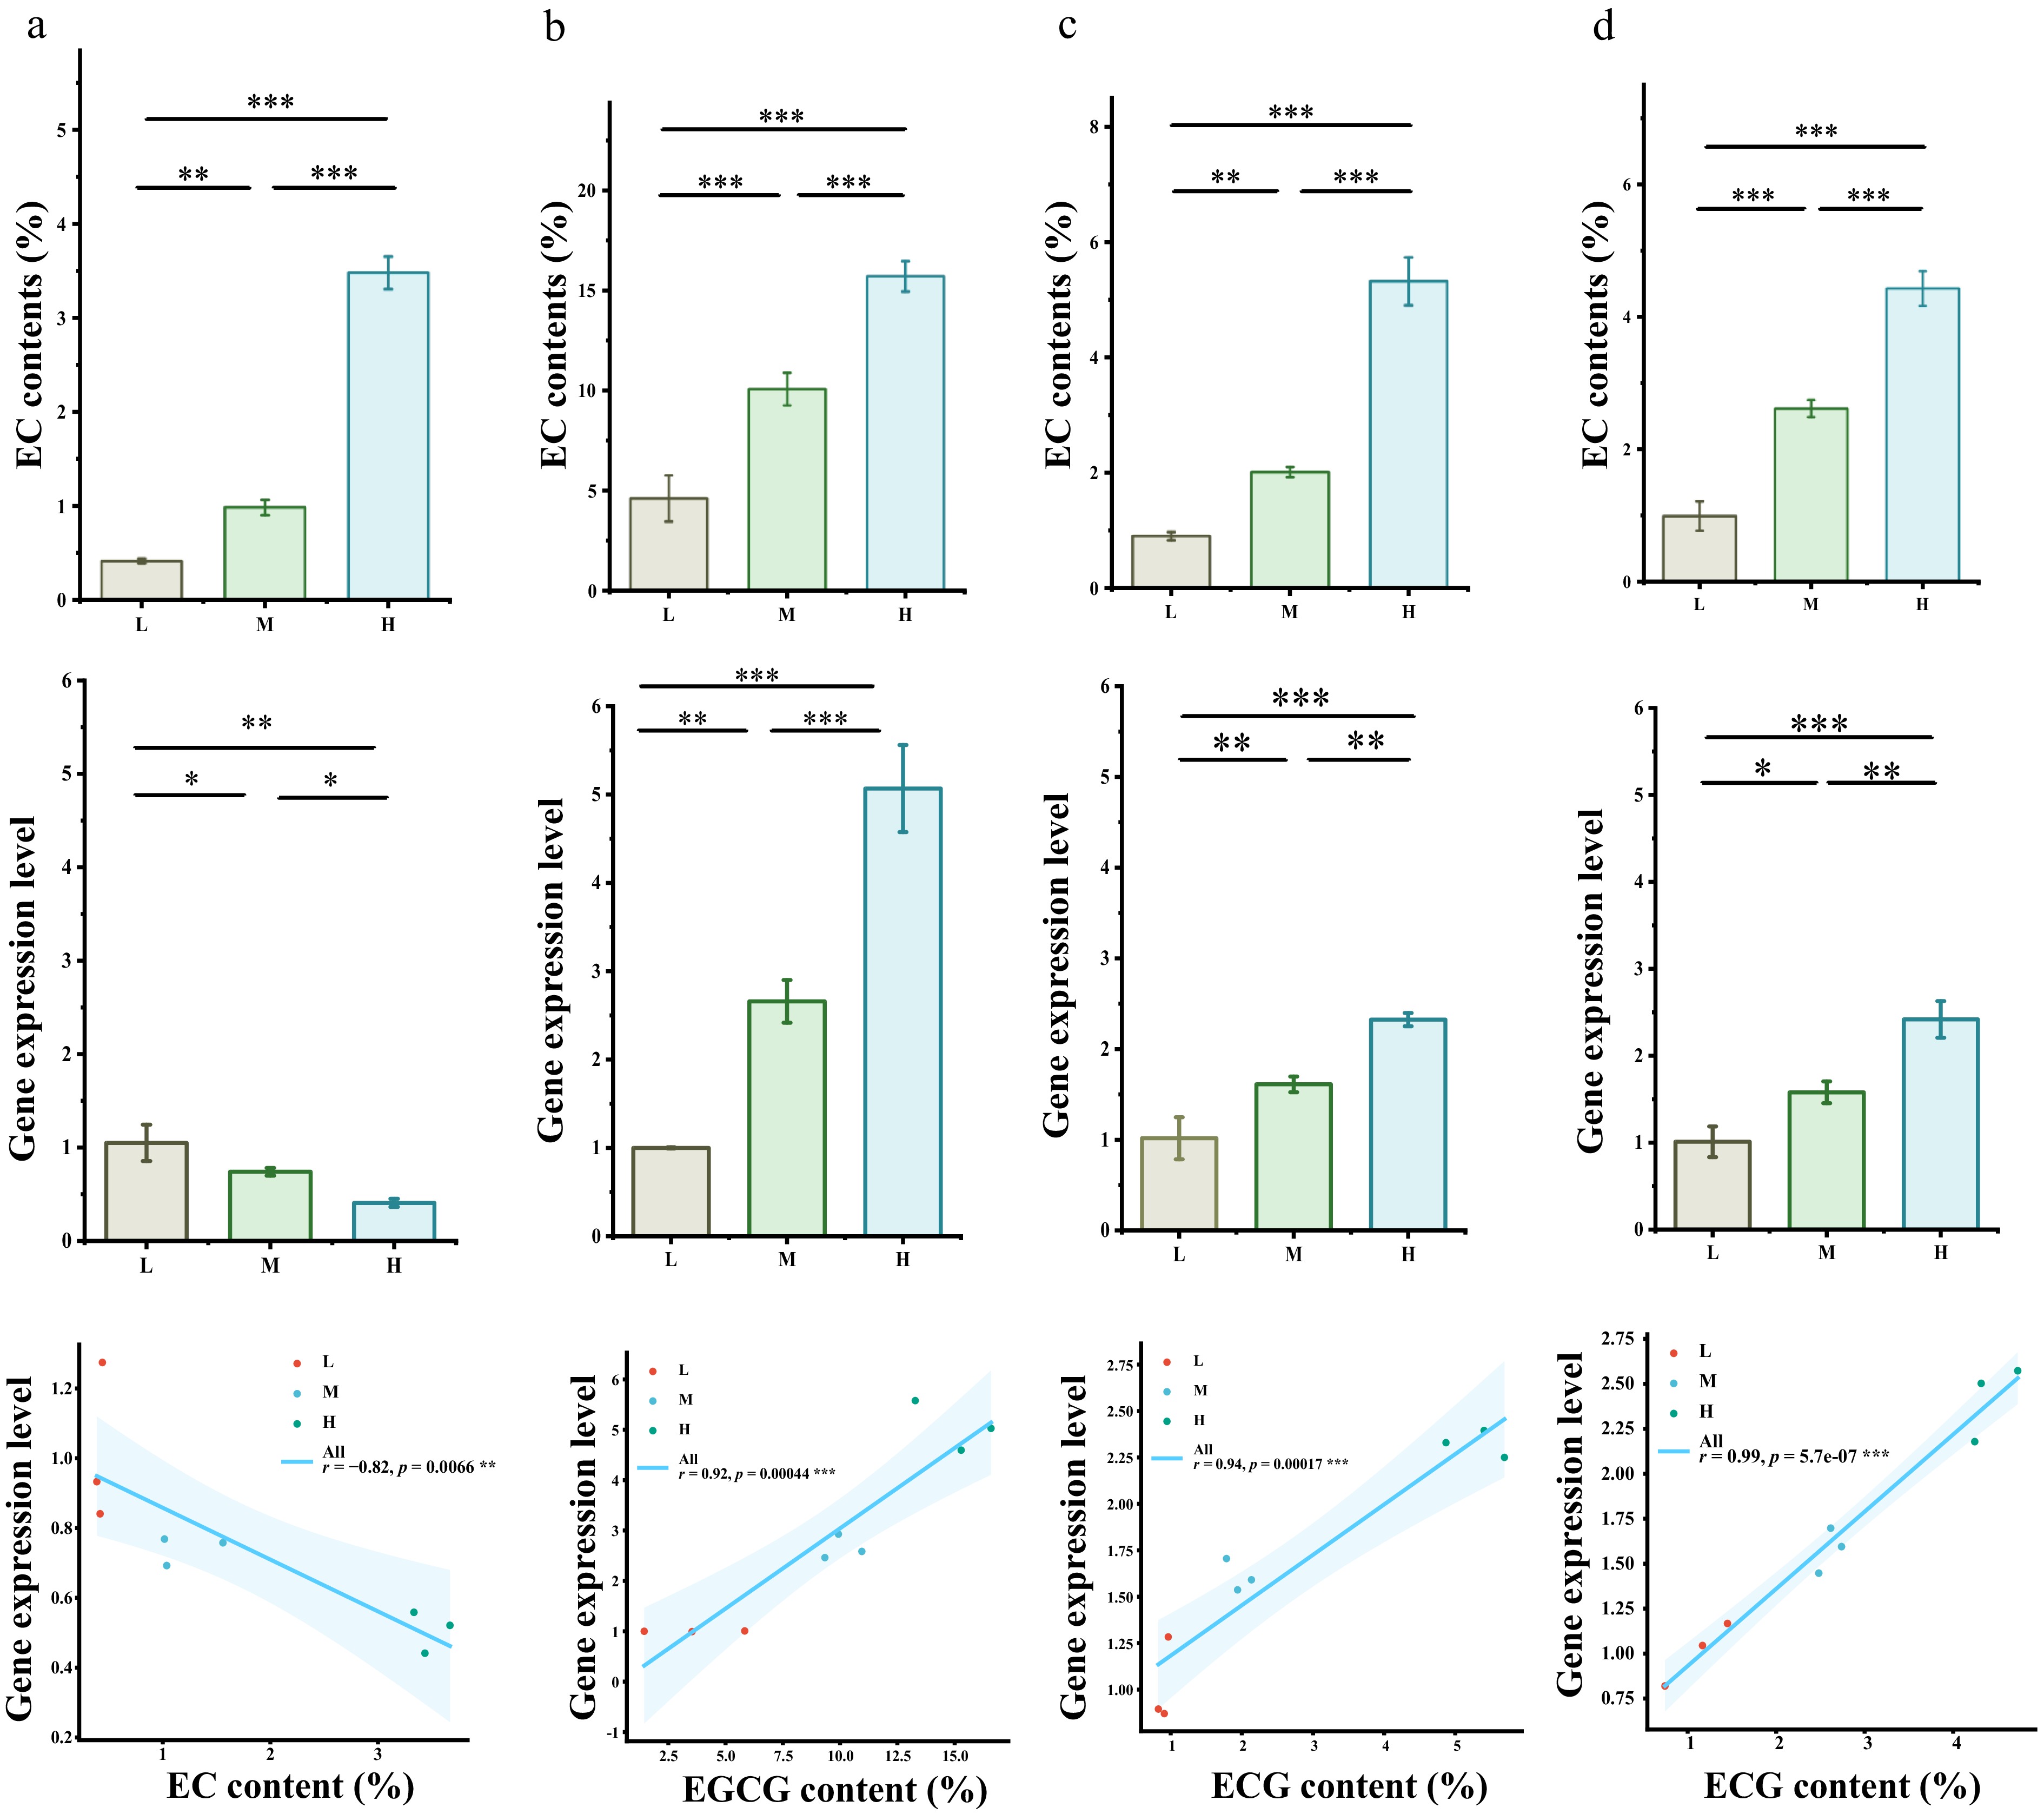
Figure 5.
RT-qPCR analysis of four candidate genes: (a) content of EC, expression level of TEA011262.1, and correlation analysis. “H” indicates high EC content: N564, N485, and N343; “M” indicates moderate EC content: M12, M14, and M5; and “L” indicates low EC content: M93, M27, and M78. (b) Content of EGCG, expression level of TEA000116.1, and correlation analysis. “H” indicates high EGCG content: N145, N149, and N143; “M” indicates moderate EGCG content: N465, M24, and N572; and “L“ indicates low EGCG content: N343, M12, and M77. (c) Content of ECG, expression level of TEA023243.1, and correlation analysis. “H“ was high: N546, M77, and N560; “M“ was medium: N143, N474, and M24; and “L“ was low: M91, M27, and M93. (d) Content of EGC, expression level of TEA026236.1, and correlation analysis. “H“ was high: M48, M95, and N343; “M“ was medium: N143, N465, and M39; and “L“ was low: N564, M18, and M93. ***, **, and * indicate statistically significant differences at p < 0.001, p < 0.01, and p < 0.05, respectively.
-
Transitions Transversions CT AG AT AC CG GT Number of sites 40,076 39,807 6,592 5,691 4,633 5,739 Percentage of allelic sites 39.08 38.82 6.43 5.55 4.52 5.60 Total (%) 79,883 (77.90) 22,655 (22.1) Table 1.
GBS sequencing substitution and inversion ratio.
-
Group Ho Fis Tajima's D Pi GP1 0.065 0.63 0.276 0.17 GP2 0.065 0.525 0.329 0.141 GP3 0.179 0.626 0.398 0.18 GP4 0.069 0.615 0.452 0.188 GP5 0.057 0.63 0.65 0.164 GP6 0.089 0.632 0.755 0.229 Total 0.07 0.69 1.19 0.23 Ho, observed heterozygosity; Fis, inbreeding coefficient; Pi, average nucleotide diversity. Table 2.
Genetic diversity analysis of 329 tea germplasm resources.
-
SNP locus Gene ID Functional annotation S8_104392830 TEA026827.1 This gene encodes an ABC transporter that mediates transmembrane transport and is involved in flavonoid sequestration into vacuoles. S13_43497176 TEA019082.1 This gene encodes a catecholamine-responsive transmembrane electron transporter that regulates physiological functions and signaling via electron transfer. S3_133542716 TEA007496.1 This gene encodes a protein that degrades key regulators of the cell cycle, differentiation, and organ development, thereby ensuring orderly developmental progression. S4_95939387 TEA011262.1 This gene encodes a sucrose transporter that facilitates sucrose uptake from extracellular sources or storage compartments for cellular metabolism. S14_33134994 TEA000989.1 This gene encodes the rate-limiting enzyme in sucrose biosynthesis and serves as a pivotal regulator of carbon allocation within leaves. S7_102036877 TEA003558.1 This gene encodes a phosphoglucose isomerase that catalyzes the interconversion of G6P and F6P in glycolysis, thereby supplying phosphoenolpyruvate (PEP) as a precursor for the shikimate pathway. The shikimate pathway provides phenylalanine for phenylpropanoid and flavonoid biosynthesis. S9_67890060 TEA026236.1 This gene encodes an enzyme that channels phenylpropanoid metabolism towards lignin biosynthesis. S6_43615287 TEA023243.1 This gene encodes a key metabolic node that regulates phenylpropanoid metabolism, including lignin and catechin biosynthesis. S3_101510193 TEA021131.1 This gene encodes a kinase that catalyzes phosphorylation reactions, providing universal precursors for chlorophyll, carotenoid, and other downstream metabolites. S7_125575552 TEA000116.1 This gene encodes a glycosyltransferase that mediates the glycosylation of phenolic compounds, including flavonoids. S4_25654704 TEA022371.1 This gene encodes an enzyme that catalyzes the synthesis of UDP-glucuronic acid, thereby competing for UDP-glucose and reducing the substrate pool available for flavonoid glycosylation. S8_69959923 TEA020506.1 This gene encodes a membrane-associated protein that is involved in flavonoid storage and biosynthesis. S5_110977386 TEA002191.1 This gene encodes a methyltransferase that converts phenolic hydroxyl groups into methoxy groups, thereby participating in the methylation modification of flavonoids. Table 3.
Candidate genes and functional annotations.
Figures
(5)
Tables
(3)