-
-
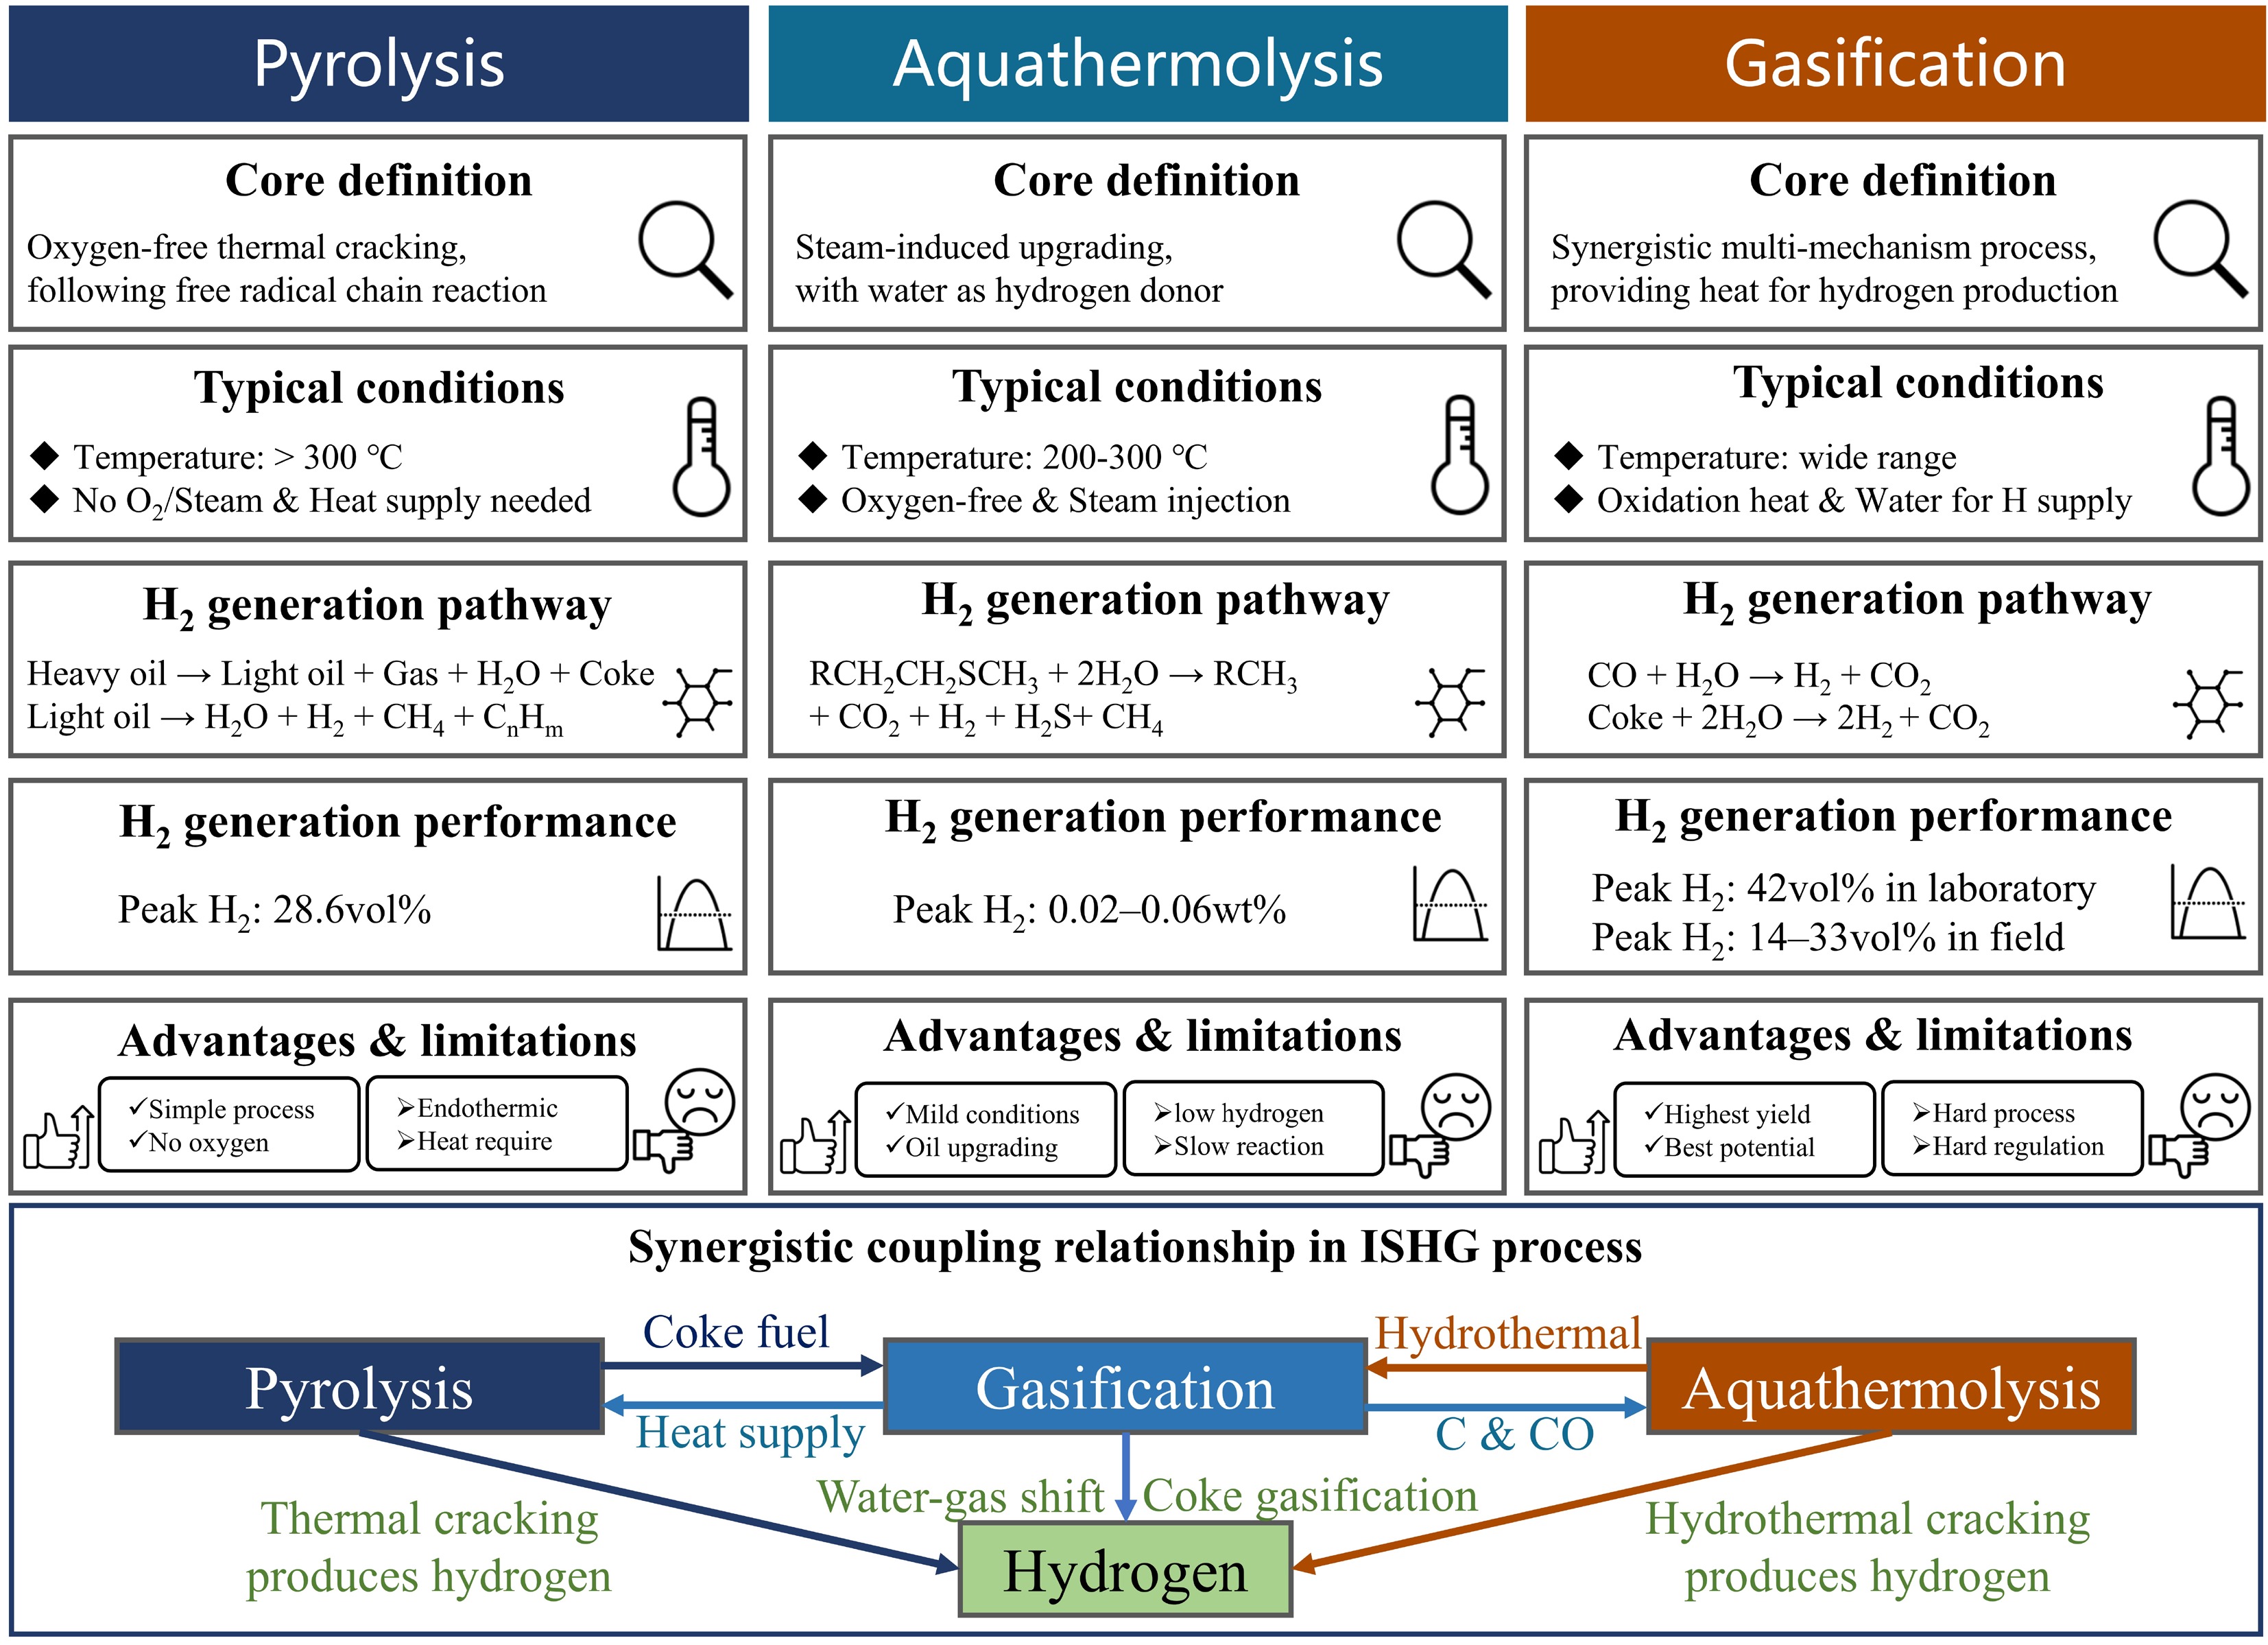
Figure 2.
The differences and connections between the three mechanisms.
-
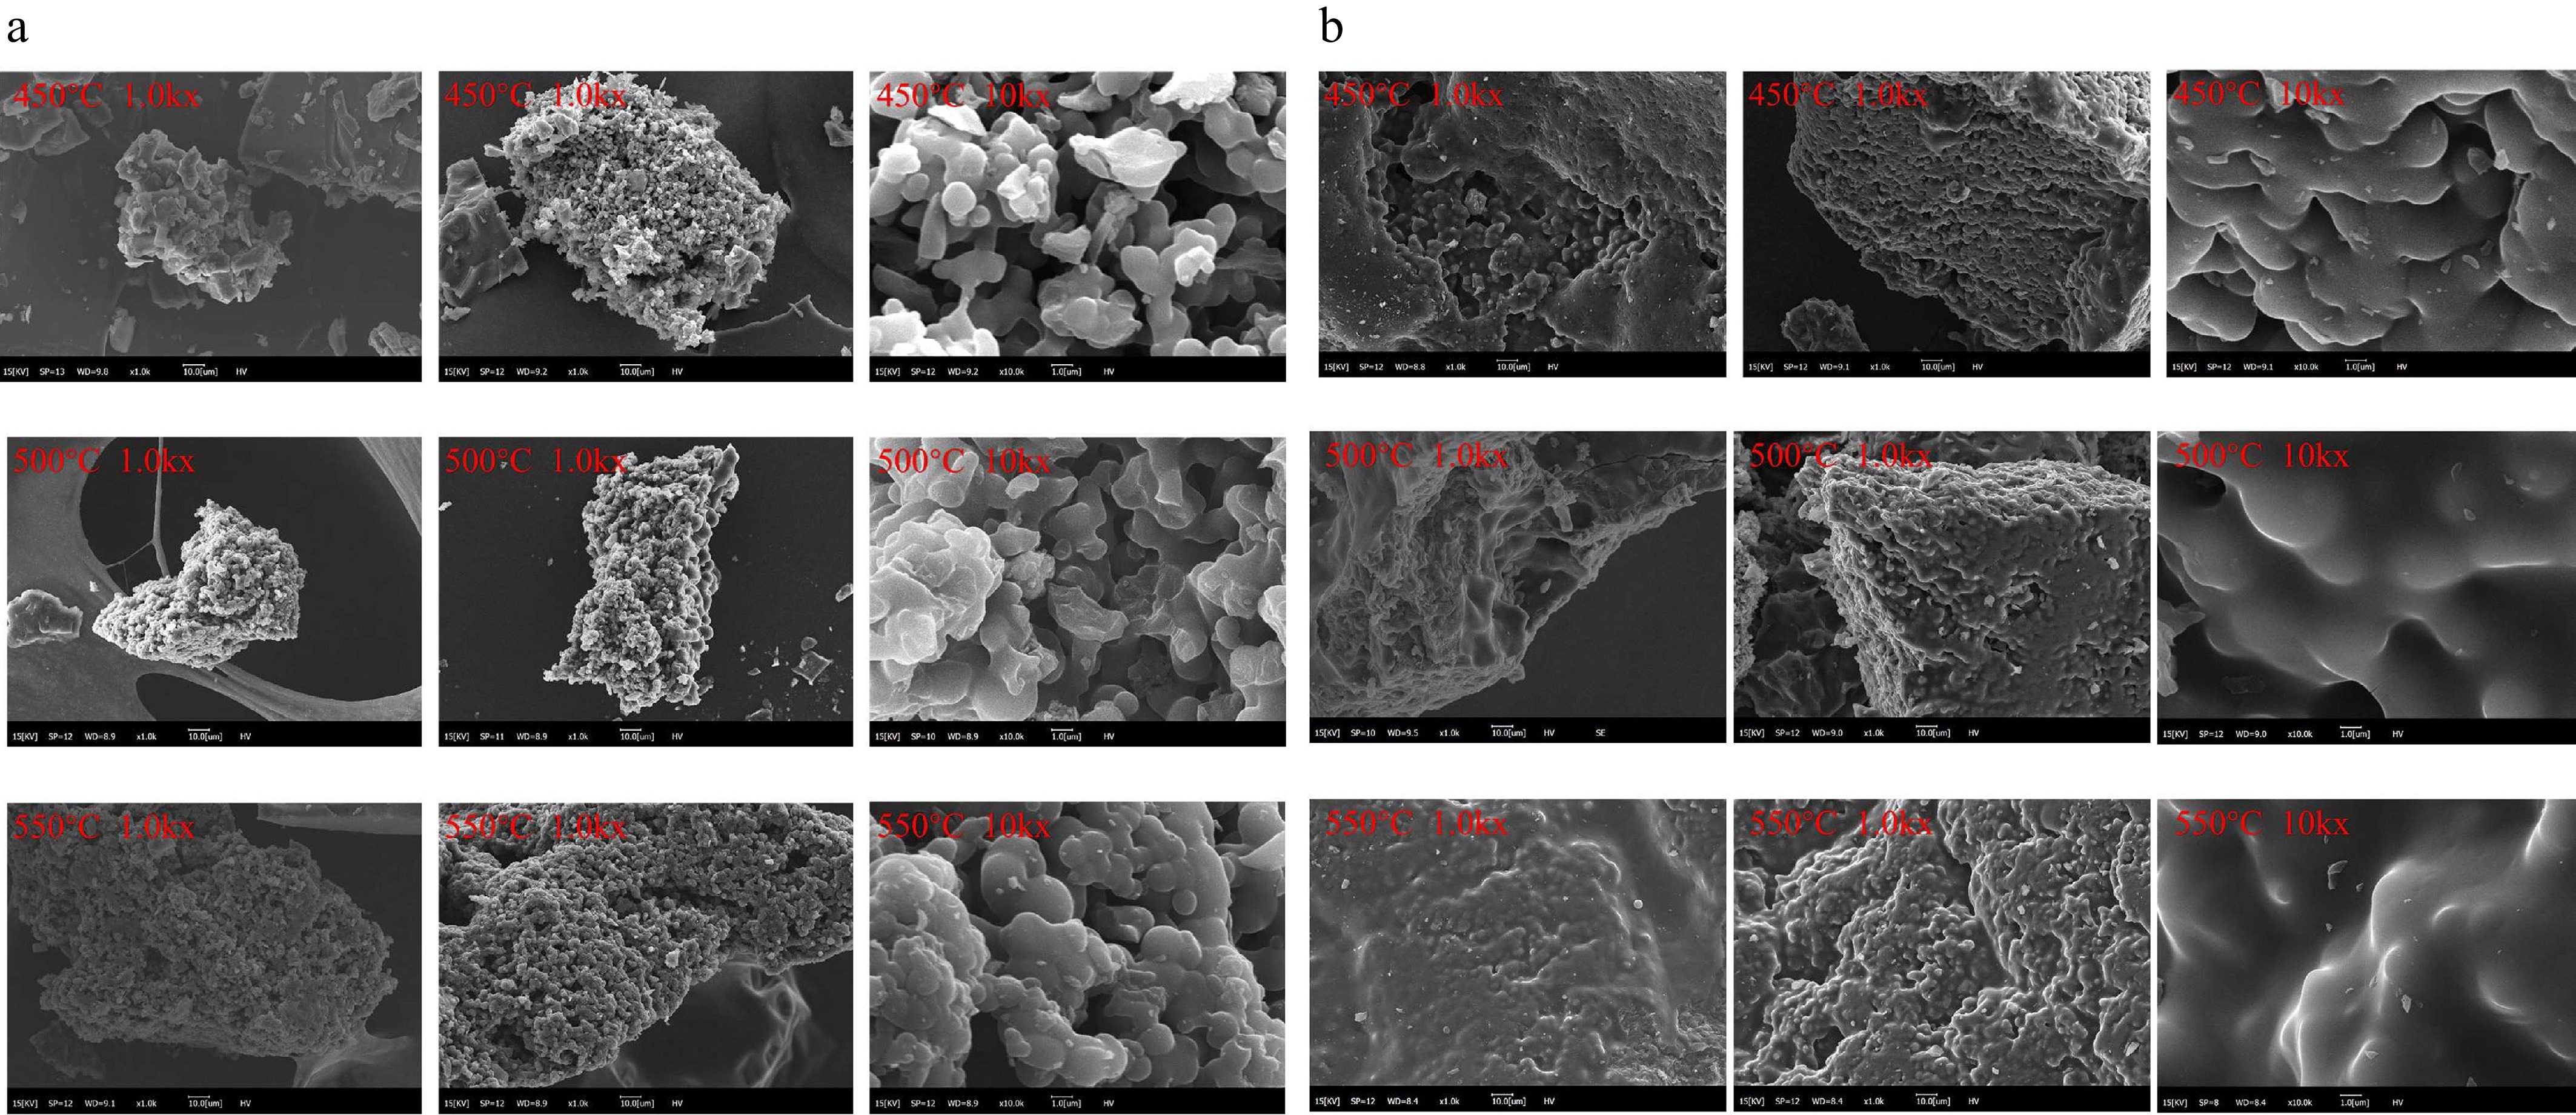
Figure 3.
SEM image of pyrolyzed coke[26] (Licence no. 6239390127009). (a) Crude oil. (b) Oxidized heavy oil.
-
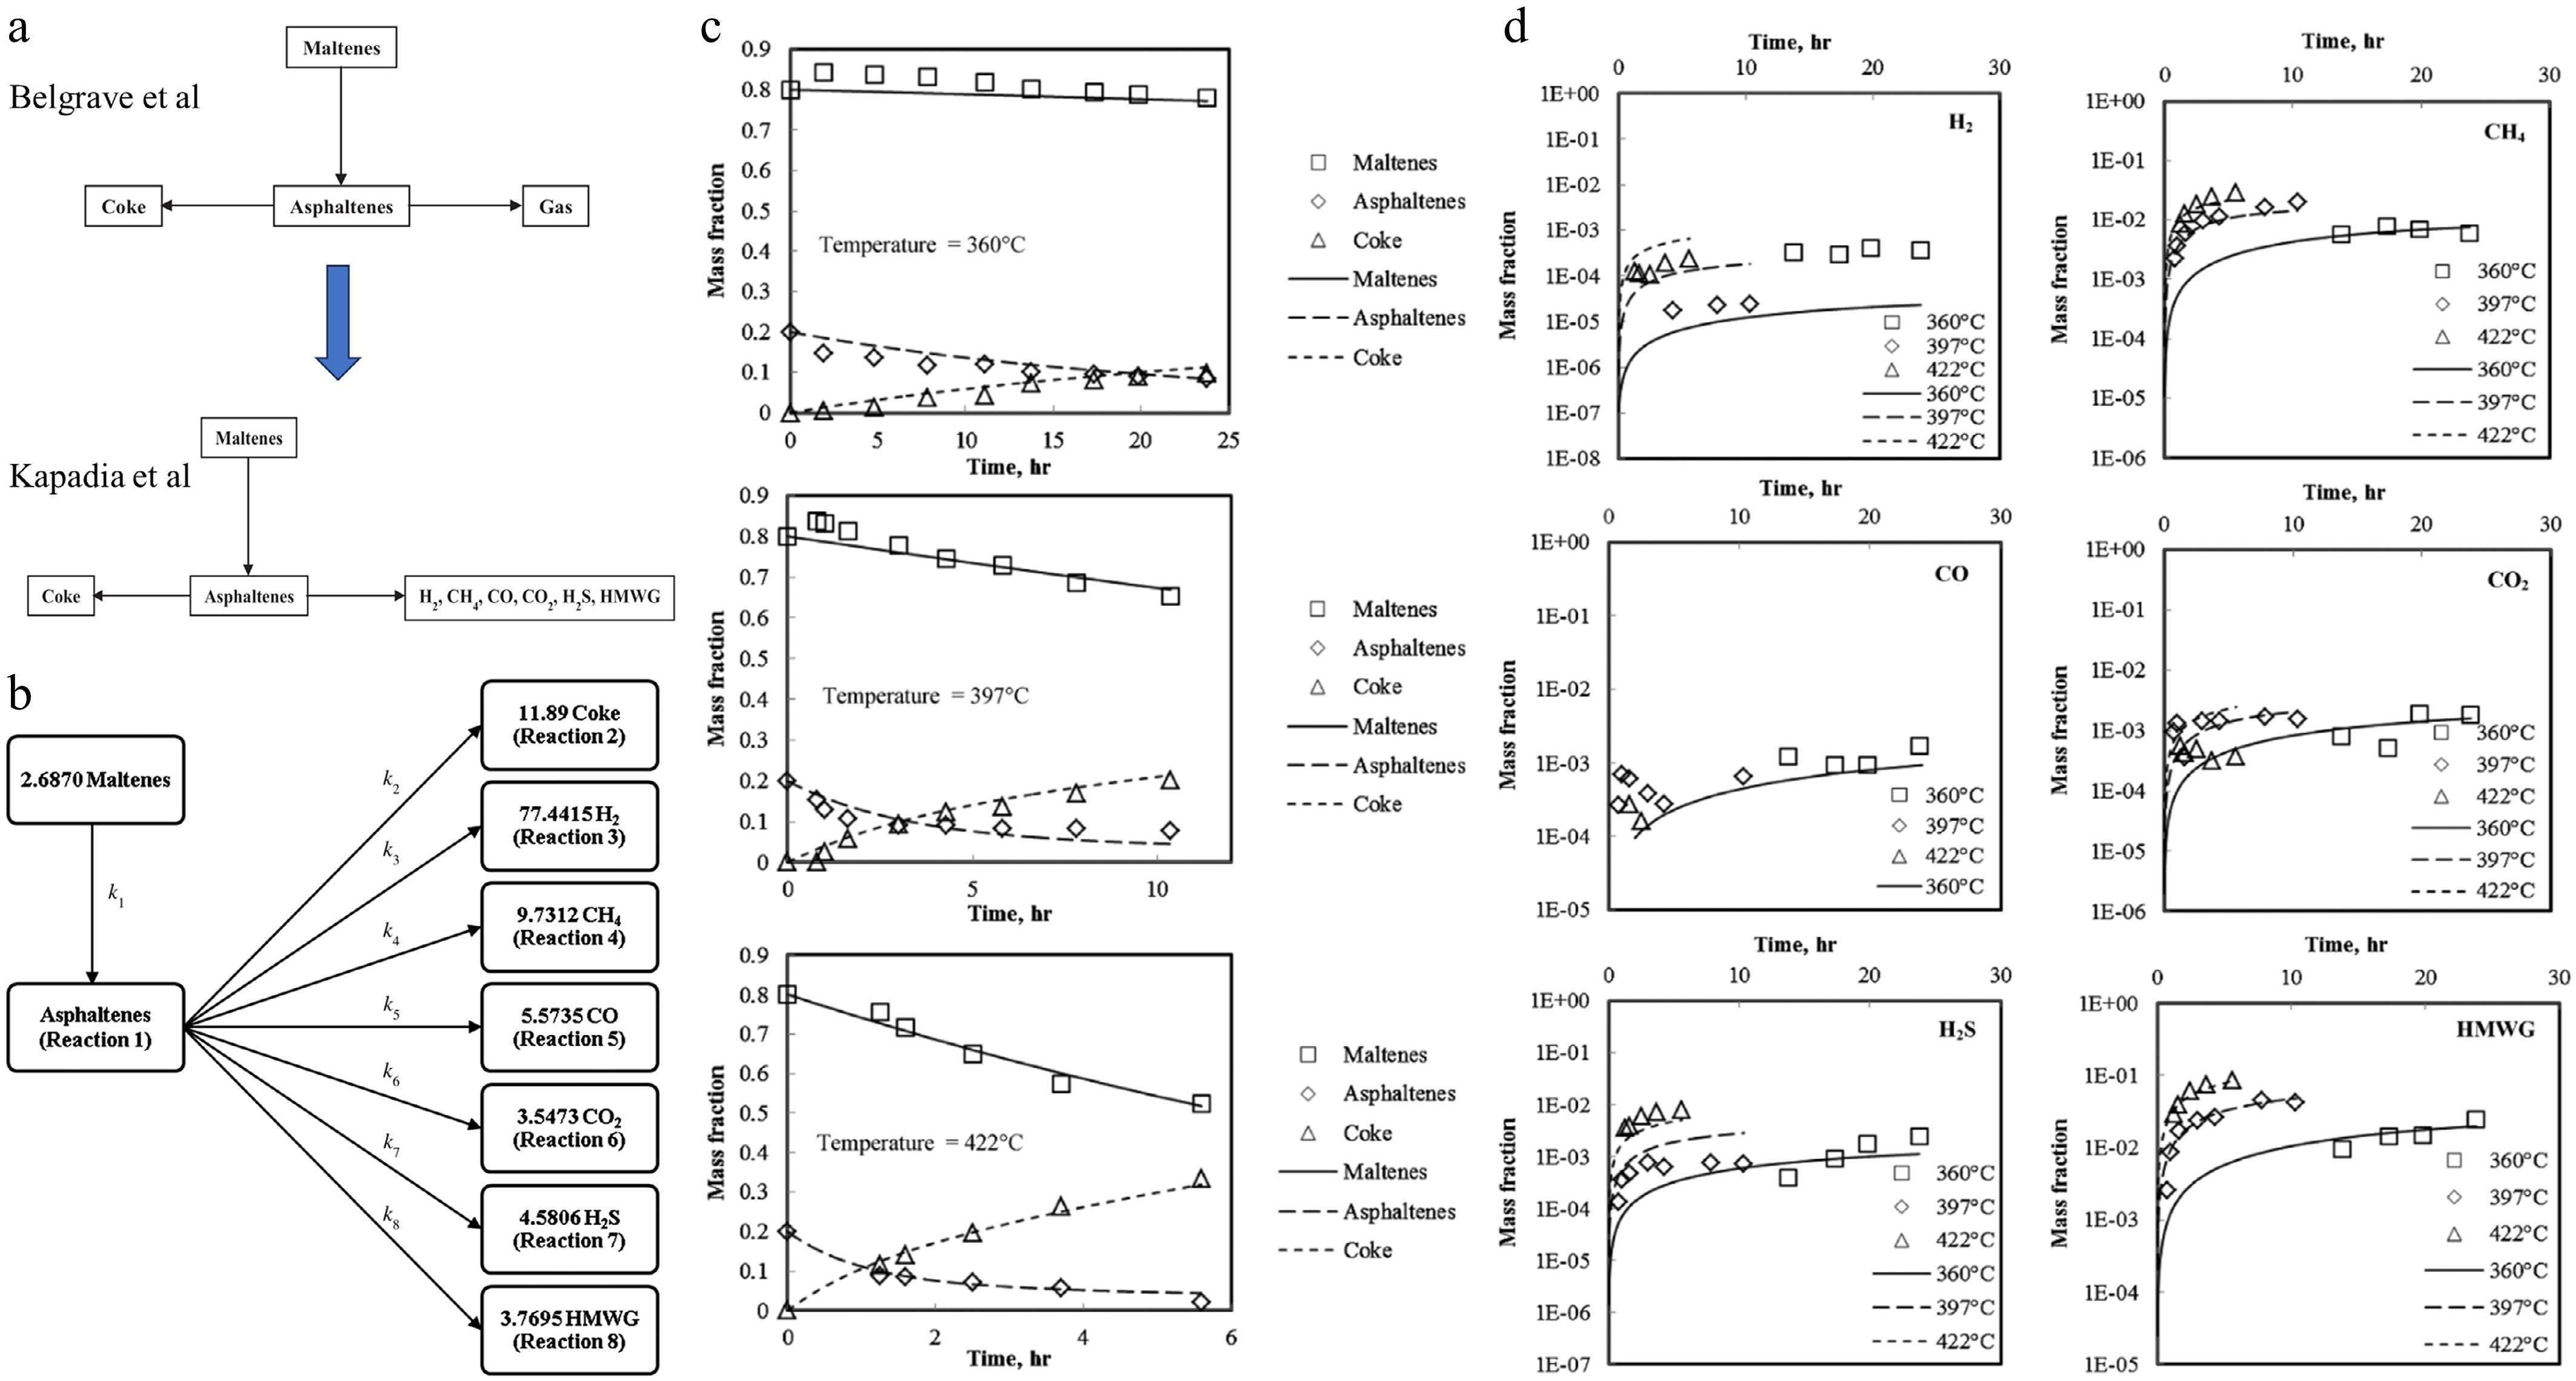
Figure 4.
Kapadia's improved bitumen pyrolysis model[35] (Licence no. 6239390397386). (a) Model improvement. (b) Pyrolysis pathway. (c) Multiphase component simulation results. (d) Gas production components.
-
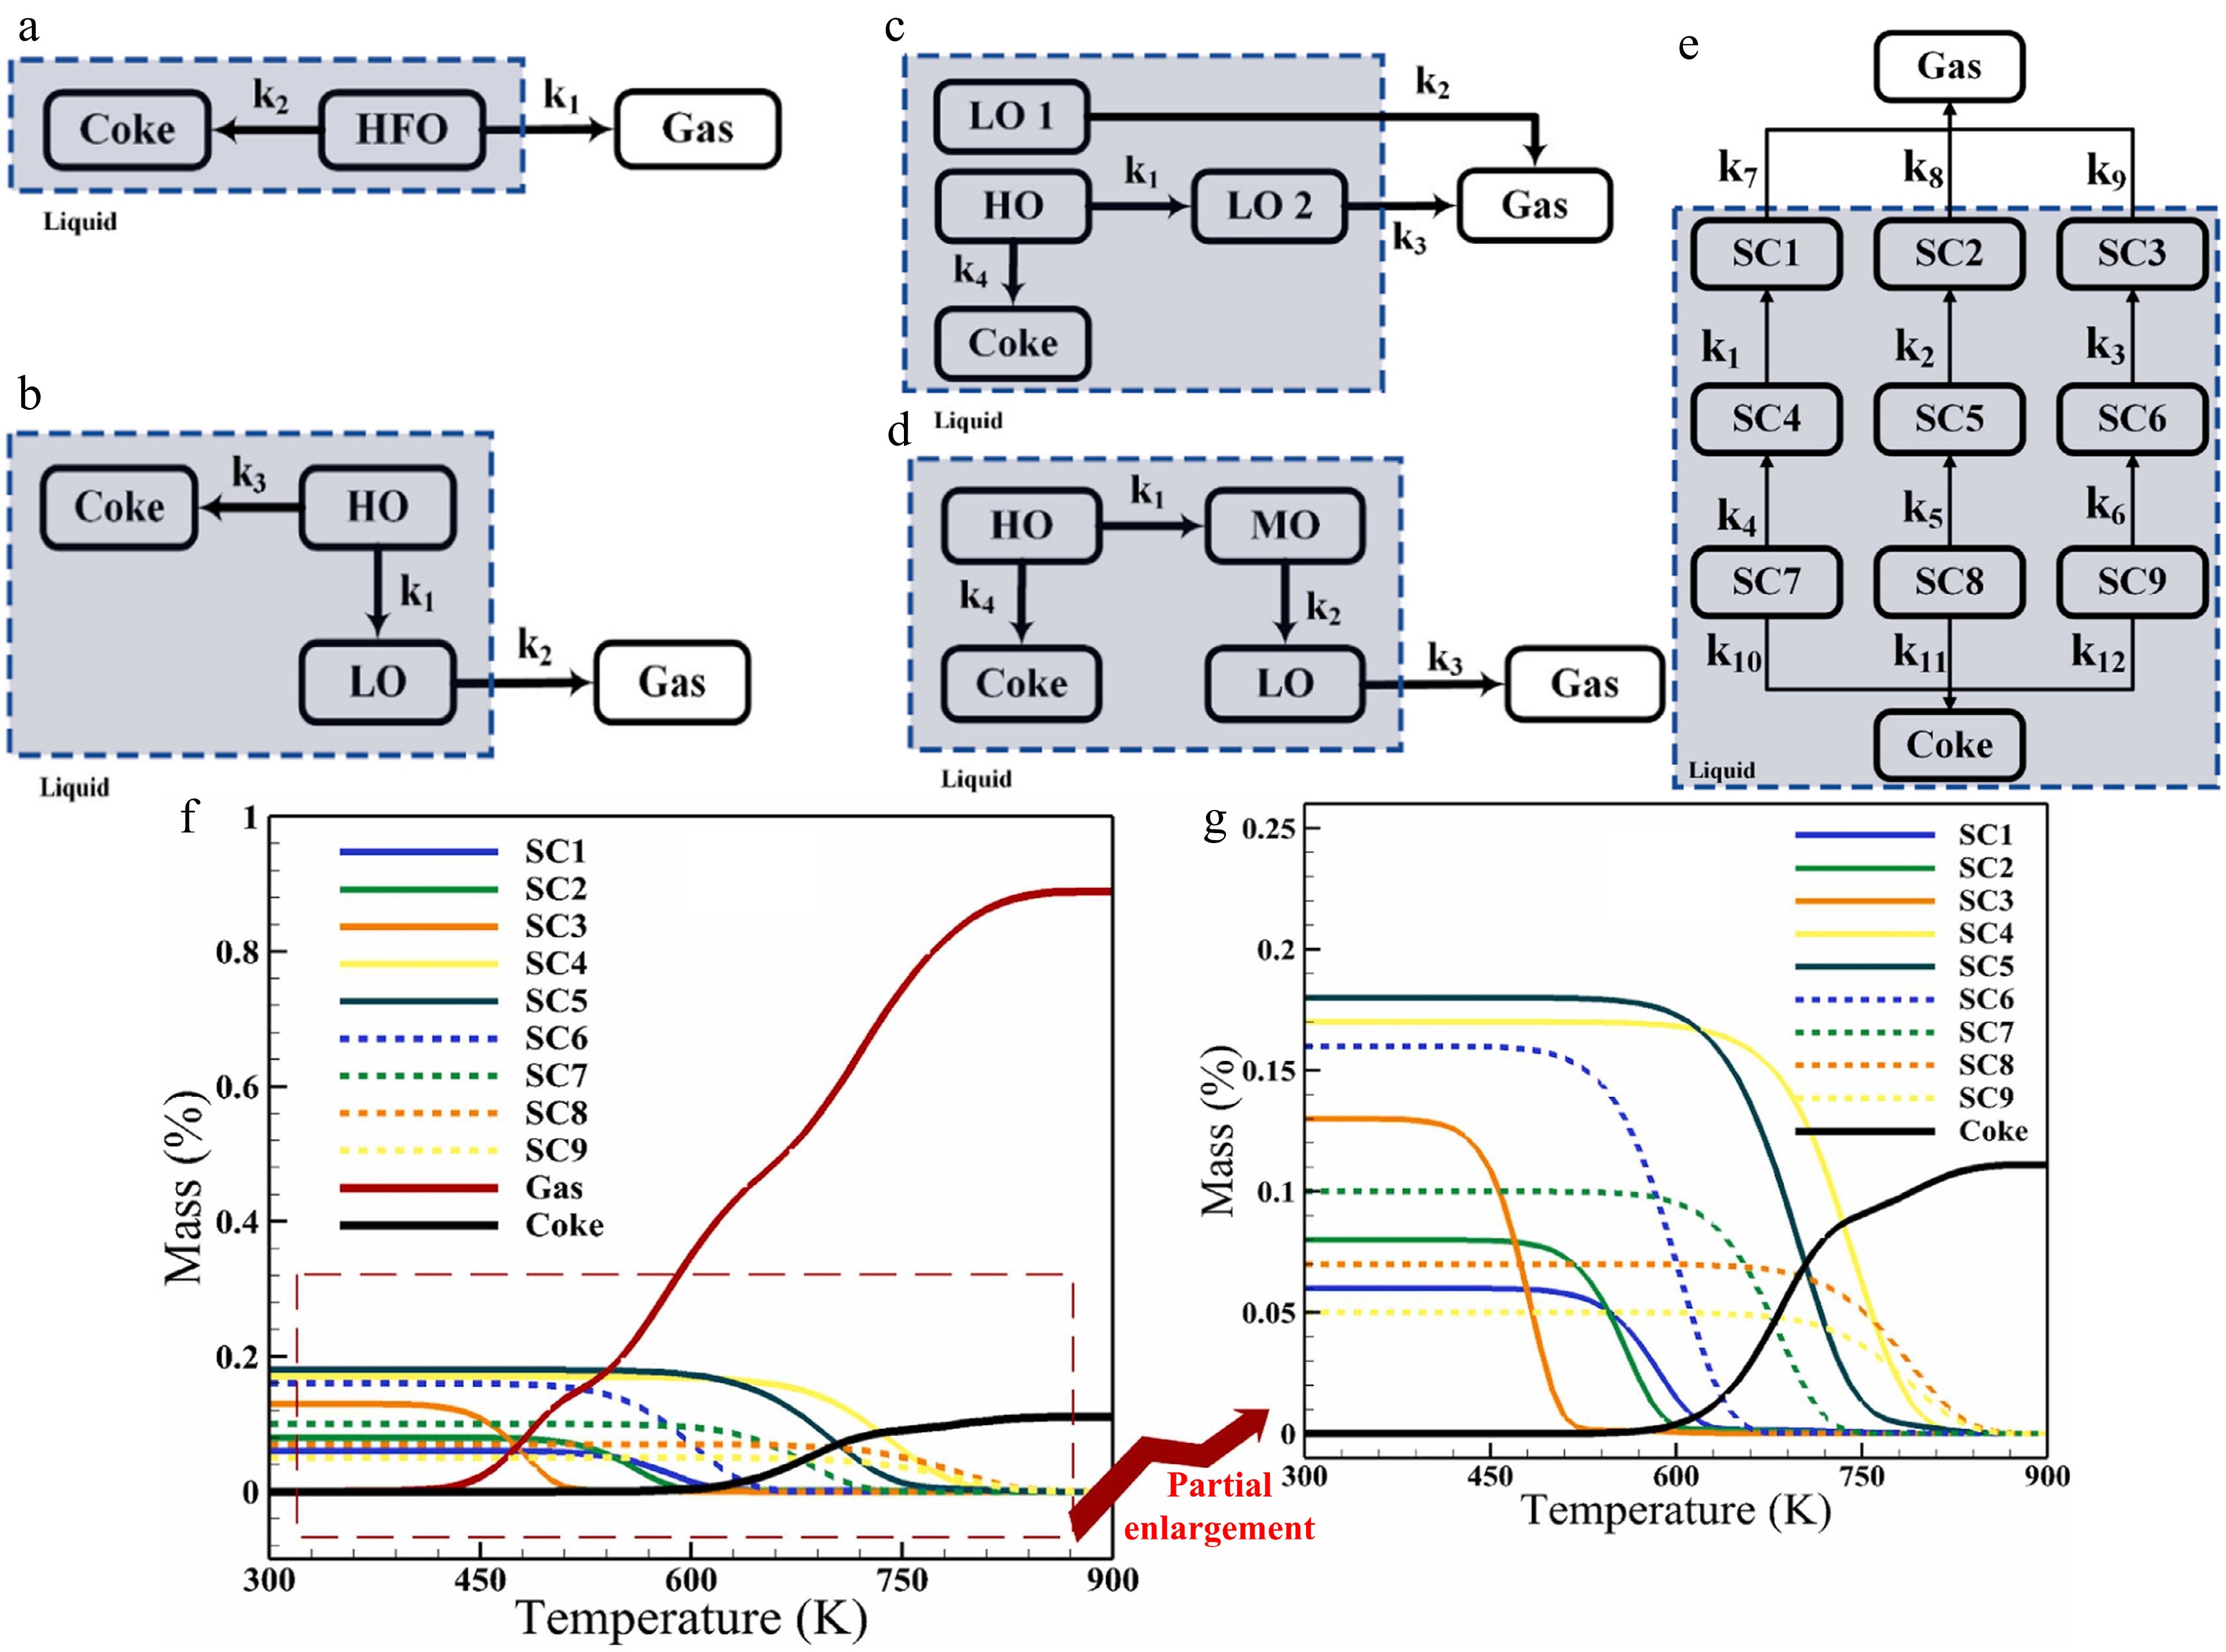
Figure 5.
Reaction kinetics model and multi-component simulation results proposed by Ganji[36] (Licence no. 6244050832583). (a) Model 1. (b) Model 2. (c) Model 3. (d) Model 4. (e) Model 5. (f) Simulation results of Model 5.
-
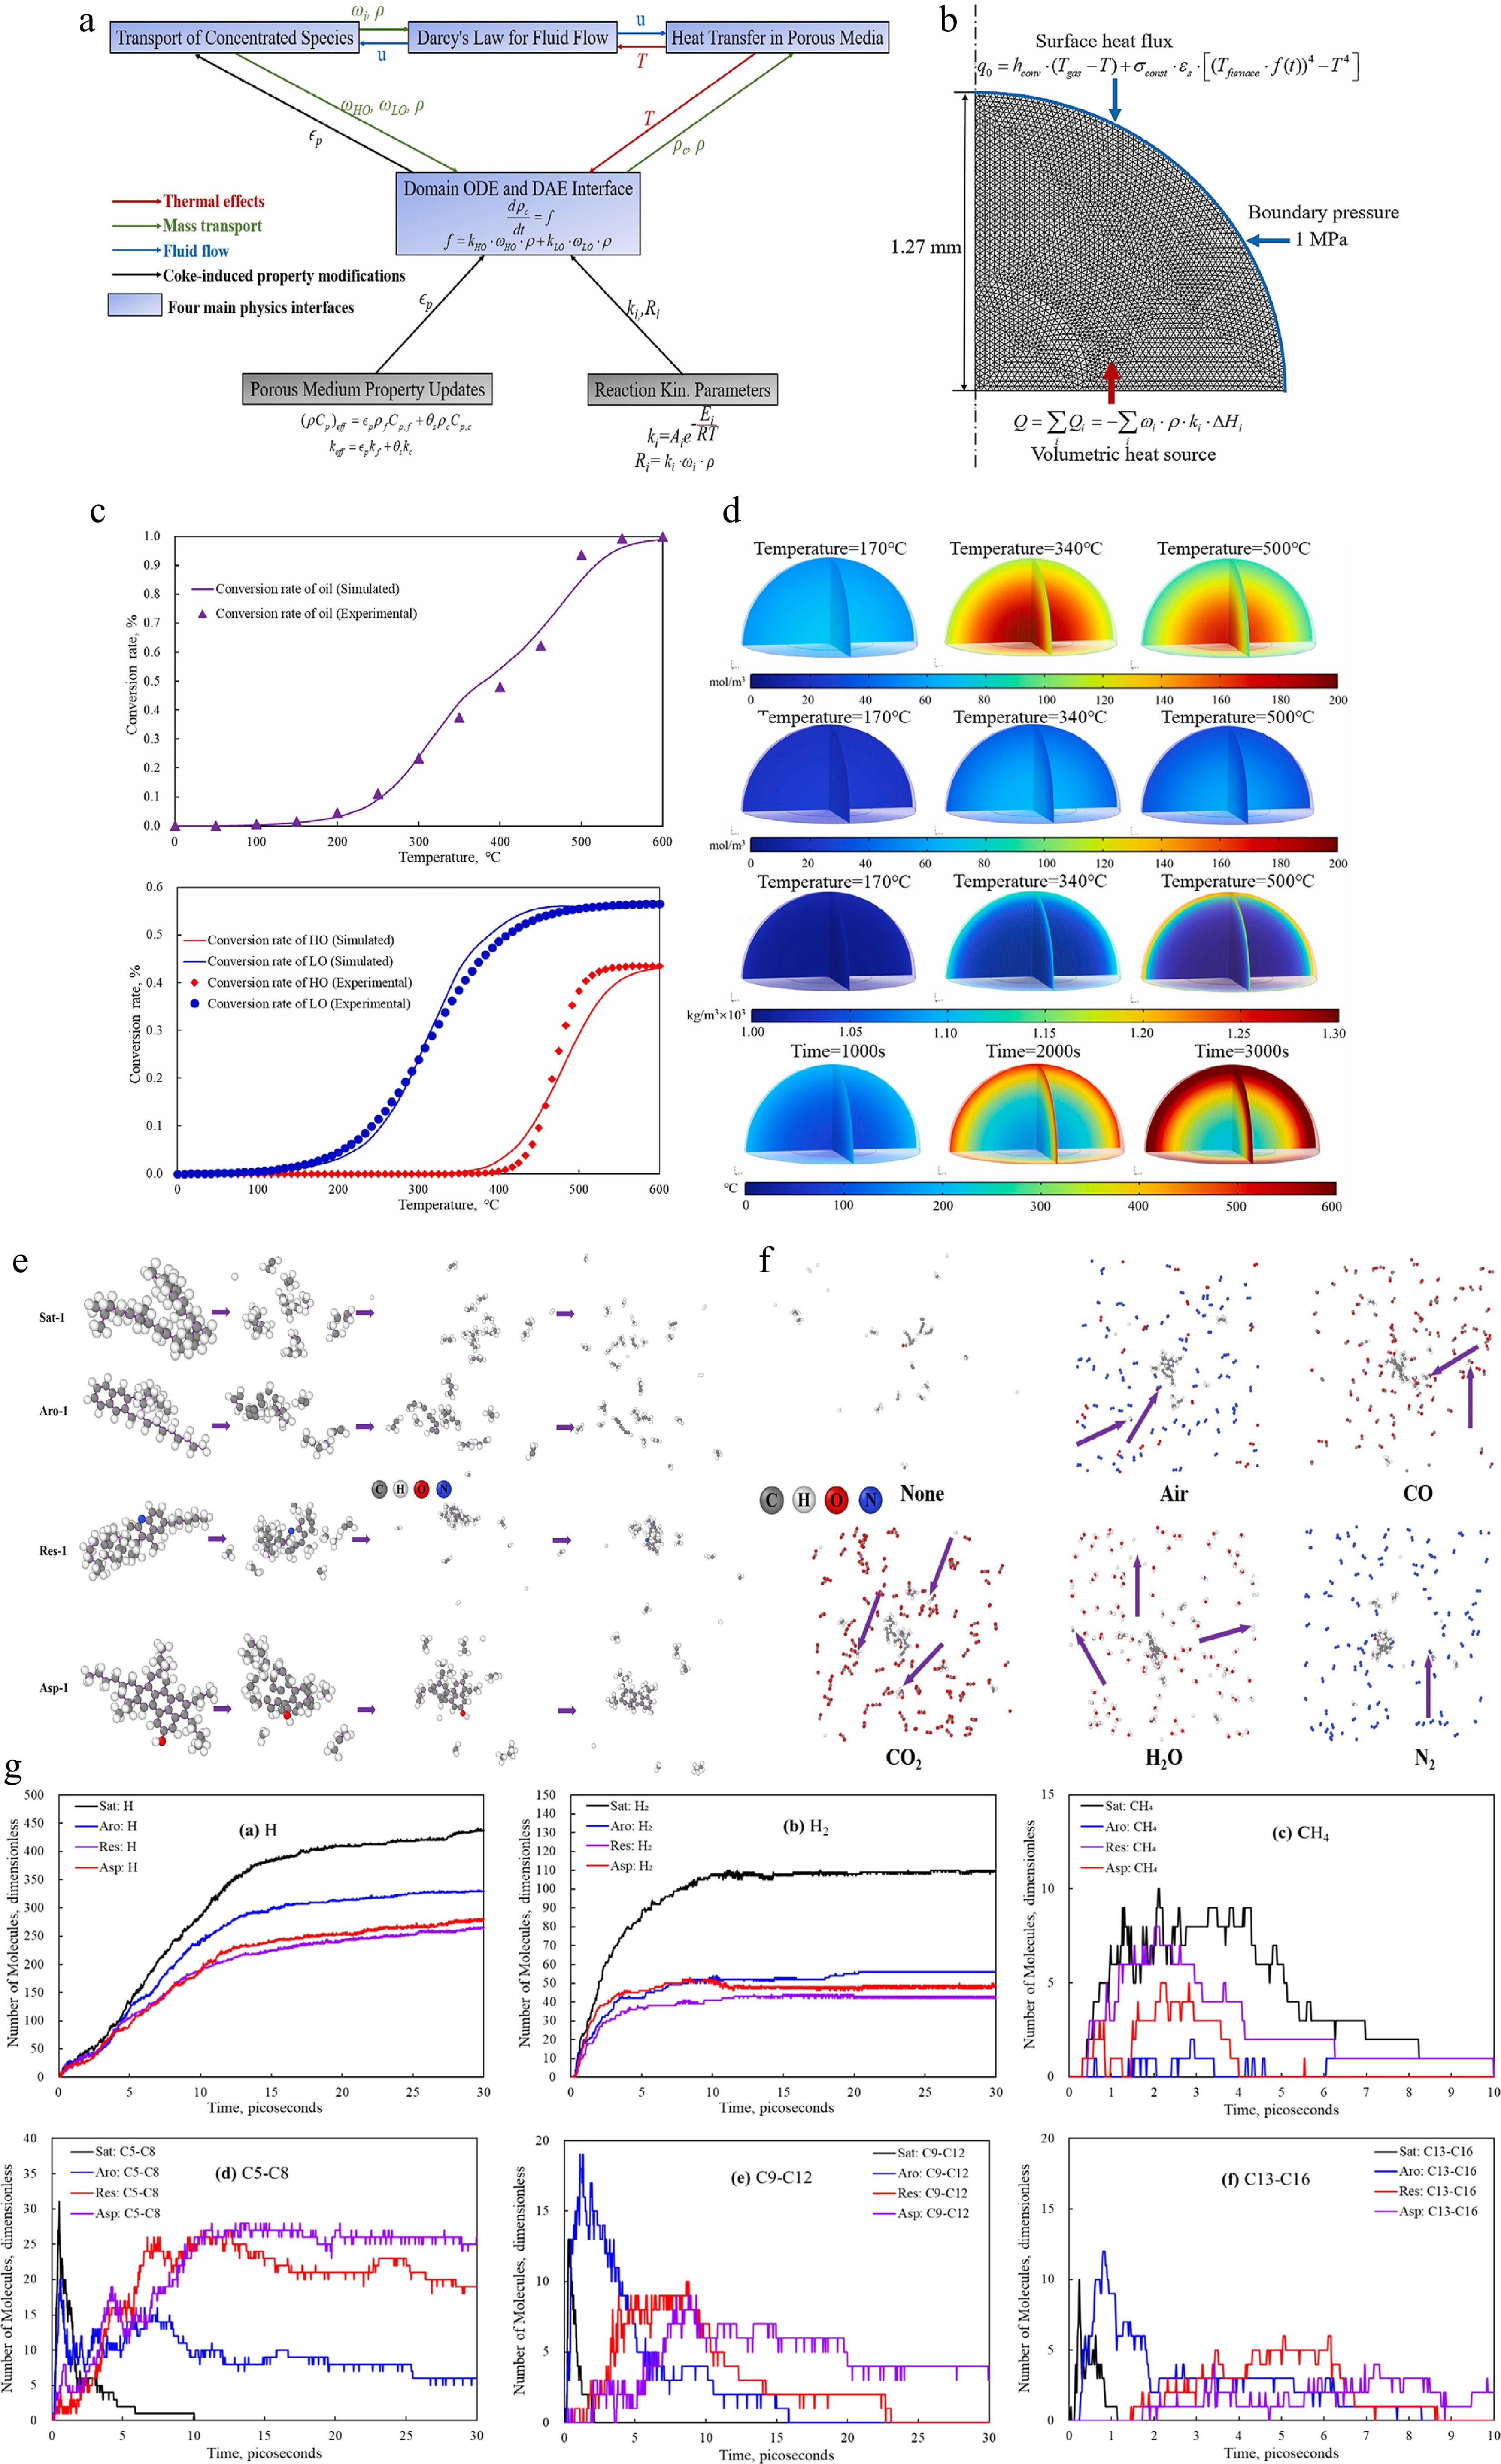
Figure 6.
Multi-field physical coupling and molecular dynamics simulation methods[28, 37] (Licence no. 6239390806160, 6244051274881). (a) Multi-field coupling framework. (b) Grid generation. (c) Fitting results. (d) 3D results. (e) Component pyrolysis. (f) Atmosphere influence. (g) Gas conversion pathway.
-
-
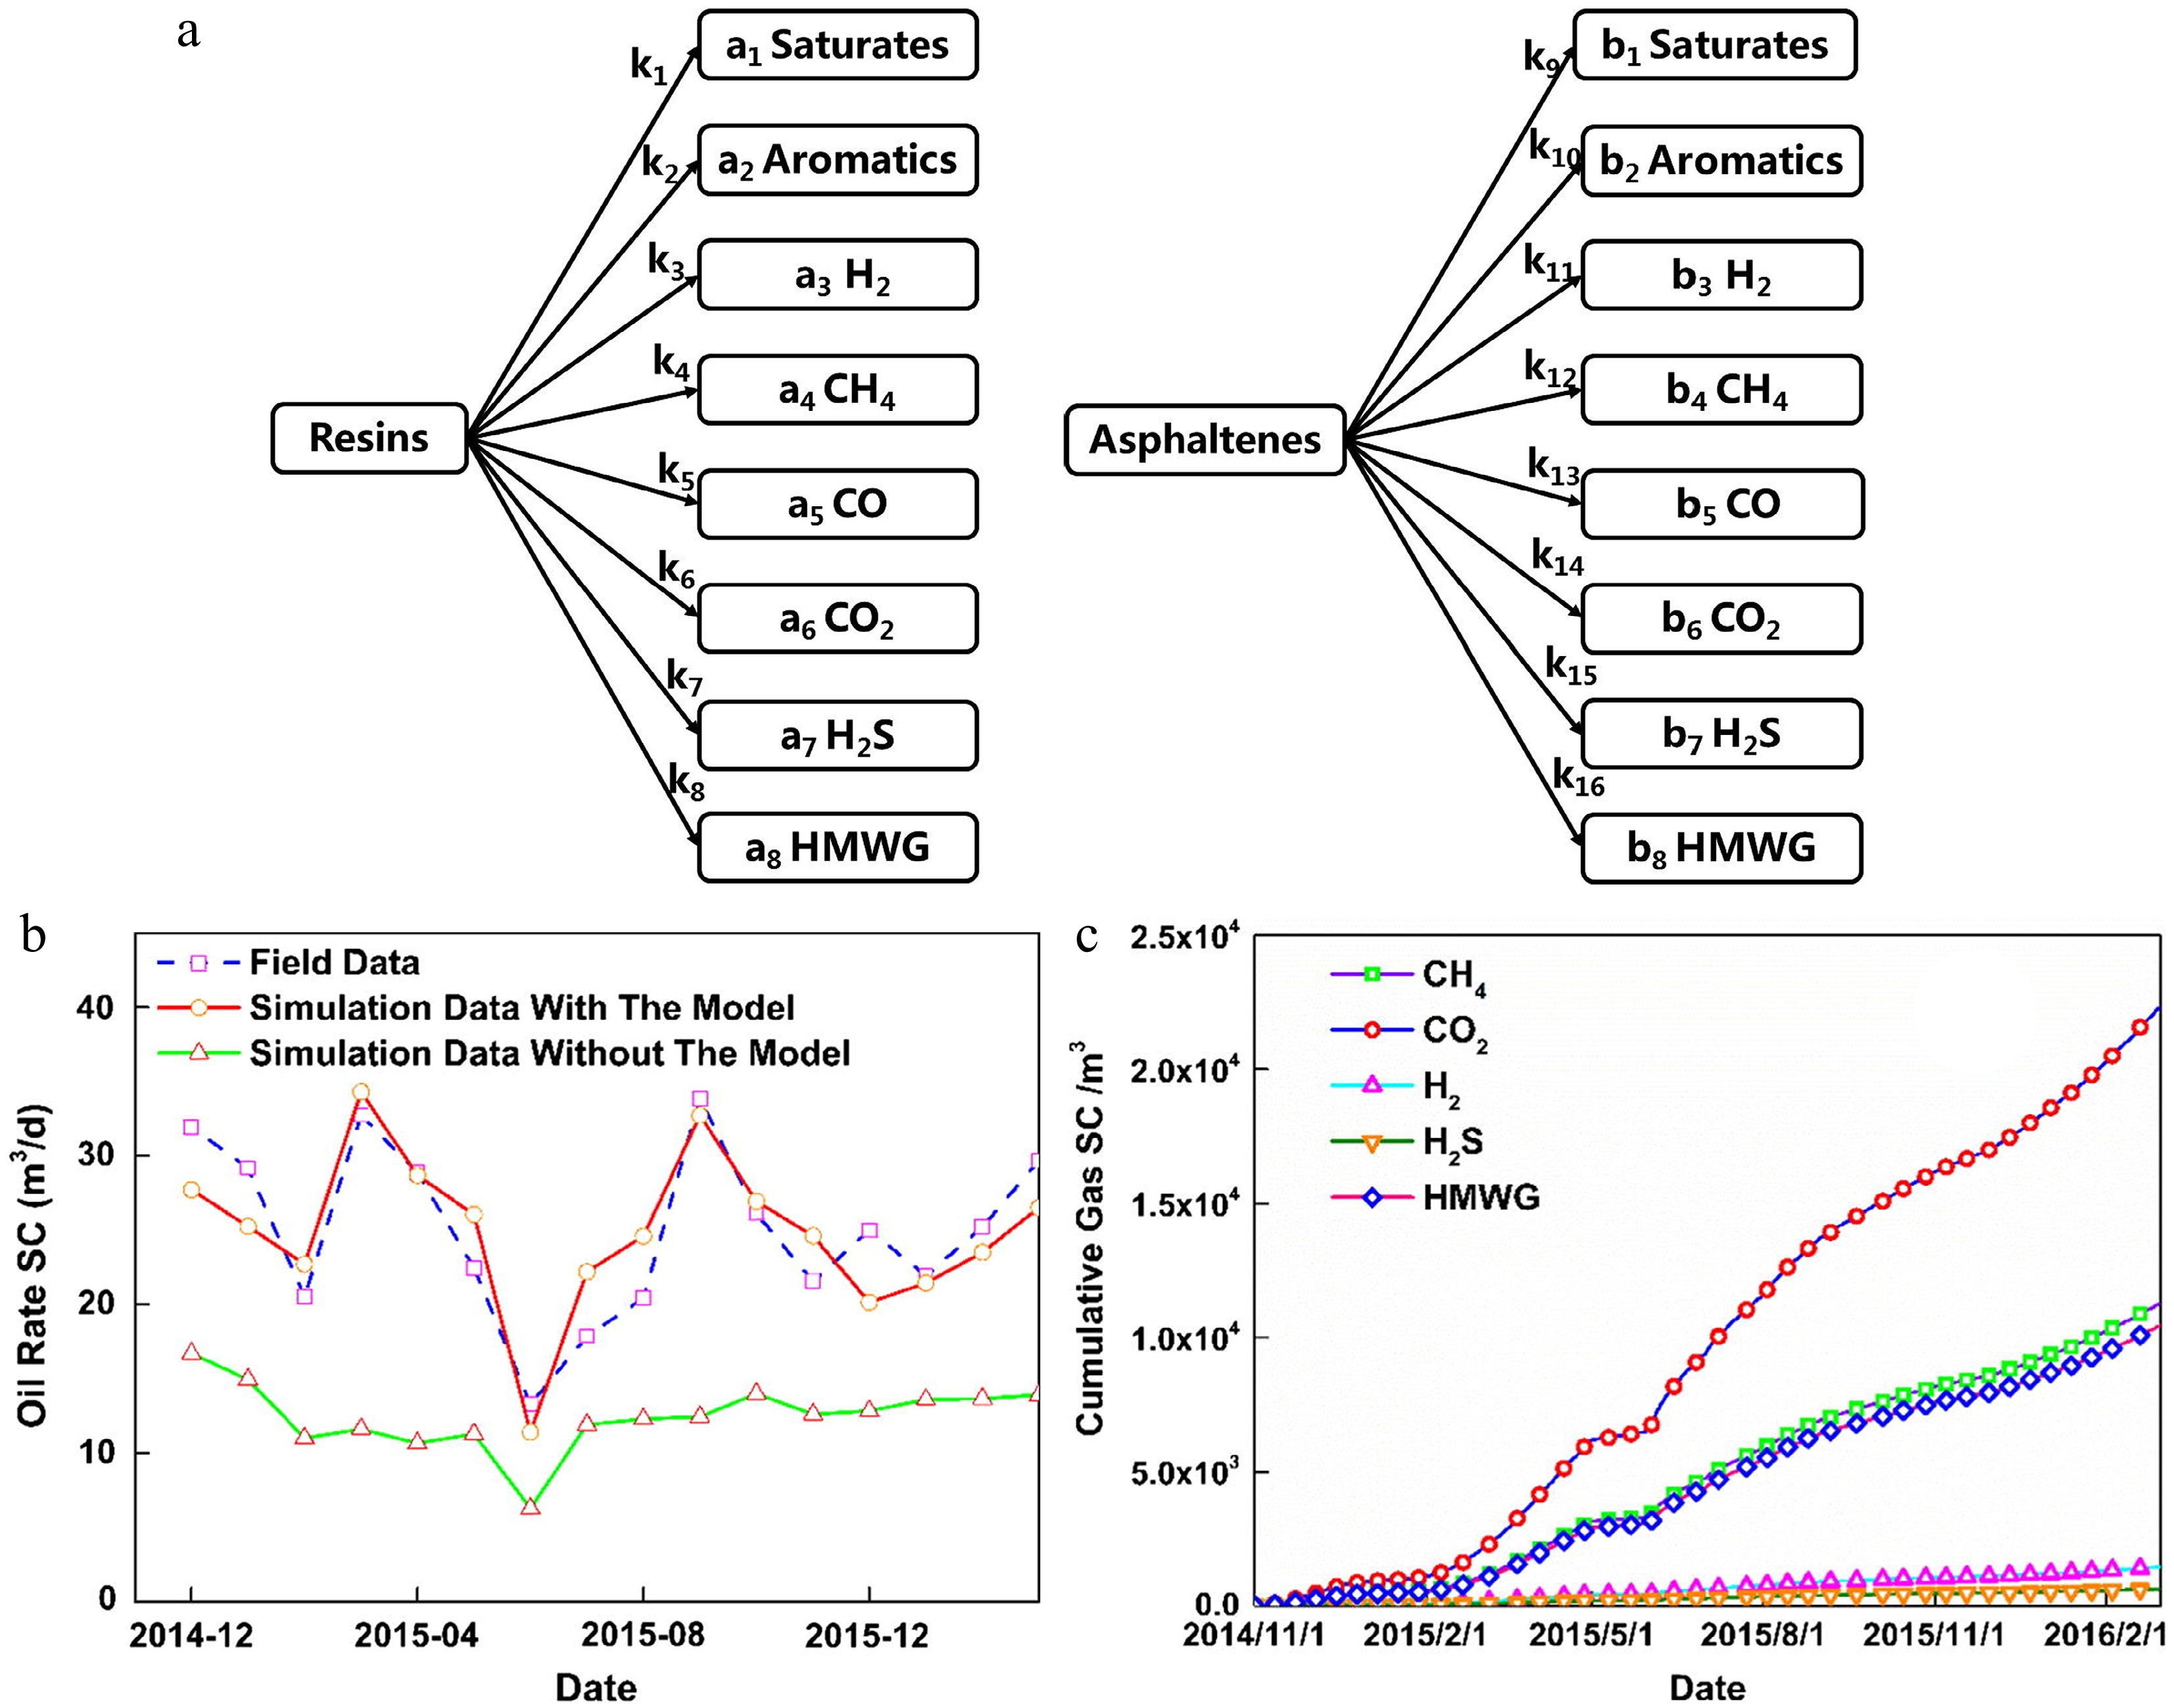
Figure 8.
The aquathermolysis model and simulation results applied to oilfield production[66] (Licence no. 6239681443442). (a) Model. (b) Fitting results. (c) Gas production results.
-
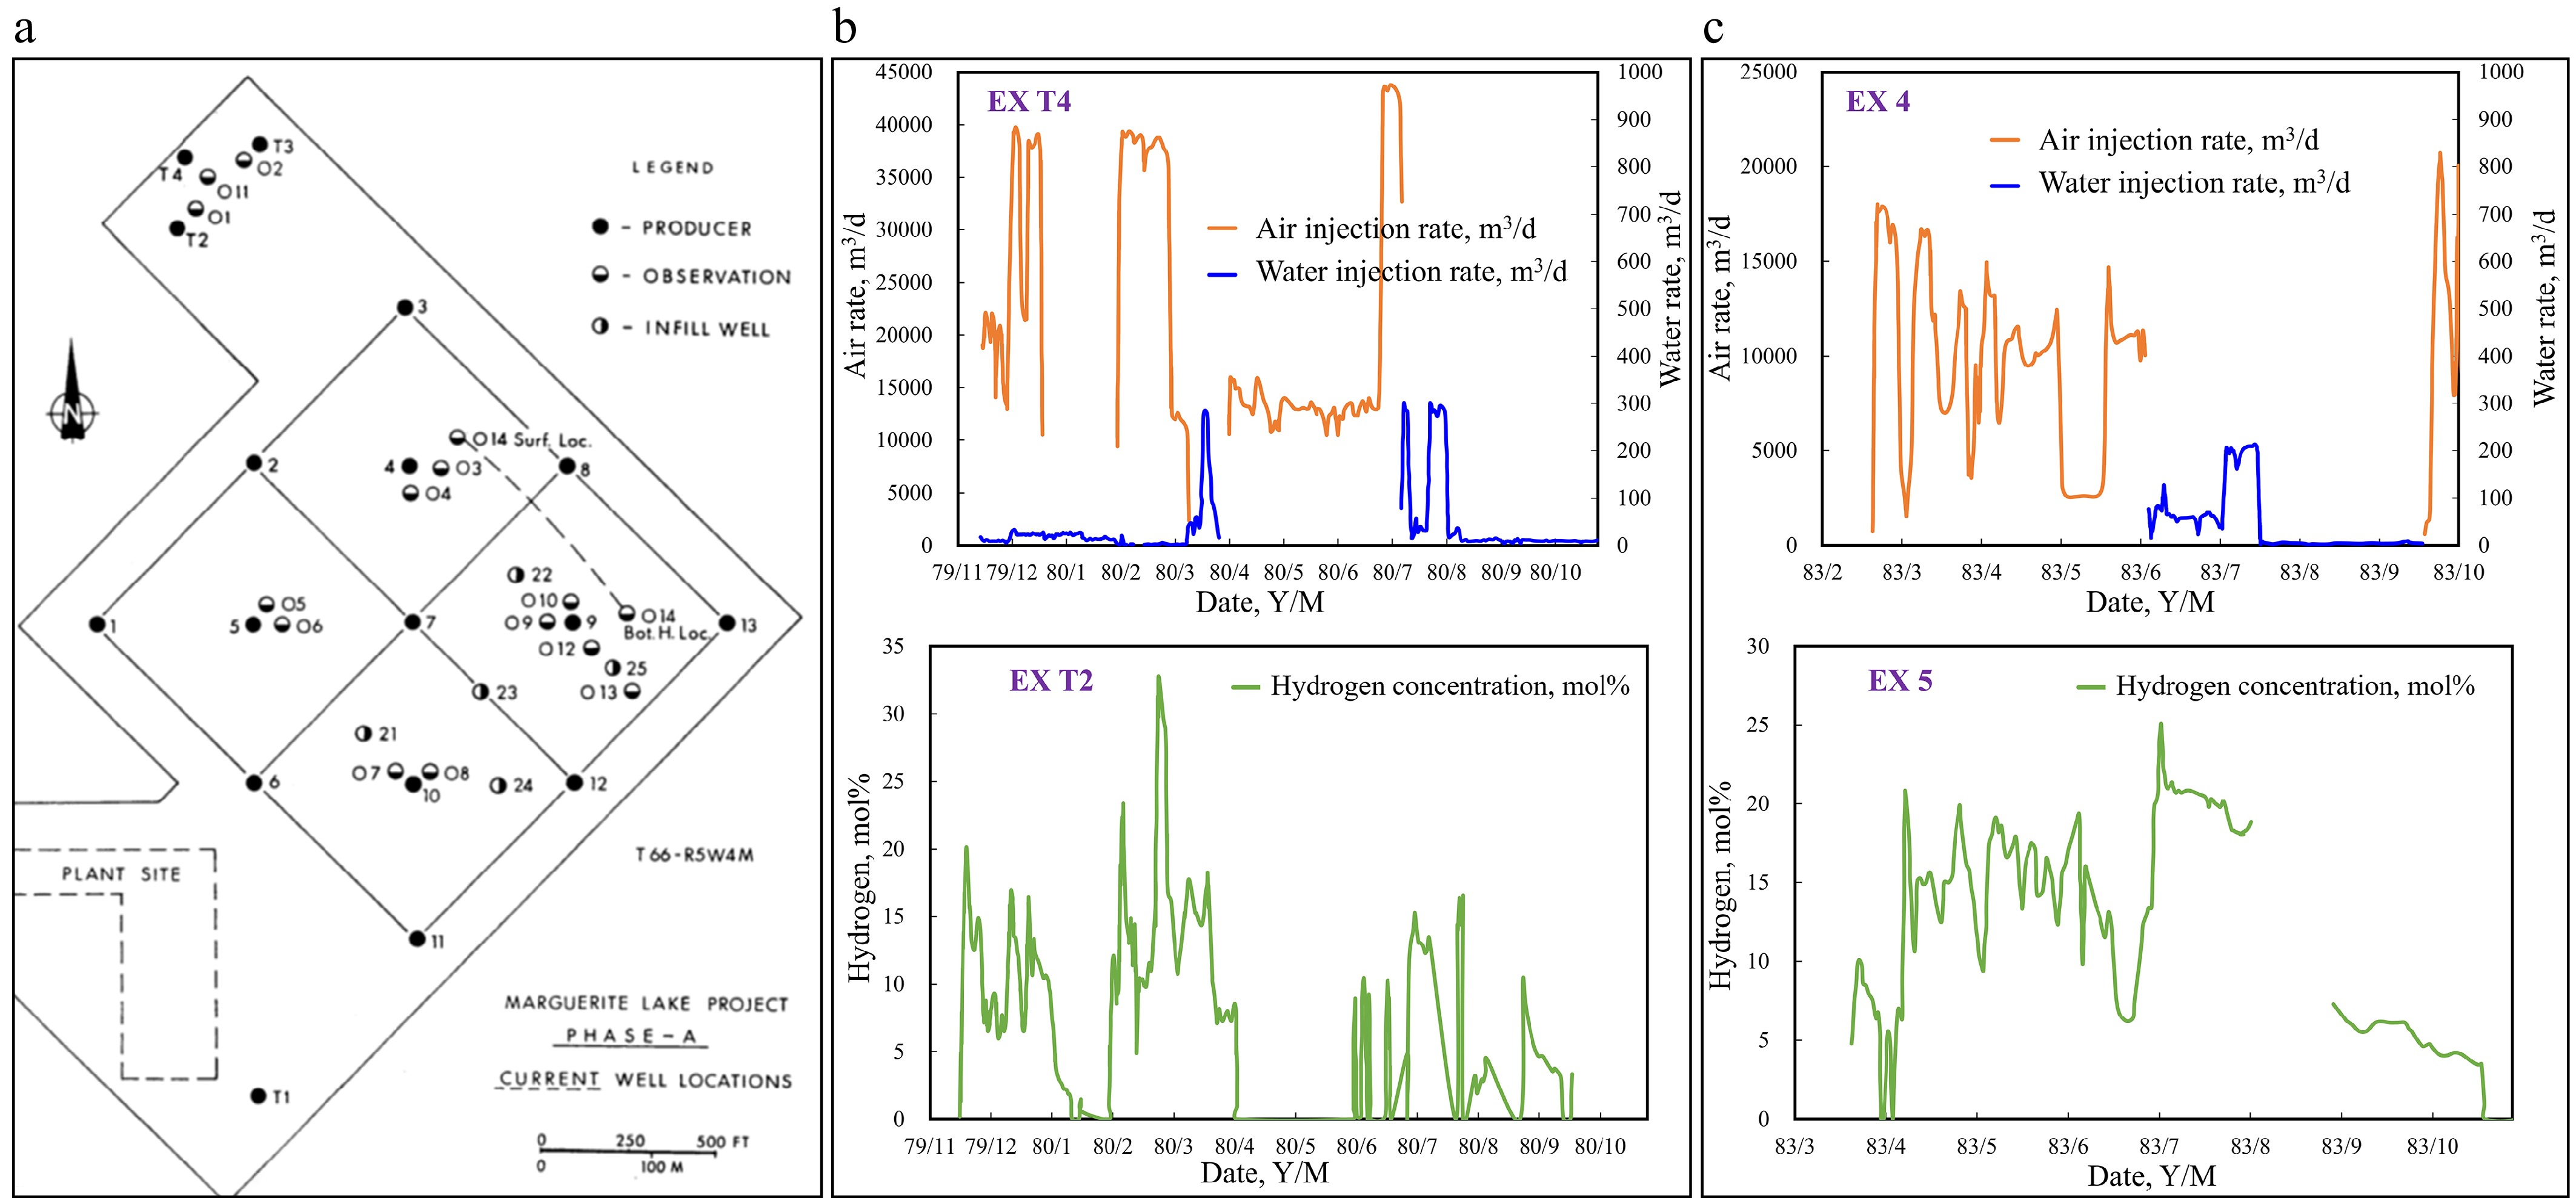
Figure 9.
The well locations, injection rate, and hydrogen concentration. (a) Well locations. (b) Hydrogen concentration of EX T4. (c) Hydrogen concentration of EX 4.
-
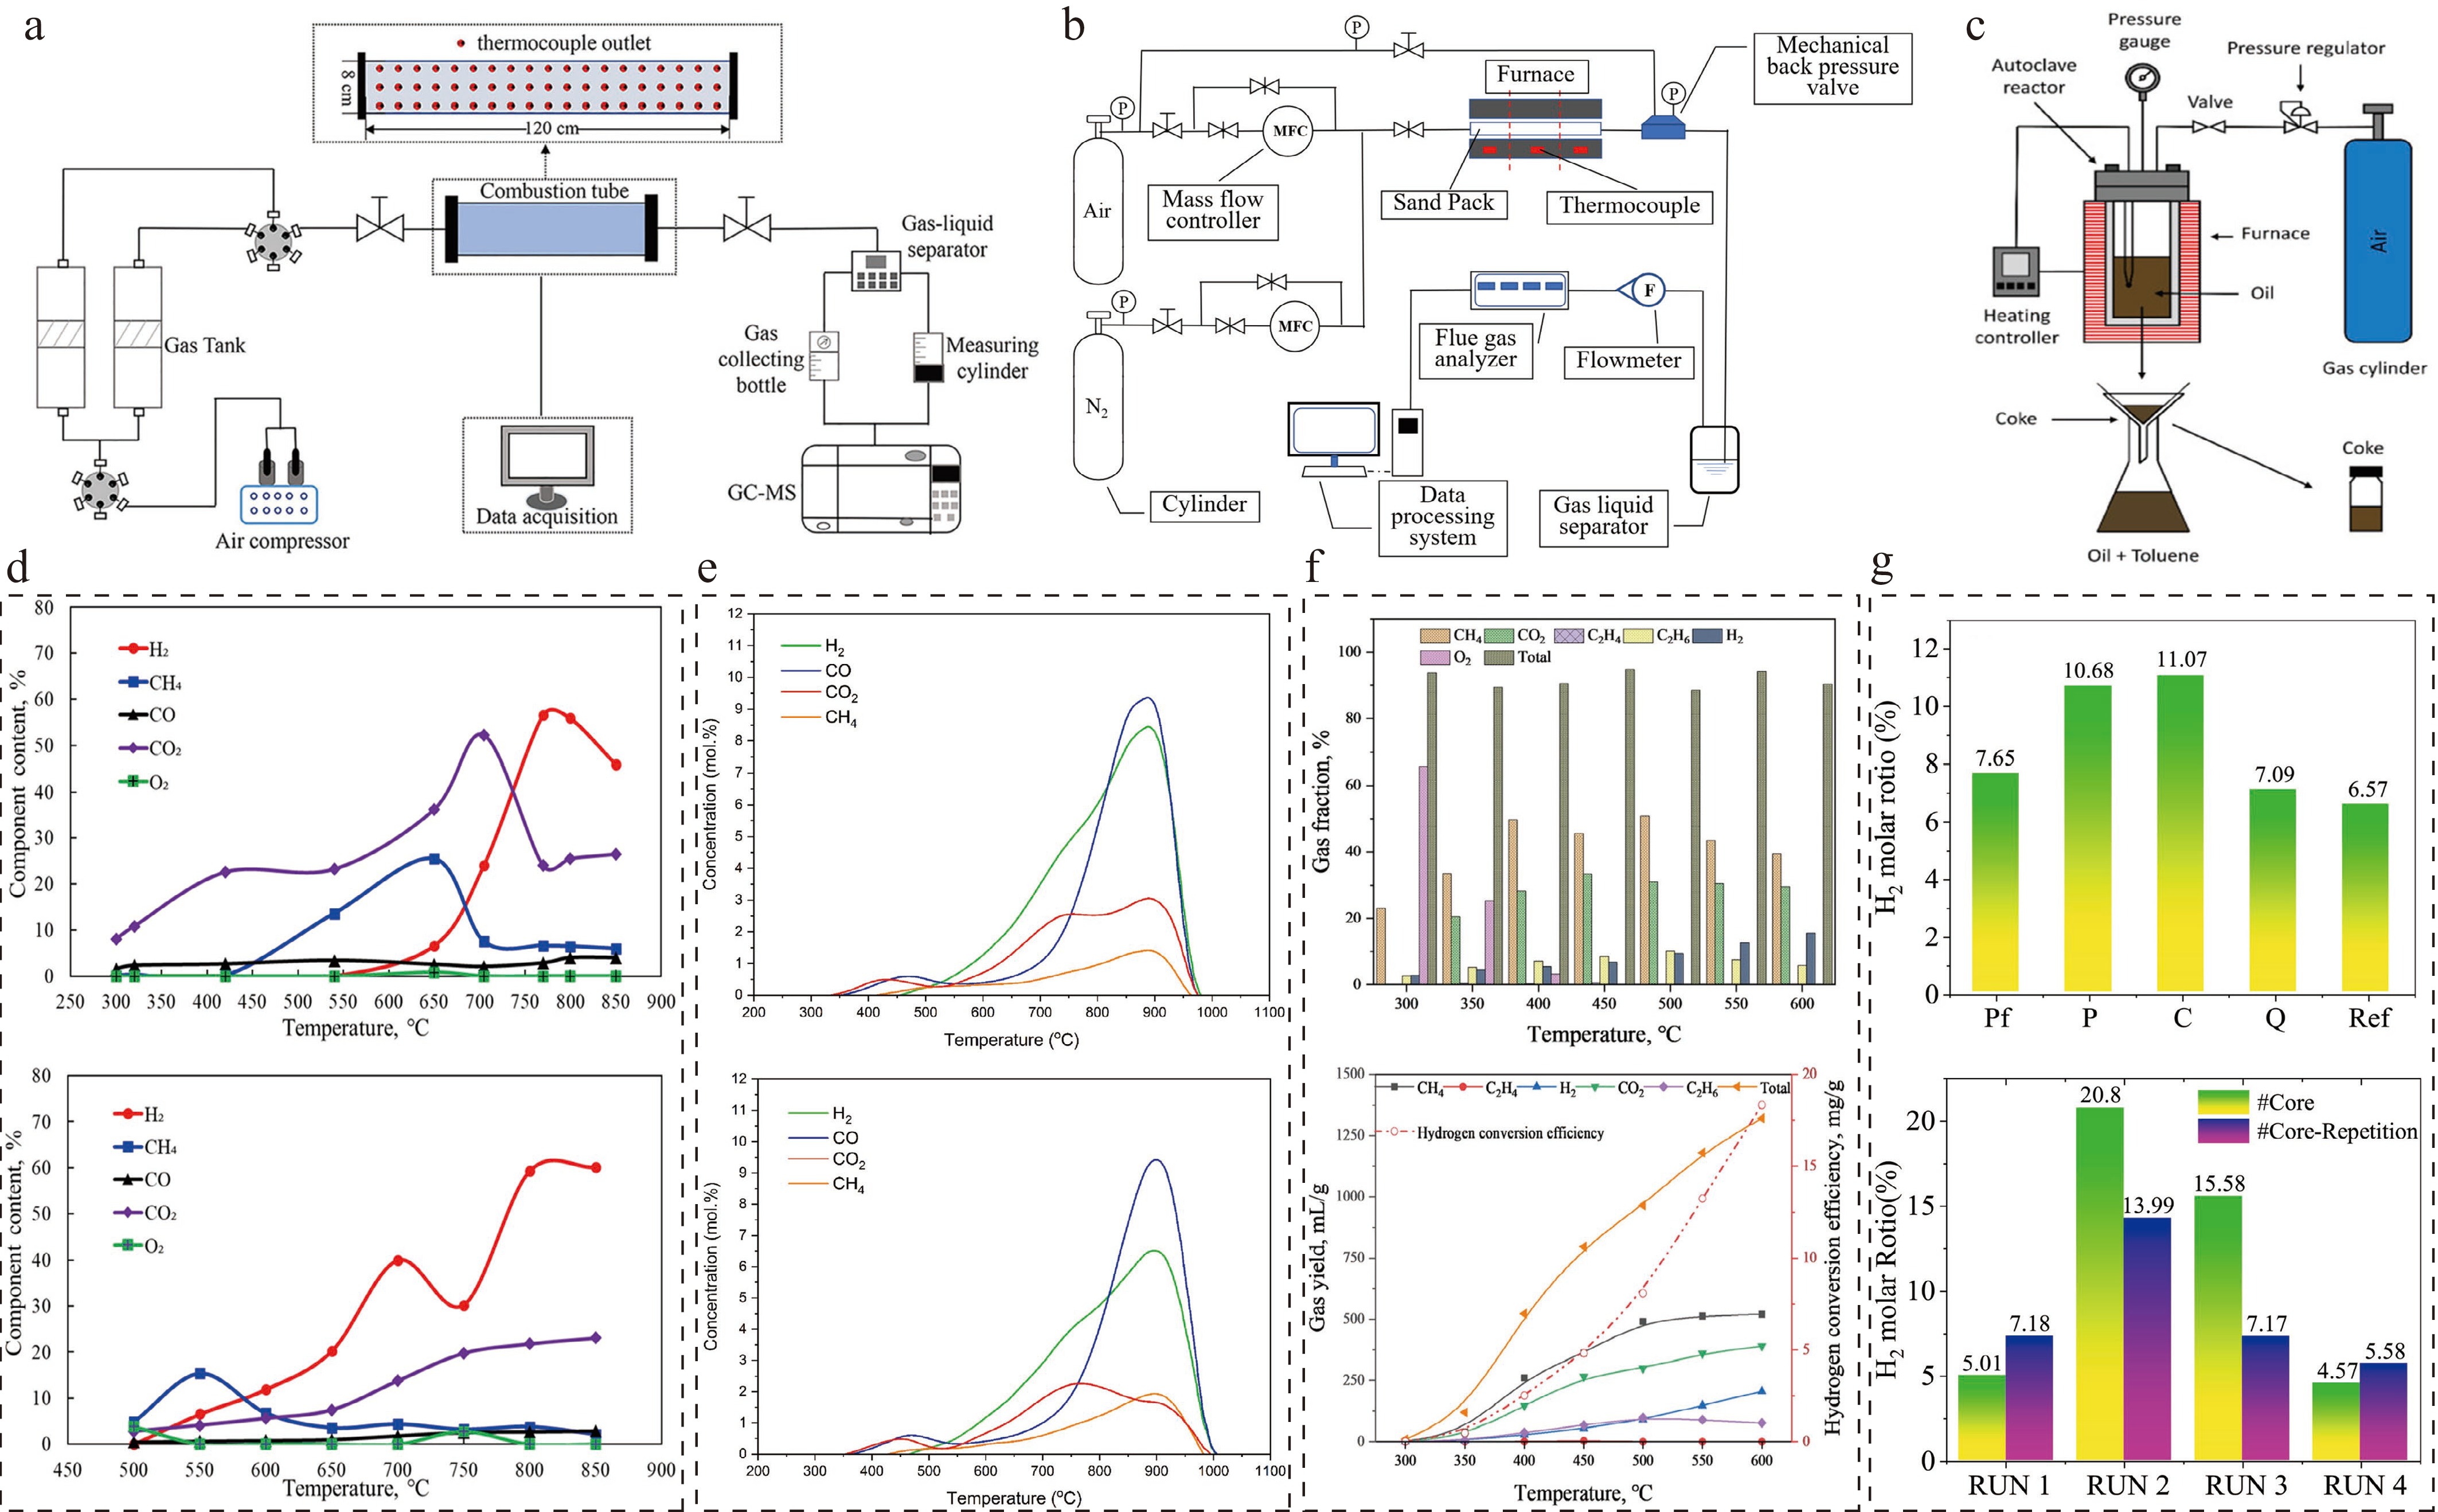
Figure 10.
The experimental equipment and hydrogen production characteristics during the ISHG process[79, 83,84] (Licence no. 502059445, 6239691210953, 6239691378567, 6239700073771, 6239700217452). (a) CT. (b) RTO. (c) RA. (d) Mineral-catalyzed and N2/Air/H2O-regulated hydrogen. (e) Coke-gasified and N2/H2O-regulated hydrogen. (f) Fixed-water-content oil oxidized hydrogen. (g) Mineral-catalyzed and multiple-round gasified hydrogen.
-
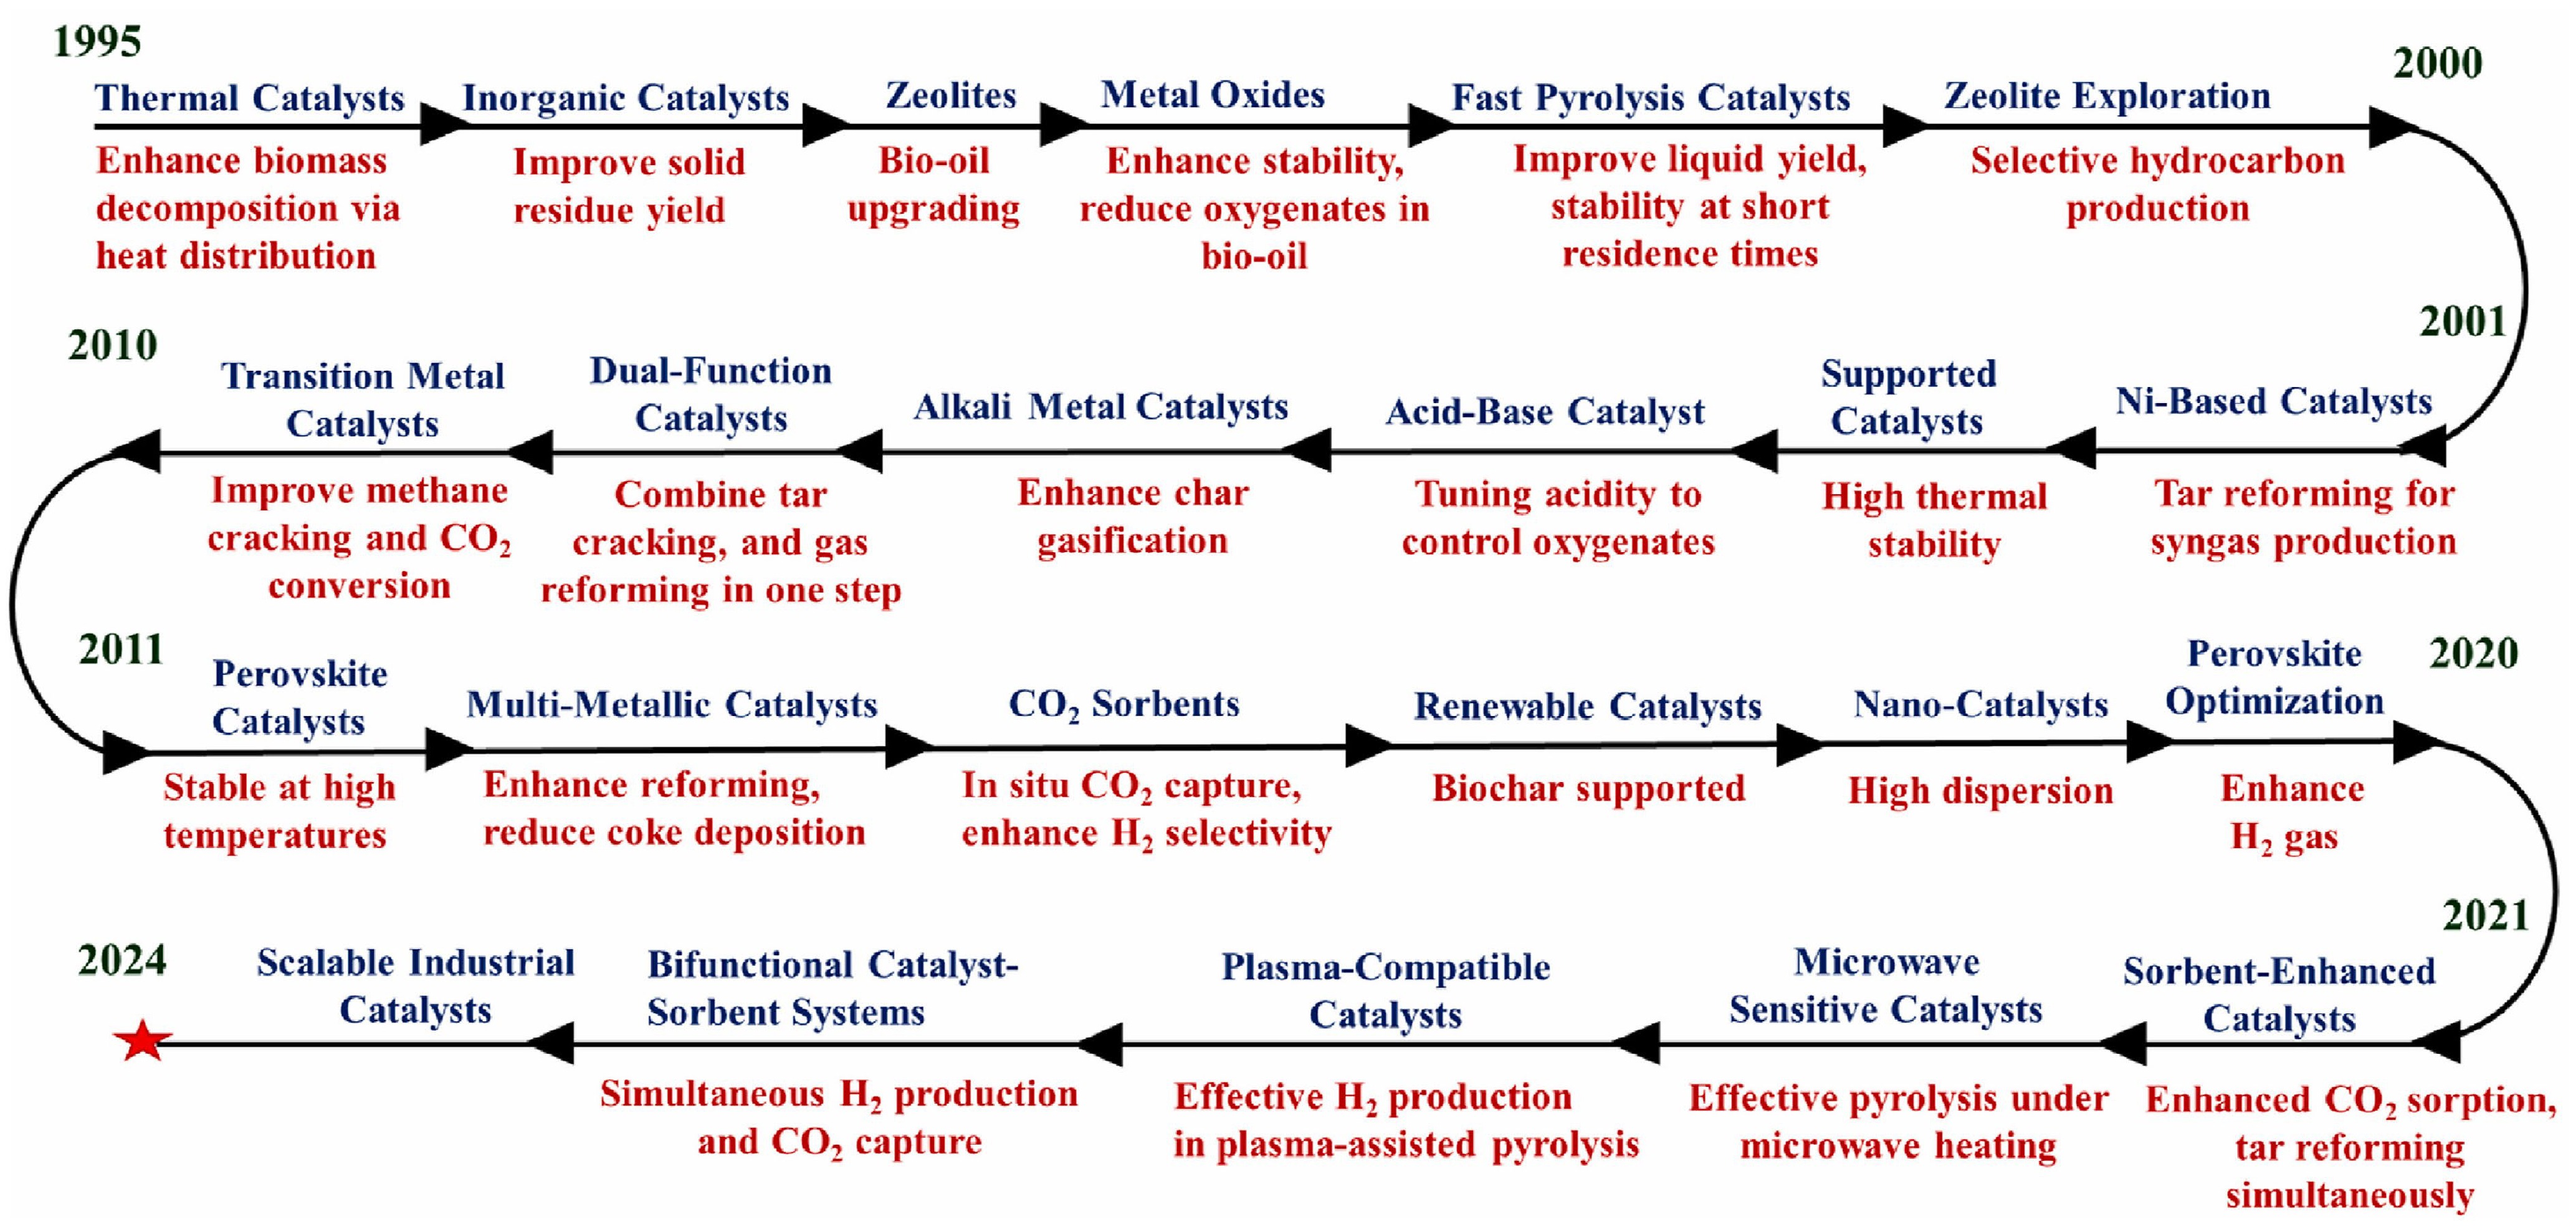
Figure 11.
The catalyst development of hydrogen generation from 1995 to 2024[86] (Licence no. 6239700454313).
-
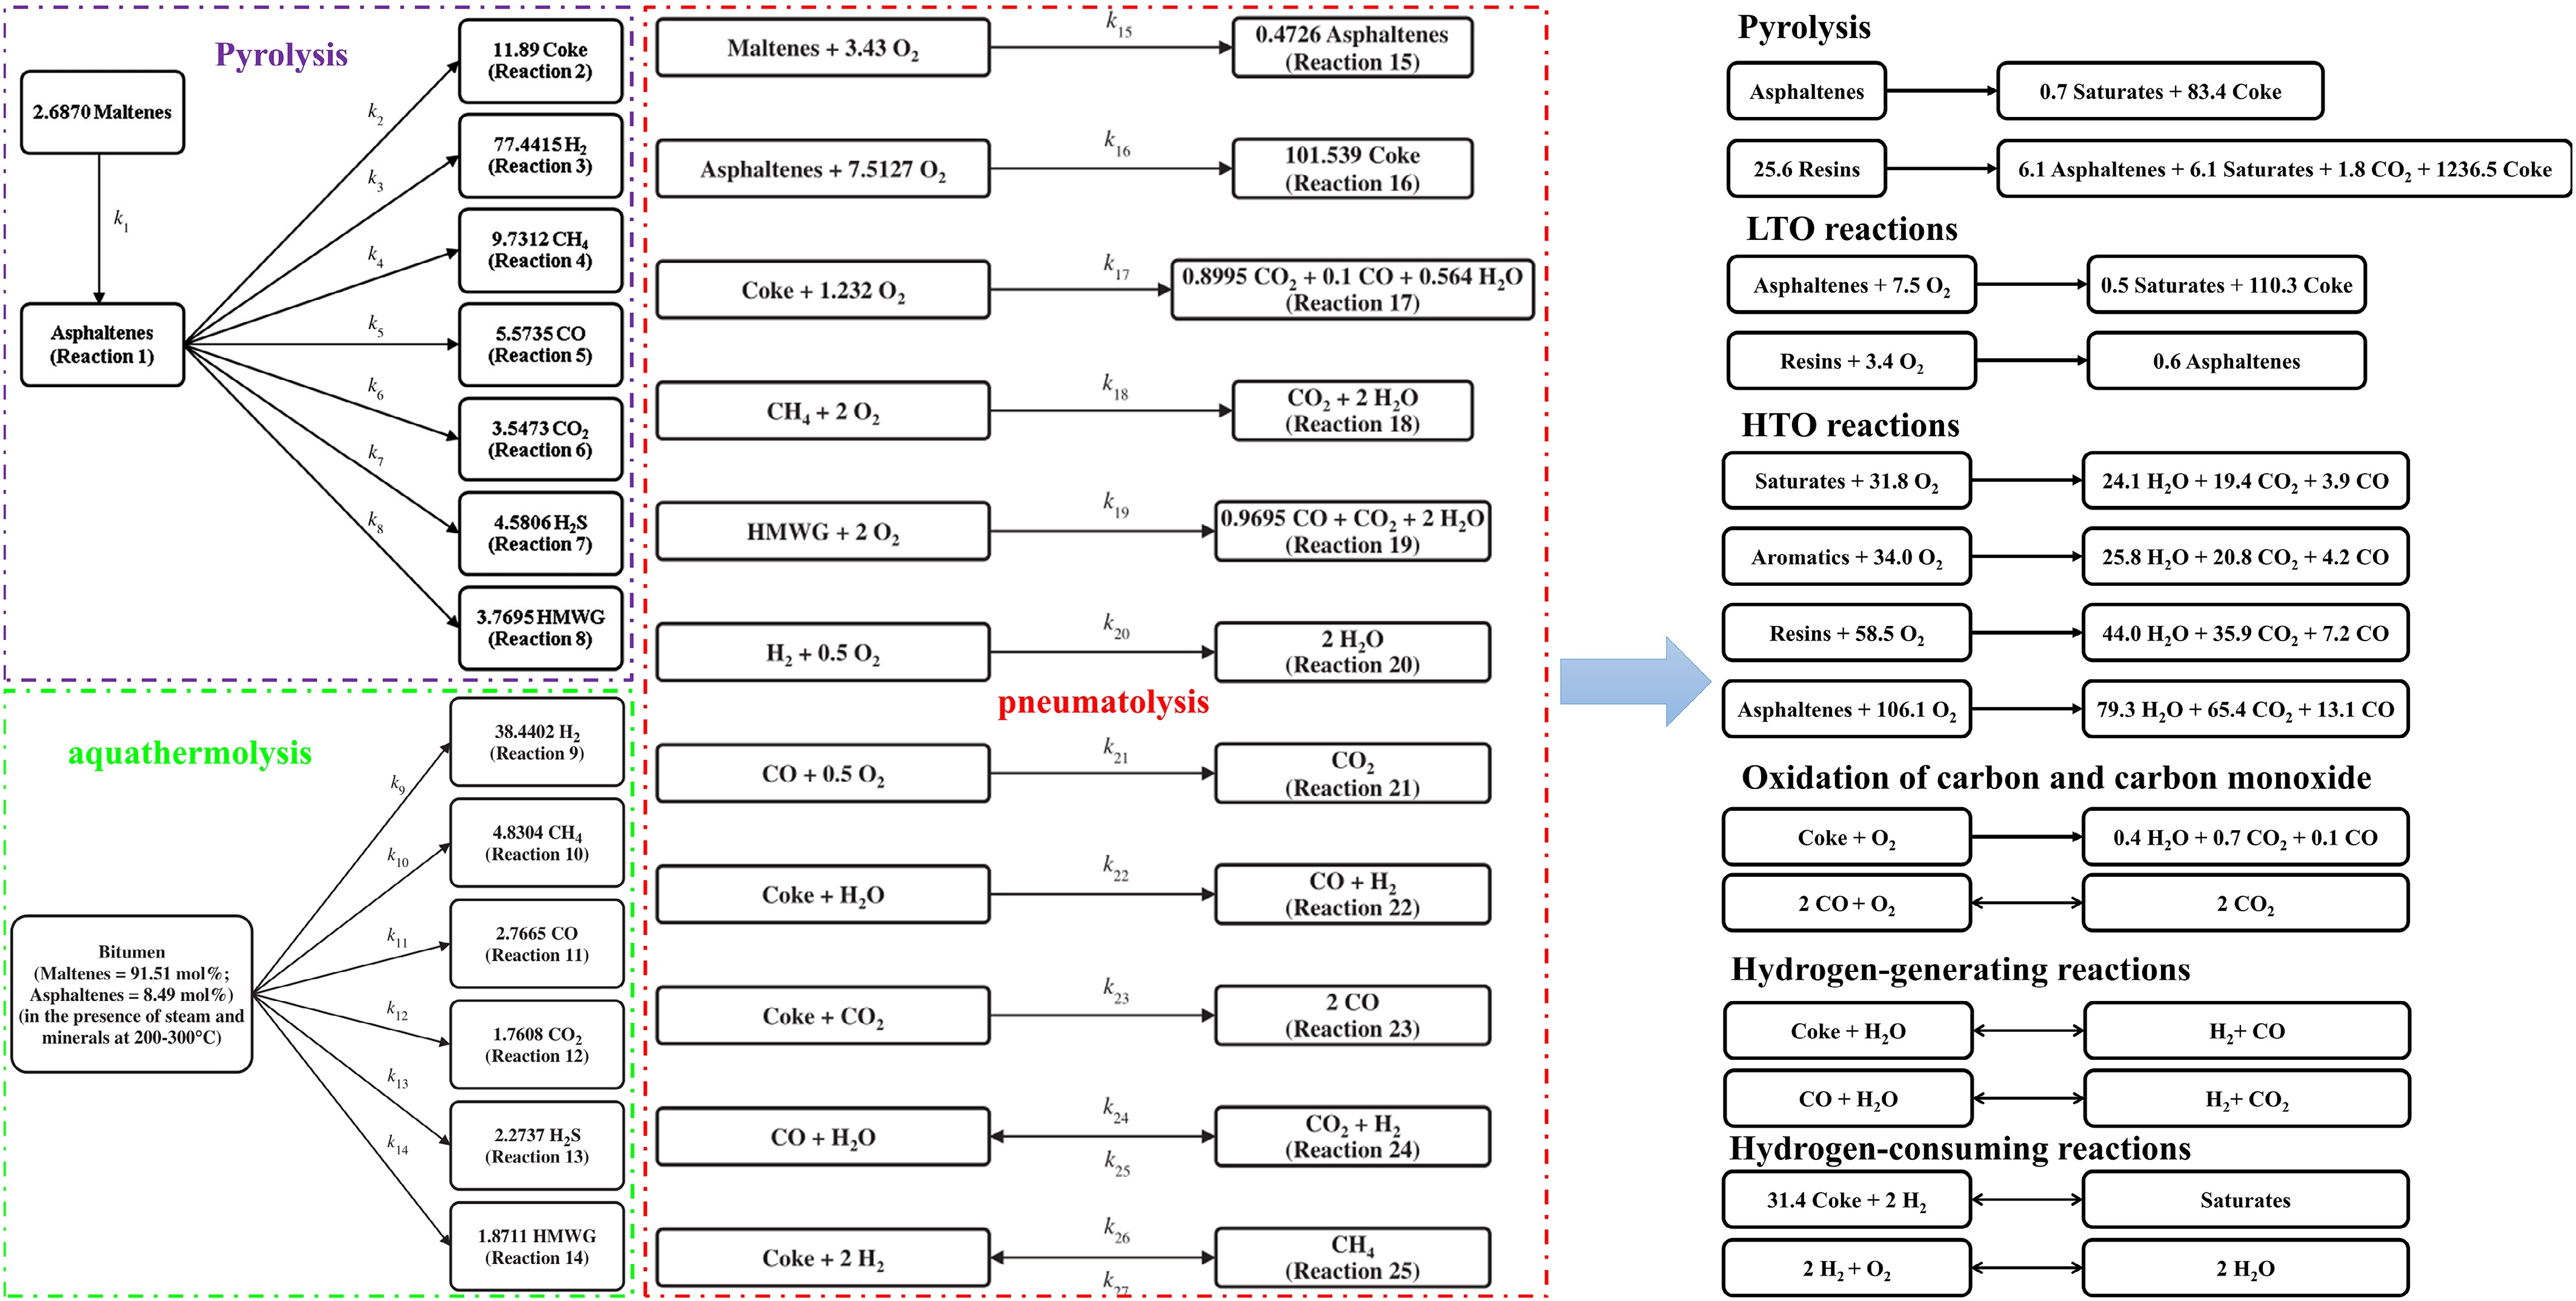
Figure 12.
Differences of reaction models in the ISHG process.
-
Stage Chemical reaction Heat variation Temperature (°C) Pyrolysis Heavy oil → Light oil + Gas + H2O + Coke Endothermic > 300 Secondary cracking Light oil → H2O + H2 + CH4 + CnHm; Light oil + H2O → H2 + CO Endothermic / Steam reforming reaction CnHm + 2nH2O → (2n + 0.5m) H2 + nCO2 Endothermic > 700 Water-gas reaction CO + H2O → H2 + CO2 Exothermic 300–600 Methane formation CO + 3H2 → CH4 + H2O; CO2 + 4H2 → CH4 + 2H2O Exothermic 300–600 Methane decomposition CH4 + H2O → 3H2 + CO Endothermic > 500 Boudouard reaction Coke + CO2 → 2CO Endothermic > 700 Coke gasification Coke + 2H2O → 2H2 + CO2 Endothermic > 700 Table 1.
The typical pyrolysis reaction process.
-
Oil sample Viscosity, mPa·s (50 °C) Reaction time, h Catalyst CH4, wt% H2, wt% Gasification rate Heavy oil, Xinjiang, China 2,578.6 72 None 0.044 0.064 0.209% Heavy oil, Liaohe, China 183 72 NiO − − 0.157% Heavy oil, Cuba 9,963.7 24 None 1.257 (vol%) 0.06 (vol%) − Oil-soluble 1.401 (vol%) 0.01 (vol%) − Extra heavy oil, Liaohe, China 11,514–16,874 48 None 0.392 0.020 − Air-soluble 0.608 0.030 − Oil-soluble 0.582 0.025 − Water-soluble 0.467 0.024 − Heavy oil, Liaohe, China 124.3 36 None 0.677 0.026 − -
Year Reservoir Porosity Permeability (mD) Viscosity (mPa·s) Depth (m) Method Peak hydrogen 1977 Utah Tar Sand 31% 600–700 > 106 107 ISC 14% 1979 Marguerite Lake 30% 1,000–3,000 > 105 450 ISC 33% 1985 Wolf Lake 32% 1,000–3,000 > 40,000 108–230 ISC 25% 2006 Whitesands 36% 3,000–12,000 / / THAI 10% 2009 Kerrobert 32% 2,000–6,000 > 21,000 789 THAI 7% Table 3.
The hydrogen concentrations reported from ISC sites.
Figures
(12)
Tables
(3)