-
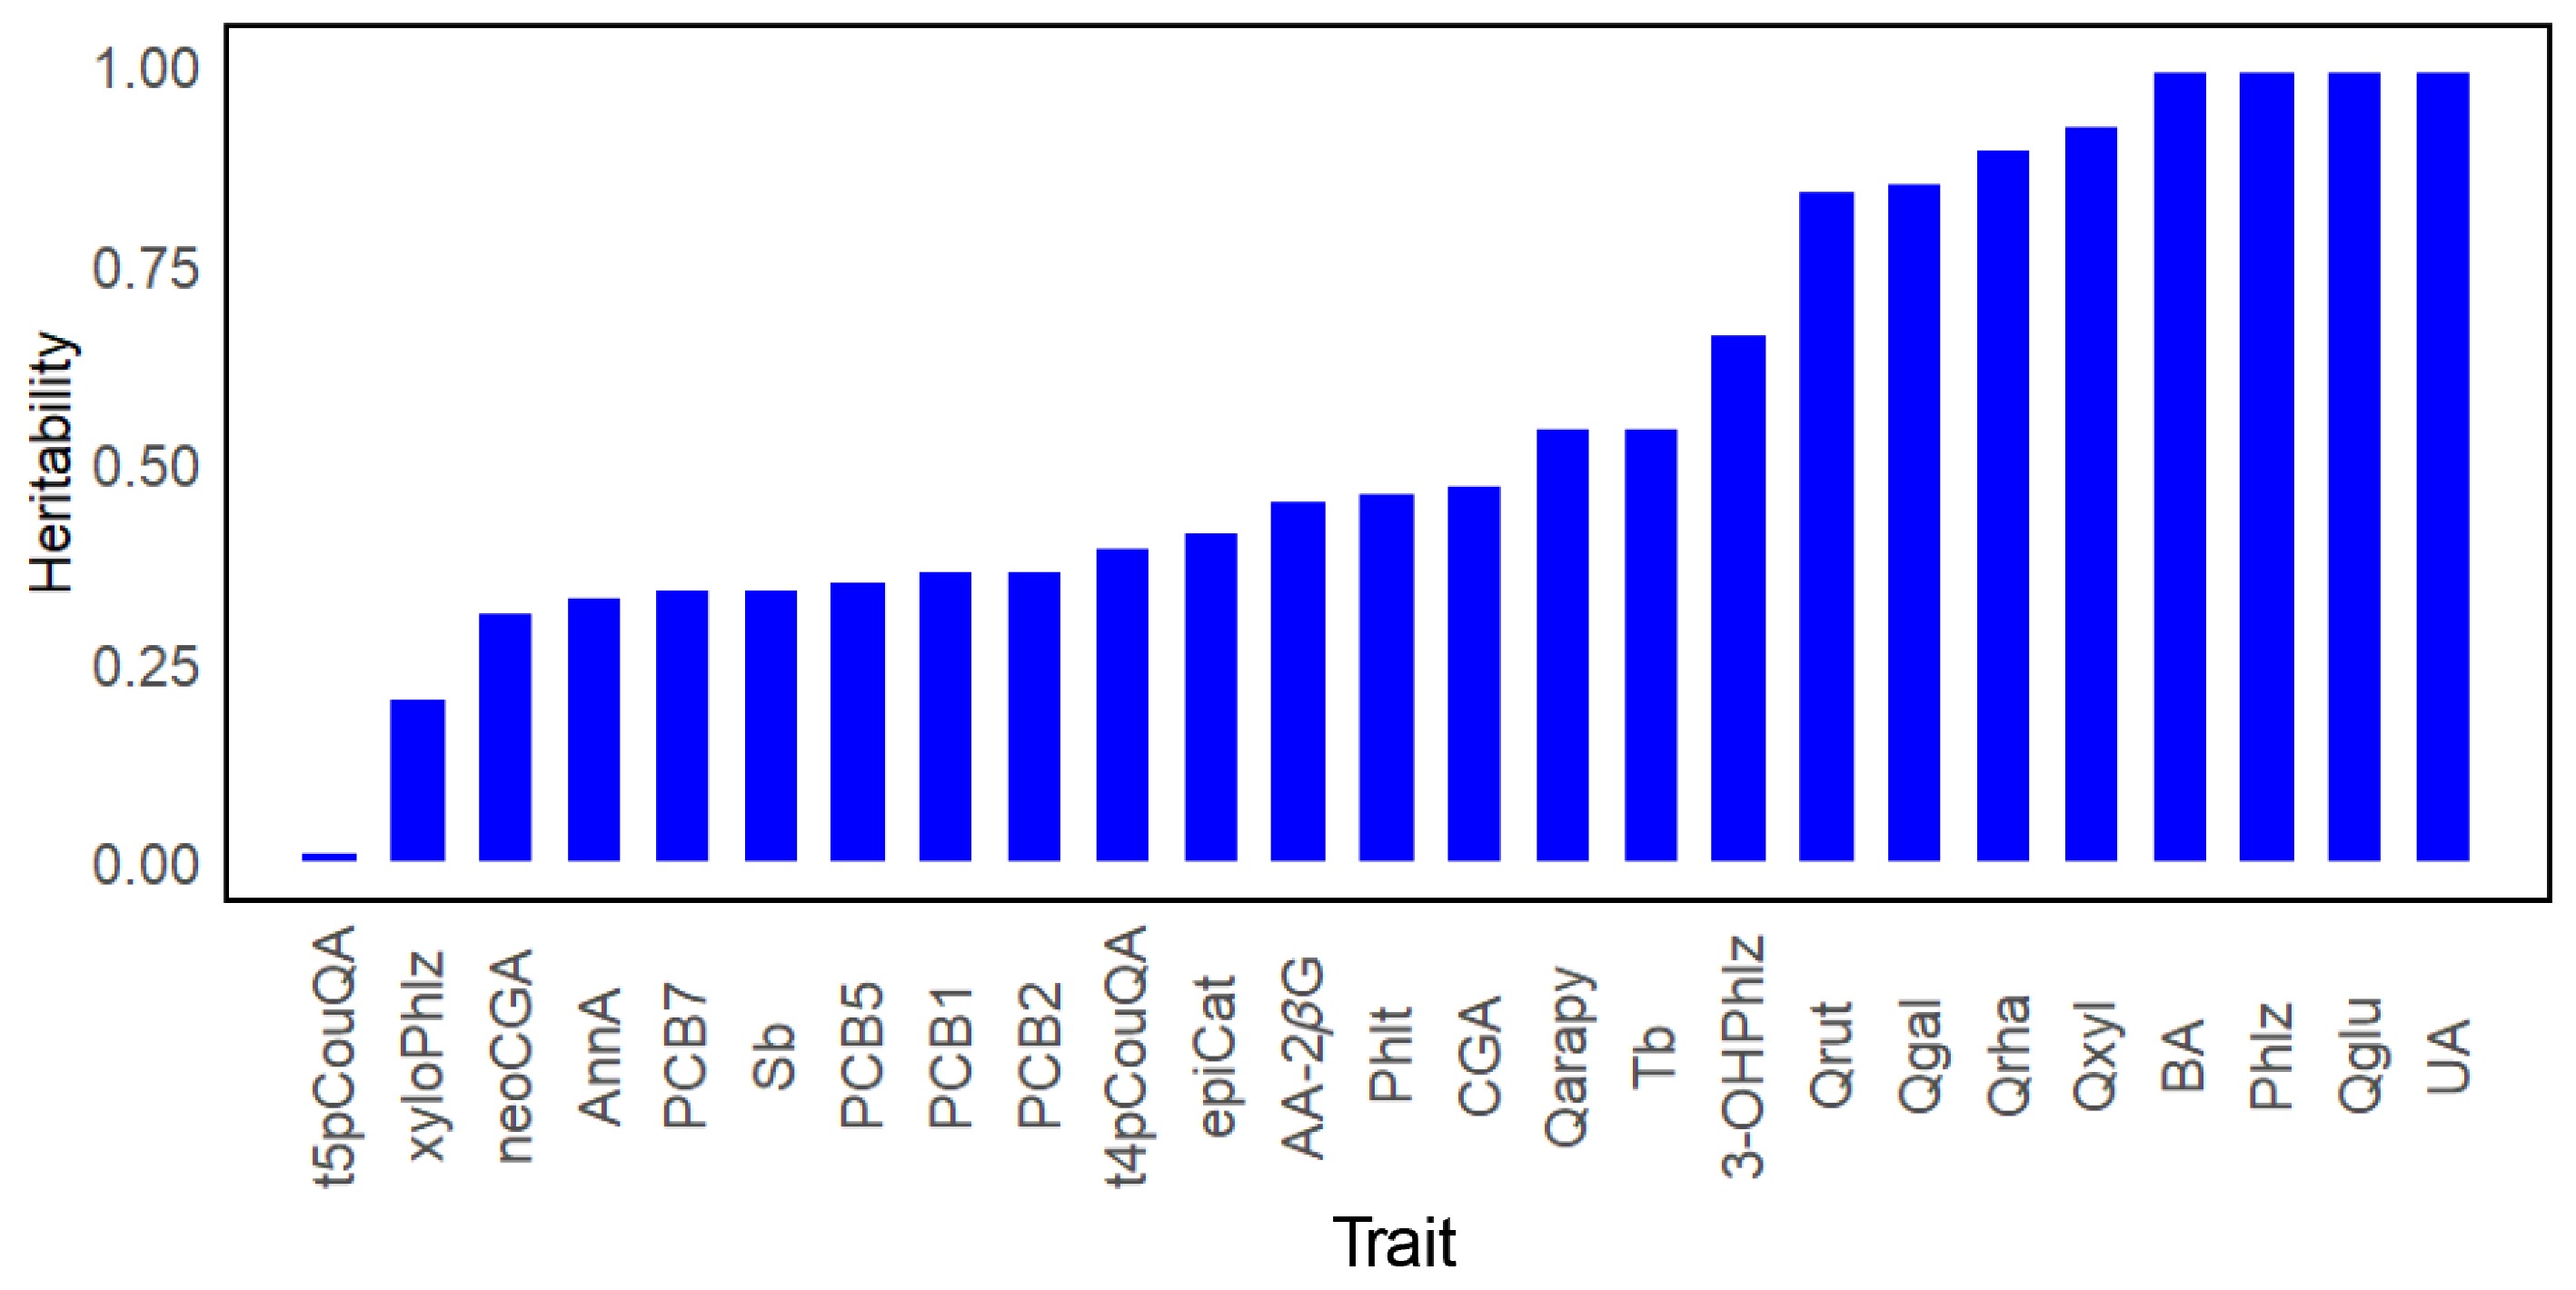
Figure 1.
Estimated heritability of leaf metabolites in apple seedlings. Refer to Table 1 for metabolite abbreviations.
-
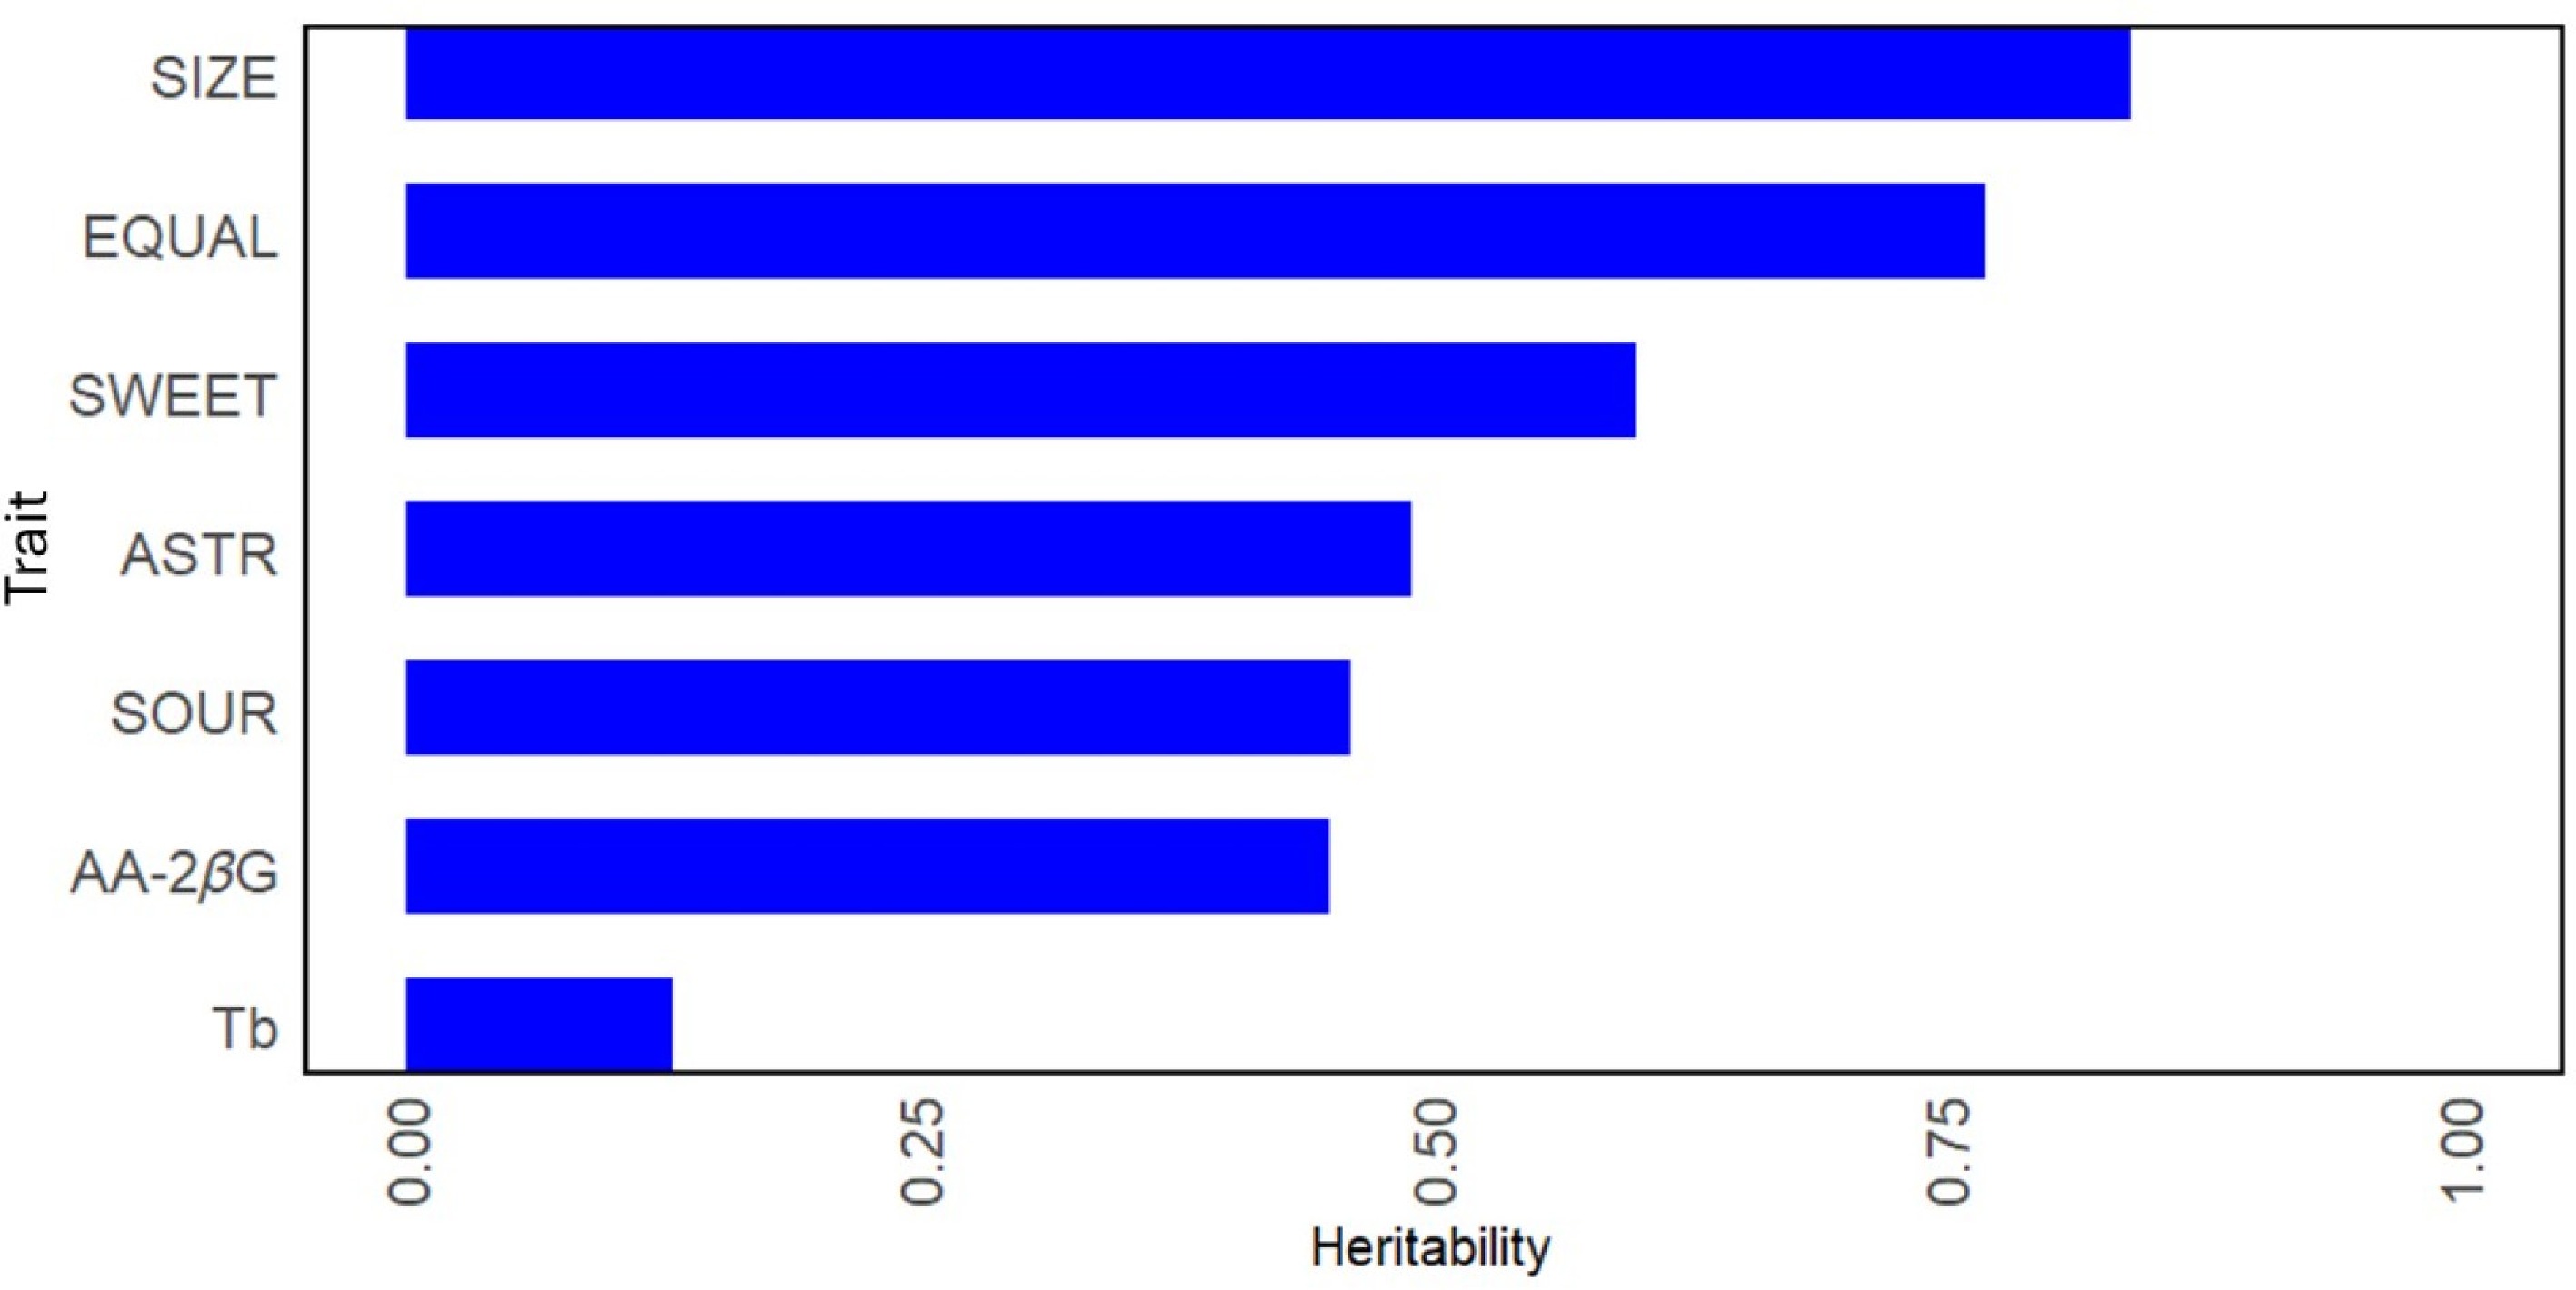
Figure 2.
Heritability of the apple fruit traits (SIZE: fruit size, EQUAL: overall eating quality, SWEET: sweetness, ASTR: astringency, SOUR: sourness, AA-2βG: ascorbyl 2-beta-glucoside, Tb: trilobatin).
-
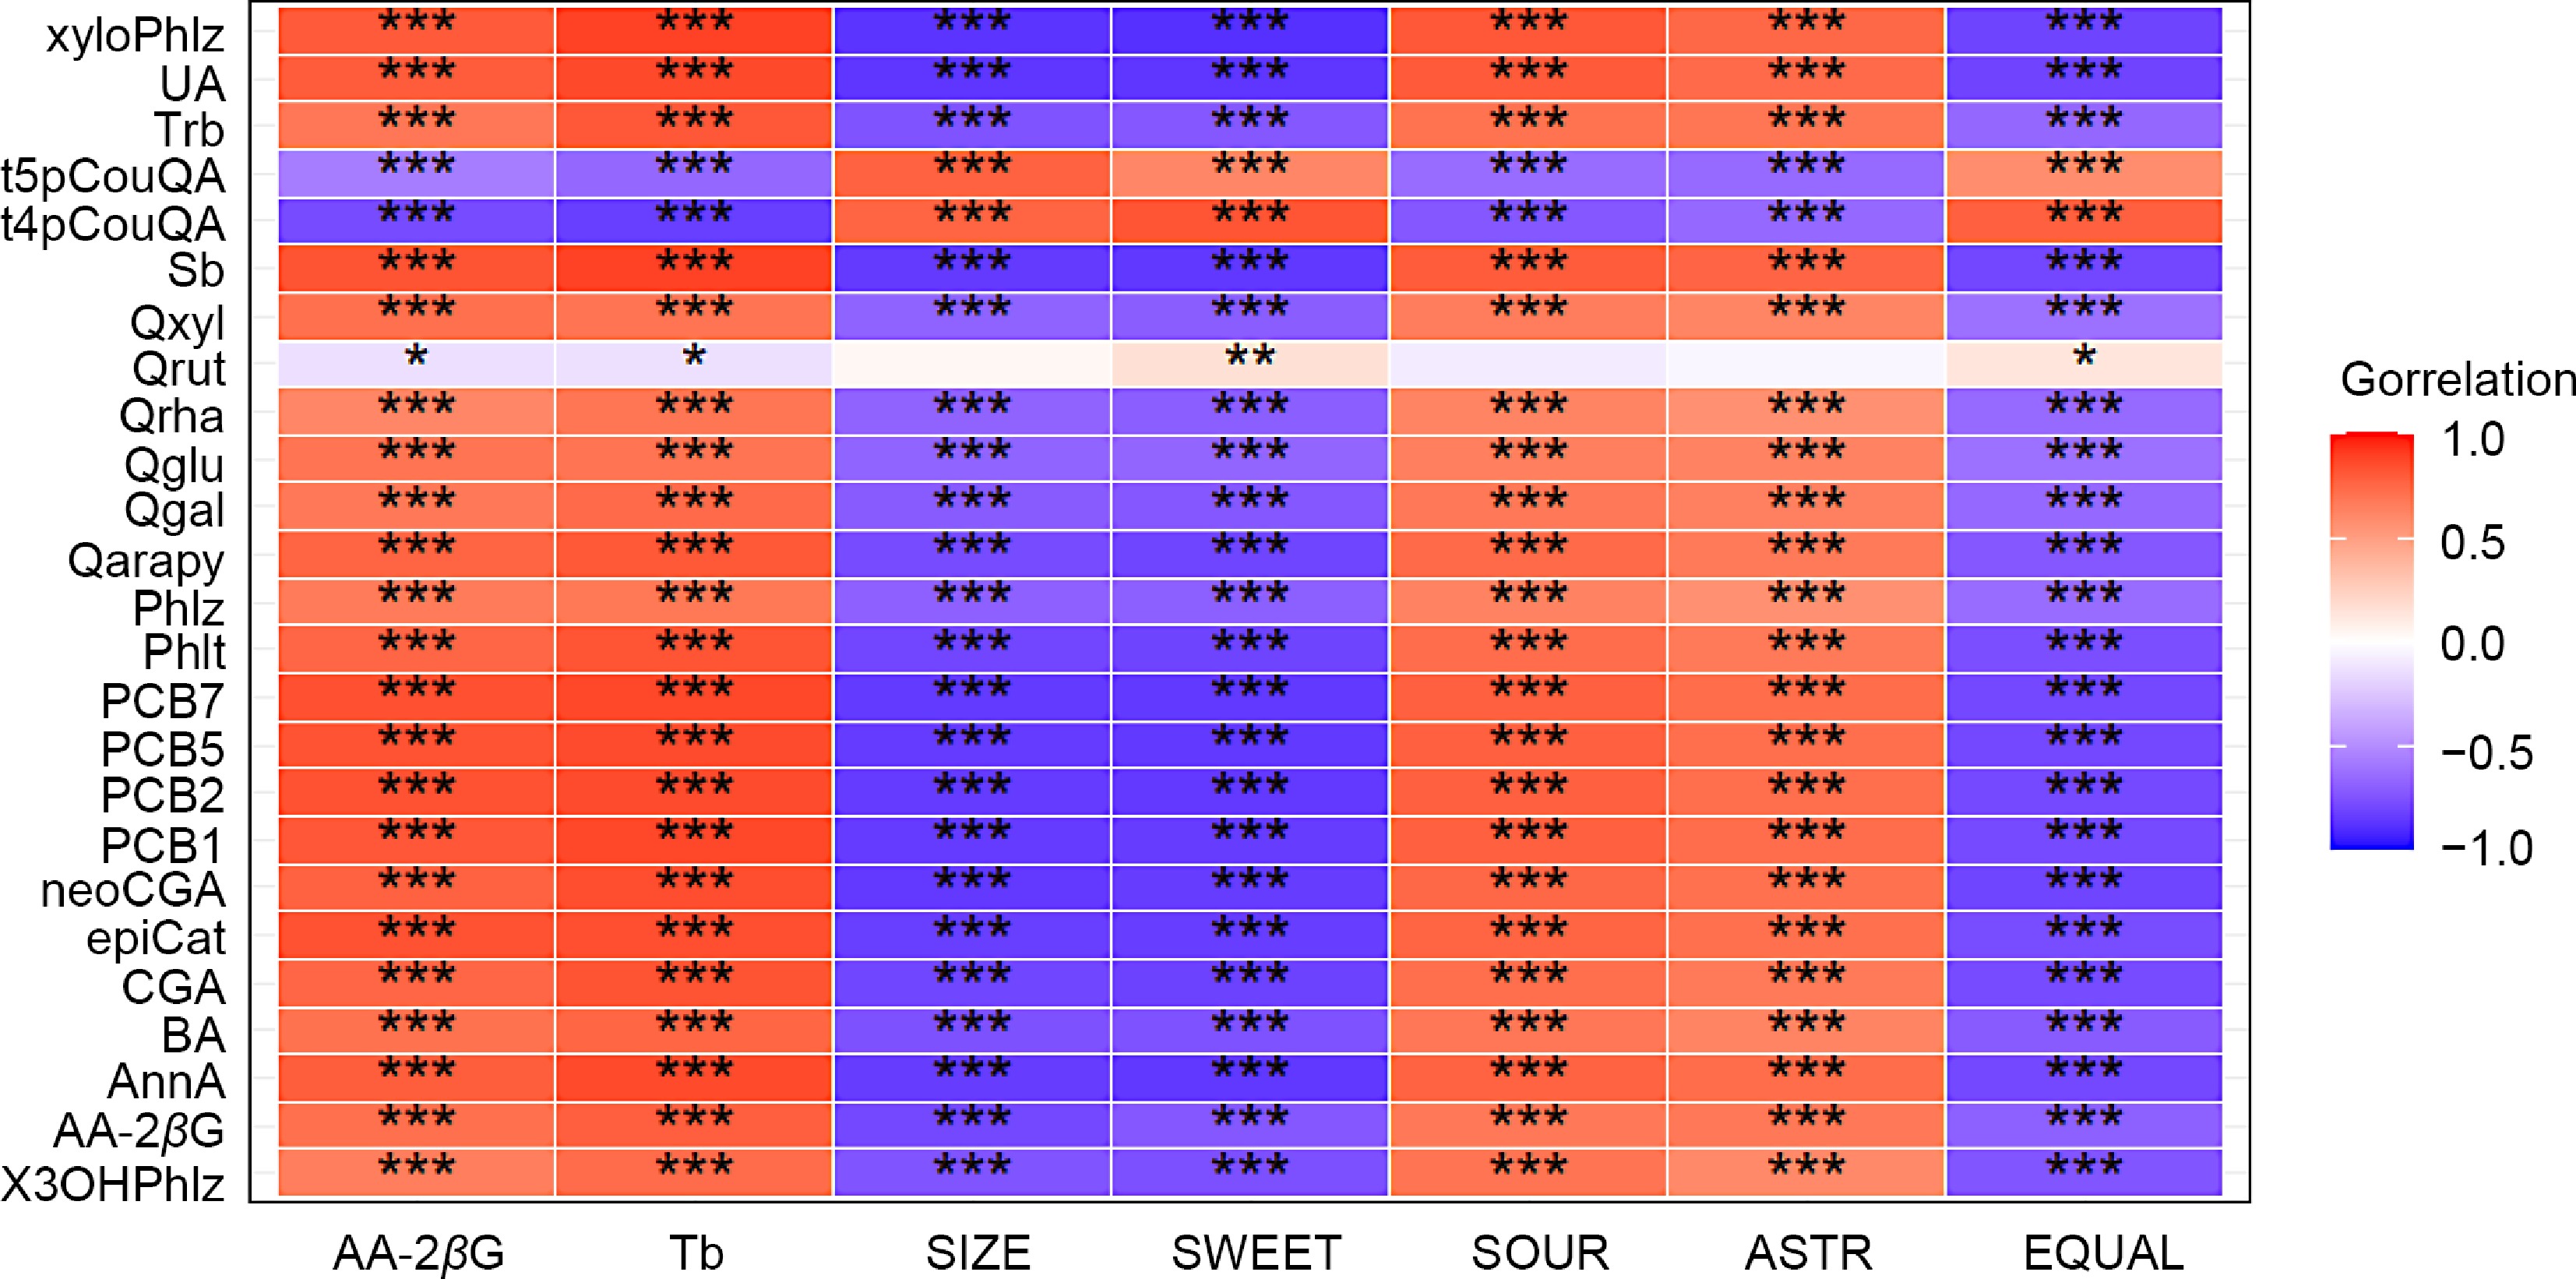
Figure 3.
Genetic correlation between apple leaf metabolites (y-axis) and apple fruit traits (x-axis). Significance levels of correlation coefficients: *** p < 0.001; ** p < 0.01; * p < 0.05. Refer to Table 1 for metabolite abbreviations.
-
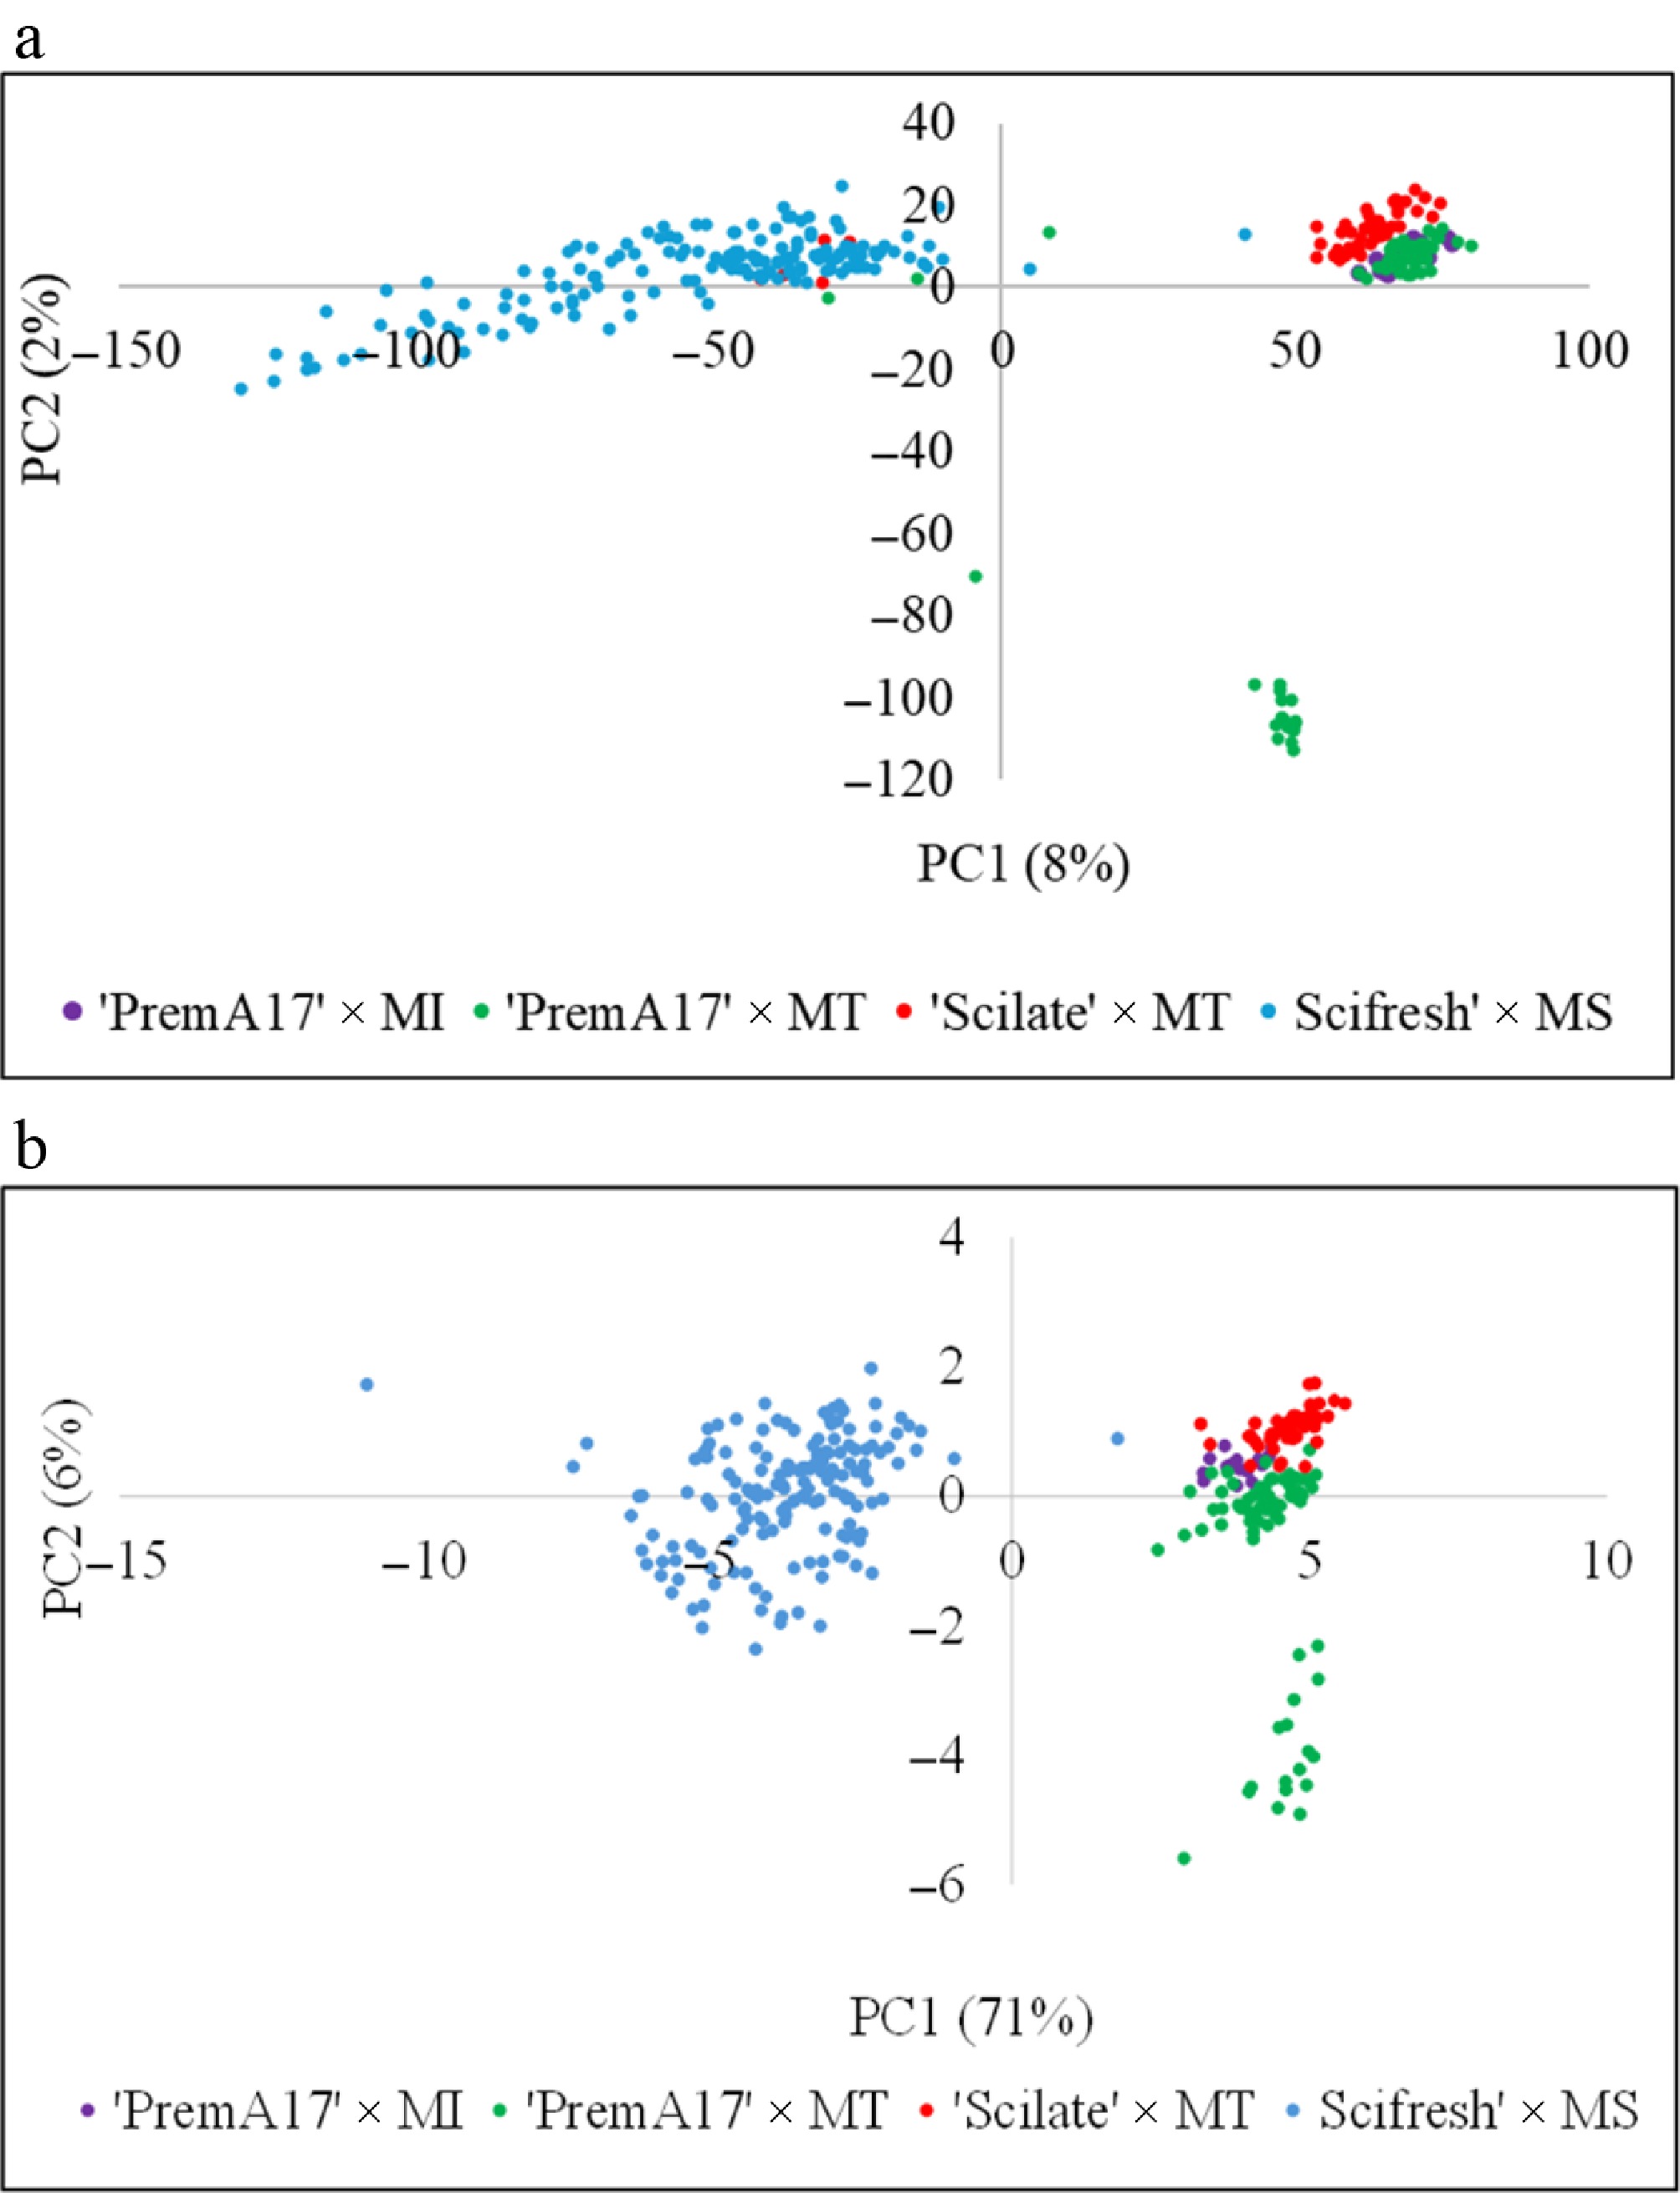
Figure 4.
Clustering pattern of apple seedlings from different families based on (a) SNP markers, and (b) leaf-derived secondary metabolites.
-
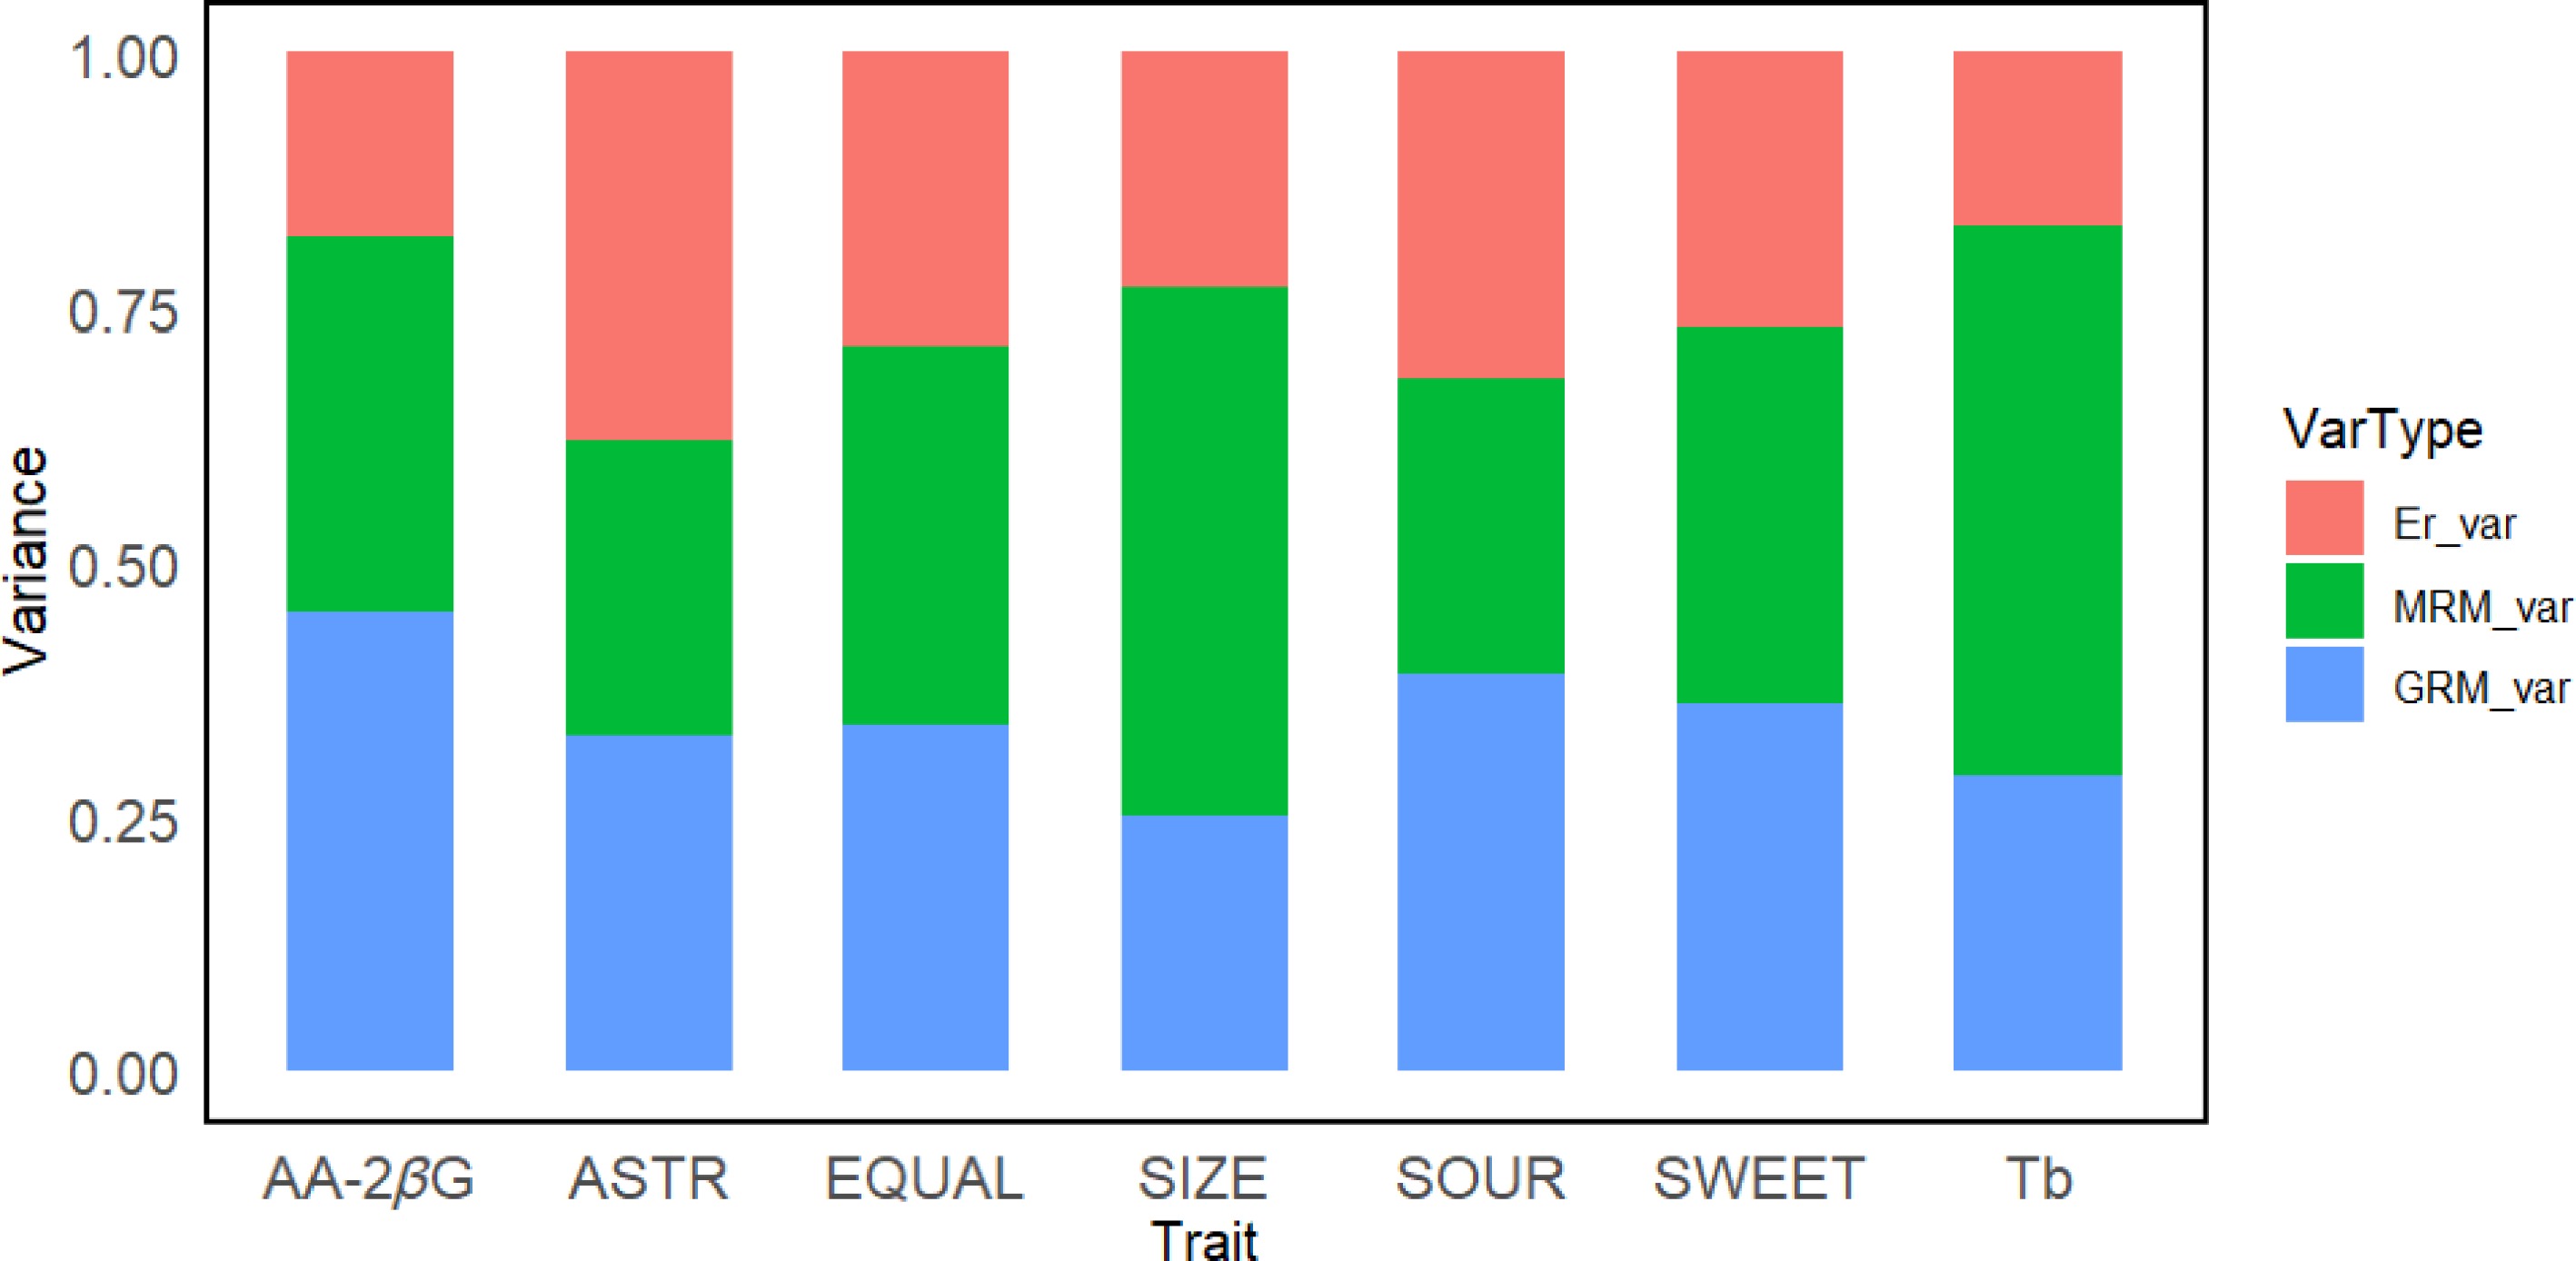
Figure 5.
Proportion of phenotypic variance in apple fruit traits captured by different kernels in the dual-kernel model analyses. (GRM: genomic relationship matrix, MRM: leaf metabolites relationship matrix, Er: error variance).
-
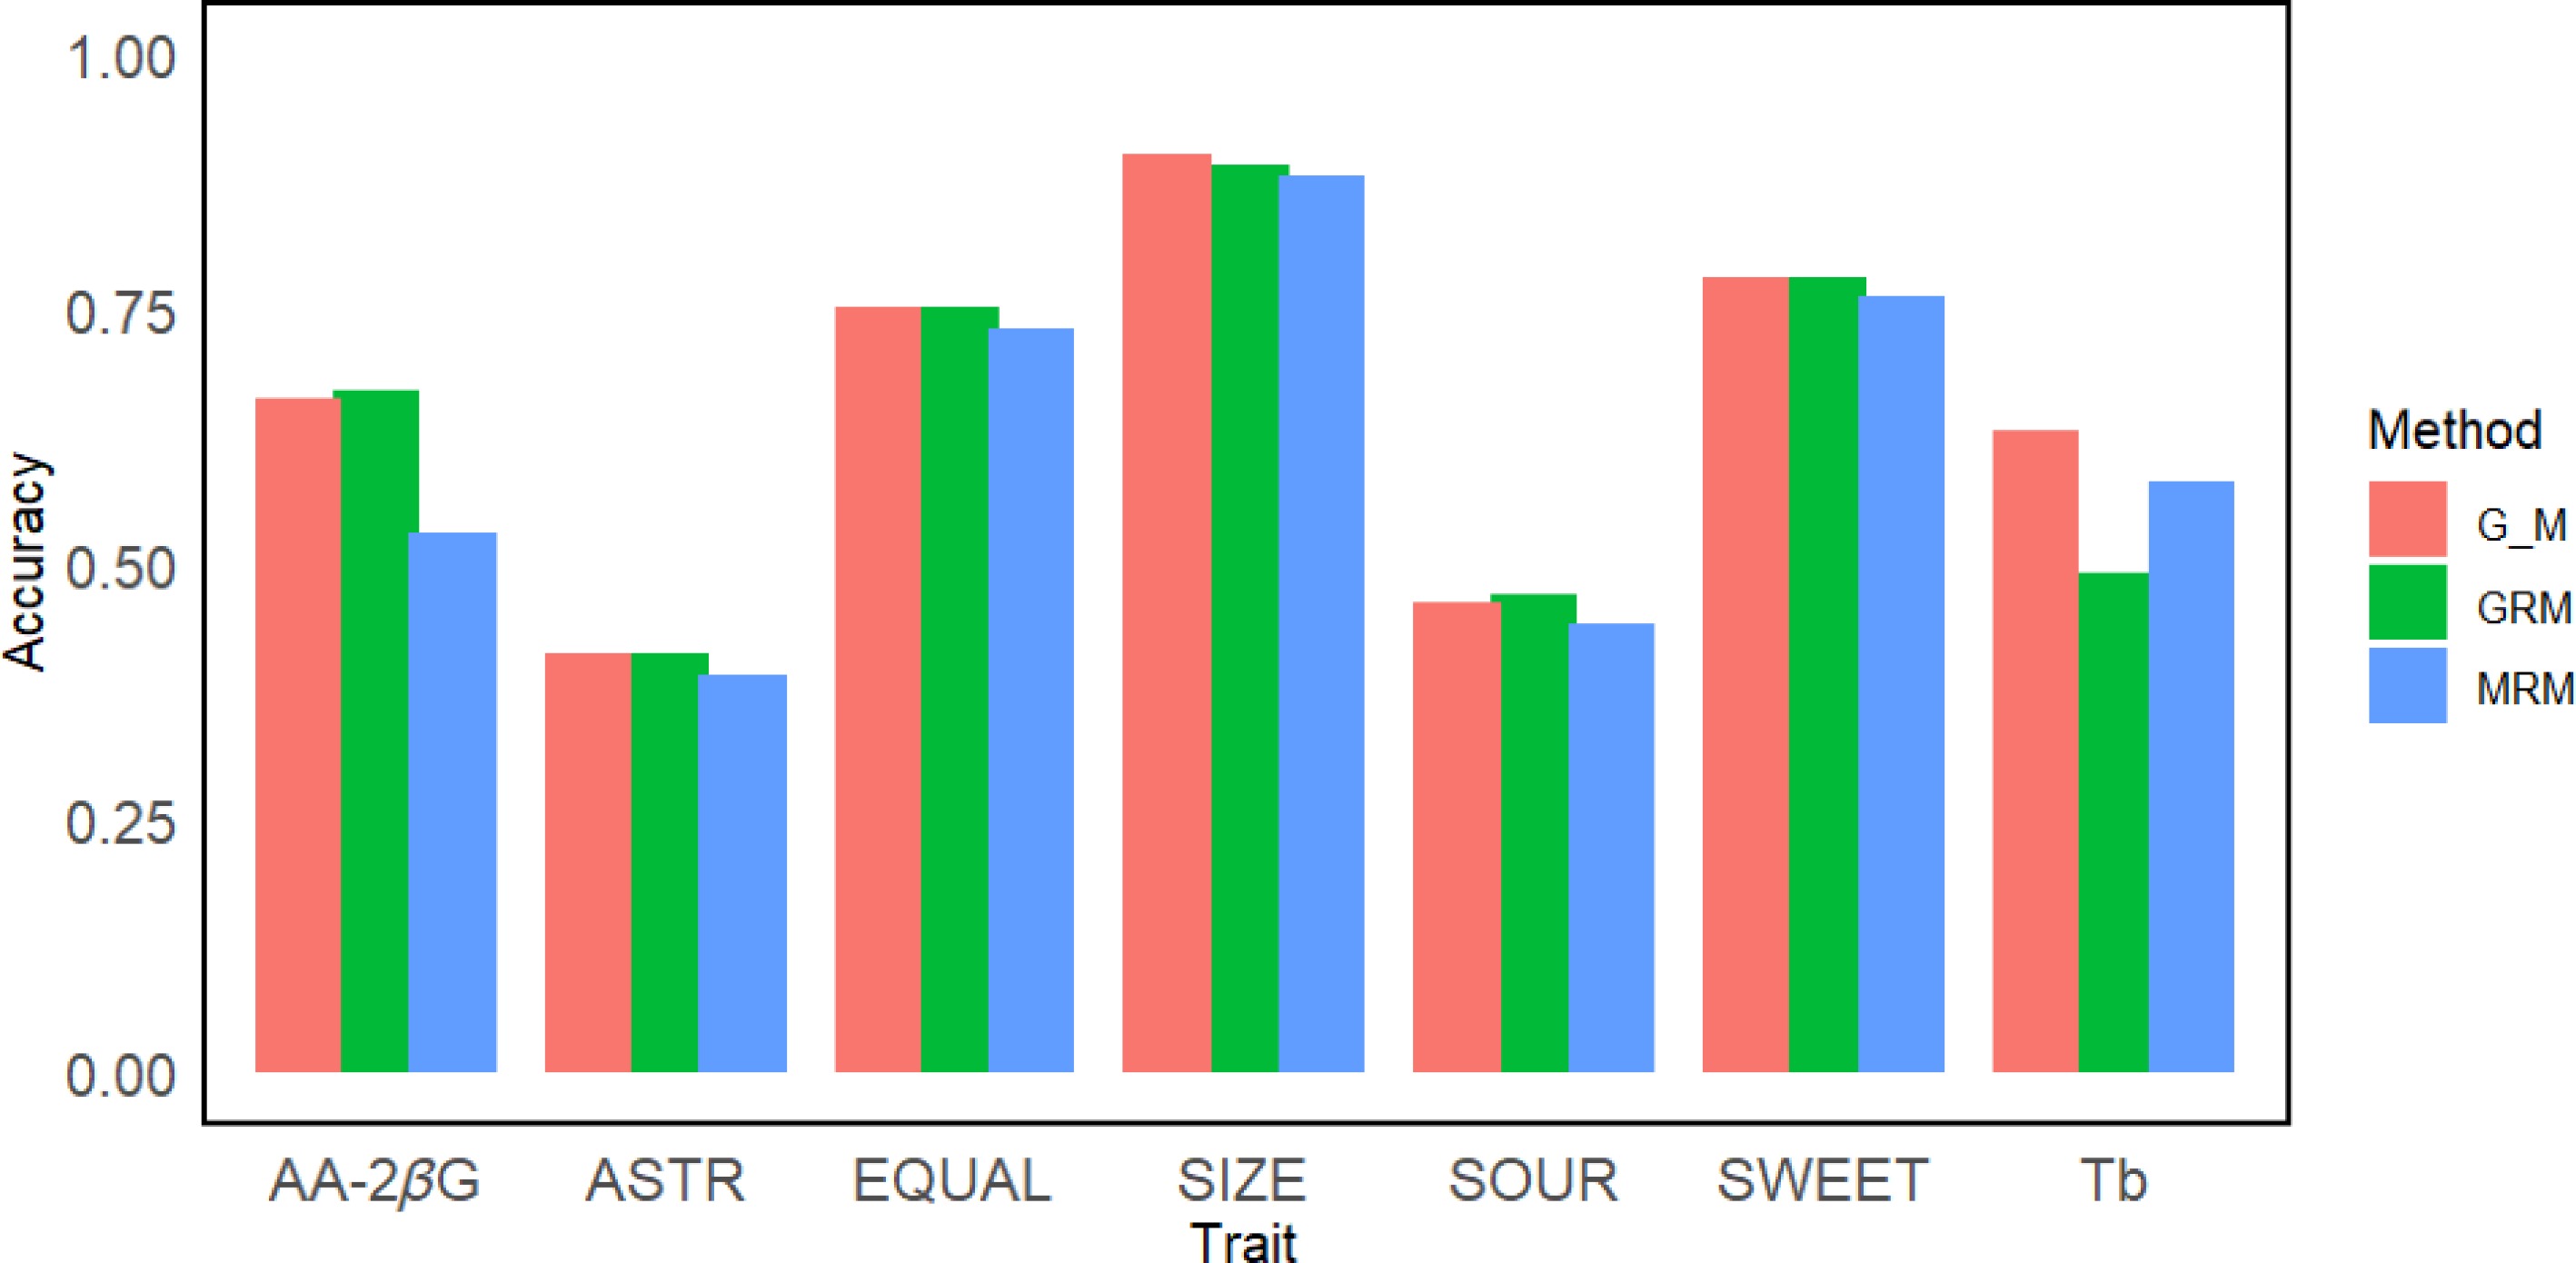
Figure 6.
Accuracy of genomic predictions in apple using models incorporating genomic relationship matrix (GRM), leaf metabolites relationship matrix (MRM), and GRM + MRM (G_M).
-
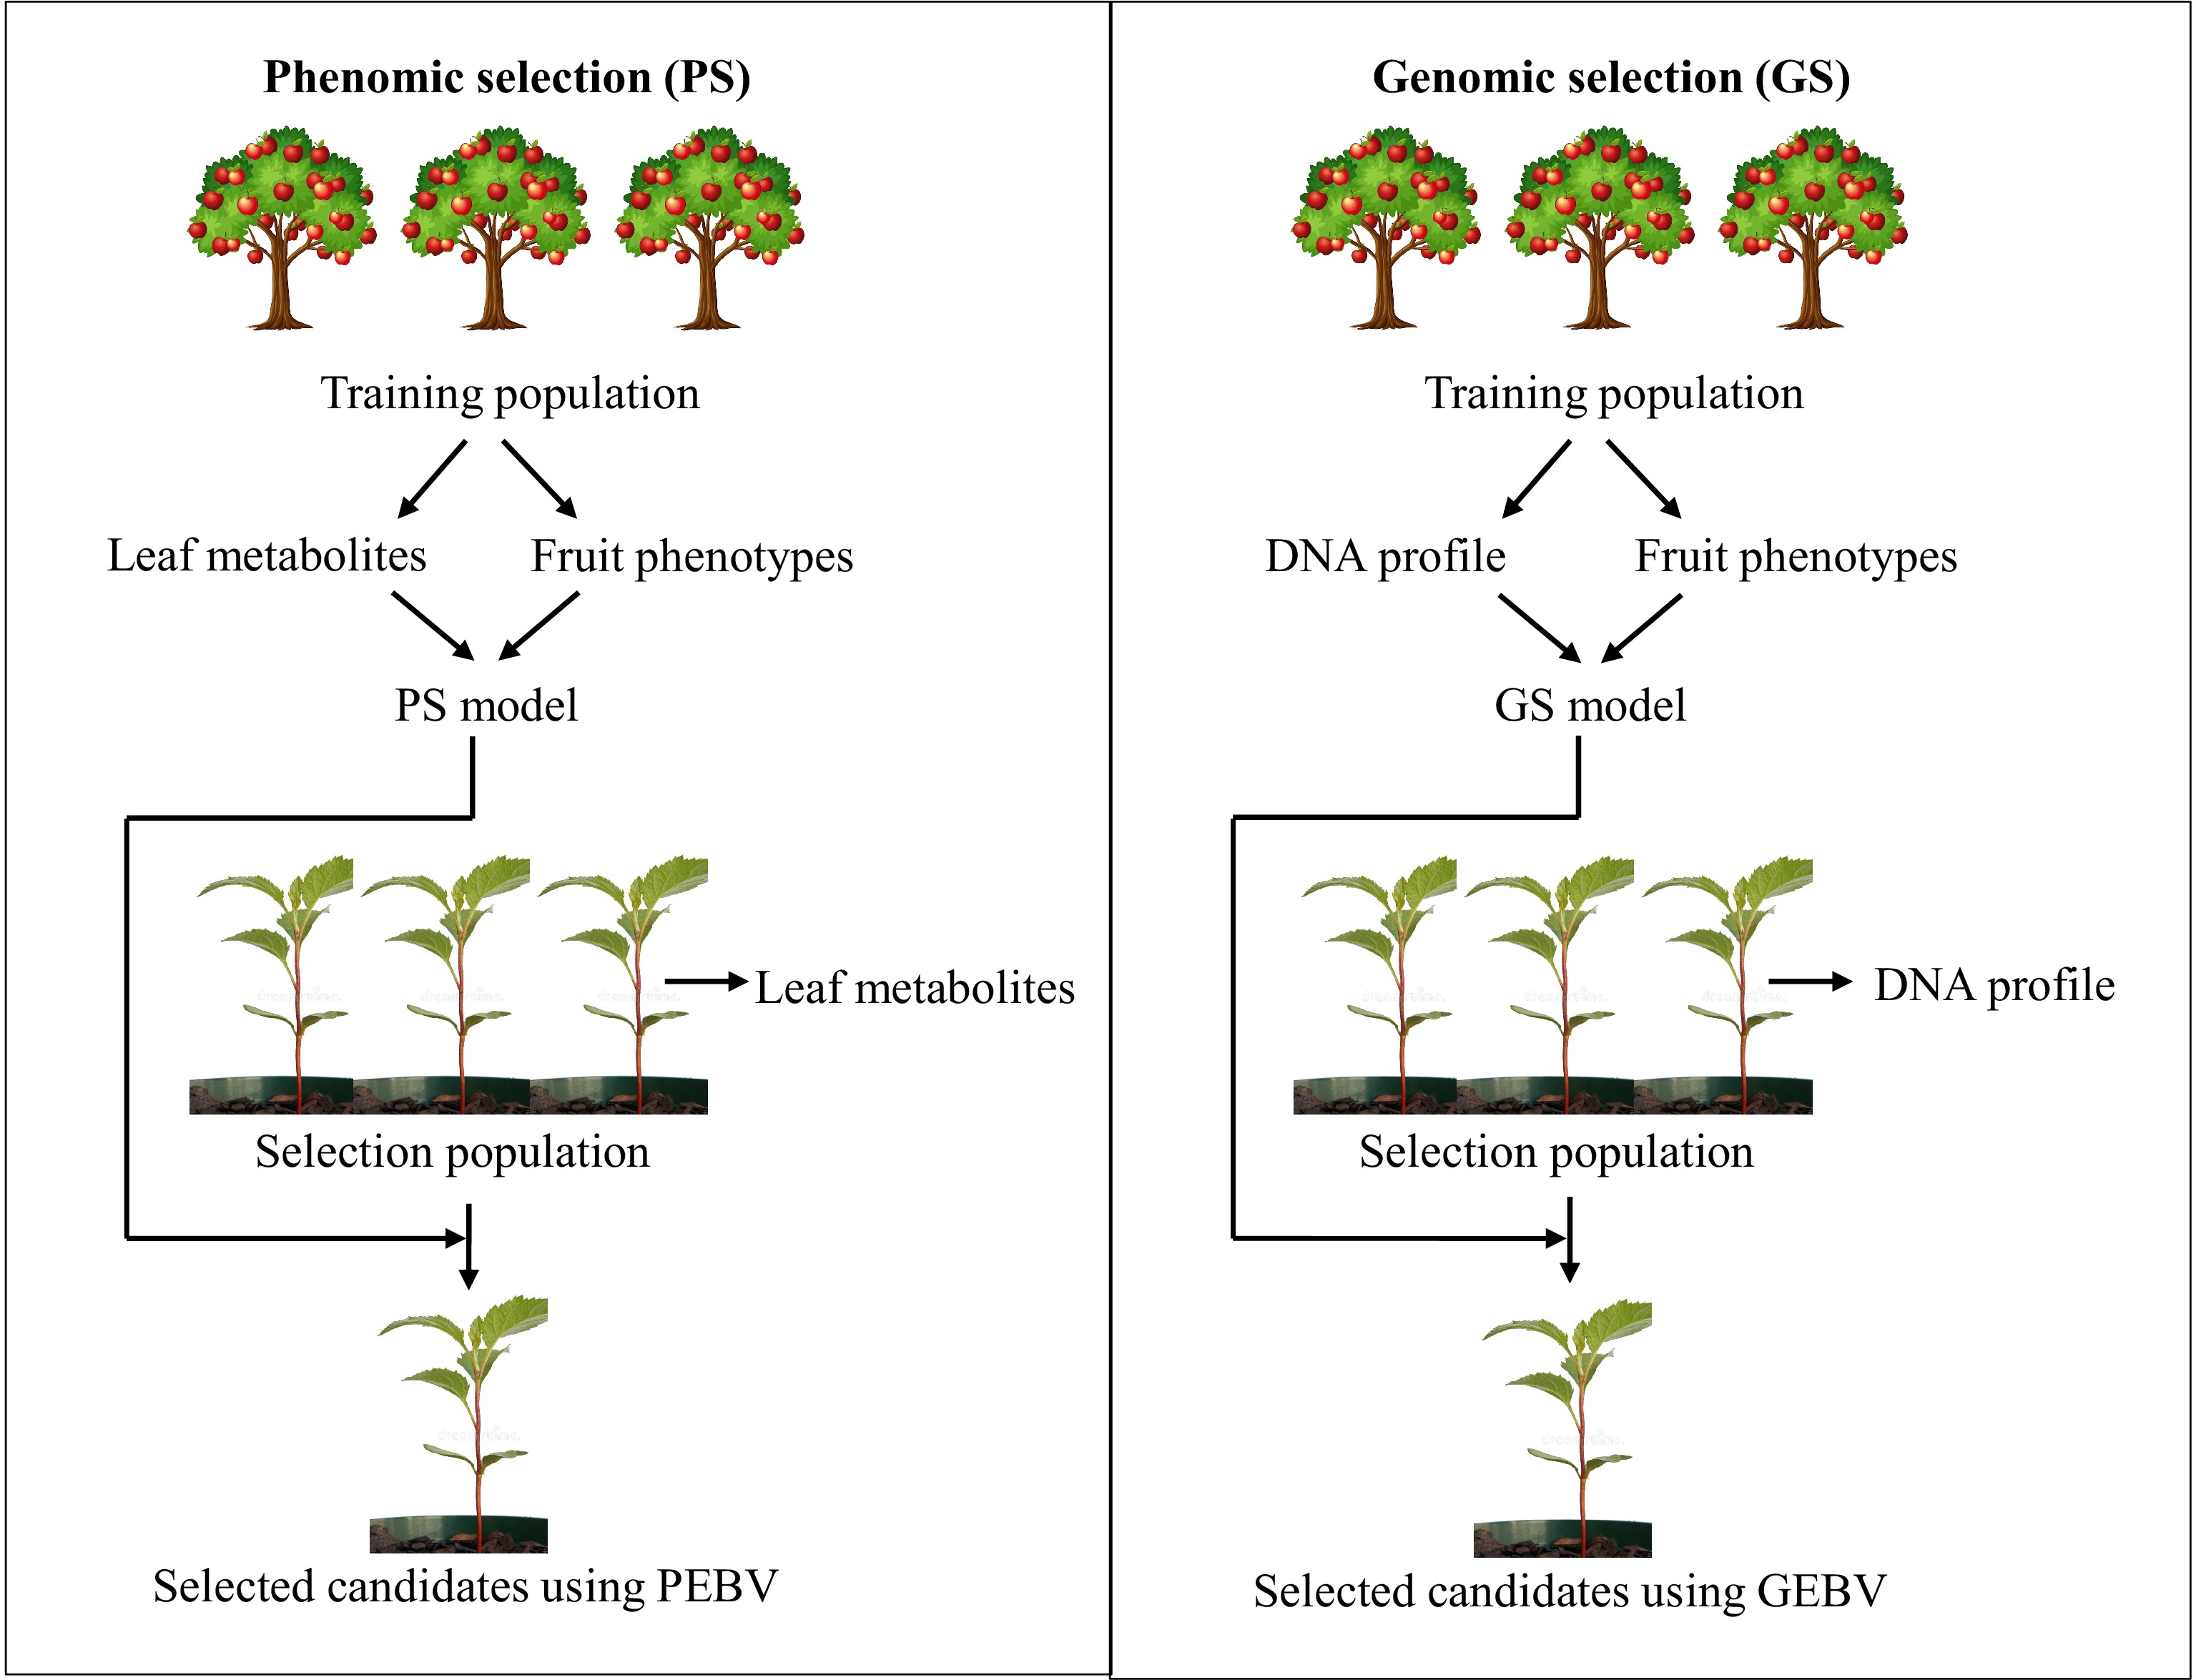
Figure 7.
Schematic presentation of the phenomic and genomic selection scheme for shortening the apple Stage 1 seedling evaluation cycle. GEBV: genomic estimated breeding value; PEBV: phenomic estimated breeding value.
-
Metabolite Group Code Q1_25% Mean Q3_75% Maximum 3-hydroxyphloridzin Chalcone 3-OHPhlz 1,709.2 3,359.5 5,036.9 14,622.6 Phloretin Chalcone Phlt 957.4 4,707.8 6,090.0 47,272.8 Phloridzin Chalcone Phlz 17,787.3 28,161.7 38,830.3 61,781.4 Sieboldin Chalcone Sb 0.0 3,174.5 1,295.1 40,078.7 Trilobatin Chalcone Tb 0.0 6,333.7 12,339.0 42,781.9 Phloretin-2'-O-xyloglucoside Chalcone xyloPhlz 136.5 493.4 615.0 3,708.7 Chlorogenic acid Cinnamic acid CGA 498.9 1,625.7 2,131.6 9,954.7 Neochlorogenic acid Cinnamic acid neoCGA 0.0 21.2 24.2 341.5 Trans-4-p-coumaroyl quinic acid Cinnamic acid t4pCouQA 23.5 268.7 430.0 1,793.8 Trans-5-p-coumaroyl quinic acid Cinnamic acid t5pCouQA 159.8 382.1 466.5 2,503.6 Epicatechin Flavanol epiCat 64.1 586.3 727.3 11,840.9 Procyanidin B1 Flavanol PCB1 0.0 7.5 11.4 107.6 Procyanidin B2 Flavanol PCB2 25.8 244.3 283.1 5,902.3 Procyanidin B5 Flavanol PCB5 8.9 73.0 87.9 1,778.6 Procyanidin B7 Flavanol PCB7 0.0 13.9 19.1 291.1 Quercetin 3-arabinopyranoside Flavonol Qarapy 1,145.5 1,817.6 2,286.6 5,133.7 Quercetin 3-galactoside Flavonol Qgal 2,322.7 3,919.9 5,350.0 11,555.3 Quercetin 3-glucoside Flavonol Qglu 1,842.3 3,558.6 4,822.7 11,907.1 Quercetin 3-rhamnoside Flavonol Qrha 3,246.0 5,595.0 7,497.8 24,610.3 Quercetin 3-rutinoside Flavonol Qrut 215.1 567.6 564.6 4,223.6 Quercetin 3-xyloside Flavonol Qxyl 512.8 871.6 1,148.7 2,678.3 Ascorbyl 2-beta-glucoside Glycoside AA-2βG 40.8 64.8 79.8 256.5 Annurcoic acid Triterpenoid AnnA 363.0 1,015.5 1,273.4 12,873.8 Betulinic acid Triterpenoid BA 16.3 33.6 47.7 105.6 Ursolic acid Triterpenoid UA 274.1 518.4 739.6 1,102.2 Table 1.
Distribution of the content (μg/g) of leaf metabolites. Q1_25% and Q3_75% represent the 25th and 75th percentile, respectively.
-
Trait (unit) Code Q1_25% Mean Q3_75% Maximum Ascorbyl 2-beta-glucoside (μg/g) AA-2βG 0.7 122.7 187.2 1,317.5 Trilobatin (μg/g) Tb 0.0 4.2 2.3 107.2 Size (1–9 scale) SIZE 1.0 4.0 6.0 9.0 Sweetness (0–9 scale) SWEET 1.0 2.7 4.0 6.0 Sourness (0–9 scale) SOUR 2.6 3.8 5.0 7.0 Astringency (0–9 scale) ASTR 0.0 1.0 1.5 7.0 Eating quality (0–9 scale) EQUAL 2.0 2.7 3.7 5.3 Table 2.
Distribution of the content of fruit-derived traits. Q1_25% and Q3_75% represent the 25th and 75th percentile, respectively.
Figures
(7)
Tables
(2)