-
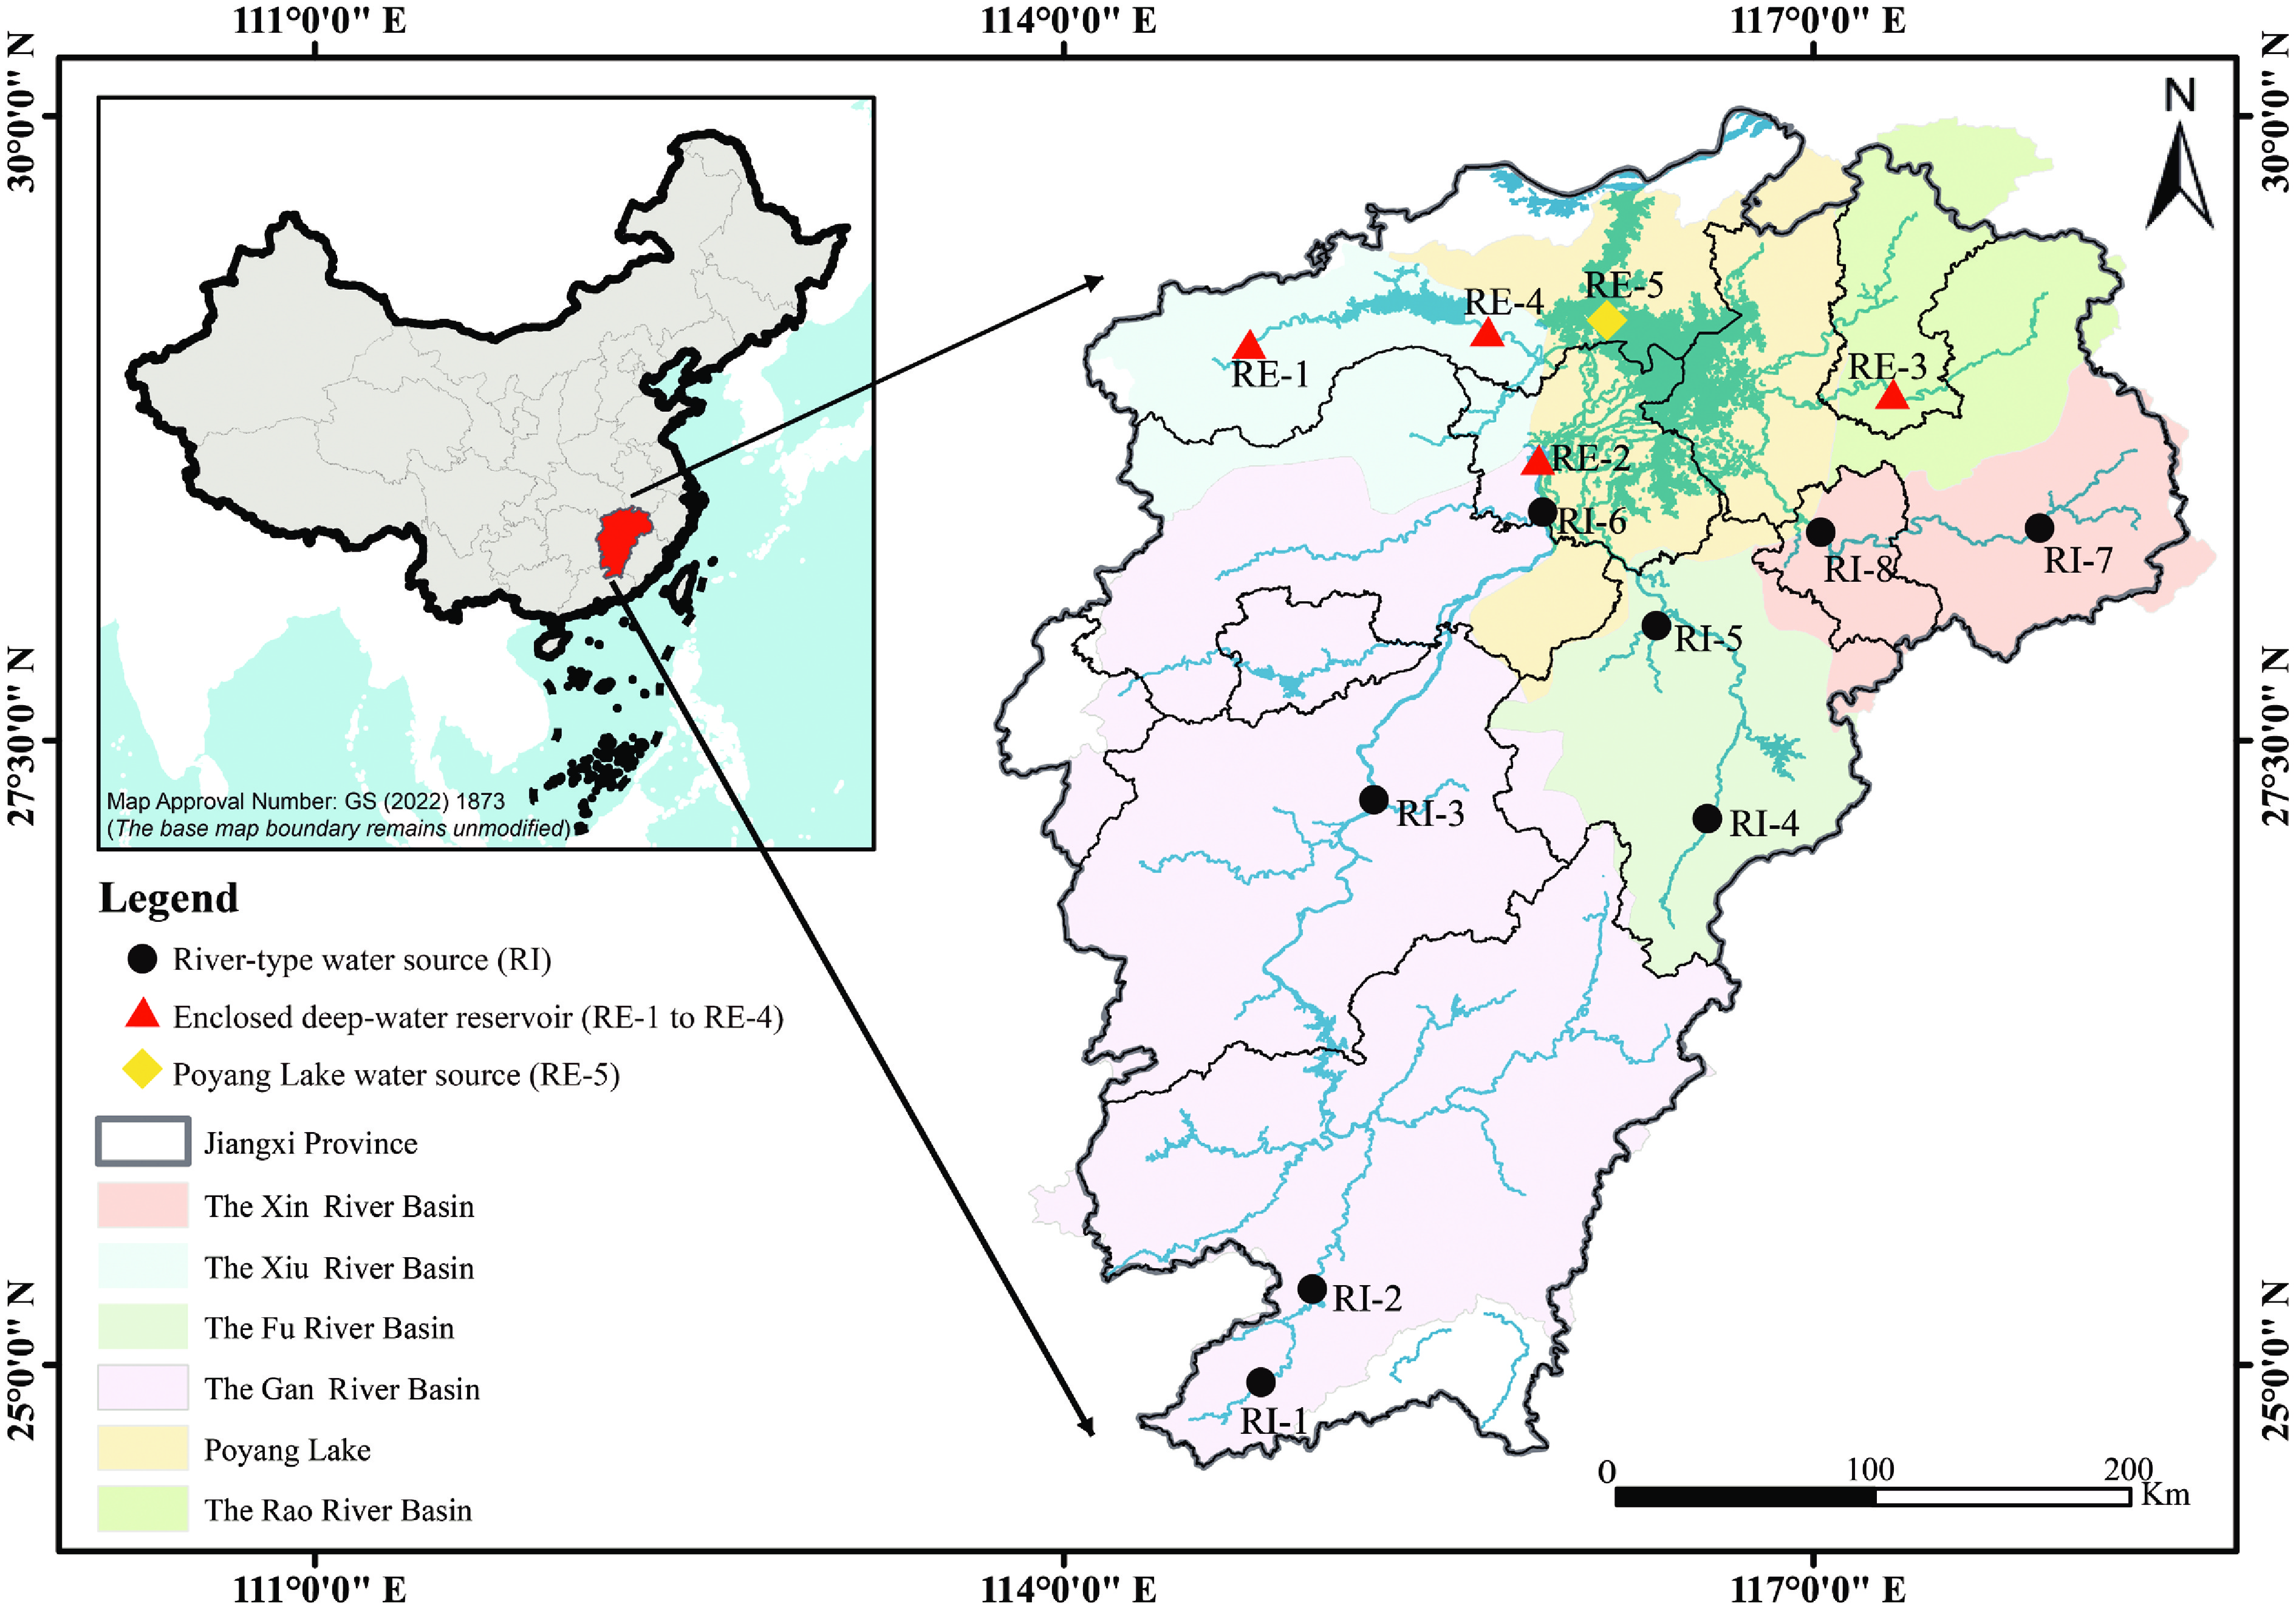
Figure 1.
Sampling sites for drinking water sources in the Poyang Lake and its five river basins. The colored areas represent the watershed boundaries delineated by hydrological criteria, which do not fully coincide with the administrative boundary of Jiangxi Province. RE-5 represents the Poyang Lake open-lake water source, which is hydrologically different from the enclosed deep-water reservoirs RE-1 to RE-4.
-
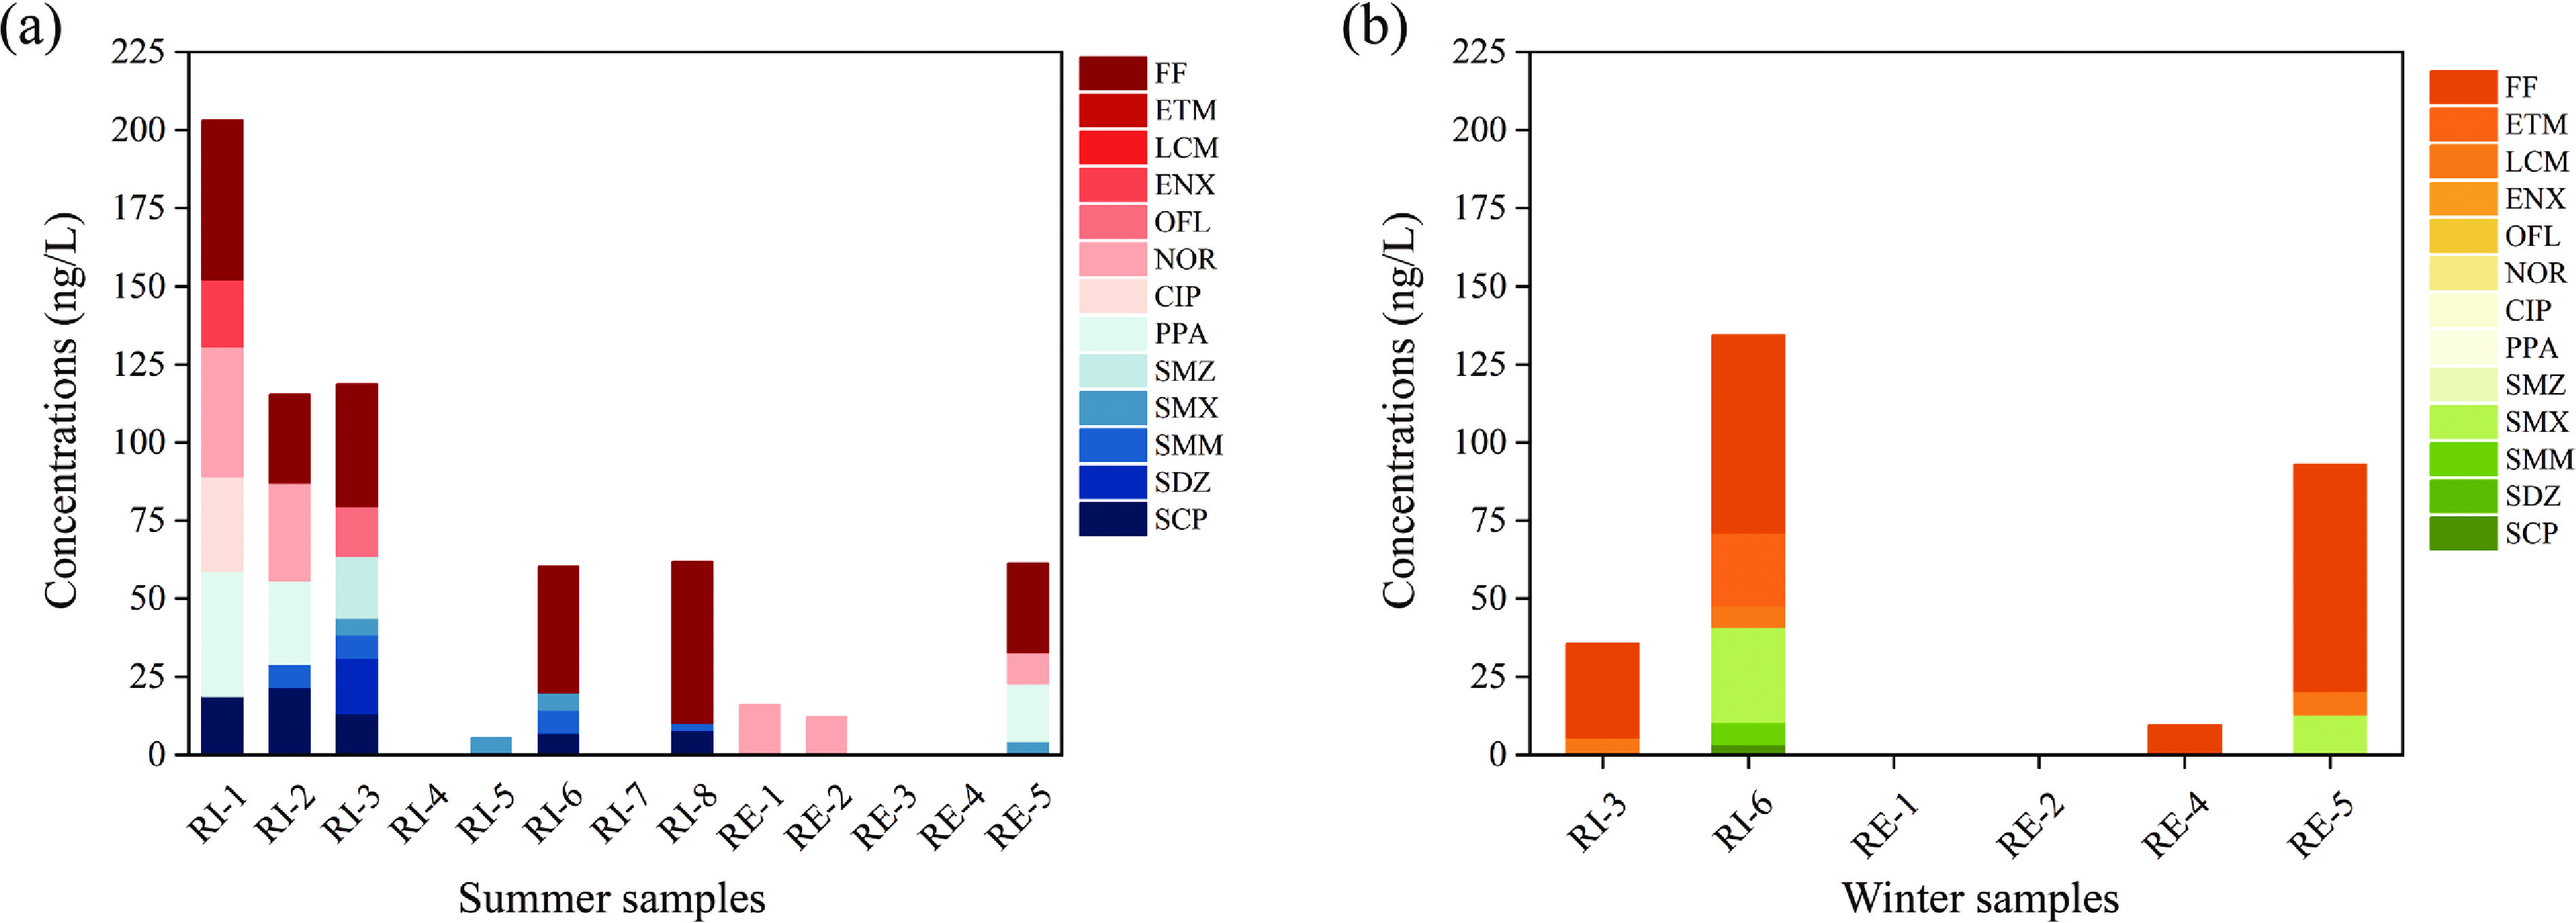
Figure 2.
Characteristics of antibiotic detection in drinking water sources in the Poyang Lake basin across different seasons. RI denotes river-type drinking water sources; RE represents reservoir-type drinking water sources.
-
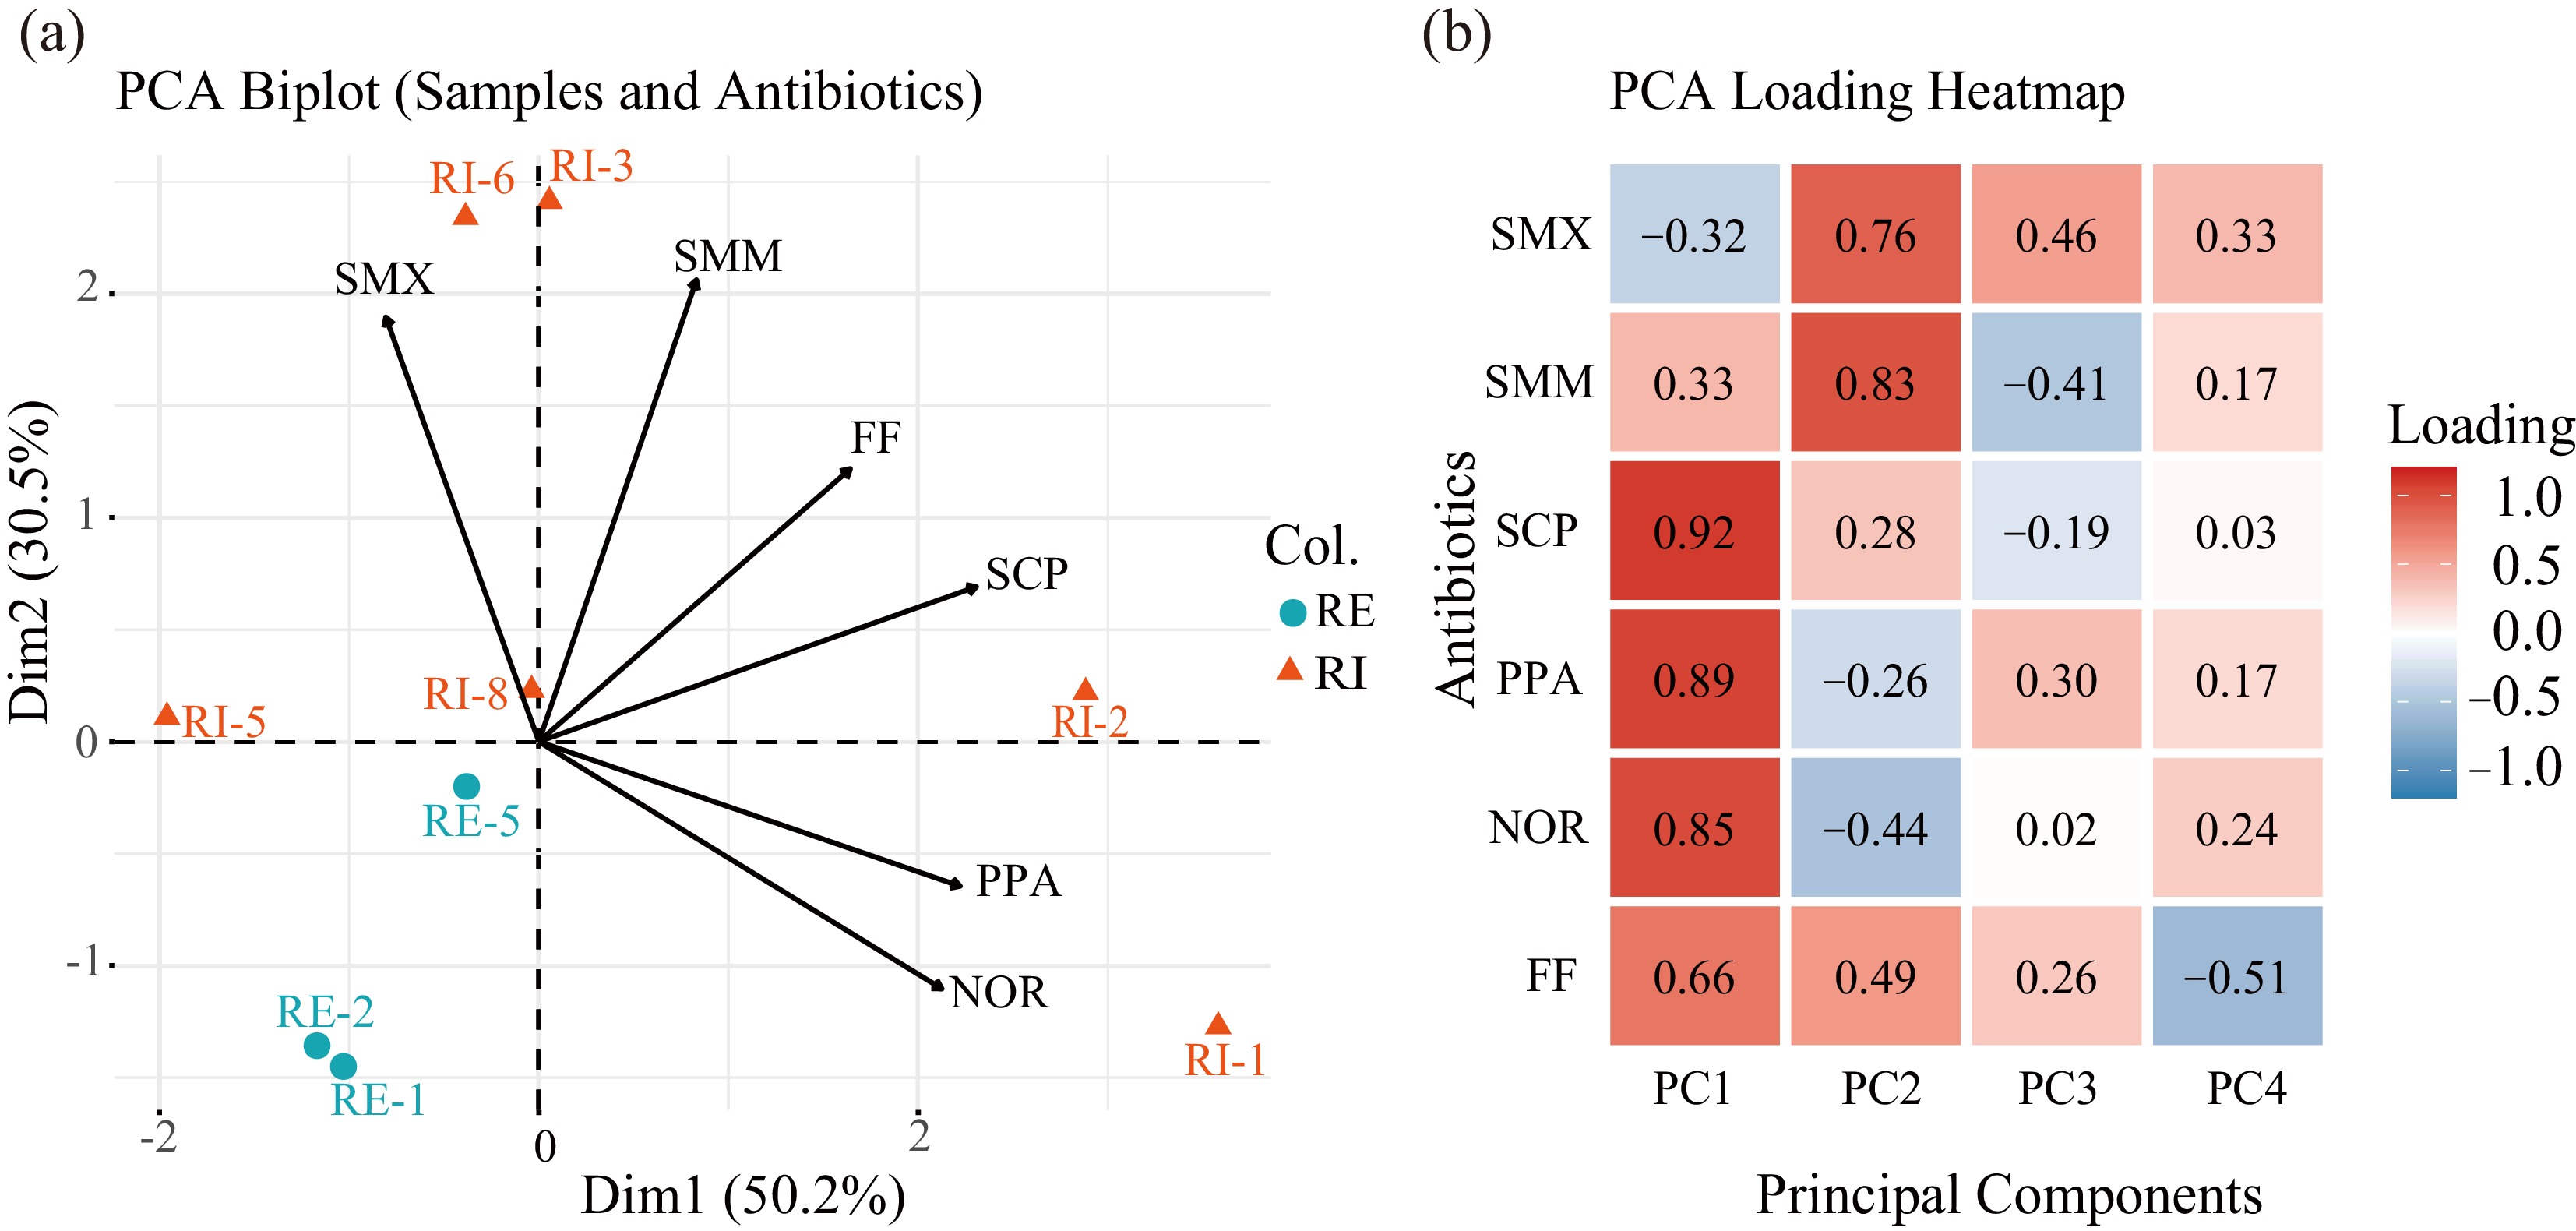
Figure 3.
Principal component analysis (PCA) of typical detected antibiotics in the Poyang Lake basin: (a) biplot; (b) loading heatmap. RI denotes river-type drinking water sources; RE represents reservoir-type drinking water sources.
-
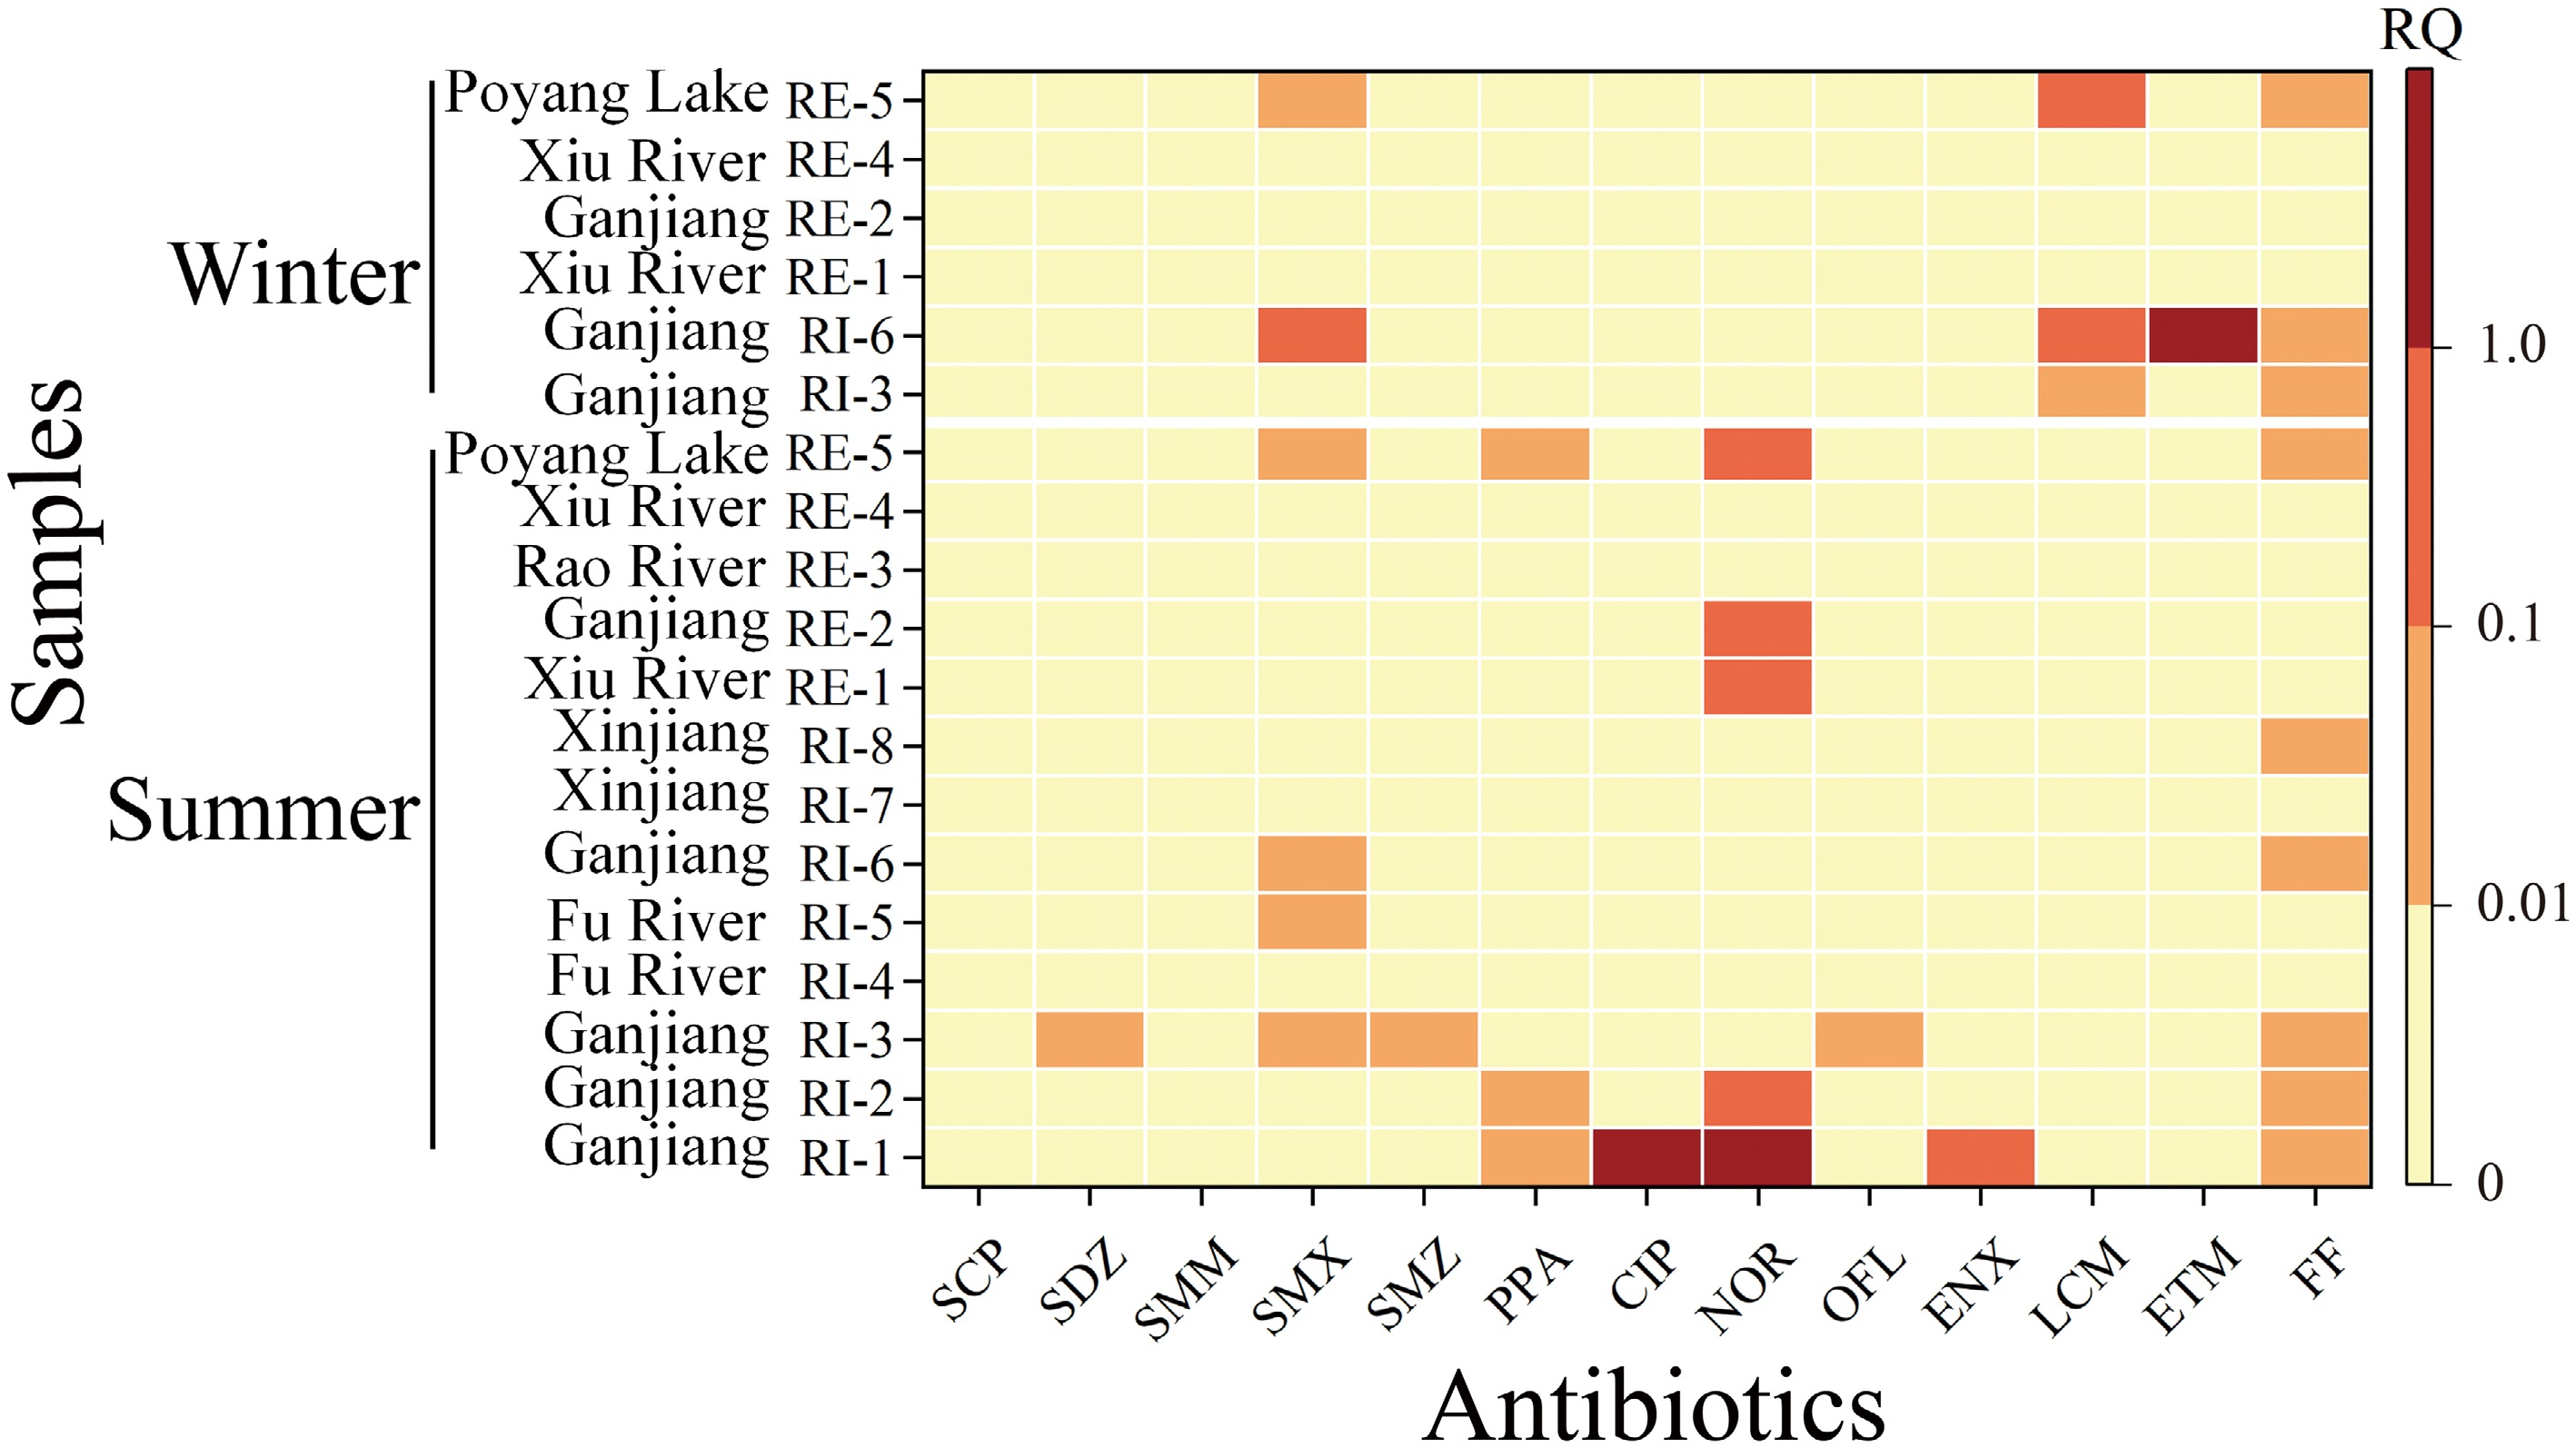
Figure 4.
Ecological risk quotients (RQs) of antibiotics in source water of the Poyang Lake basin. RI denotes river-type drinking water sources; RE represents reservoir-type drinking water sources.
-
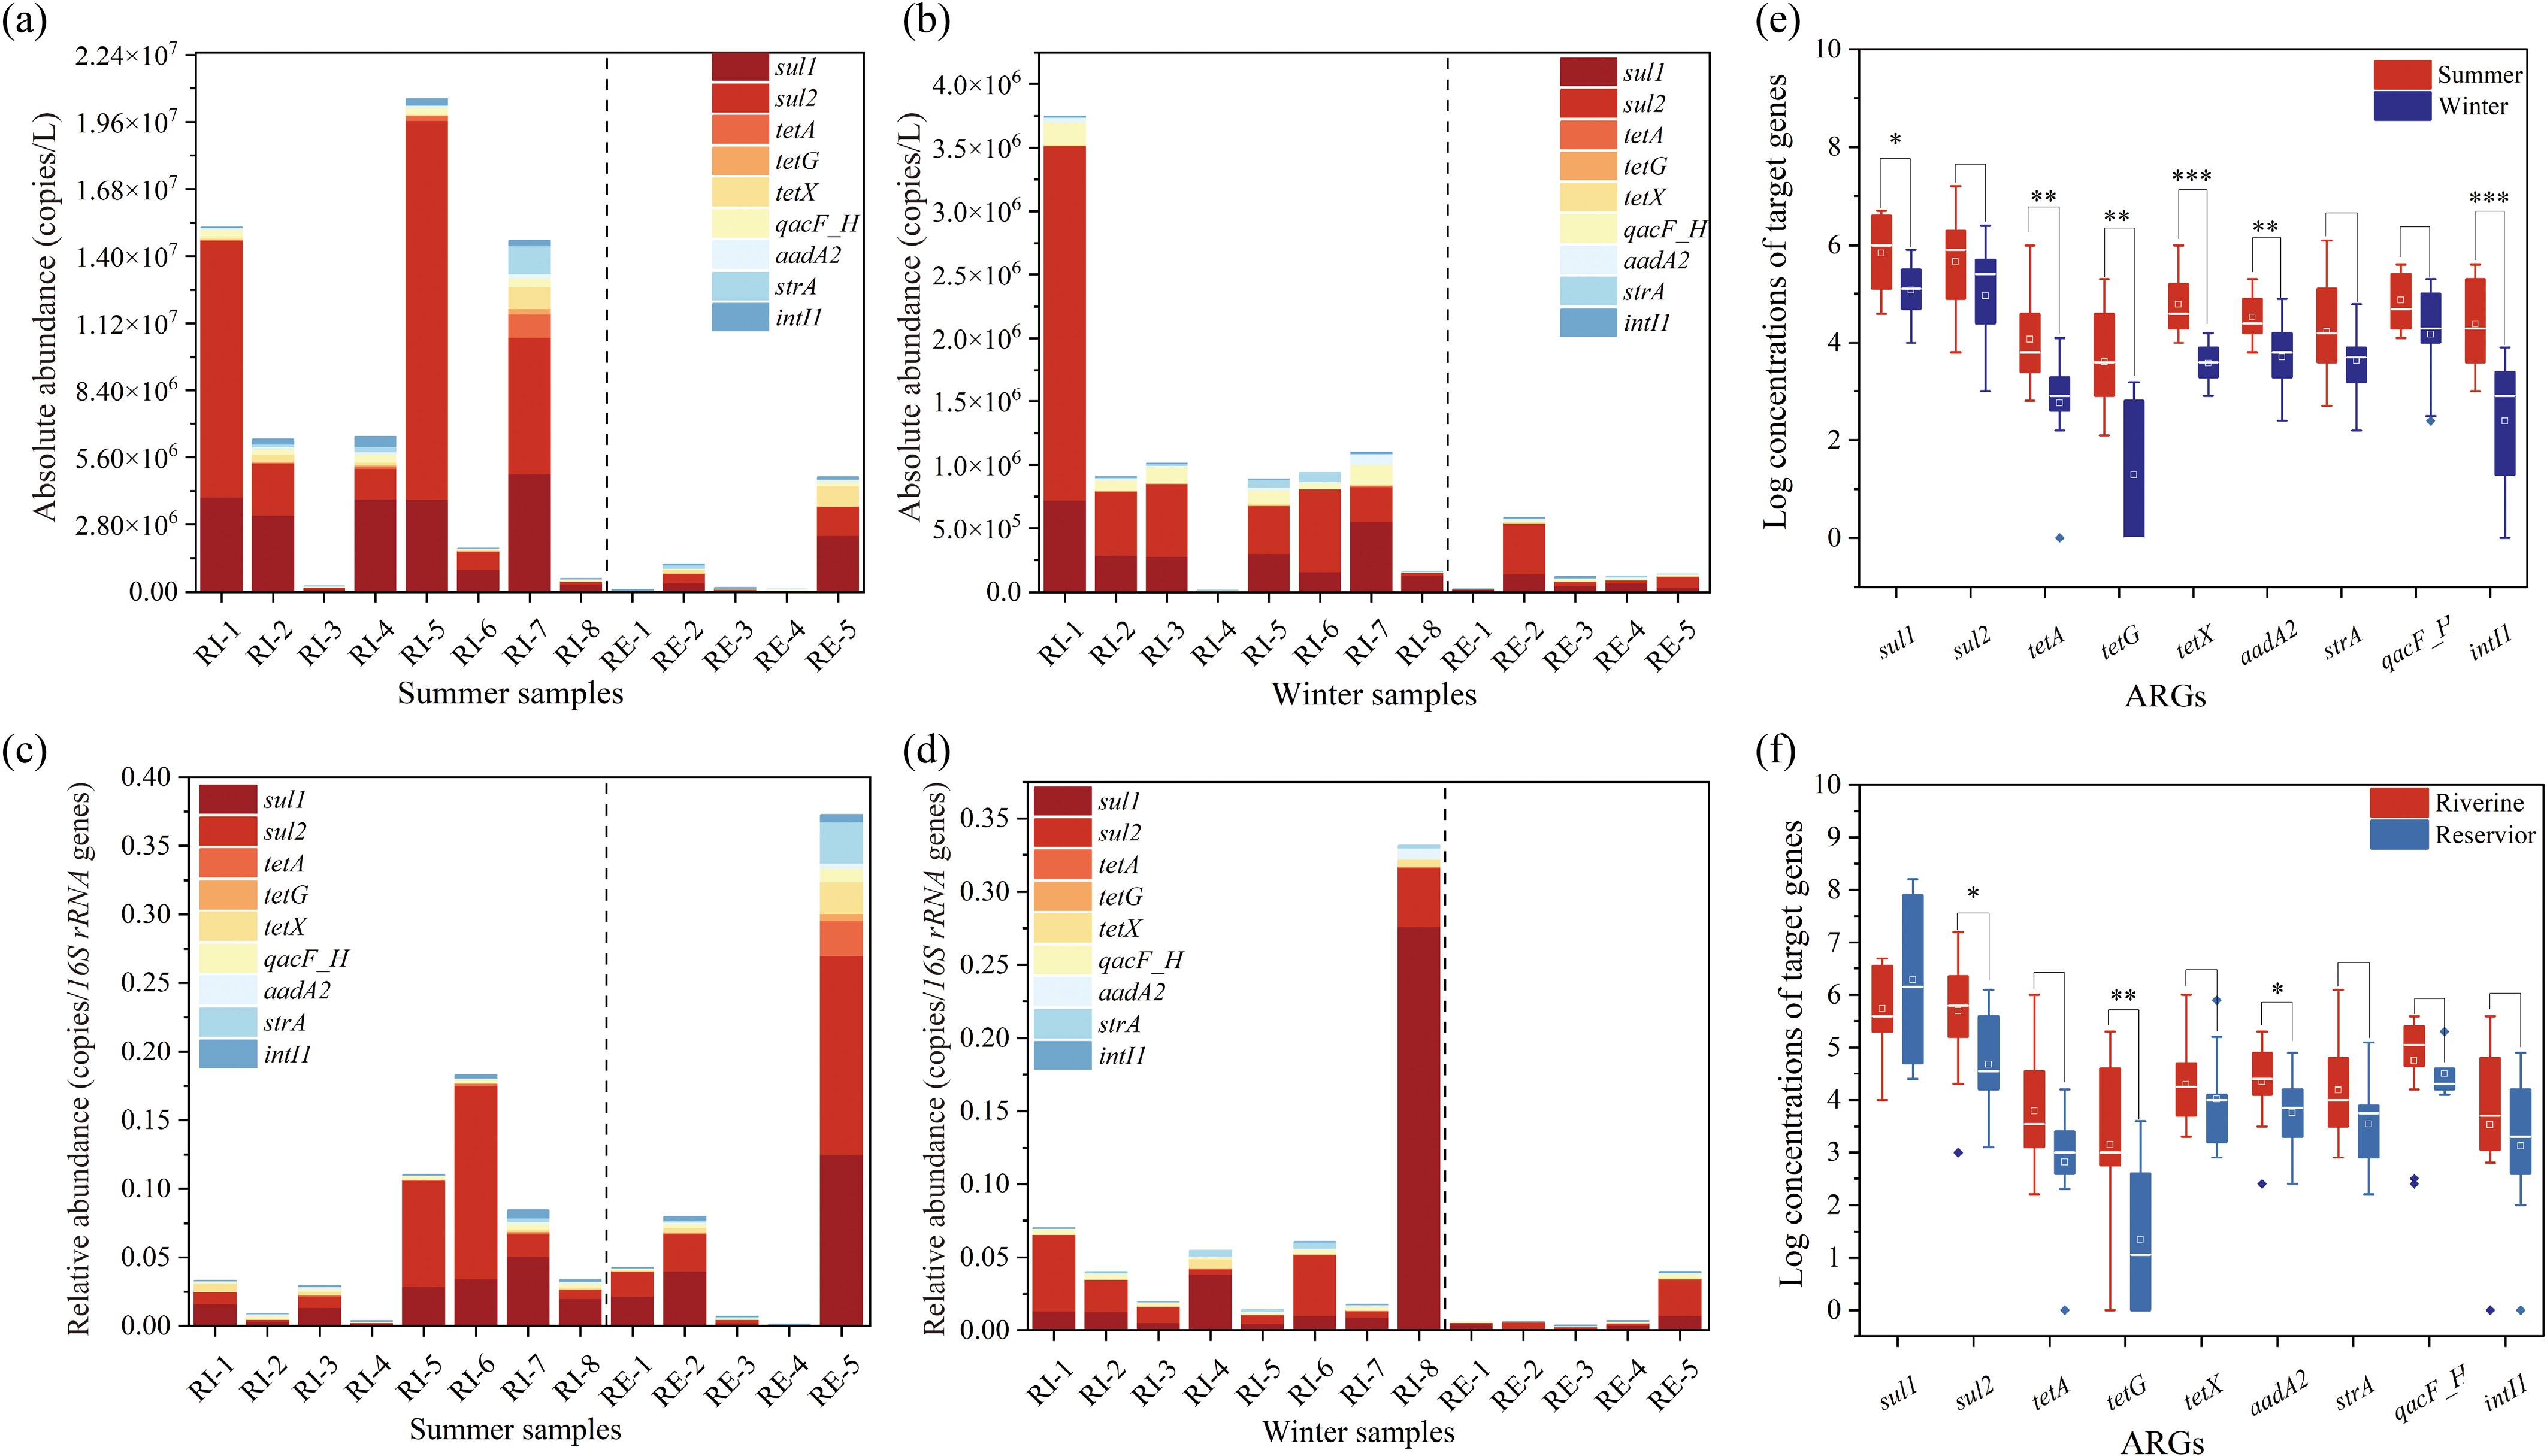
Figure 5.
Distribution of ARGs in drinking water sources of the Poyang Lake basin: (a), (b) absolute abundance of ARGs in summer and winter samples; (c), (d) relative abundance of ARGs in summer and winter samples; (e), (f) seasonal and water source type box plots for ARGs. RI denotes river-type water sources, and RE denotes reservoir-type water sources.
-
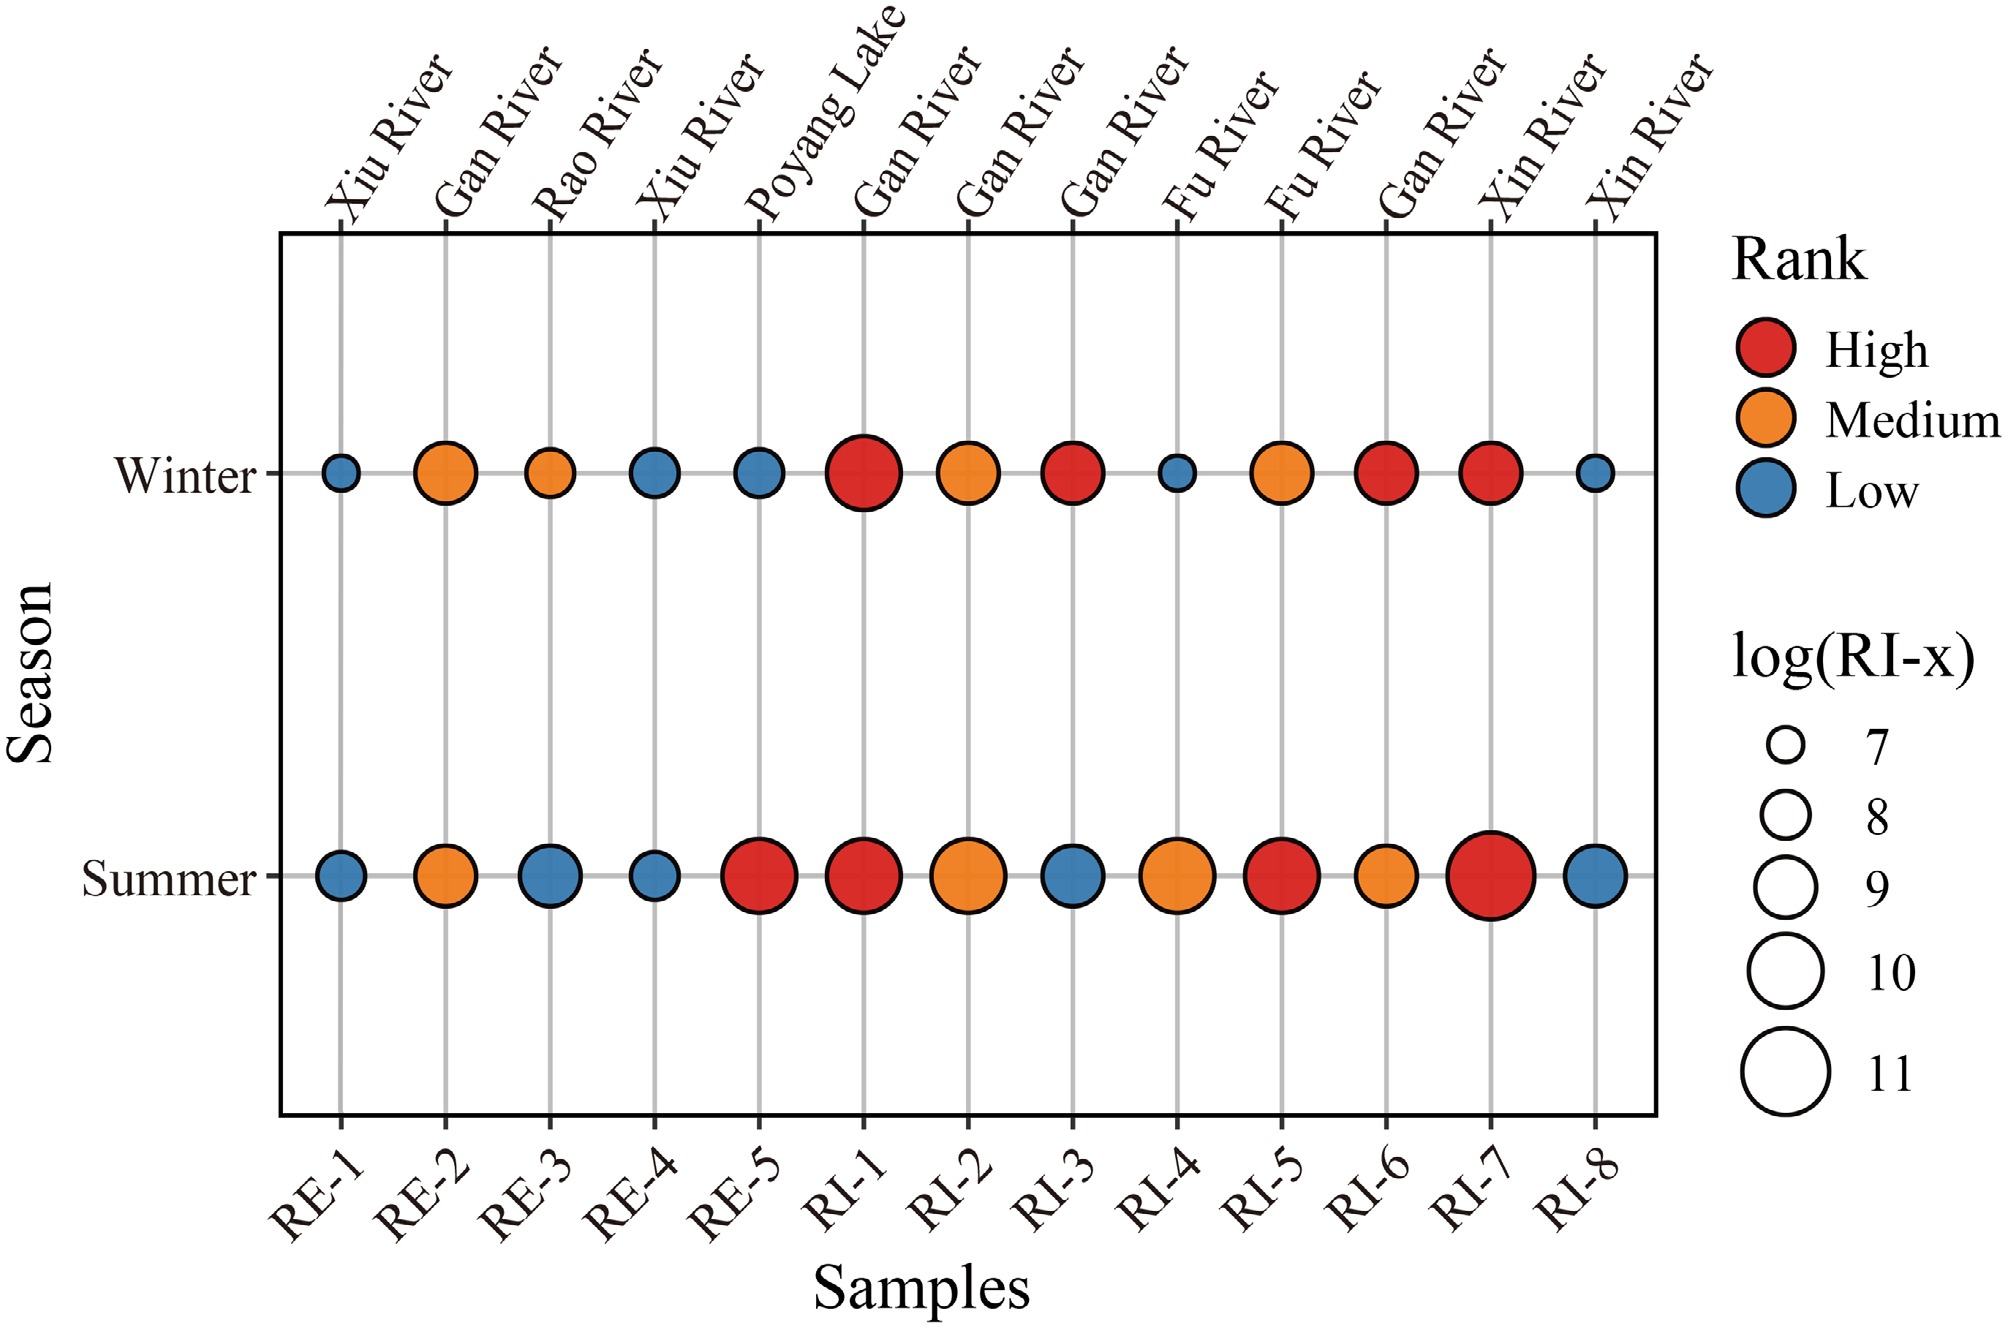
Figure 6.
Risk Index (RI-x) values and risk levels for drinking water sources in the Poyang Lake basin. RI-x denotes river-type water sources, while RE-x denotes reservoir-type water sources.
-
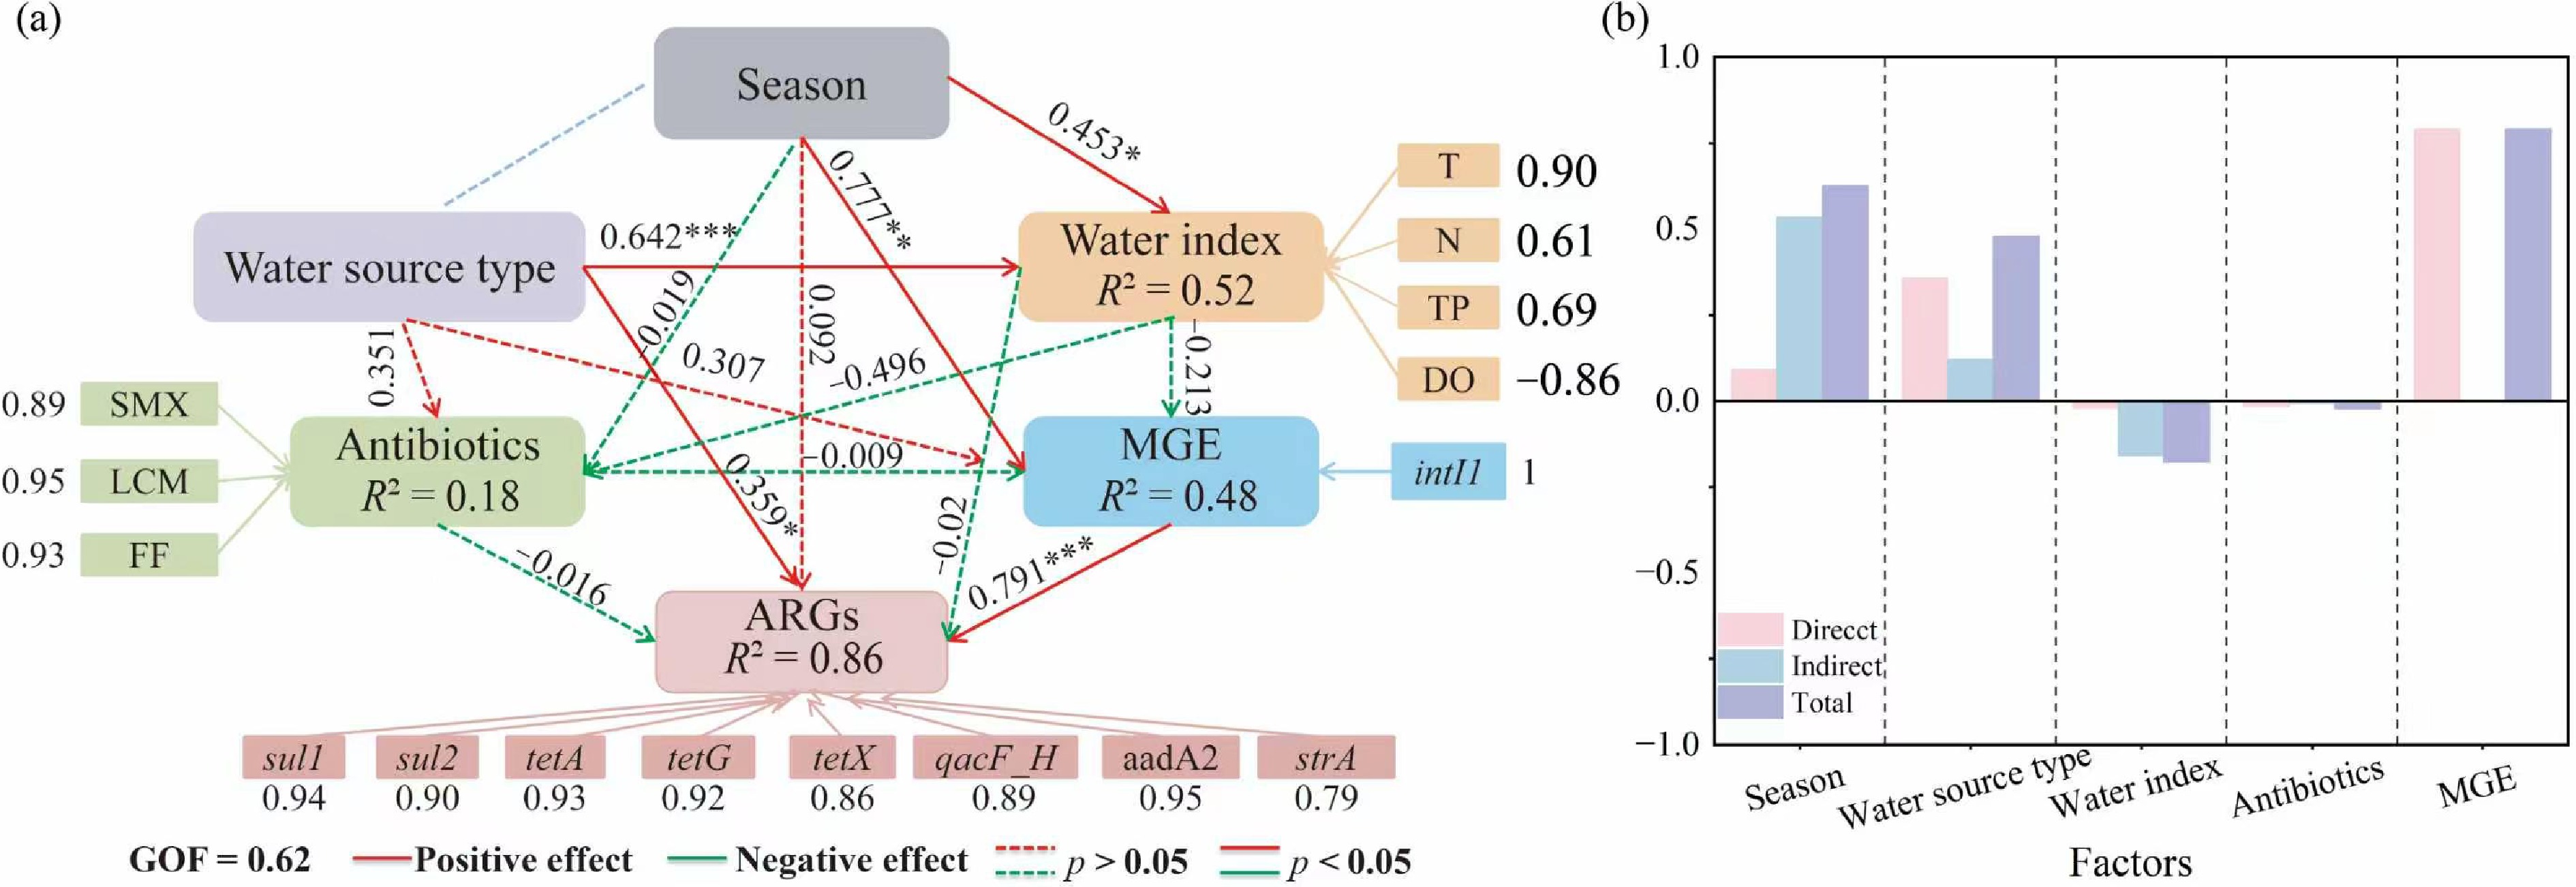
Figure 7.
The partial least squares path model (PLS-PM) based on ARGs: (a) PLS-PM describing the relationship between season, location, water index, antibiotics, MGE, and ARGs. Red and green arrows represent positive and negative effects, respectively. Solid and dashed arrows indicate statistical significance and non-significance, respectively. Statistical significance is indicated by * p < 0.05, ** p < 0.01, and *** p < 0.001. The numbers on each narrow indicate the correlation coefficient values. R2 values show the proportion of variance explained for each factor. (b) Standardized effects of each factor on the ARG abundance.
-
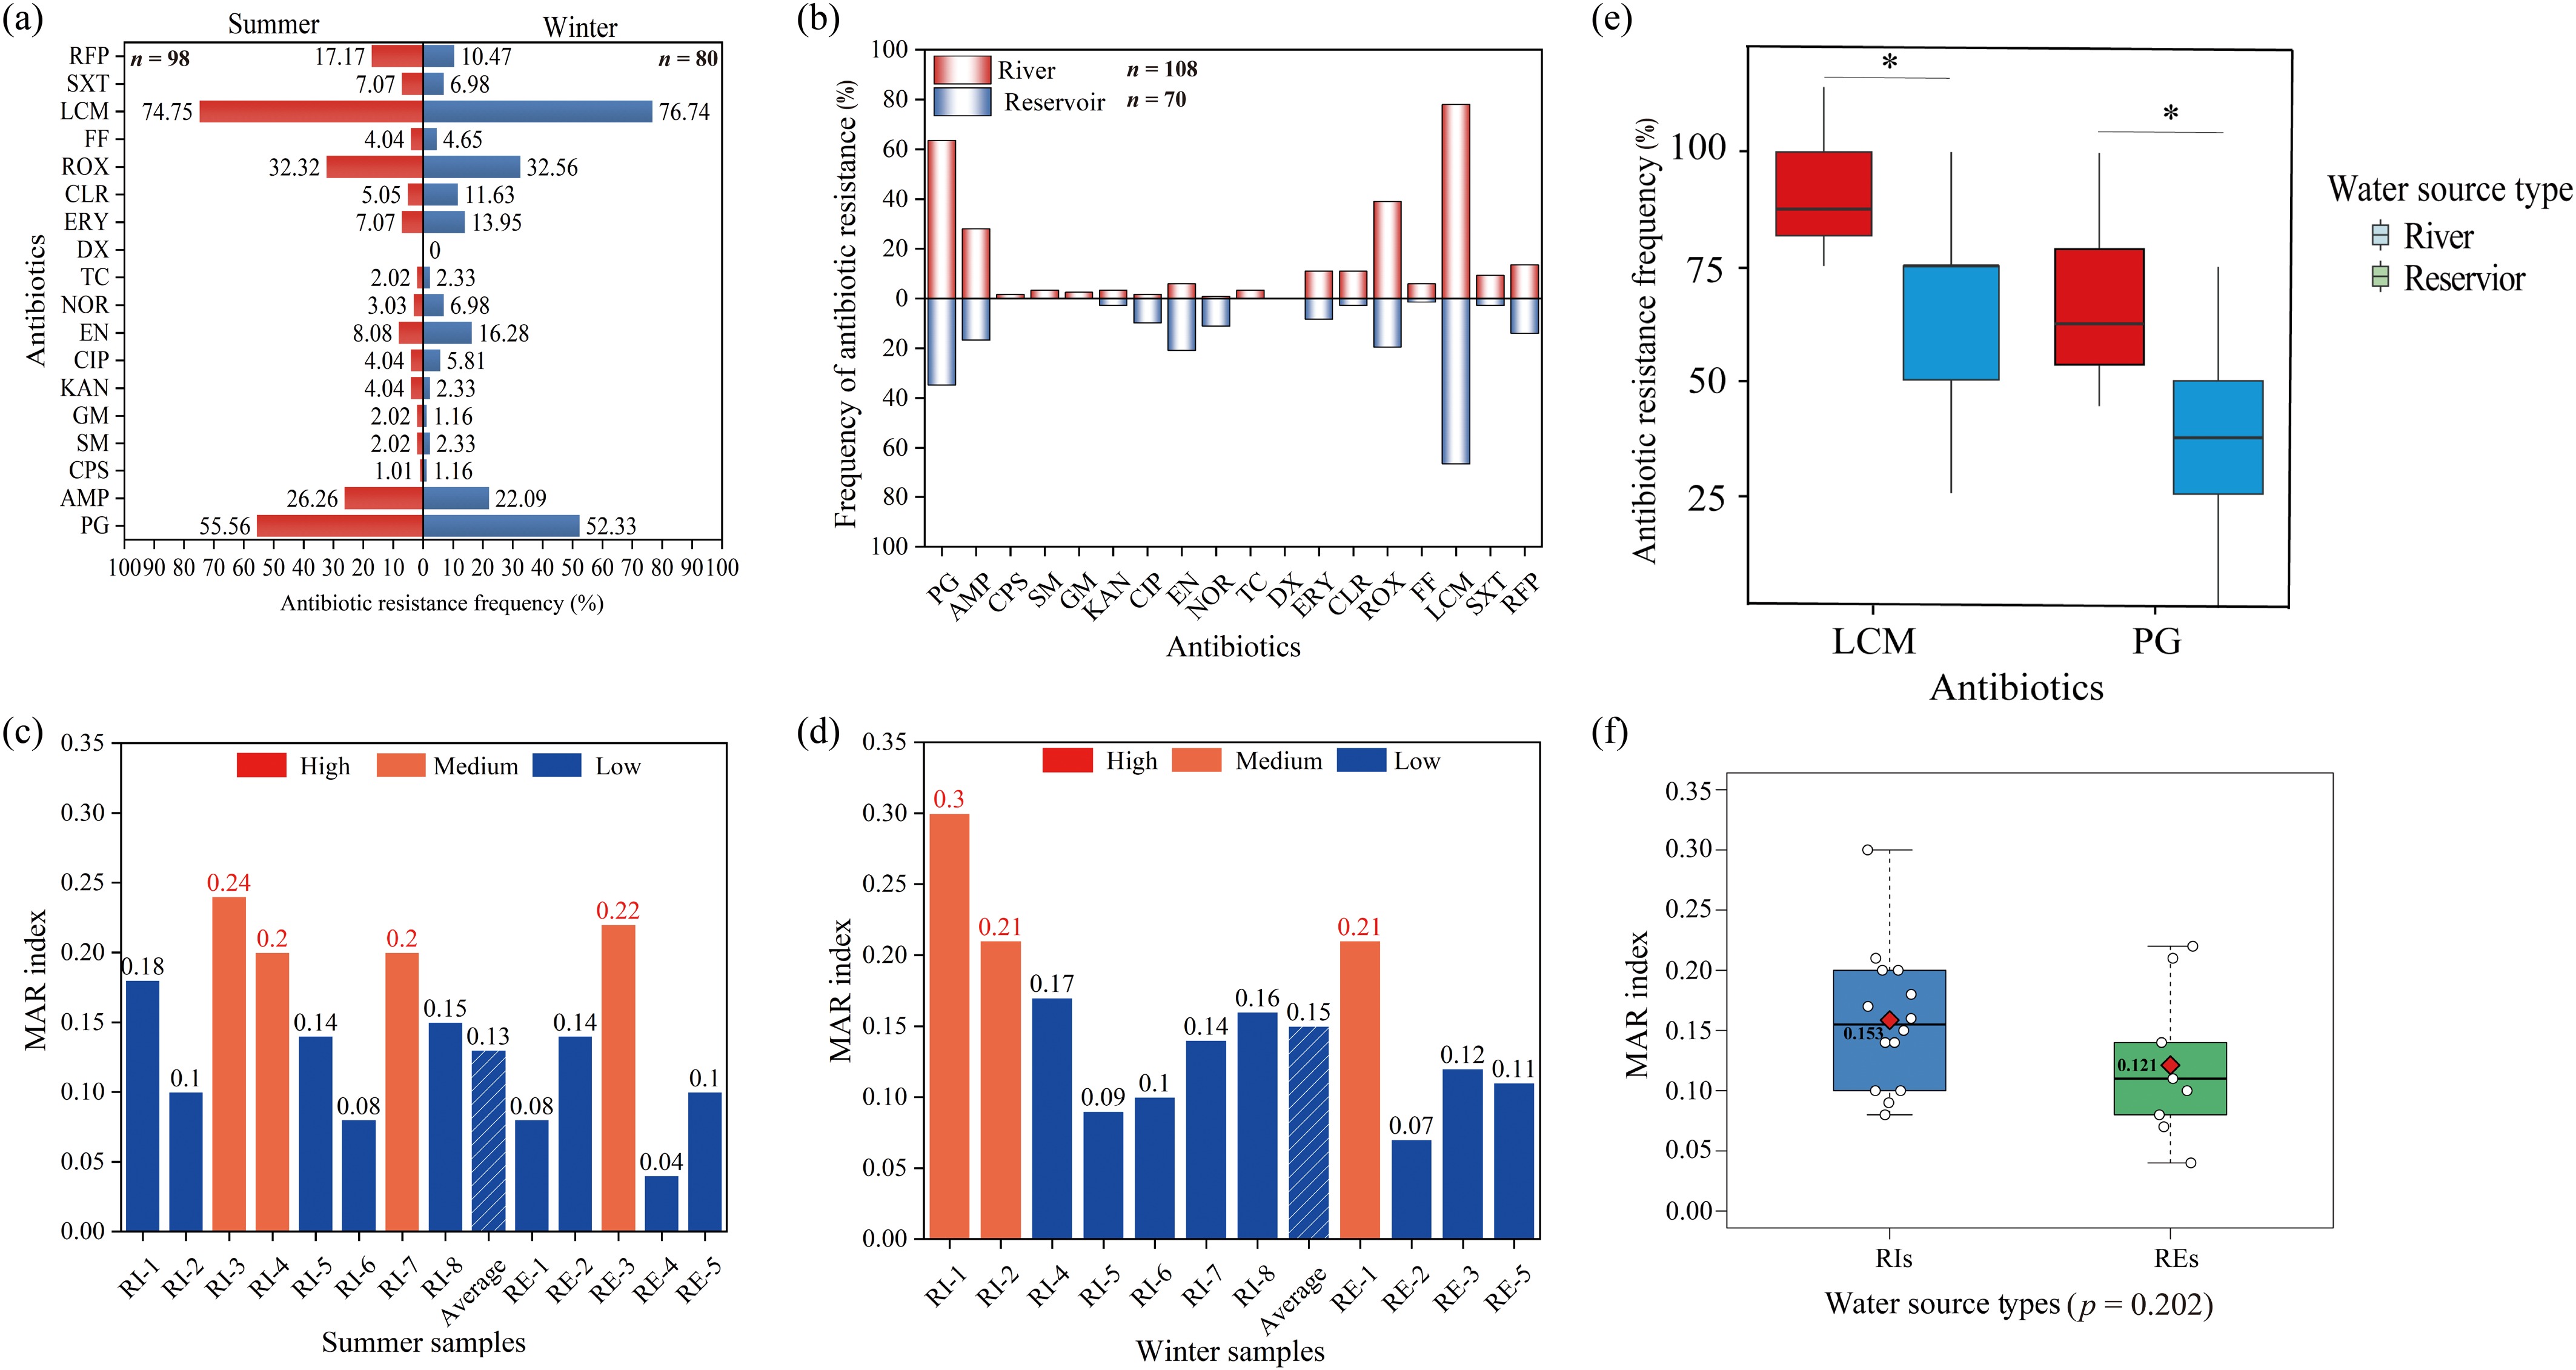
Figure 8.
Antimicrobial resistance characteristics of bacterial strains isolated from drinking water sources in the Poyang Lake basin: (a) resistance frequencies to different antibiotics among strains isolated during summer and winter; (b) antibiotic resistance frequencies among isolates from river-type and reservoir-type samples; (c) differential analysis of antibiotic resistance frequency in river-type and reservoir-type water sources (significant antibiotic screening); (d), (e) MAR index for all bacteria across sample types; (f) comparison of MAR Indexes for river-type and reservoir-type water sources. The points in the figure represent the observed values at each sampling point, with the red diamond symbols denoting the group means. RI denotes river-type water sources; RE denotes reservoir-type water sources.
-
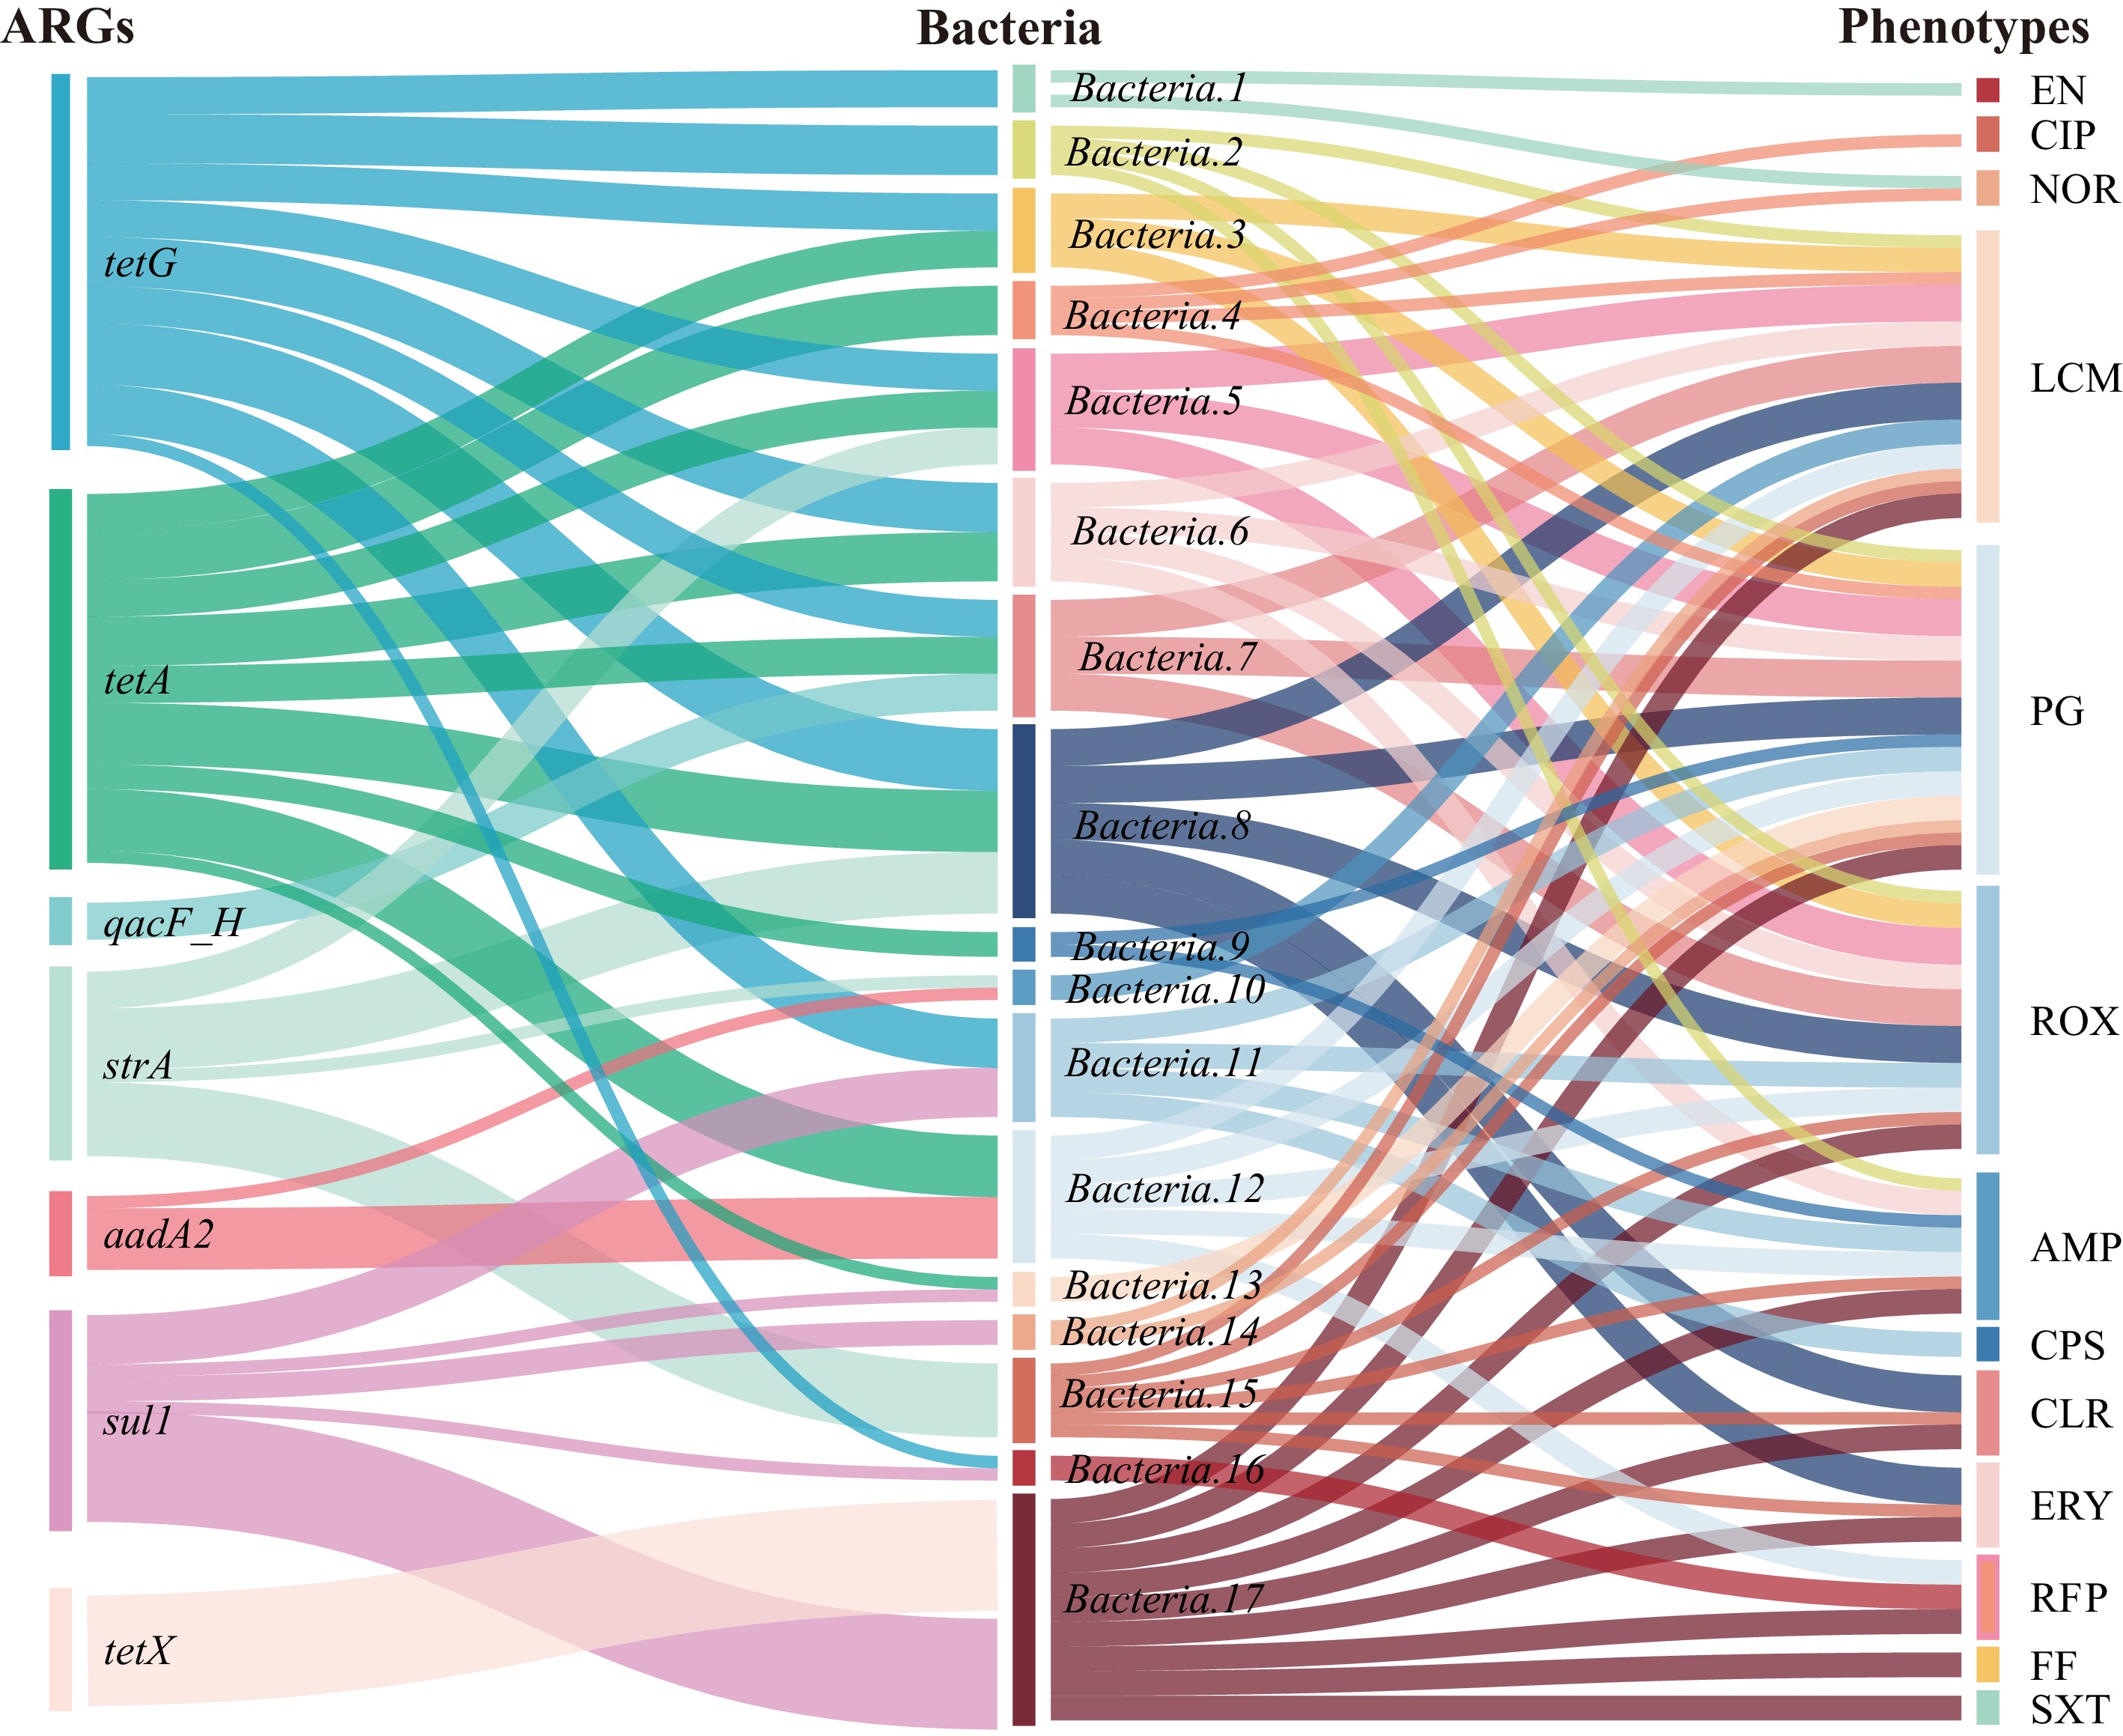
Figure 9.
Sankey diagram illustrating the association between ARGs and resistance phenotypes in typical pathogenic bacteria from drinking water sources in the Poyang Lake basin.
Figures
(9)
Tables
(0)