-
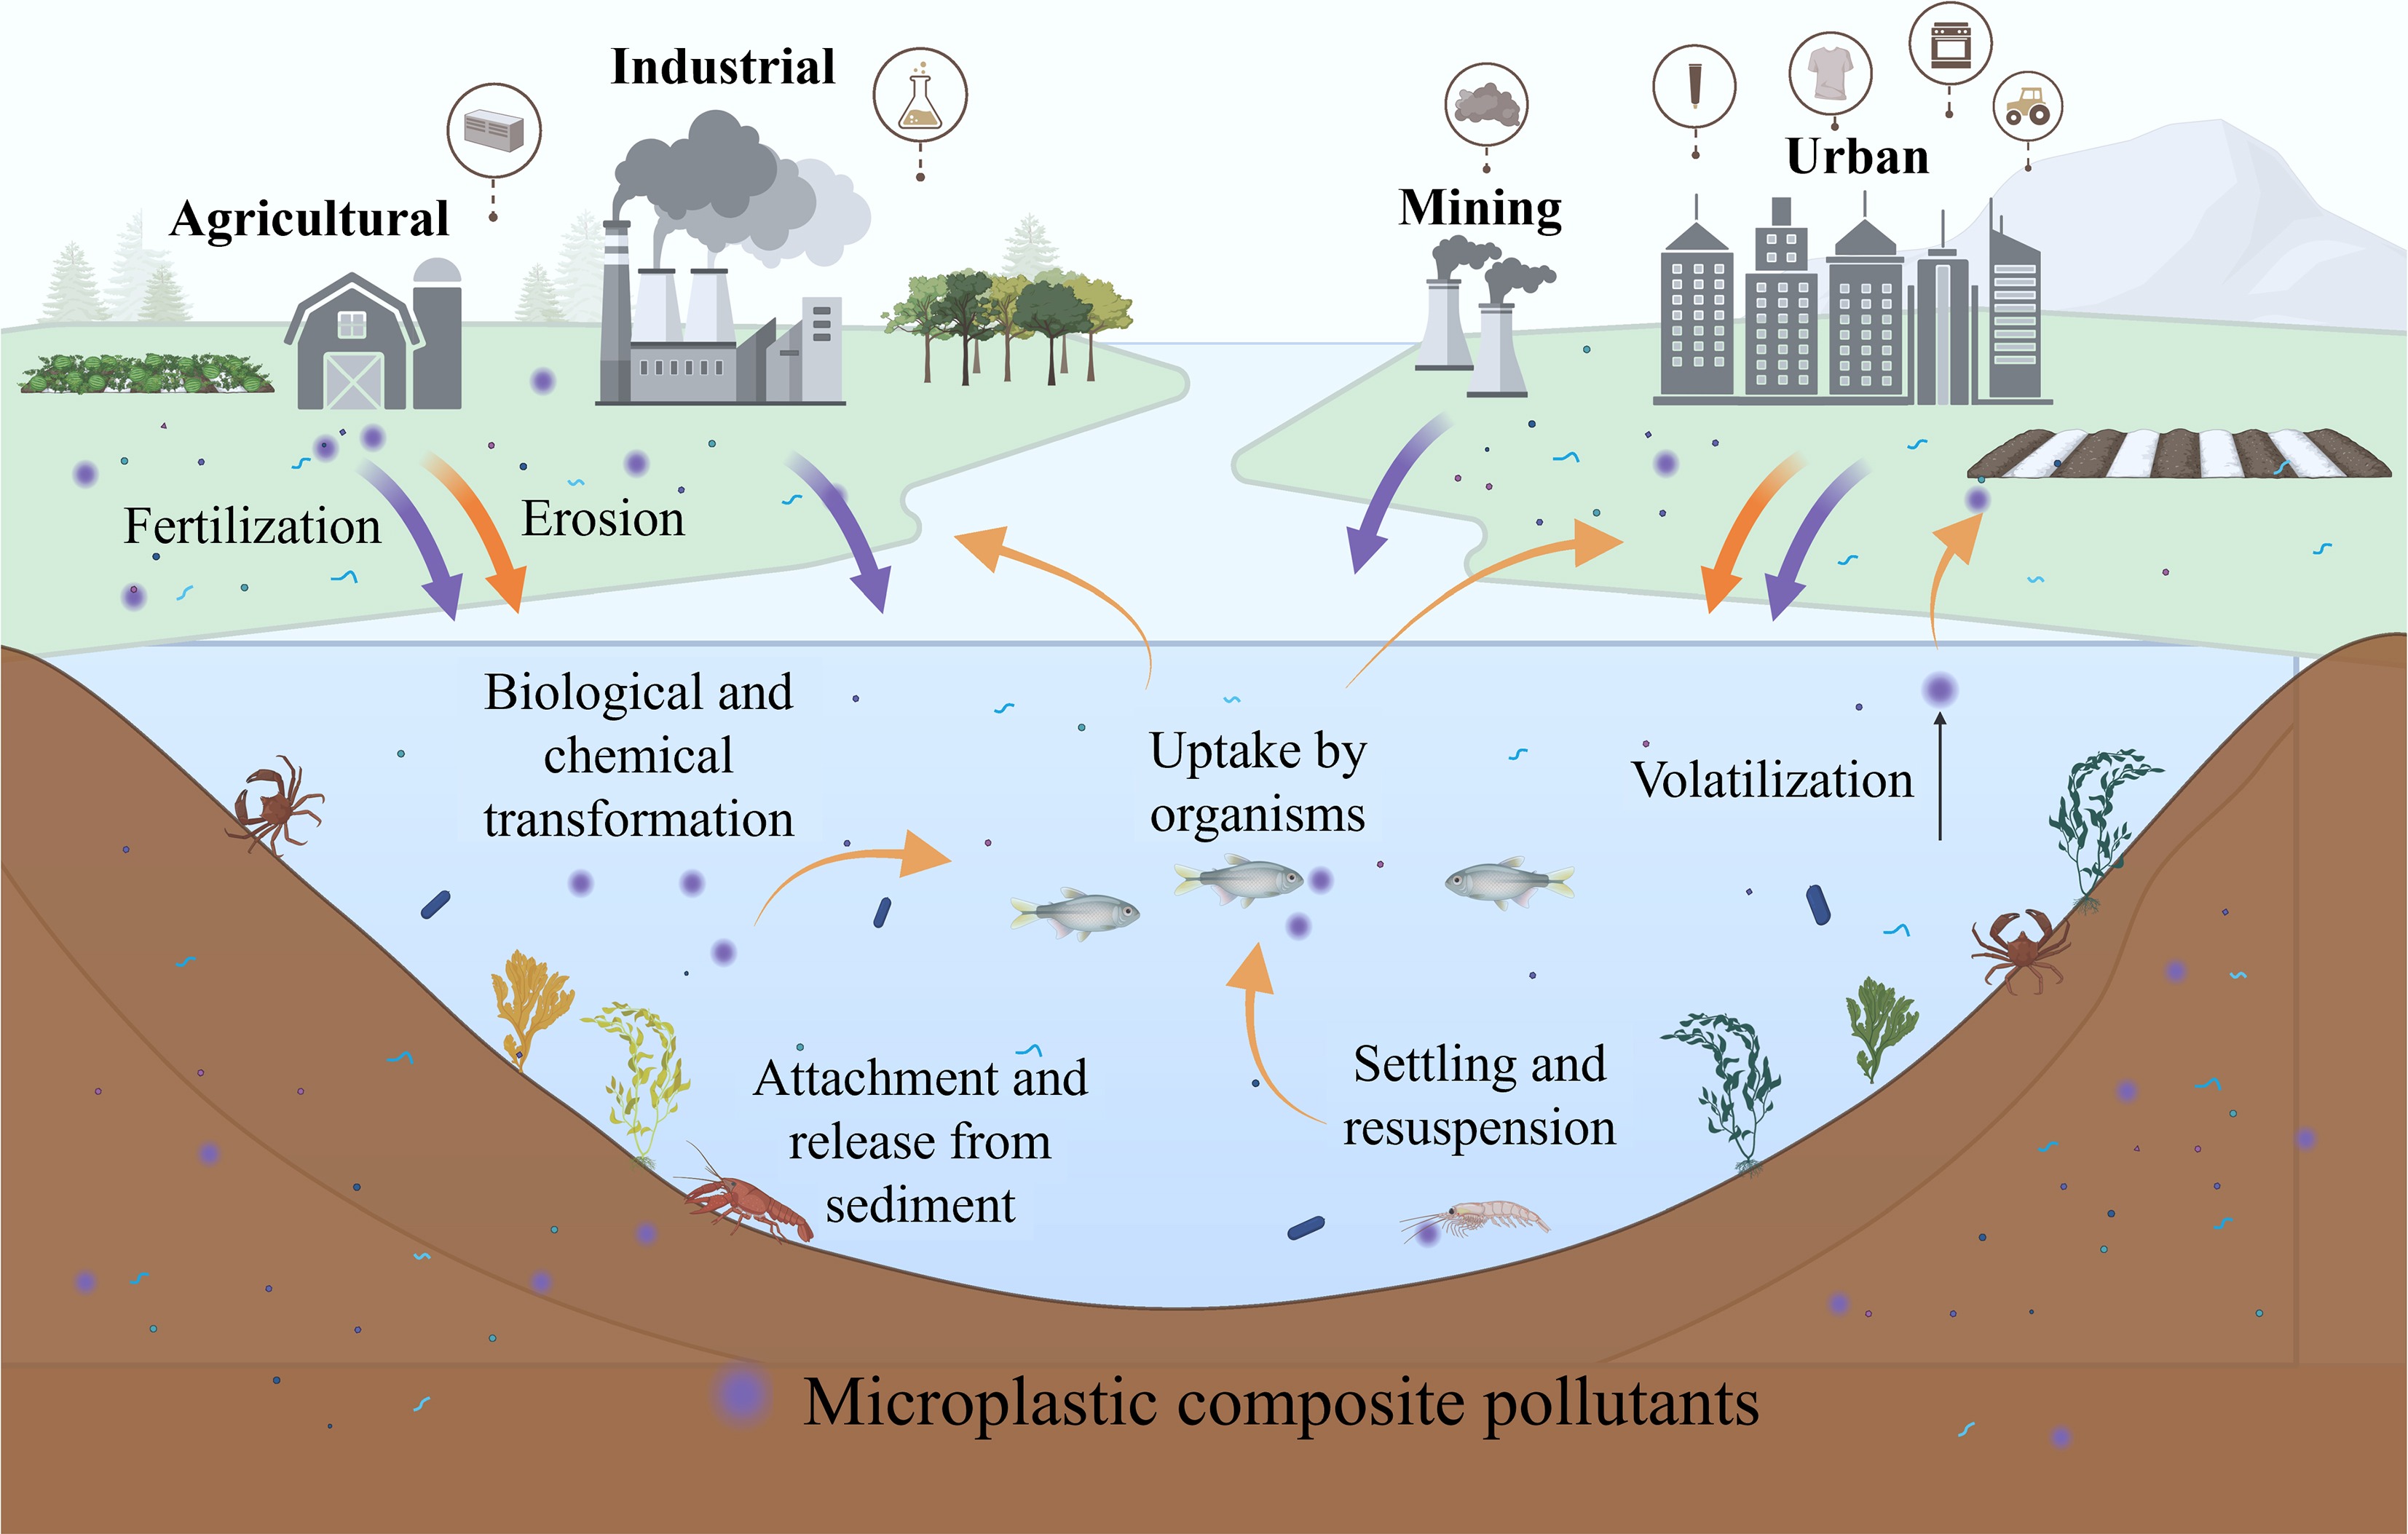
Figure 1.
Schematic illustration of the sources, cross-media migration and transformation, and ecological risks of microplastic composite pollutants in multi-media environments.
-
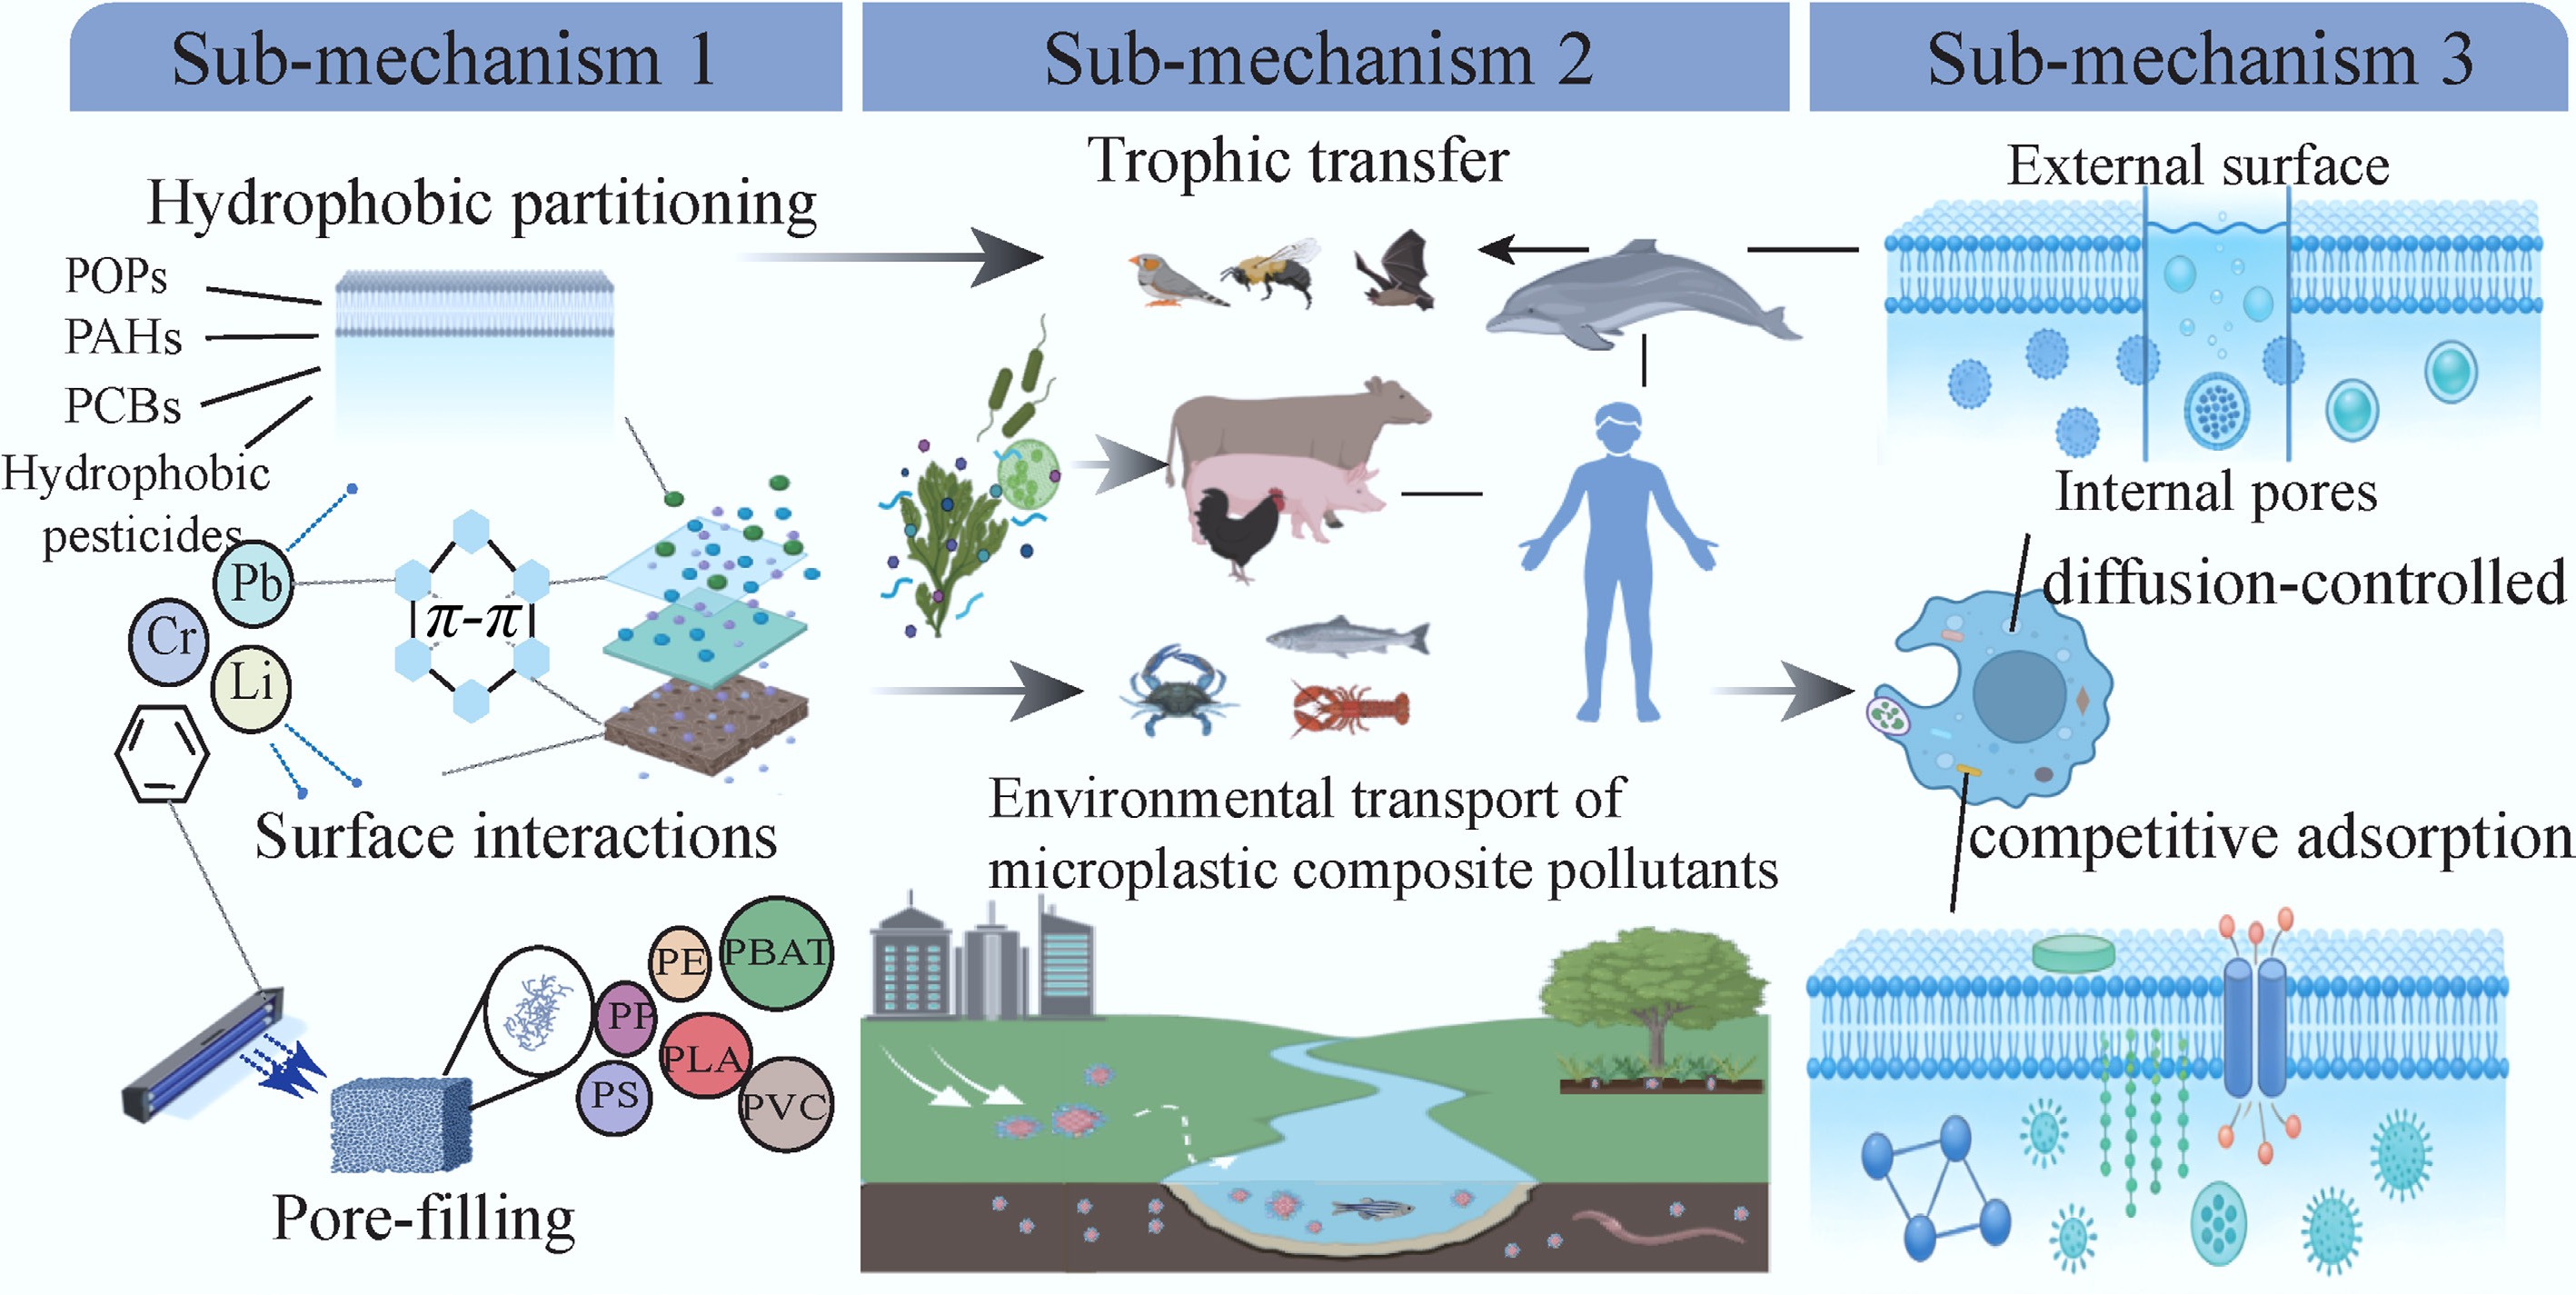
Figure 2.
Sorption–desorption mechanisms between microplastics and pollutants.
-
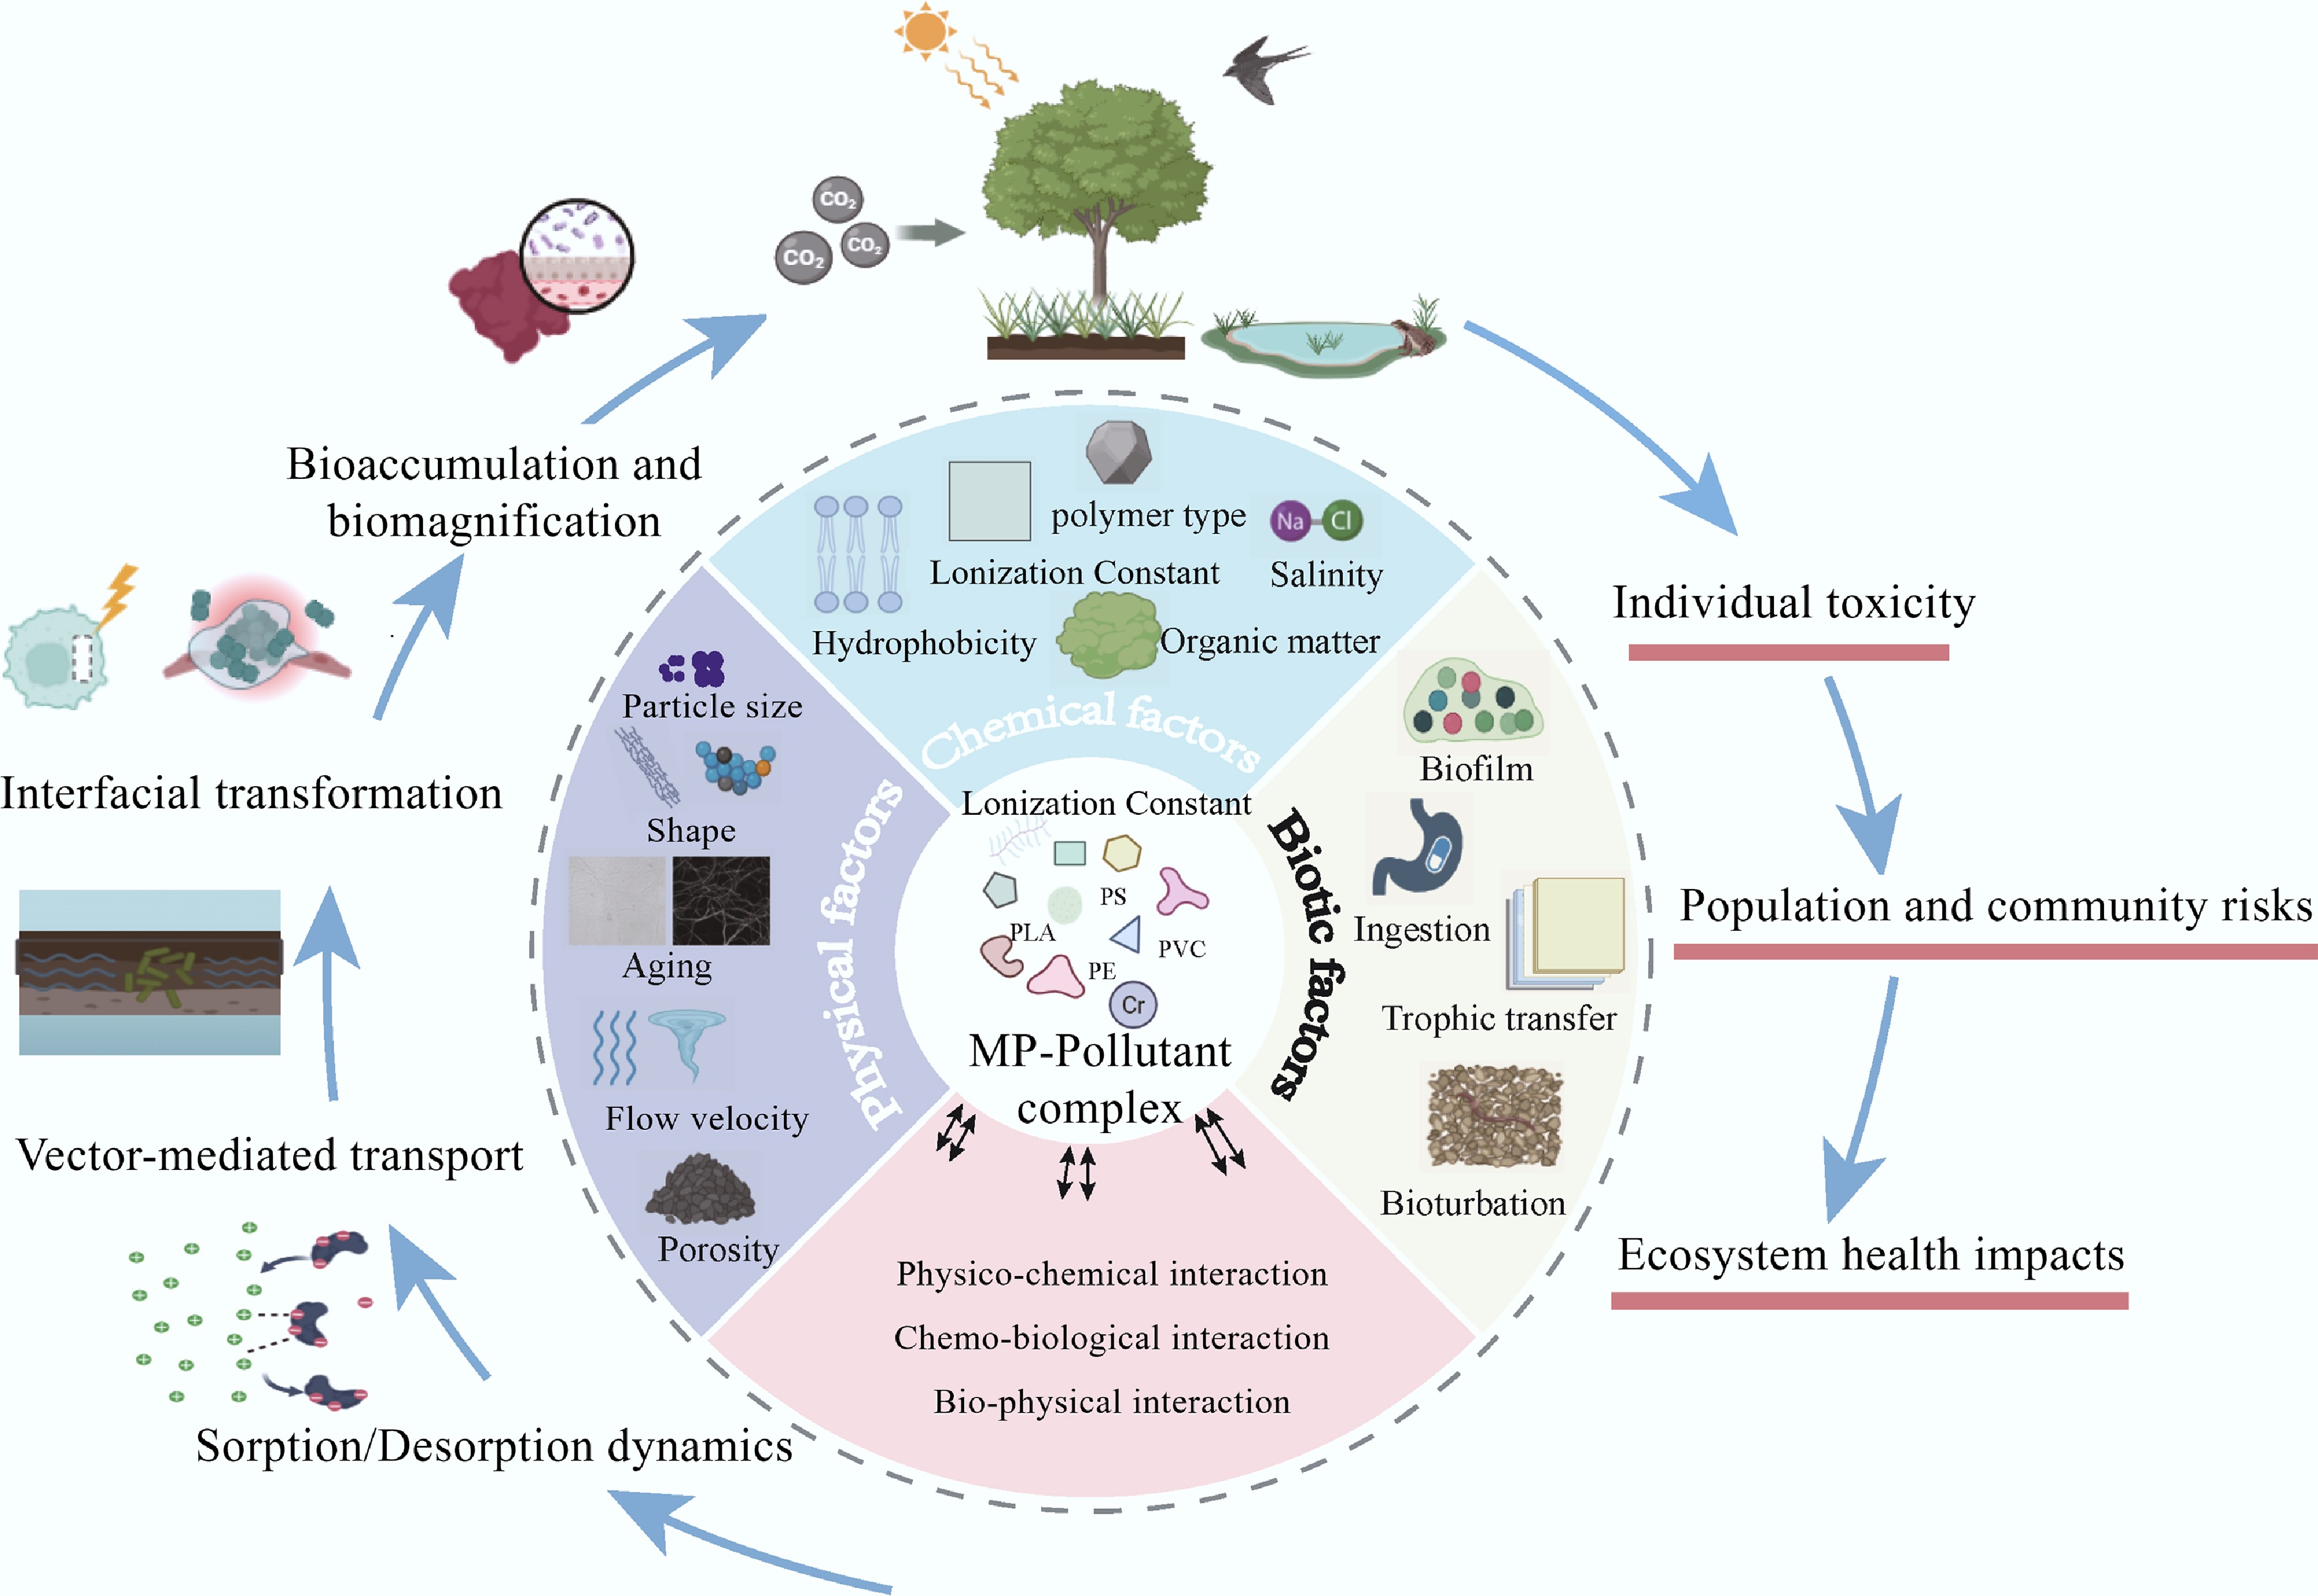
Figure 3.
Multi-dimensional regulatory effects of environmental factors on the microplastic-pollutant system.
-
MPs/NPs Sources Concentration Methods Ref. PE Adults/children 4.62 × 10⁵ particles/(kg × day) Micro-Fourier-Transform Infrared Spectroscopy [27] Polyester/acrylic Everest snow sample and Everest stream water sample 30 particles/L (average) and
1 particle/L (average)Micro-Fourier-Transform Infrared; Spectroscopy; Stereomicroscopic visual observation [28] PET/PS/PMMA Human blood 1.6 µg/L Double shot pyrolysis gas chromatography-mass spectrometry [29] PP Human placenta Microplastics were detected in
four out of six placentas, totaling
12 fragments (5–10 μm)Micro-Raman Spectroscopy [30] PE/PVC/PP/PS Shenyang atmosphere 7.62 μg/m³ Pyrolysis gas chromatography-mass spectrometry [31] PP/PE The Yangtze River 5.13 items/L in water column,
113.9 items/kg
(dry weight) in sedimentMicro-Raman Spectroscopy [15] PVC/PE/PS Industrial soil 0.03 wt%–6.7 wt% Fourier-Transform Infrared Spectroscopy [32] PE/PP/PS/PVC Groundwater in Australian agricultural areas 38 ± 8 pcs/L Laser Direct Infrared Spectroscopy [33] PE/PP/PS Chinese tap water 440 ± 275 particles/L Micro-Raman Spectroscopy Fluorescence microscopy coupled with Nile Red staining [34] PS/PE/PP/PMMA Retina 49.21 μg/g Pyrolysis gas chromatography-mass spectrometry; Laser Direct Infrared Spectroscopy [35] PET/PS Tianjin 102–103 ng/g dw in open-grown
leafy vegetablesLaser-ablation inductively coupled plasma mass spectrometry [36] Due to methodological differences, the data in this table should be interpreted qualitatively as evidence of the widespread presence of MNPs across global environmental media and should not be used for direct quantitative comparisons. Table 1.
Distribution and residual concentration of microplastics in different environmental media and biological samples
-
Microplastic types Target pollutant Adsorption capacity Dominant sorption
mechanismRef. Pseudo-first-order Pseudo-second-order qe, ca1 (mg/g) K1 qe, ca1 (mg/g) K2 PVC BPAF 0.107 0.0030 min−1 0.244 0.085 g/(mg·min) Hydrophobic partitioning, electrostatic interaction [92] PS 3D RGO 6.15 0.093 min−1 558.66 0.226 g/(mg·min) π–π stacking [91] 100–154 μm HDPE Cd2+ 23.65 0.0008 g/(mg·min) 95.88 0.0097 g/(mg·min) Physical interaction [93] PP 9-NAnt 80.41 µg/g 0.0530 h−1 666.67 µg/g 0.0028 g/(µg·h) Hydrophobic partitioning, electrostatic interaction [94] 30–50 mesh mPS Aniline 0.0203 0.9609 min−1 0.0252 15.9572 g/(mg·min) π–π stacking [95] PE MG 4.360 1.572 h−1 4.530 2.273 g/(mg·h) Electrostatic interaction [96] PE RhB 1.217 0.946 h−1 1.236 2.072 g/(mg·h) Electrostatic interaction PS BPA 0.5577 21.8068 min−1 0.5577 60.3331 g/(mg·min) Hydrophobic partitioning, π–π stacking [97] Original PLA CIP 0.049 0.091 min−1 0.382 22.84 g/(mg·min) Hydrogen bonding [98] Aging PLA CIP 0.137 0.099 min−1 0.472 4.275 g/(mg·min) π–π stacking PP Cd2+ 0.18 ± 0.01 0.19 ± 0.05 h−1 0.20 ± 0.01 1.50 ± 0.48 g/(mg·h) Physical adsorption [99] PBAT Chlorpyrifos 9.2047 0.2521 h−1 9.6241 0.0435 g/(mg·h) Hydrophobic partitioning, π–π stacking [100] Original 80 μm PS AZI 366.87 mg/kg 0.675 min−1 389.66 mg/kg 0.0024 × 10⁻⁴ kg/(mg·min) Hydrophobic partitioning, electrostatic interaction [101] The fitted equilibrium adsorption capacities (qe, cal) have heterogeneous units due to differences in initial pollutant concentrations and detection limits across studies. Therefore, direct cross-comparison of kinetic data within this table is not recommended. Table 2.
Kinetic fitting parameters of pollutant adsorption on various microplastics
-
Microplastic types Target pollutant Adsorption capacity
(linear [Kd])Dominant
sorption mechanismRef. PE PFOS 32.8 L/kg Hydrophobic partitioning [102] PE FOSA 298.3 L/kg Hydrophobic partitioning PVC PFOS 100.5 L/kg Hydrophobic partitioning, electrostatic interaction PVC FOSA 115.7 L/kg Hydrophobic partitioning PE Phenanthrene 38,100 ±
5,600 L/kgHydrophobic partitioning [46] PP Phenanthrene 2,190 ±
170 L/kgHydrophobic partitioning PS BPA 18.8 L/kg π–π stacking [103] PVC BPA 0.4 L/kg Hydrophobic partitioning PA BPA 76,287 L/kg Hydrogen bonding PE CIP 55.1 ±
7.94 L/kgVan der Waals force [104] PE TMP 8.38 ± 1.32 L/kg Van der Waals force PE SDZ 6.19 ± 0.238 L/kg Van der Waals force PS CIP 51.5 ± 7.76 L/kg Van der Waals force, π–π stacking PP SDZ 7.85 ± 0.679 L/kg Hydrophobic partitioning PA AMX 756 ± 48.0 L/kg Hydrogen bonding PVC SDZ 6.61 ± 0.549 L/kg Hydrophobic partitioning Table 3.
Thermodynamic partition coefficients (Kd) of pollutant adsorption on various microplastic
Figures
(3)
Tables
(3)