-
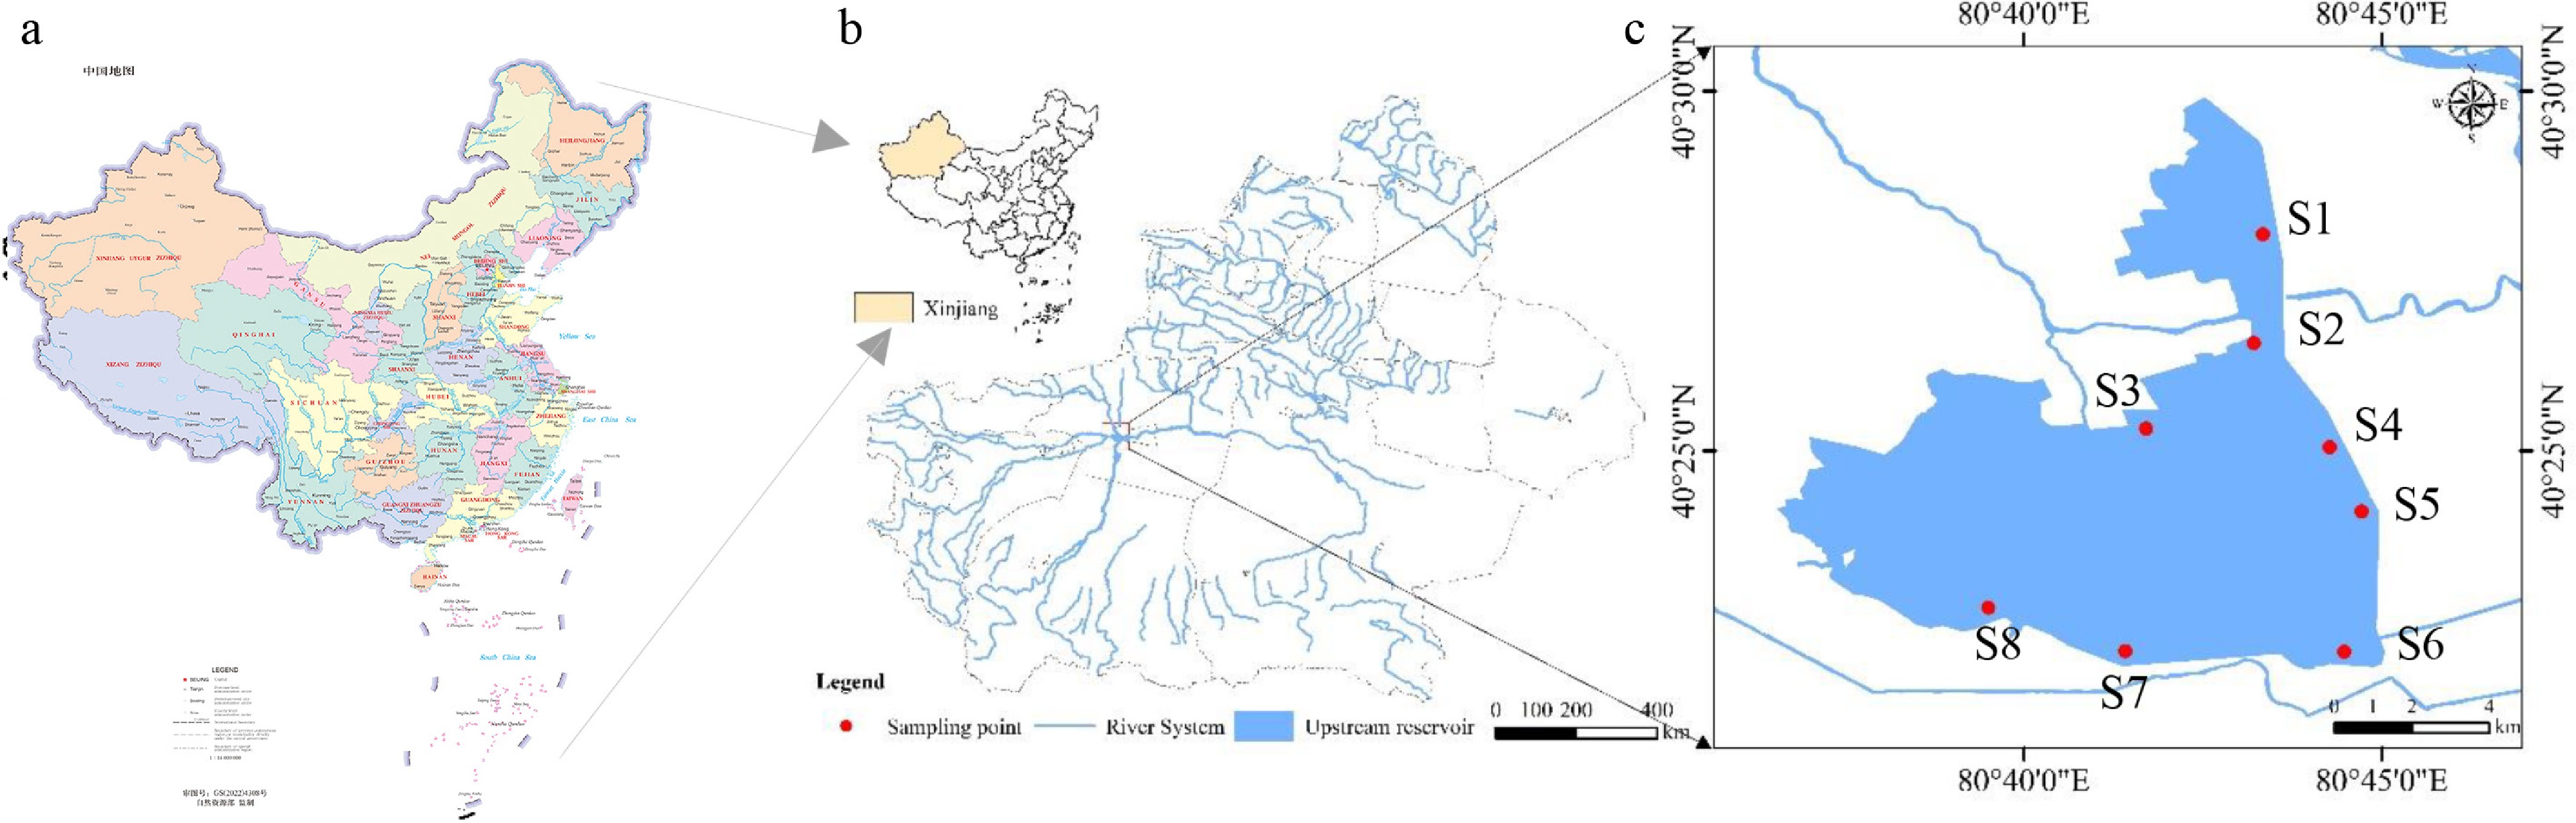
Figure 1.
Map of fish resource sampling sites. (a) Map of China. (b) Top left corner: outline map of China. Light yellow highlighting indicates the geographical location of the Xinjiang Uygur Autonomous Region within China. Bottom right corner: regional overview of the study area in Xinjiang, showing the river system and the location of the upstream reservoir (highlighted by a red box). (c) Detailed inset map of the upstream reservoir, with eight sampling points labeled S1–S8 (red dots). Blue shaded areas represent the upstream reservoir, and blue lines denote the connected river system. Scale bars are provided to indicate the spatial scale for both the regional overview (0–400 km) and the detailed inset map (0–4 km). Source of the map:
http://bzdt.ch.mnr.gov.cn . -
Order Family Species n TL (cm) BW (g) Regression parameters Min Max (Mean) * Min Max (Mean) * a 95% CL of a b 95% CL of b R2 (LWR) Cypriniformes Cyprinidae Erythroculter ilishaeformis 26 14.43 28.42 19.96 ± 3.29 20.10 242.00 67.90 ± 47.01 −5.953 −6.988~−4.918 3.357 3.010~3.704 0.946 Hemiculter leucisculus 35 9.06 16.95 11.83 ± 2.11 4.20 52.75 15.96 ± 11.59 −5.825 −7.586~−4.064 3.409 2.693~4.124 0.747 Carassius auratus 16 5.67 9.57 7.94 ± 1.02 2.14 10.50 6.83 ± 2.25 −4.575 −5.228~−3.922 3.113 2.797~3.429 0.972 Abbottina rivularis 91 6.87 10.74 8.80 ± 1.00 2.61 13.70 6.86 ± 2.61 −5.158 −5.750~−4.566 3.232 2.959~3.505 0.863 Rhodeus ocellatus 42 3.23 6.69 4.55 ± 0.75 0.30 3.40 1.26 ± 0.68 −4.529 −5.054~−4.003 3.074 2.726~3.422 0.891 Pseudorasbora parva 66 3.52 7.91 6.00 ± 0.90 0.30 4.50 2.07 ± 0.82 −4.432 −4.849~−4.015 2.846 2.612~3.079 0.905 Cyprinus carpio 11 20.12 33.25 27.79 ± 3.68 106.50 448.70 278.71 ± 97.27 −3.256 −5.384~−1.127 2.661 2.019~3.302 0.907 Cobitidae Misgurnus anguillicaudatus 34 7.36 12.79 9.27 ± 1.29 1.68 7.24 3.56 ± 1.51 −4.473 −5.816~−3.129 2.553 1.948~3.158 0.698 Perciformes Odontobutidae Odontobutis obscurus 24 9.65 19.43 14.16 ± 2.61 13.40 87.40 40.90 ± 19.80 −3.305 −3.730~−2.881 2.621 2.460~2.782 0.981 Channidae Channa argus 5 26.10 42.25 33.65 ± 6.94 135.70 461.60 306.66 ± 154.76 −3.843 −7.334~−0.353 2.700 1.704~3.696 0.961 Gobiidae Rhinogobius giurinus 77 2.86 7.83 5.37 ± 1.46 0.20 5.30 1.93 ± 1.38 −4.642 −4.972~−4.312 3.025 2.827~3.223 0.926 Siluriformes Bagridae Pelteobagrus fulvidraco 3 5.58 18.52 10.43 ± 7.05 2.20 83.50 29.79 ± 46.52 −4.677 −11.173~1.820 3.107 0.237~5.977 0.995 Siluridae Silurus meridionalis 9 20.29 42.56 32.40 ± 7.50 50.10 417.70 227.74 ± 126.27 −4.437 −7.035~−1.839 2.802 2.051~3.553 0.917 n, number of individuals. TL, total length. BW, body weight. Min and Max, minimum and maximum total lengths in cm or weights in g. (Mean) * reported as mean ± standard deviation (SD). a and b are the parameters of the length–weight relationship (LWR), a, intercept of LWR; b, slope of LWR. CL, fiducial interval. R2, coefficient of determination. Table 1.
The length–weight relationships of 13 freshwater fish species collected from the Upstream Reservoir in Xinjiang, China.
-
Species K (range) K (mean) * CV (%) 1 Erythroculter ilishaeformis 0.590–1.055 0.760 ± 0.114 15.0 2 Hemiculter leucisculus 0.499–2.264 0.861 ± 0.394 45.7 3 Carassius auratus 1.169–1.475 1.305 ± 0.098 7.5 4 Abbottina rivularis 0.470–1.670 0.962 ± 0.143 14.9 5 Rhodeus ocellatus 0.705–1.880 1.225 ± 0.215 17.6 6 Pseudorasbora parva 0.541–1.301 0.913 ± 0.131 14.3 7 Cyprinus carpio 0.979–1.556 1.26 ± 0.159 12.6 8 Misgurnus anguillicaudatus 0.263–0.645 0.434 ± 0.096 22.1 9 Odontobutis obscurus 1.146–1.614 1.358 ± 0.132 9.7 10 Channa argus 0.602–0.842 0.755 ± 0.091 12.1 11 Rhinogobius giurinus 0.567–2.664 1.038 ± 0.316 30.5 12 Pelteobagrus fulvidraco 0.983–1.315 1.188 ± 0.179 15.1 13 Silurus meridionalis 0.469–0.988 0.611 ± 0.152 24.9 K, the condition factor. (Mean) * Reported as mean ± standard deviation. CV (%) = Coefficient of variation = (Standard deviation/Mean) × 100%. Table 2.
The condition factor of species in the Upstream Reservoir in Xinjiang, China.
Figures
(1)
Tables
(2)