-
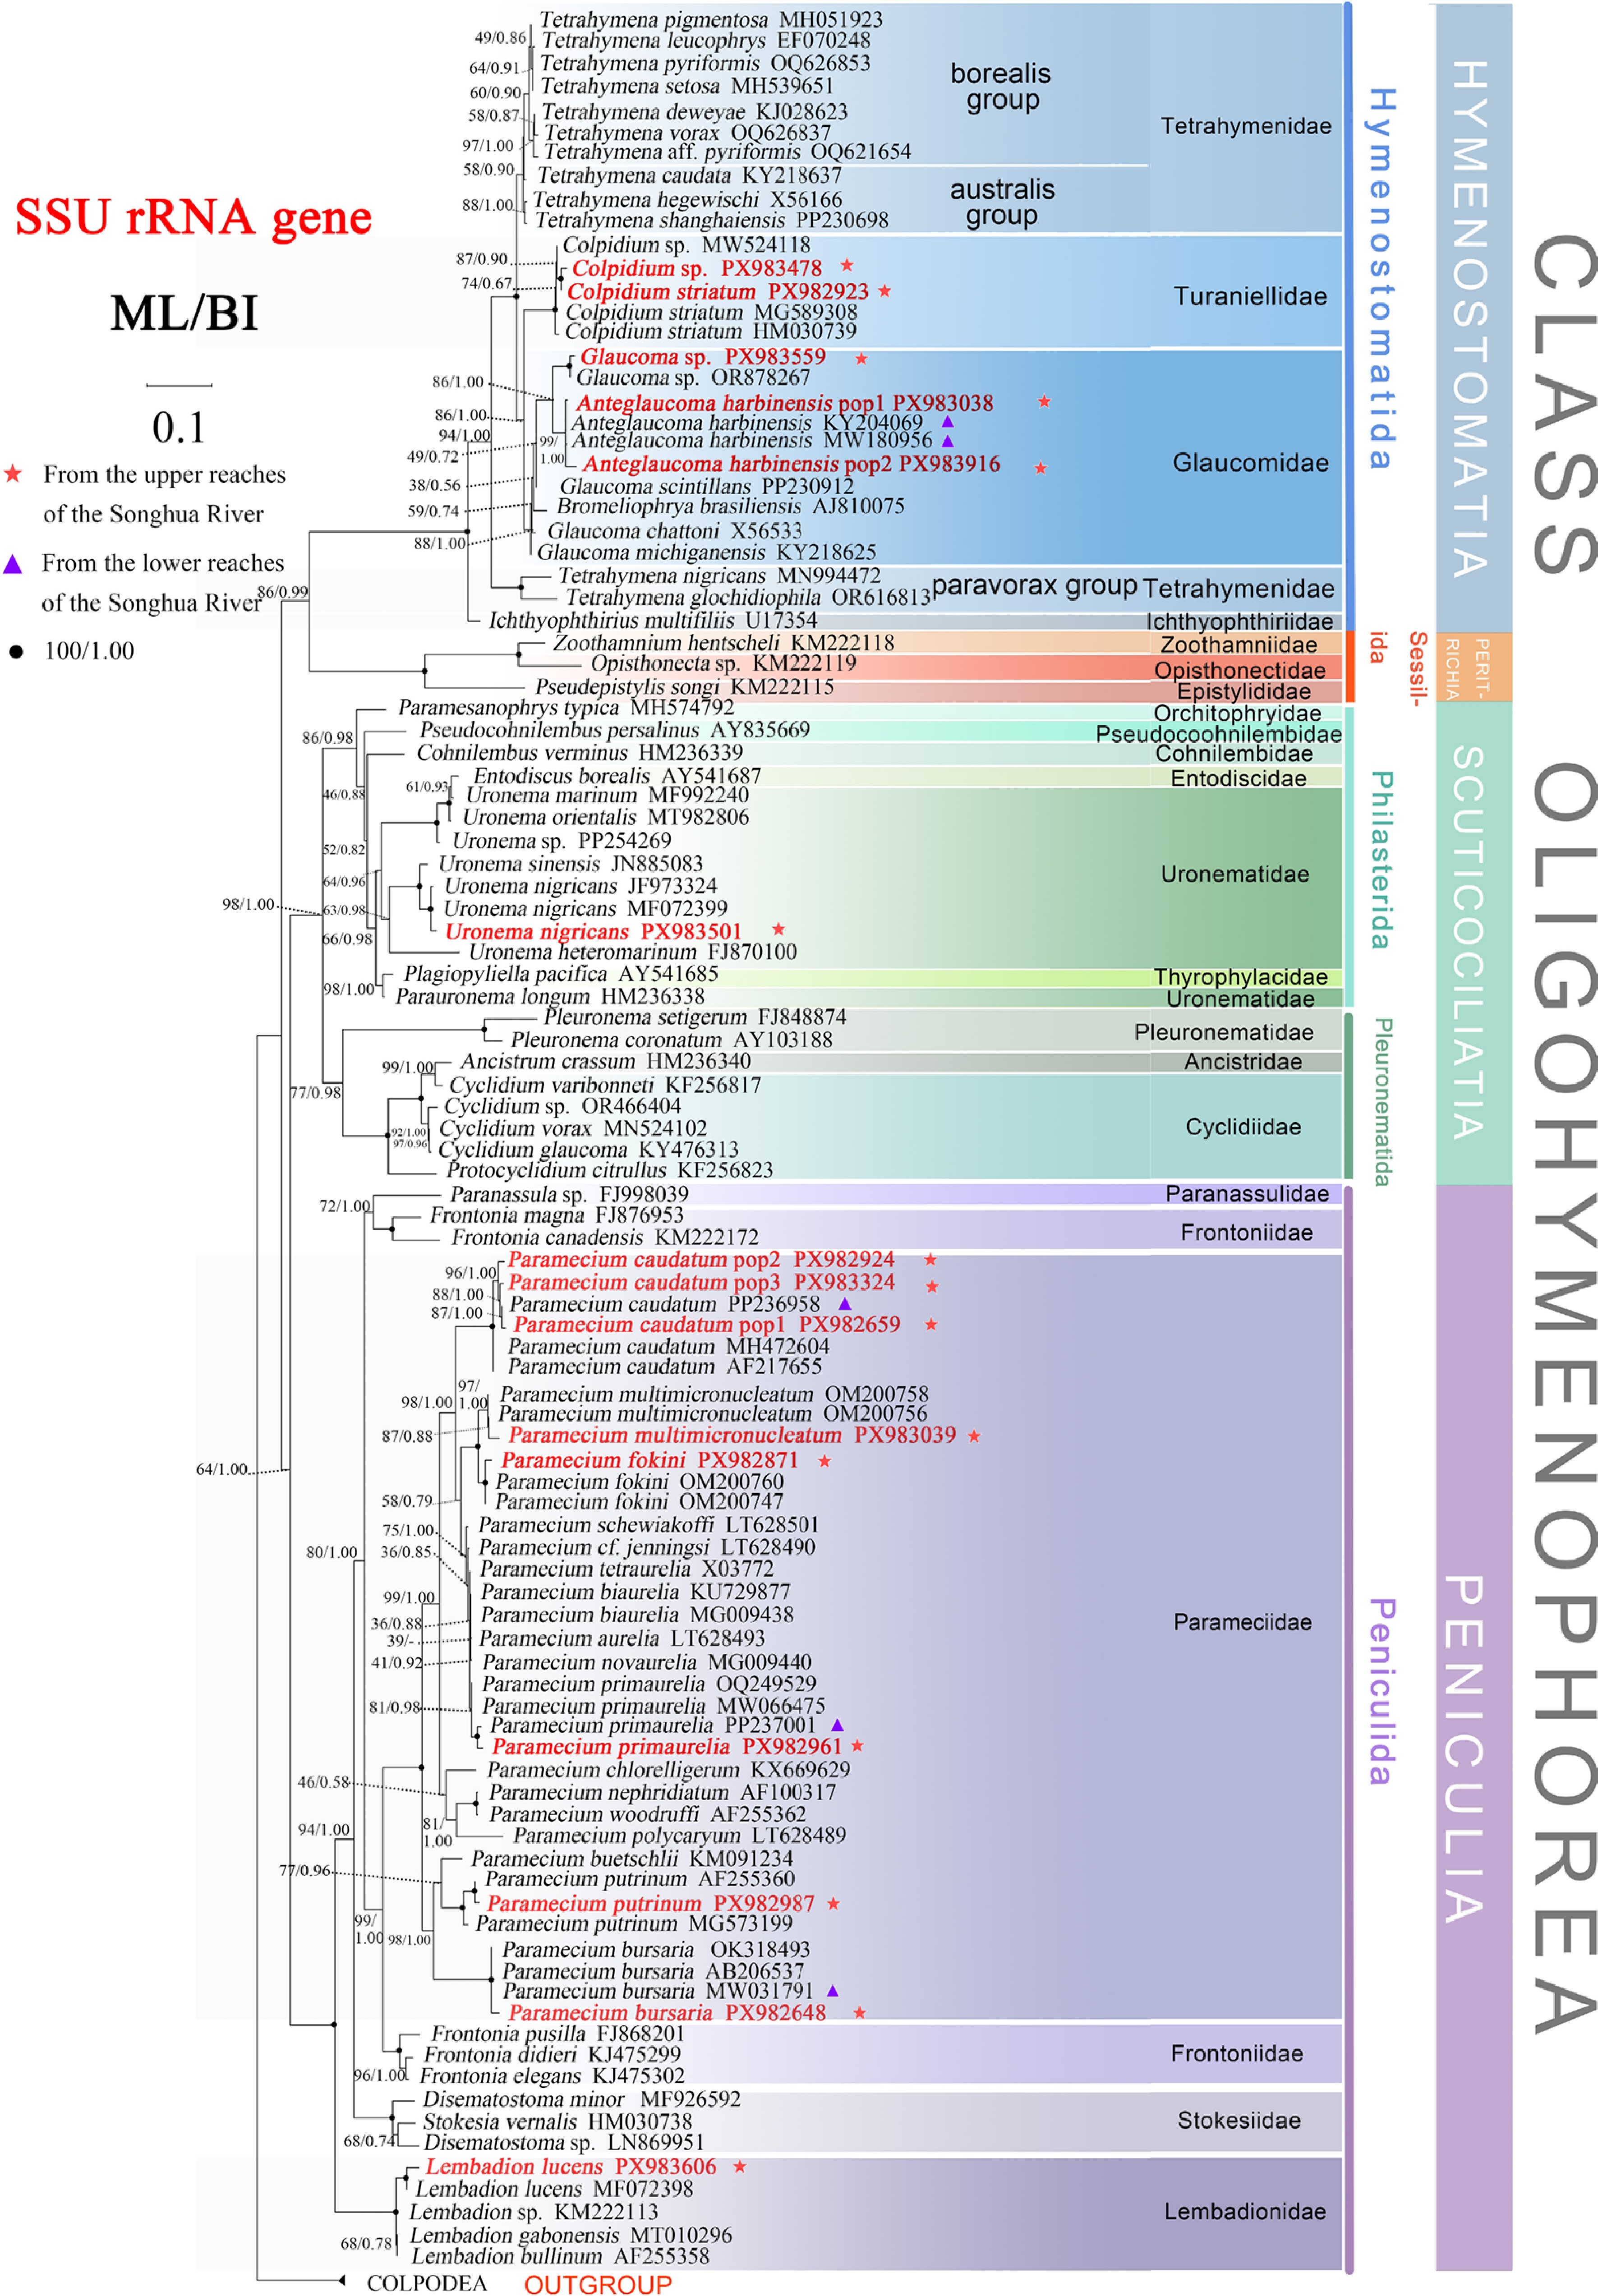
Figure 1.
The maximum-likelihood (ML) tree based on the SSU rRNA gene of major members of the class Oligohymenophorea. Newly added sequences in this study are bolded in red type. Node support is shown as: ML bootstraps/BI posterior probability. Dashes (−) indicate the discordance in branching patterns between ML and BI. Fully supported (100%/1.00) branches are marked with solid circles. The scale bar corresponds to ten substitutions per 100 nucleotide positions. Pentagon reflect populations obtained from the upper reaches of the Songhua River, while triangles reflect populations obtained from the lower reaches of the Songhua River.
-
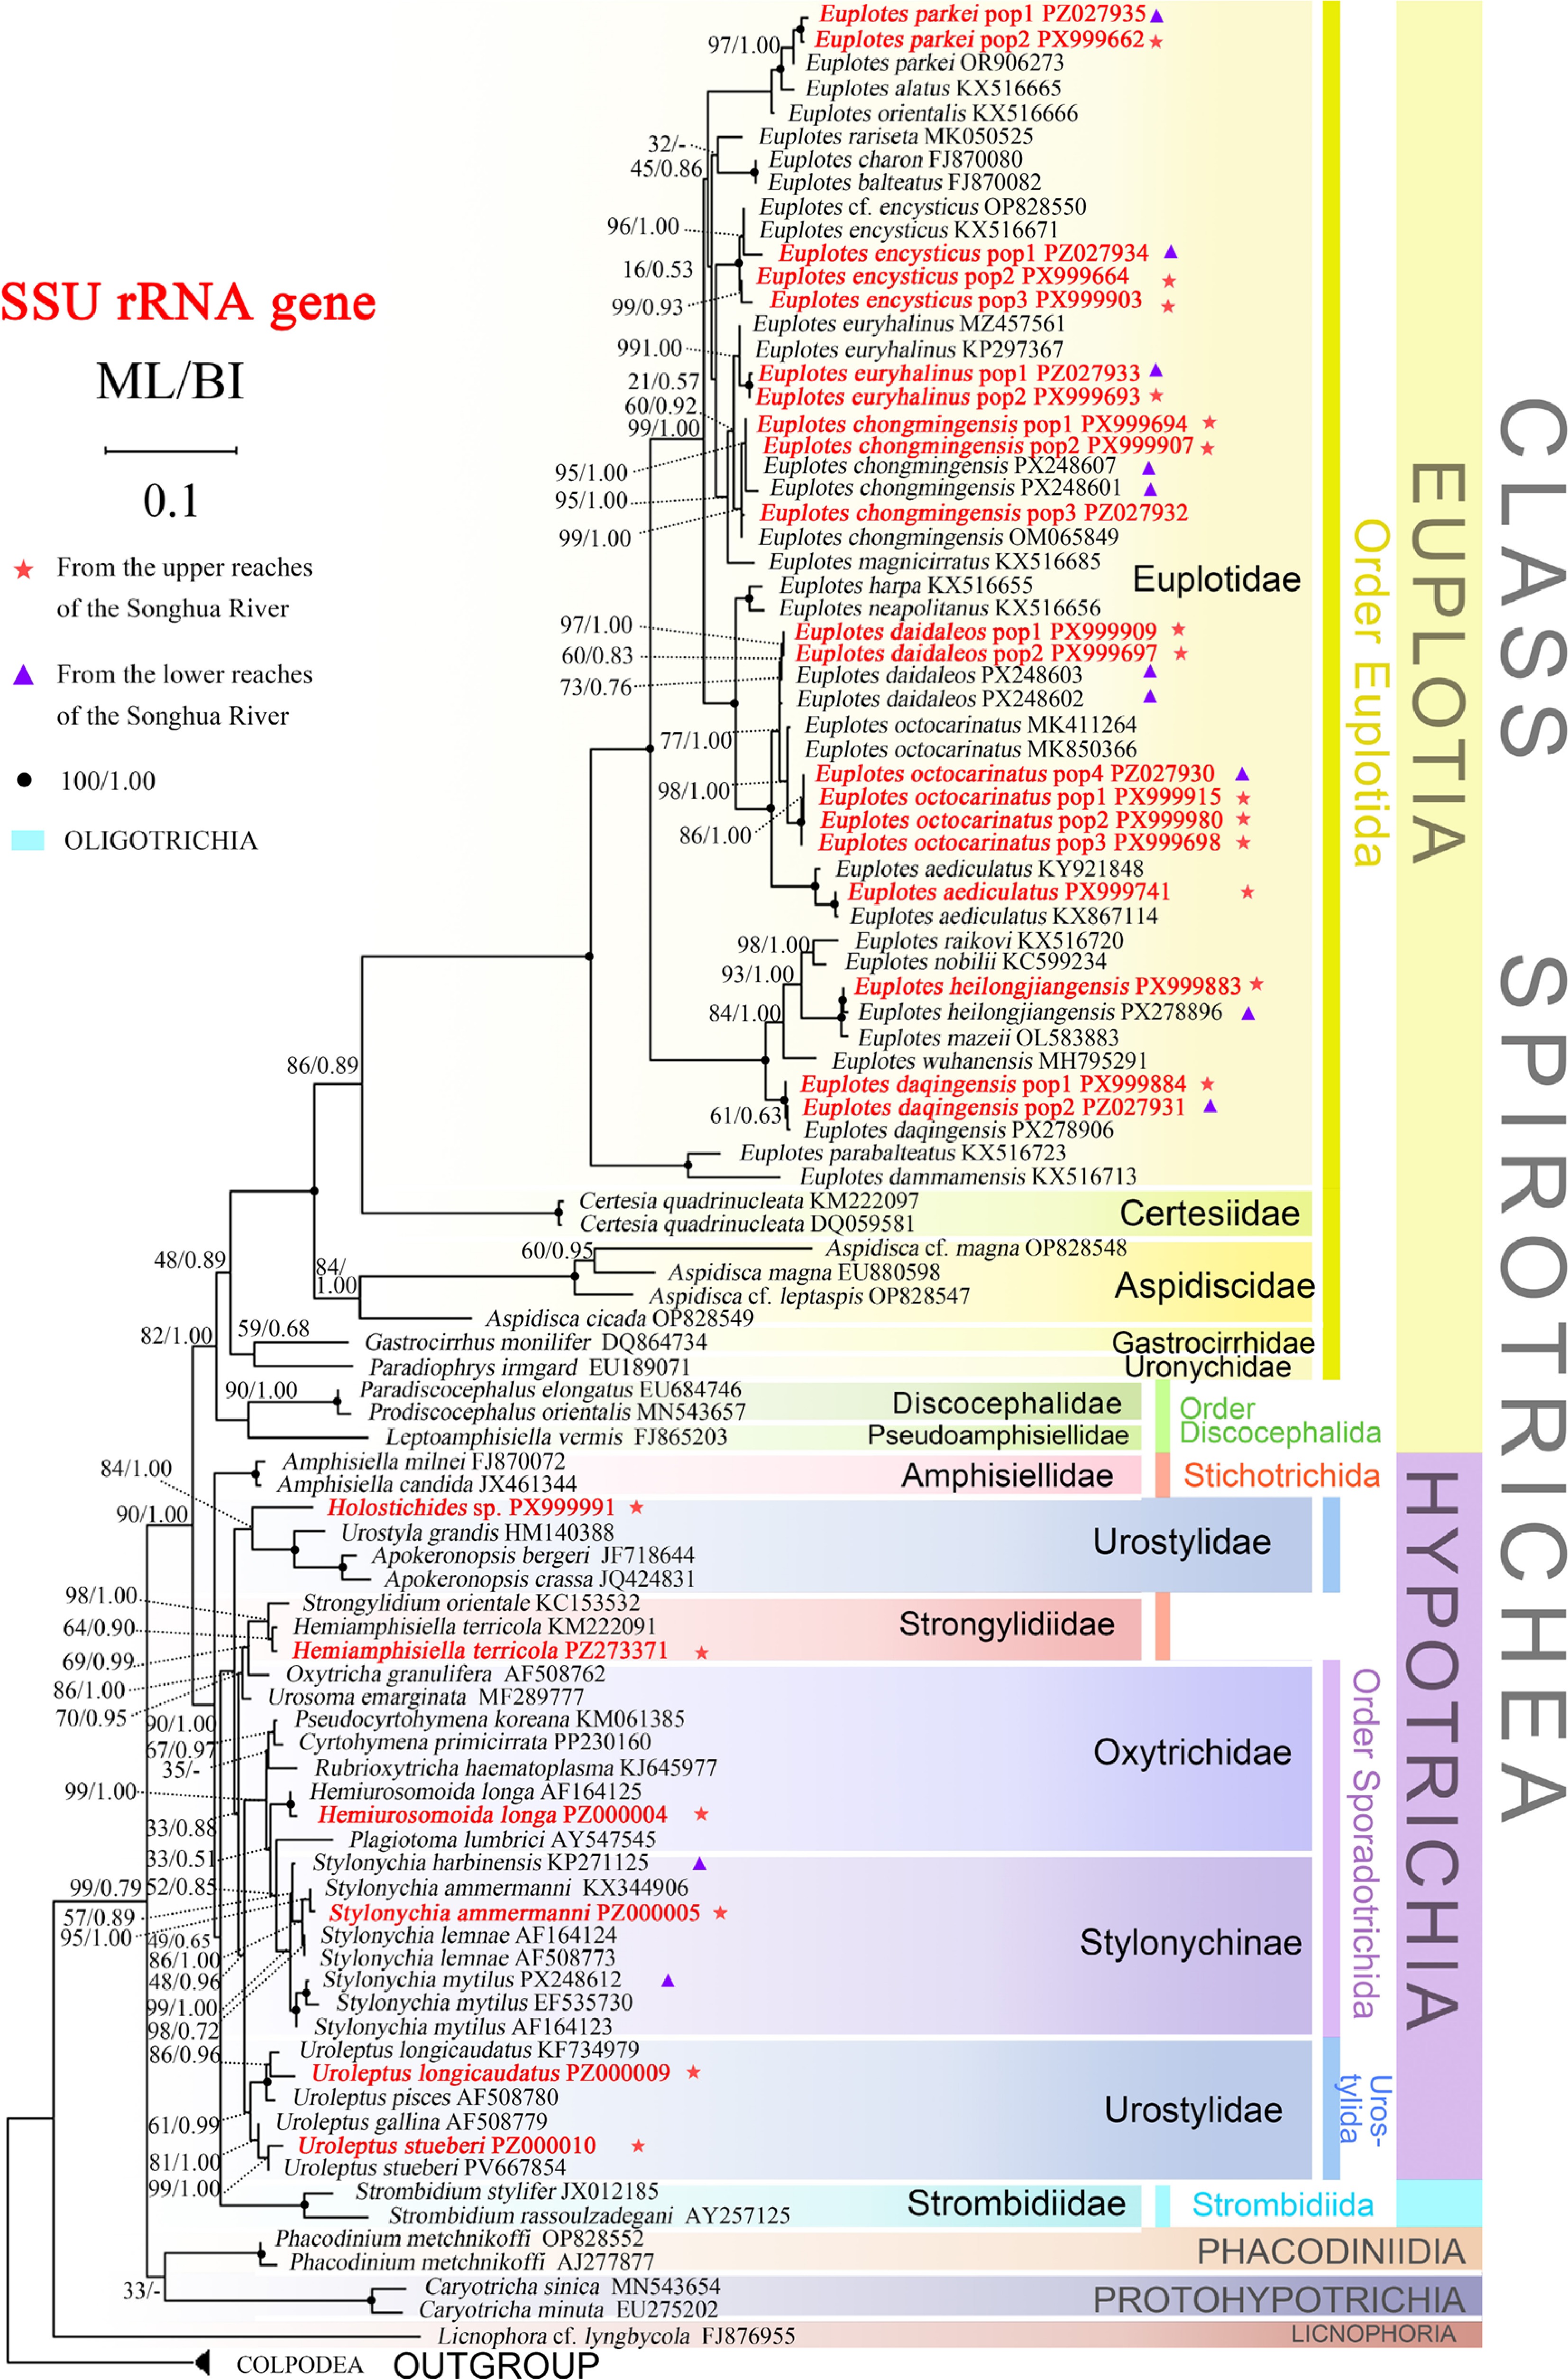
Figure 2.
The maximum-likelihood (ML) tree based on the SSU rRNA gene of major members of the class Spirotrichea. Newly added sequences in this study are bolded in red type. Node support is shown as: ML bootstraps/BI posterior probability. Dashes (−) indicate the discordance in branching patterns between ML and BI. Fully supported (100%/1.00) branches are marked with solid circles. The scale bar corresponds to ten substitutions per 100 nucleotide positions. Pentagon reflect populations obtained from the upper reaches of the Songhua River, while triangles reflect populations obtained from the lower reaches of the Songhua River.
-
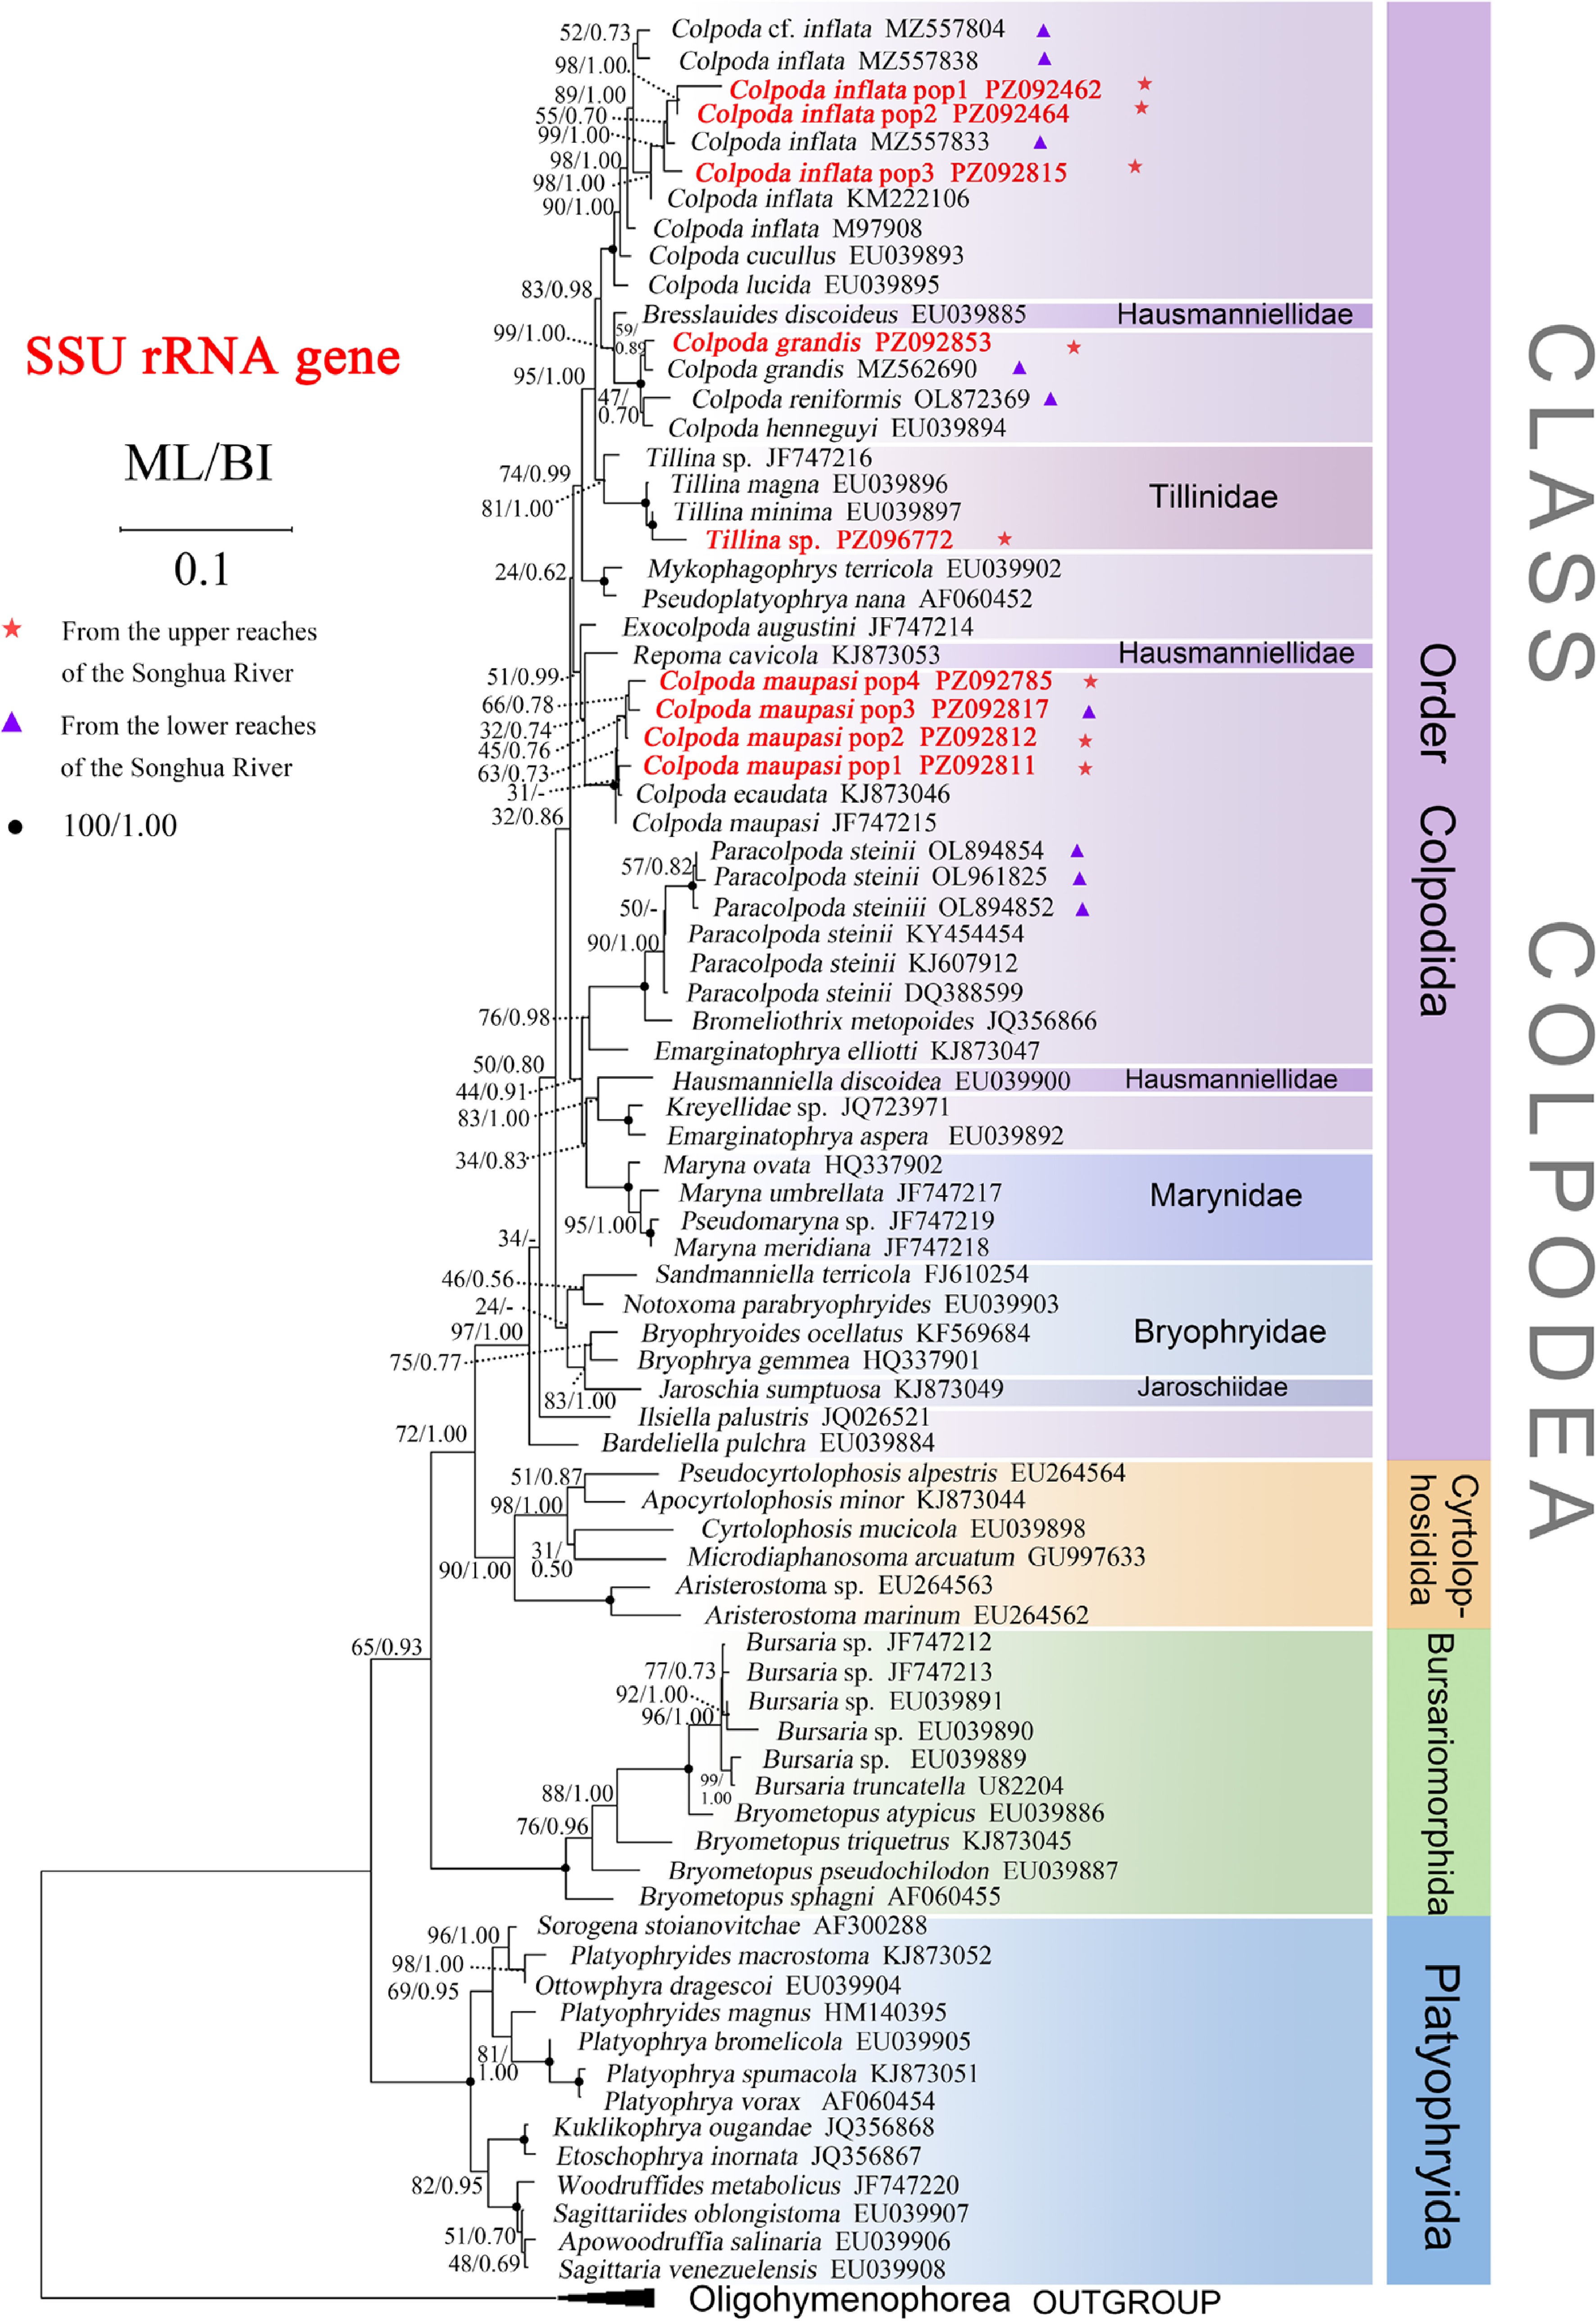
Figure 3.
The maximum-likelihood (ML) tree based on the SSU rRNA gene of major members of the class Colpodea. Newly added sequences in this study are bolded in red type. Node support is shown as: ML bootstraps/BI posterior probability. Dashes (−) indicate the discordance in branching patterns between ML and BI. Fully supported (100%/1.00) branches are marked with solid circles. The scale bar corresponds to ten substitutions per 100 nucleotide positions. Pentagon reflect populations obtained from the upper reaches of the Songhua River, while triangles reflect populations obtained from the lower reaches of the Songhua River.
-
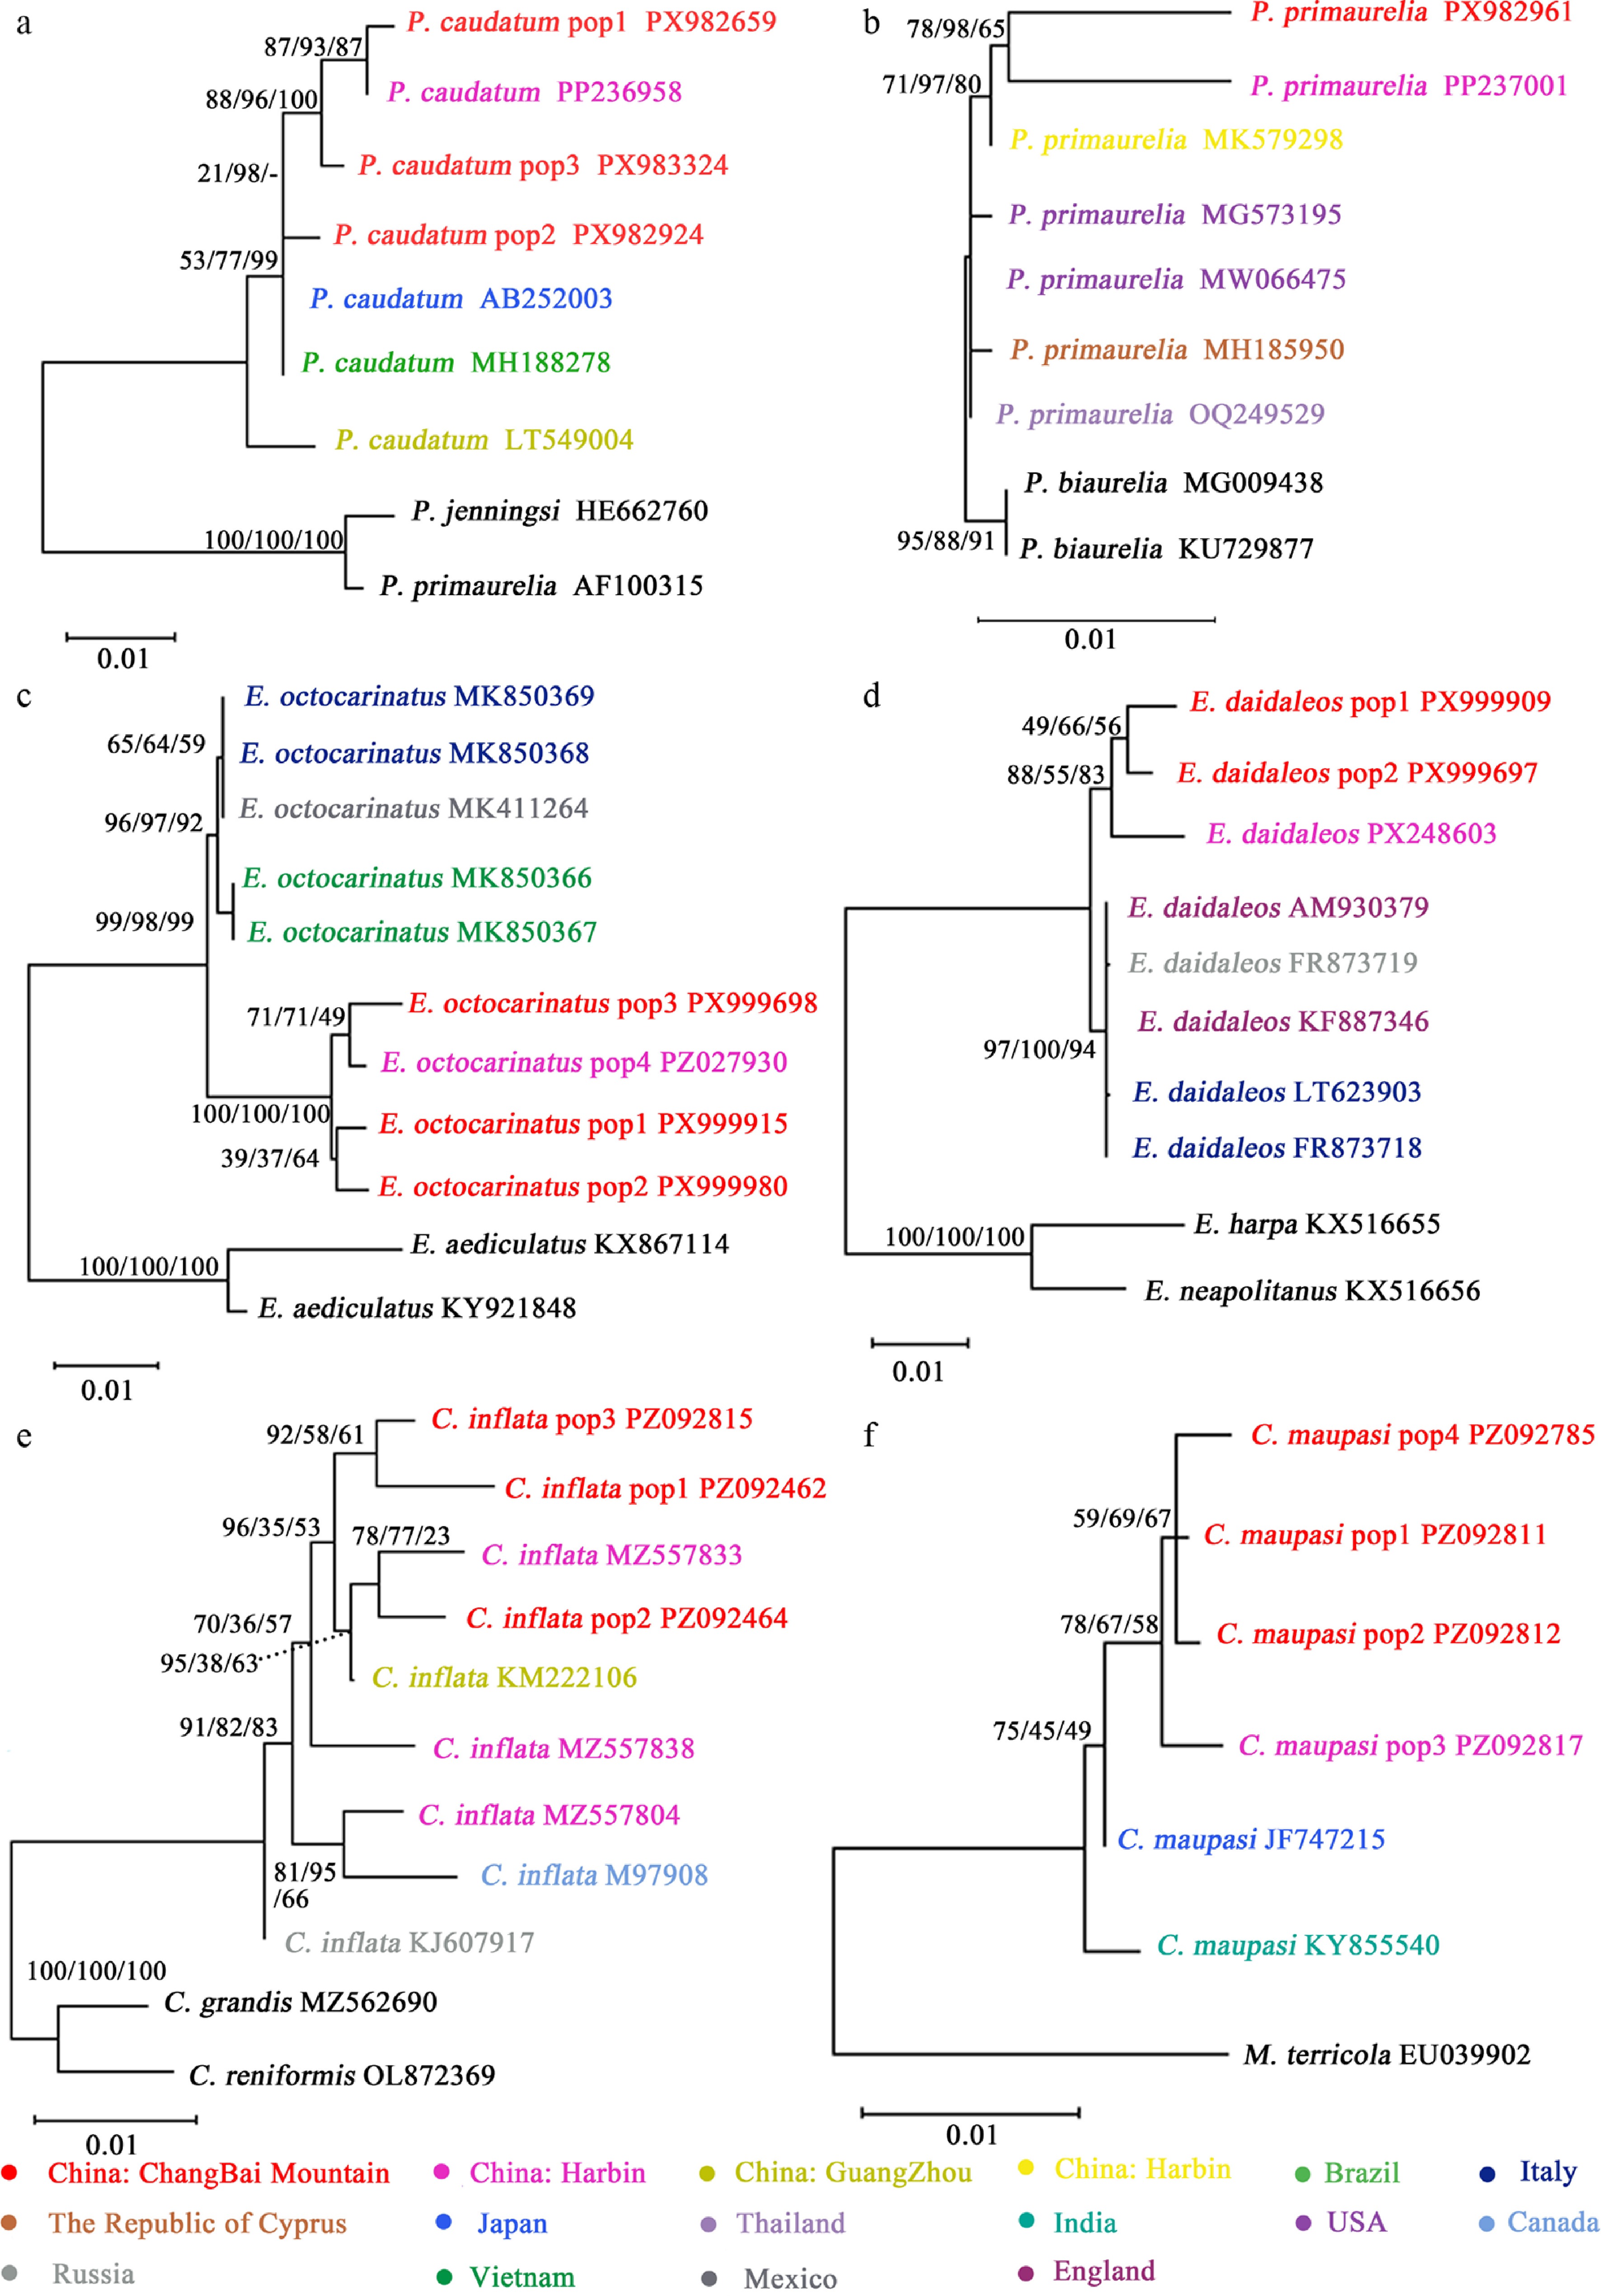
Figure 4.
Maximum likelihood phylogenetic trees based on SSU rRNA gene sequences for six representative species from the classes Oligohymenophorea, Spirotrichea, and Colpodea, showing intraspecific relationships among geographic populations of (a) P. caudatum, (b) P. primaurelia, (c) E. octocarinatus, (d) E. daidaleos, (e) C. inflata, and (f) C. maupasi. Different geographic populations are color-coded. Nodal supports are shown in the order ML/NJ/MP; dashes (−) indicate nodes where the topology of the ML tree is inconsistent with those inferred by other methods. The scale bar corresponds to one substitution per 100 nucleotide positions.
-
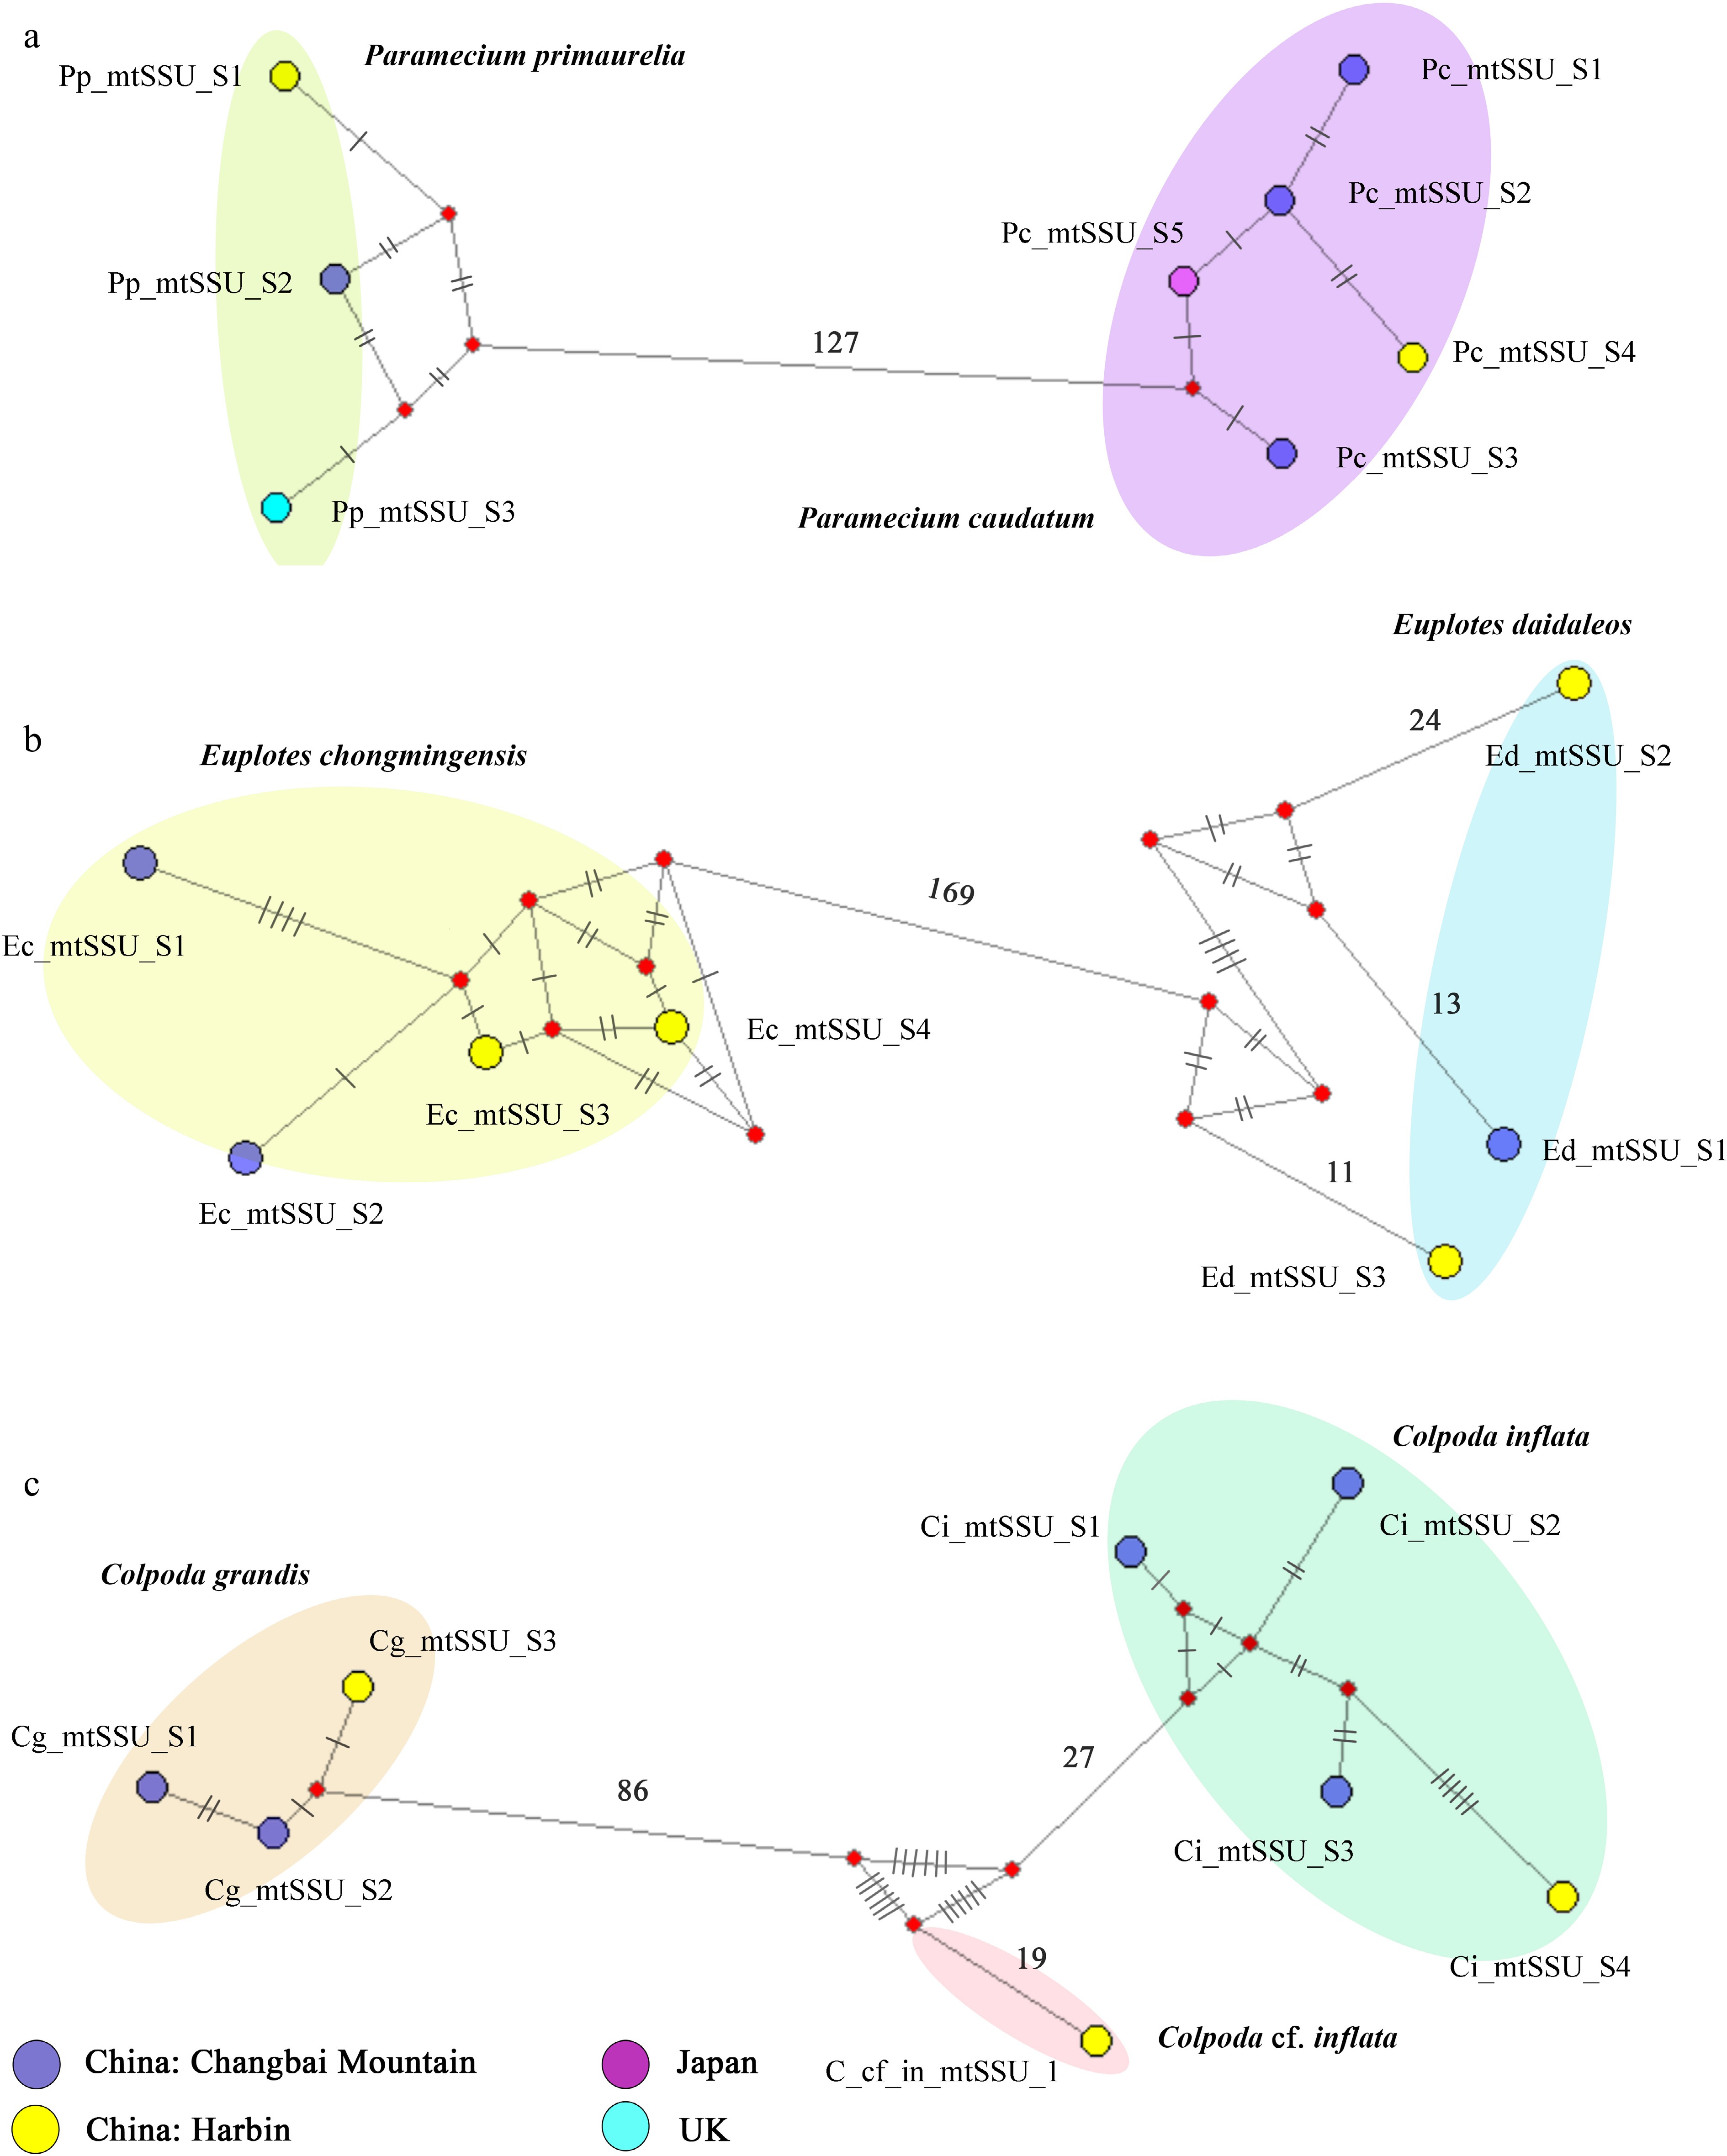
Figure 5.
Haplotype networks based on mtSSU rRNA gene sequences for three ciliate classes: (a) Oligohymenophorea (P. caudatum and P. primaurelia), (b) Spirotrichea (E. chongmingensis and E. daidaleos), and (c) Colpodea (C. inflata and C. grandis). All sequences represent unique haplotypes (no shared haplotypes) and are labeled as 'species abbreviation_gene_sequence number'. Colored circles indicate different geographical origins. Red nodes represent unsampled intermediate haplotypes (median vectors). Numbers on branches indicate nucleotide substitutions (only shown for branches with > 10 substitutions).
-
Population pop1 pop2 pop3 PP236958 MH188278 AB252003 LT549004 Sequence similarity P. caudatum pop1 99.5% 99.4% 99.7% 99.7% 99.7% 98.7% P. caudatum pop2 0.011 99.6% 99.8% 99.8% 99.8% 98.8% P. caudatum pop3 0.008 0.007 99.8% 99.7% 99.7% 98.7% Genetic distance P. caudatum (PP236958) 0.001 0.004 0.003 99.9% 99.9% 98.9% P. caudatum (MH188278) 0.010 0.004 0.005 0.002 100.0% 99.0% P. caudatum (AB252003) 0.010 0.004 0.005 0.002 0.000 99.0% P. caudatum (LT549004) 0.019 0.013 0.015 0.012 0.010 0.010 Table 1.
Information on genetic distance and sequence similarity for seven populations of Paramecium caudatum based on the SSU rRNA gene, viz. P. caudatum (pop1–3), P. caudatum (PP236958), P. caudatum (MH188278), P. caudatum (AB252003), and P. caudatum (LT549004).
-
Population pop3 pop1 pop2 pop4 MK850366 MK411264 MK850369 MK850368 MK850367 Sequence similarity E. octocarinatus pop3 99.6% 99.4% 99.7% 98.7% 98.8% 98.8% 98.8% 98.7% E. octocarinatus pop1 0.009 99.5% 99.8% 98.7% 98.9% 98.8% 98.8% 98.7% E. octocarinatus pop2 0.009 0.005 99.6% 98.5% 98.6% 98.6% 98.6% 98.5% E. octocarinatus pop4 0.007 0.005 0.005 98.7% 99.0% 98.9% 98.9% 98.7% Genetic distance E. octocarinatus MK850366 0.020 0.017 0.017 0.017 99.8% 99.8% 99.8% 100% E. octocarinatus MK411264 0.013 0.011 0.012 0.011 0.002 100% 100% 99.8% E. octocarinatus MK850369 0.019 0.015 0.015 0.016 0.002 0.000 100% 99.8% E. octocarinatus MK850368 0.019 0.015 0.015 0.016 0.002 0.000 0.000 99.8% E. octocarinatus MK850367 0.020 0.017 0.017 0.017 0.000 0.002 0.002 0.002 Table 2.
Information on genetic distance and sequence similarity for nine populations of Euplotes octocarinatus based on SSU-rDNA, viz. E. octocarinatus (pop1–4), E. octocarinatus (MK850366), E. octocarinatus (MK411264), E. octocarinatus (MK850369), E. octocarinatus (MK850368), and E. octocarinatus (MK850367).
-
Population pop2 pop3 pop1 MZ557833 MZ557838 MZ557804 KM222106 KJ607917 M97908 Sequence similarity C. inflata pop2 99.3% 98.8% 99.2% 98.9% 99.2% 99.8% 99.2% 97.8% C. inflata pop3 0.009 99.1% 99.6% 99.1% 99.2% 99.9% 99.3% 98.1% C. inflata pop1 0.019 0.010 98.7% 99.0% 98.9% 99.0% 99.0% 97.8% Genetic distance C. inflata MZ557833 0.009 0.009 0.017 98.8% 99.0% 99.7% 99.1% 97.8% C. inflata MZ557838 0.018 0.014 0.015 0.017 99.3% 99.1% 99.3% 98.0% C. inflata MZ557804 0.018 0.018 0.019 0.015 0.013 99.3% 99.3% 98.1% C. inflata KM222106 0.007 0.006 0.015 0.006 0.011 0.009 99.3% 98.2% C. inflata KJ607917 0.008 0.007 0.009 0.009 0.007 0.007 0.007 98.1% C. inflata M97908 0.023 0.023 0.025 0.020 0.018 0.011 0.009 0.010 Table 3.
Information on genetic distance and sequence similarity for six populations of Colpoda inflata based on SSU-rDNA, viz. C. inflata (pop1–3), C. inflata (MZ557833), C. inflata (MZ557838), C. inflata (MZ557804), C. inflata (KM222106), C. inflata (KJ607917), and C. inflata (M97908).
Figures
(5)
Tables
(3)