-
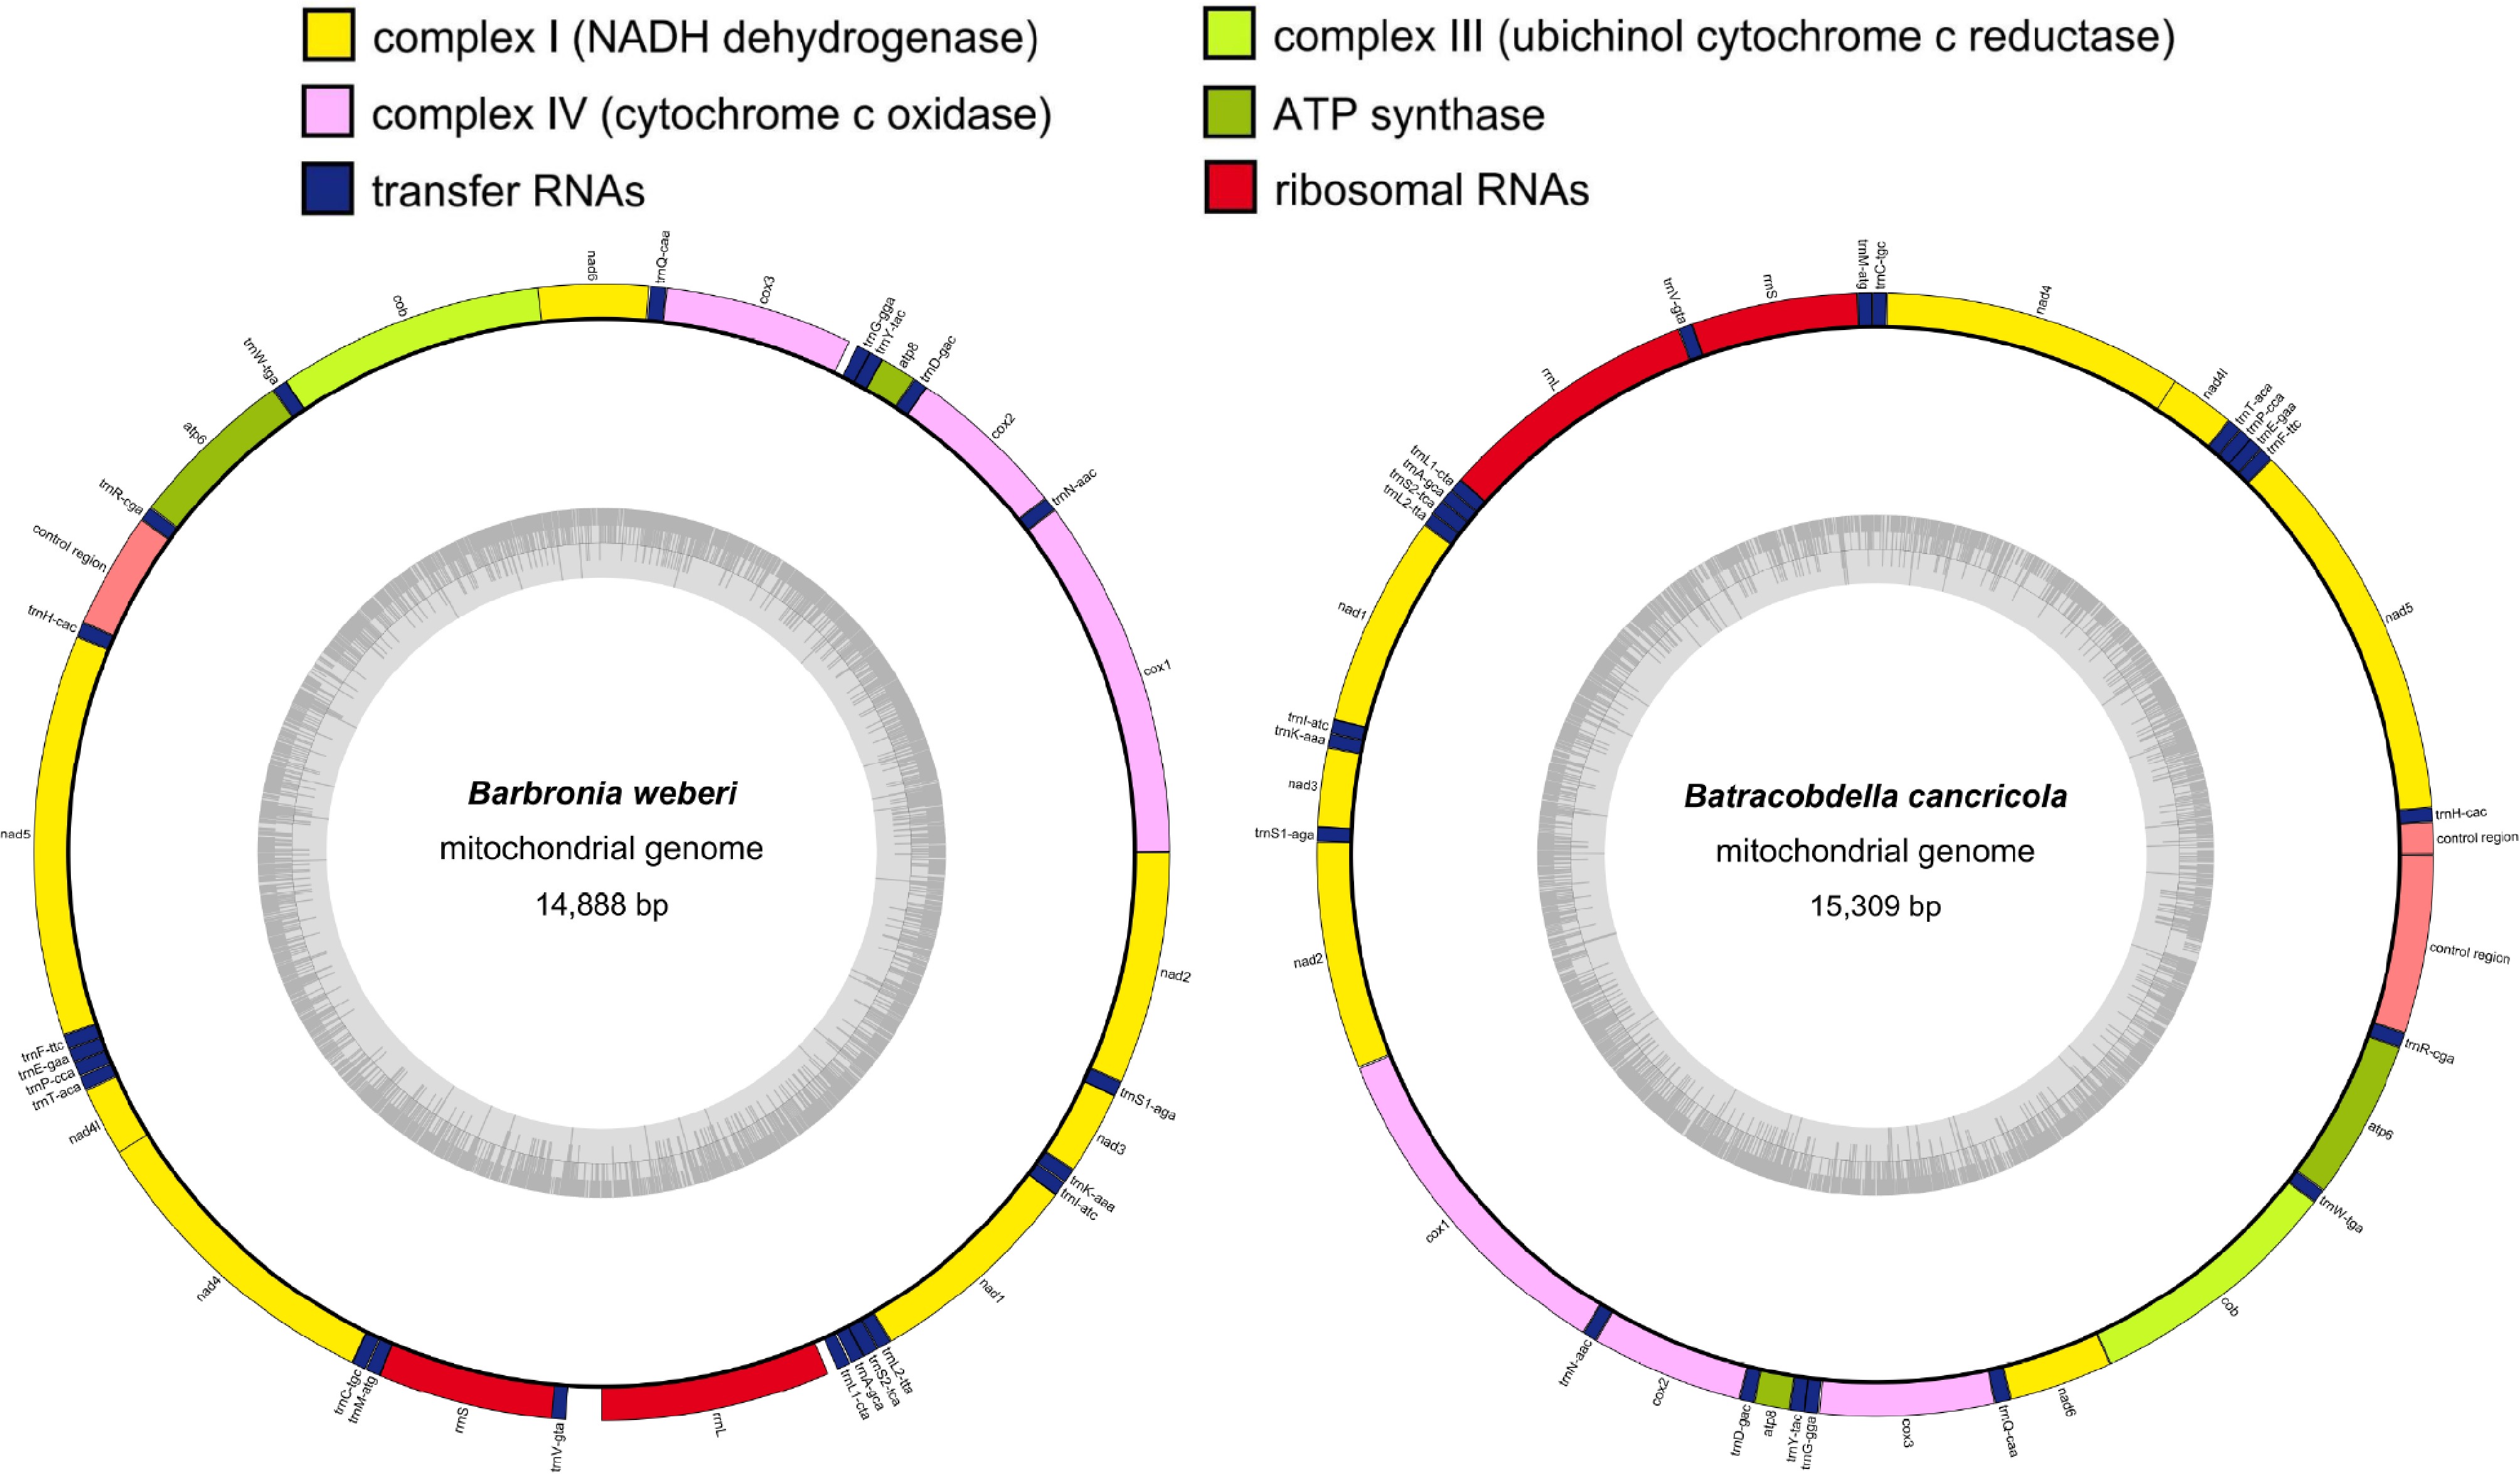
Figure 1.
The circular mitogenomes of two firstly sequenced leech species. Genes are characterized by different color blocks. Color blocks outside each loop reveal that the genes are on the heavy strand.
-
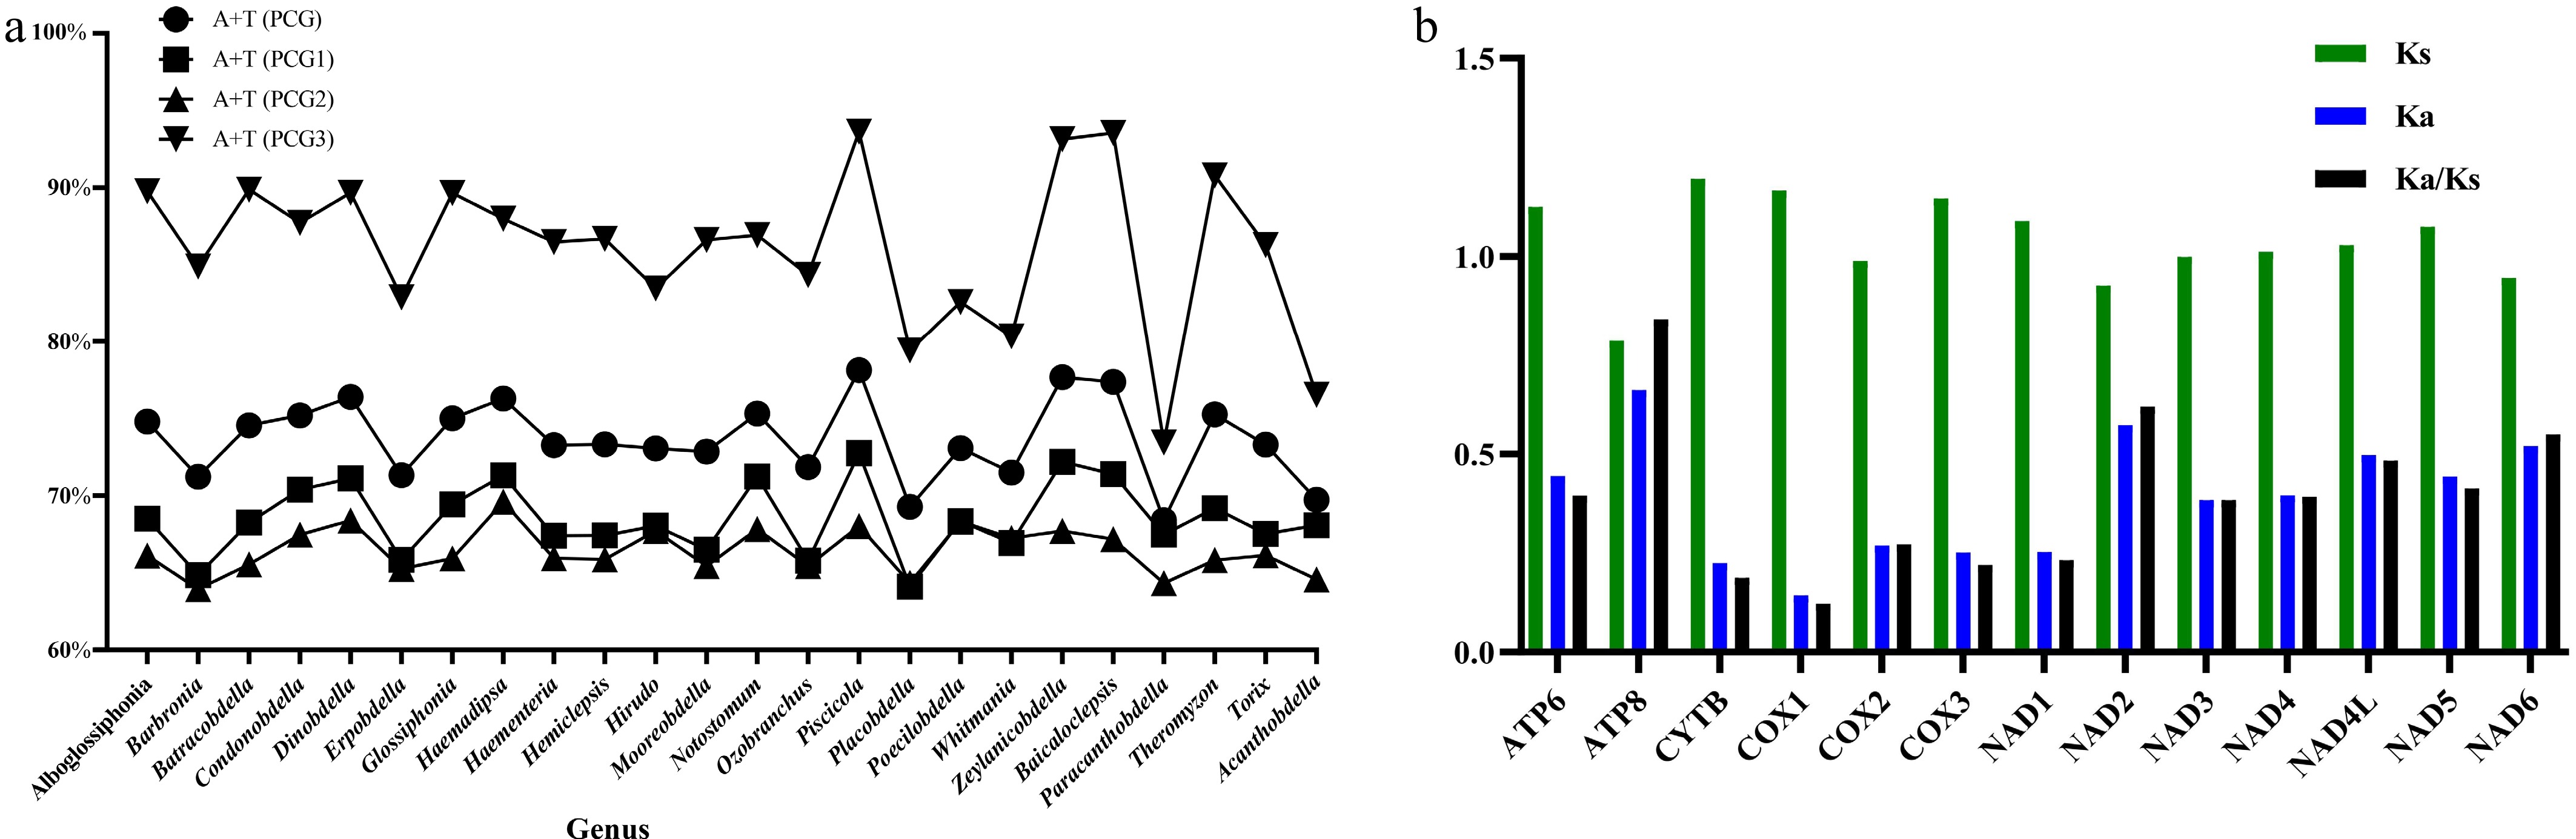
Figure 2.
Average base composition of 13 PCGs and evolutionary rate of each PCG in the mitogenomes of 51 leech species. (a) The AT content of the 1st, 2nd, and 3rd codon positions of 13 PCGs. (b) Synonymous nucleotide substitutions per synonymous site (Ks), nonsynonymous nucleotide substitutions per nonsynonymous site (Ka), and the ratio of Ka/Ks.
-
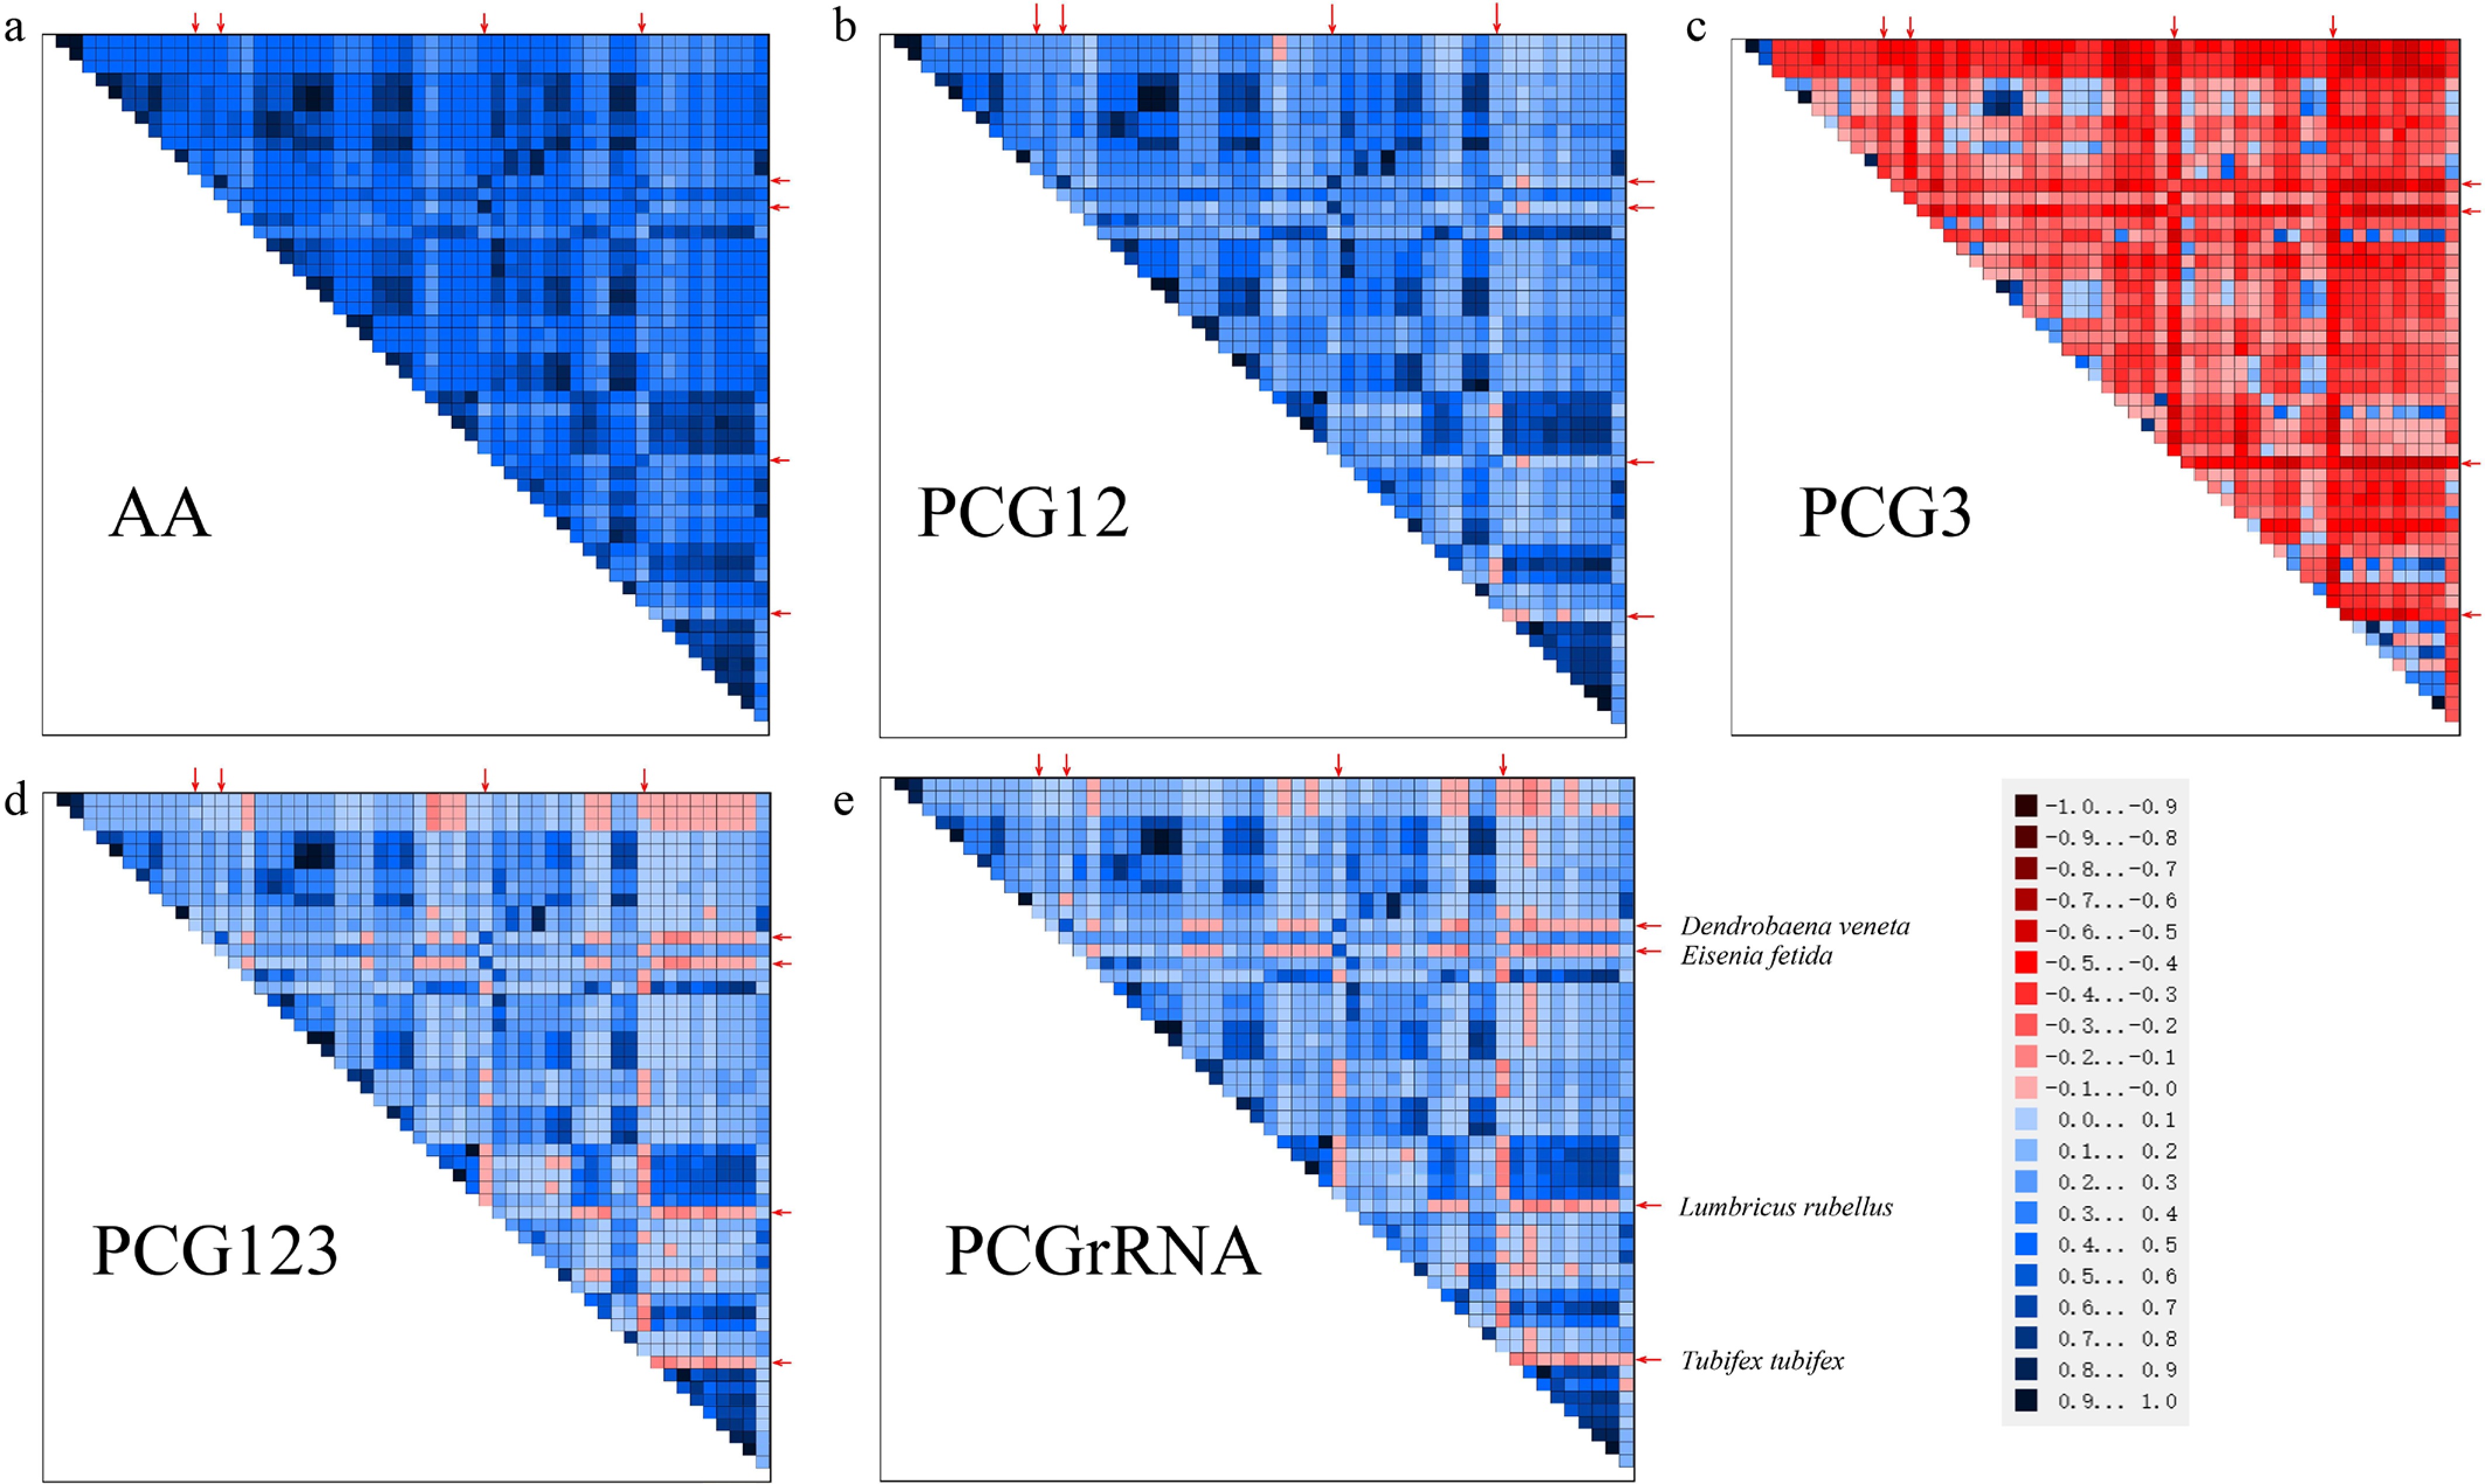
Figure 3.
Heterogeneous sequence divergence among Hirudinea mitogenomes and four outgroups (indicated by red arrows).
-
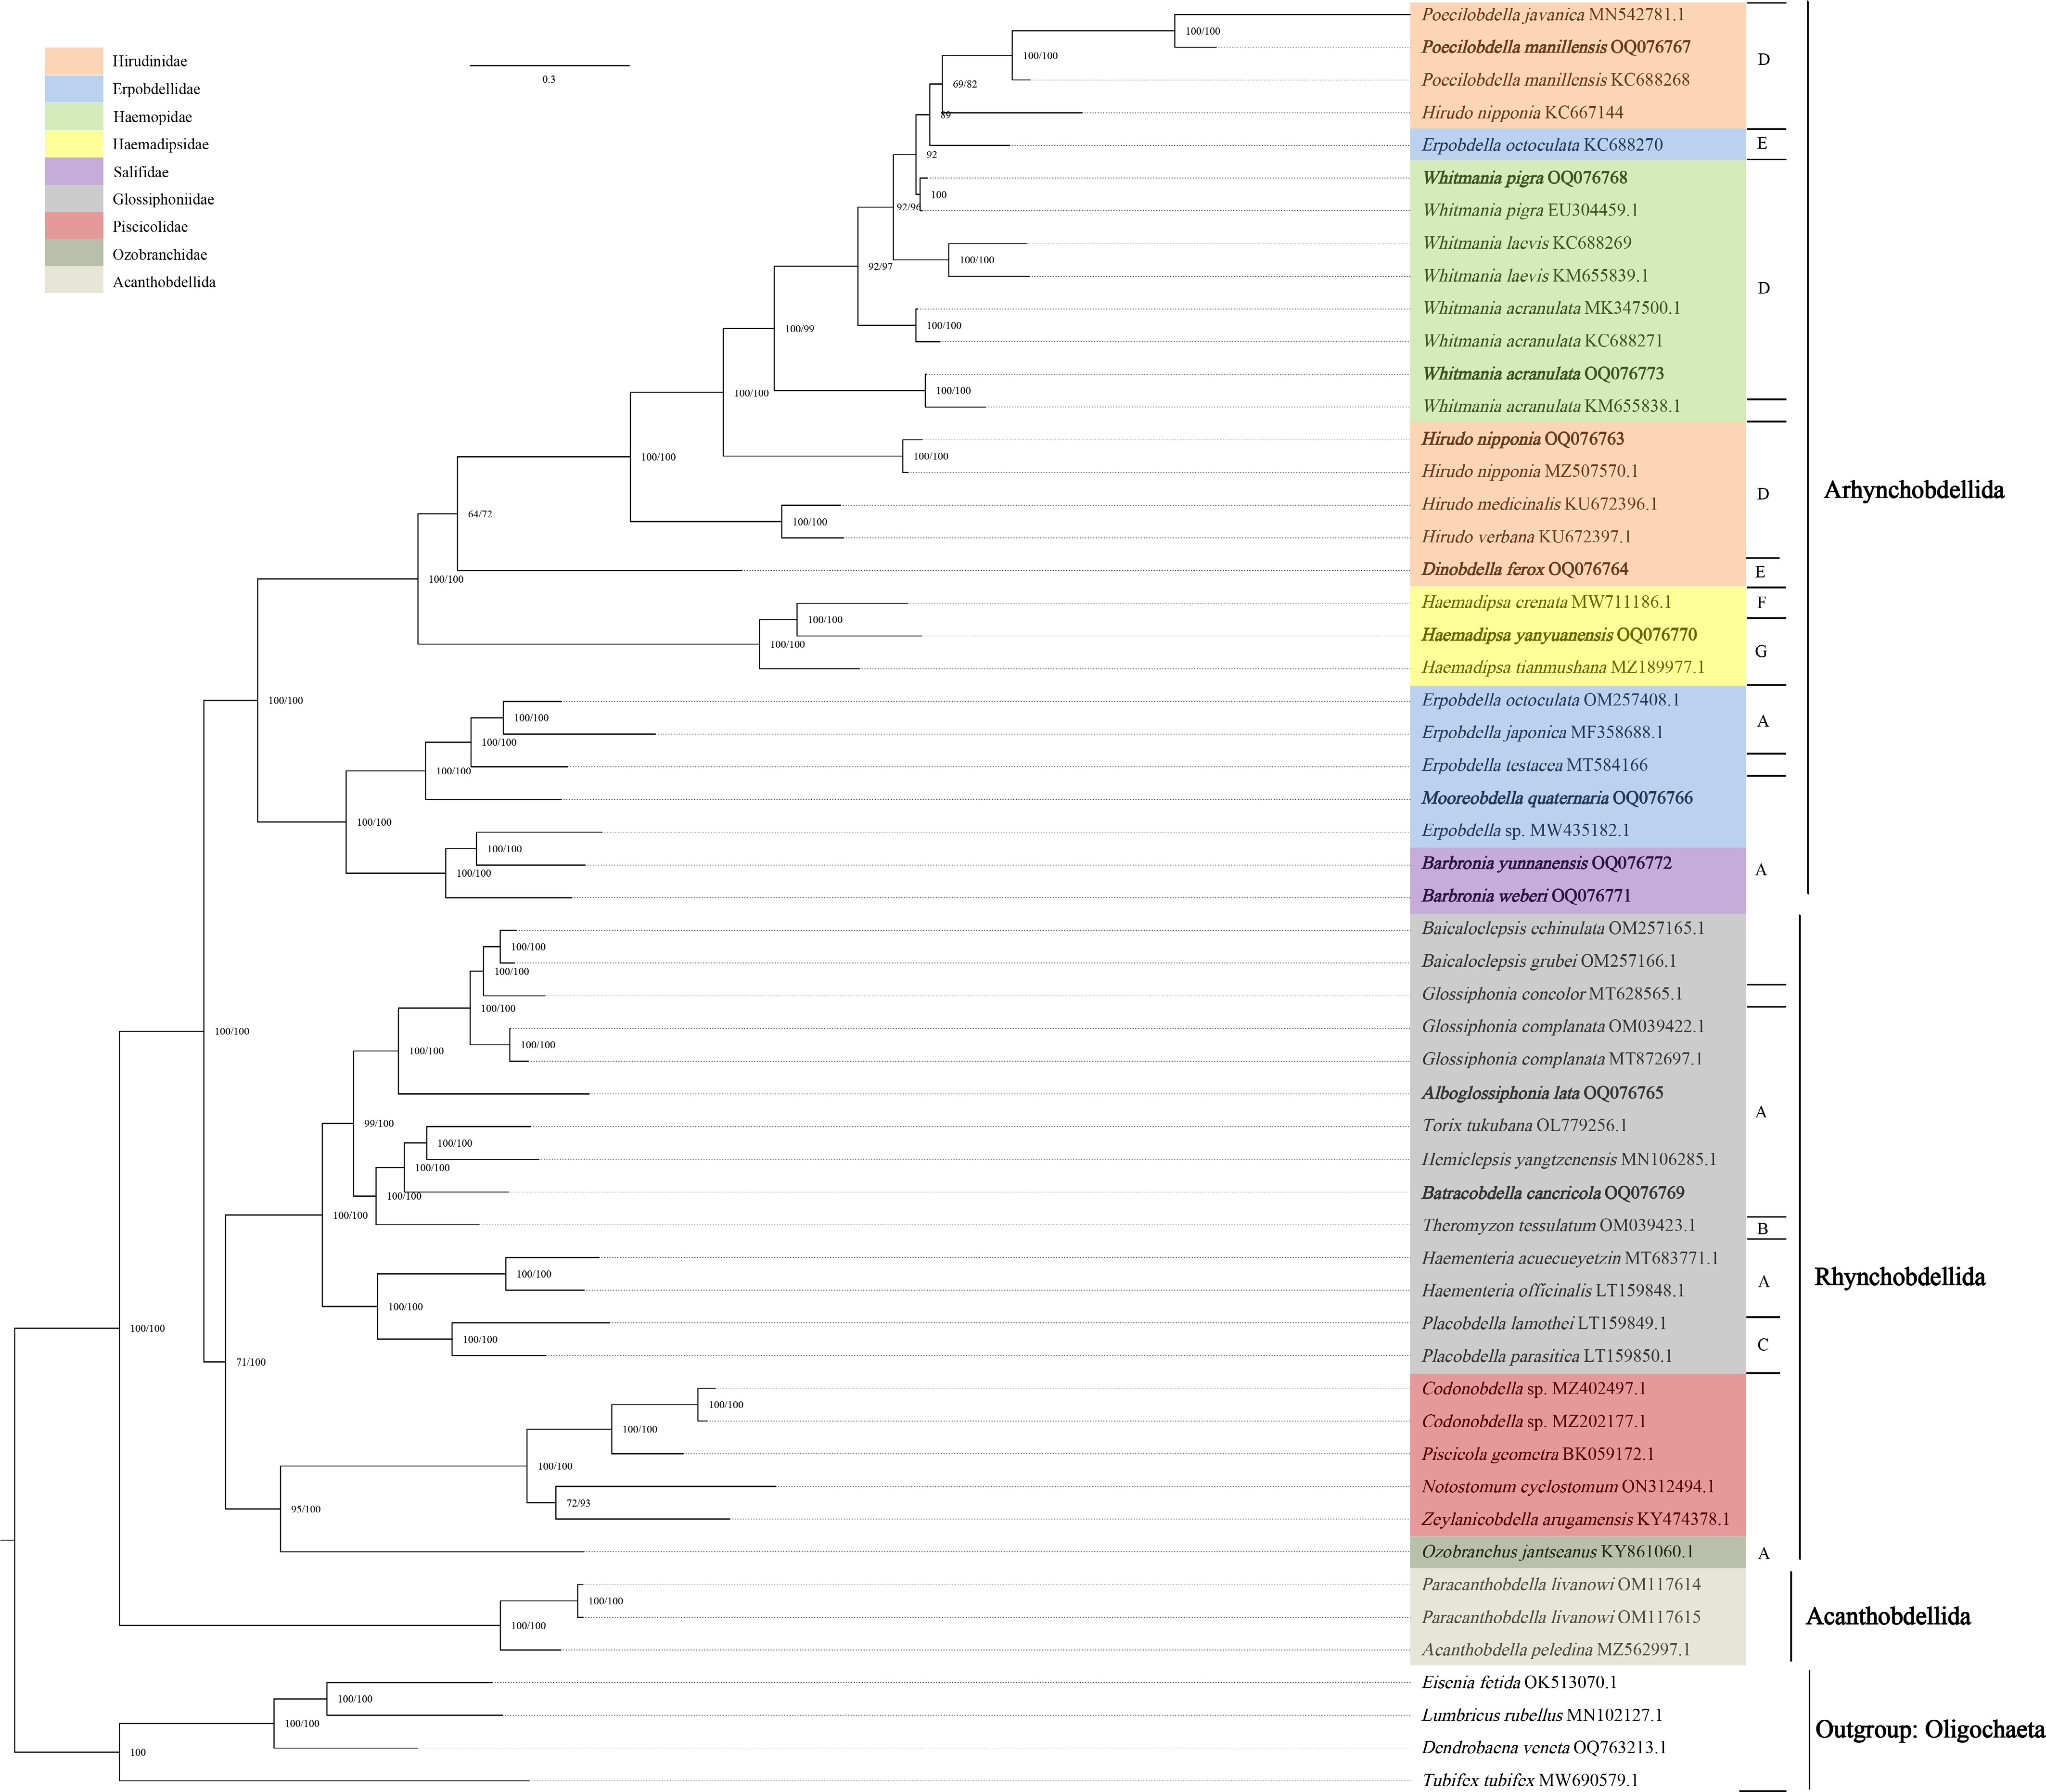
Figure 4.
Maximum likelihood phylogenetic relationships inferred from all positions of PCGs and two rRNAs (PCGrRNA). Numbers are ML bootstrap and BI PP values. A-G represent the corresponding gene order patterns in Fig. 5. Different colors represent different families in Hirudinea. The 11 newly sequenced sequences were displayed in bold.
-
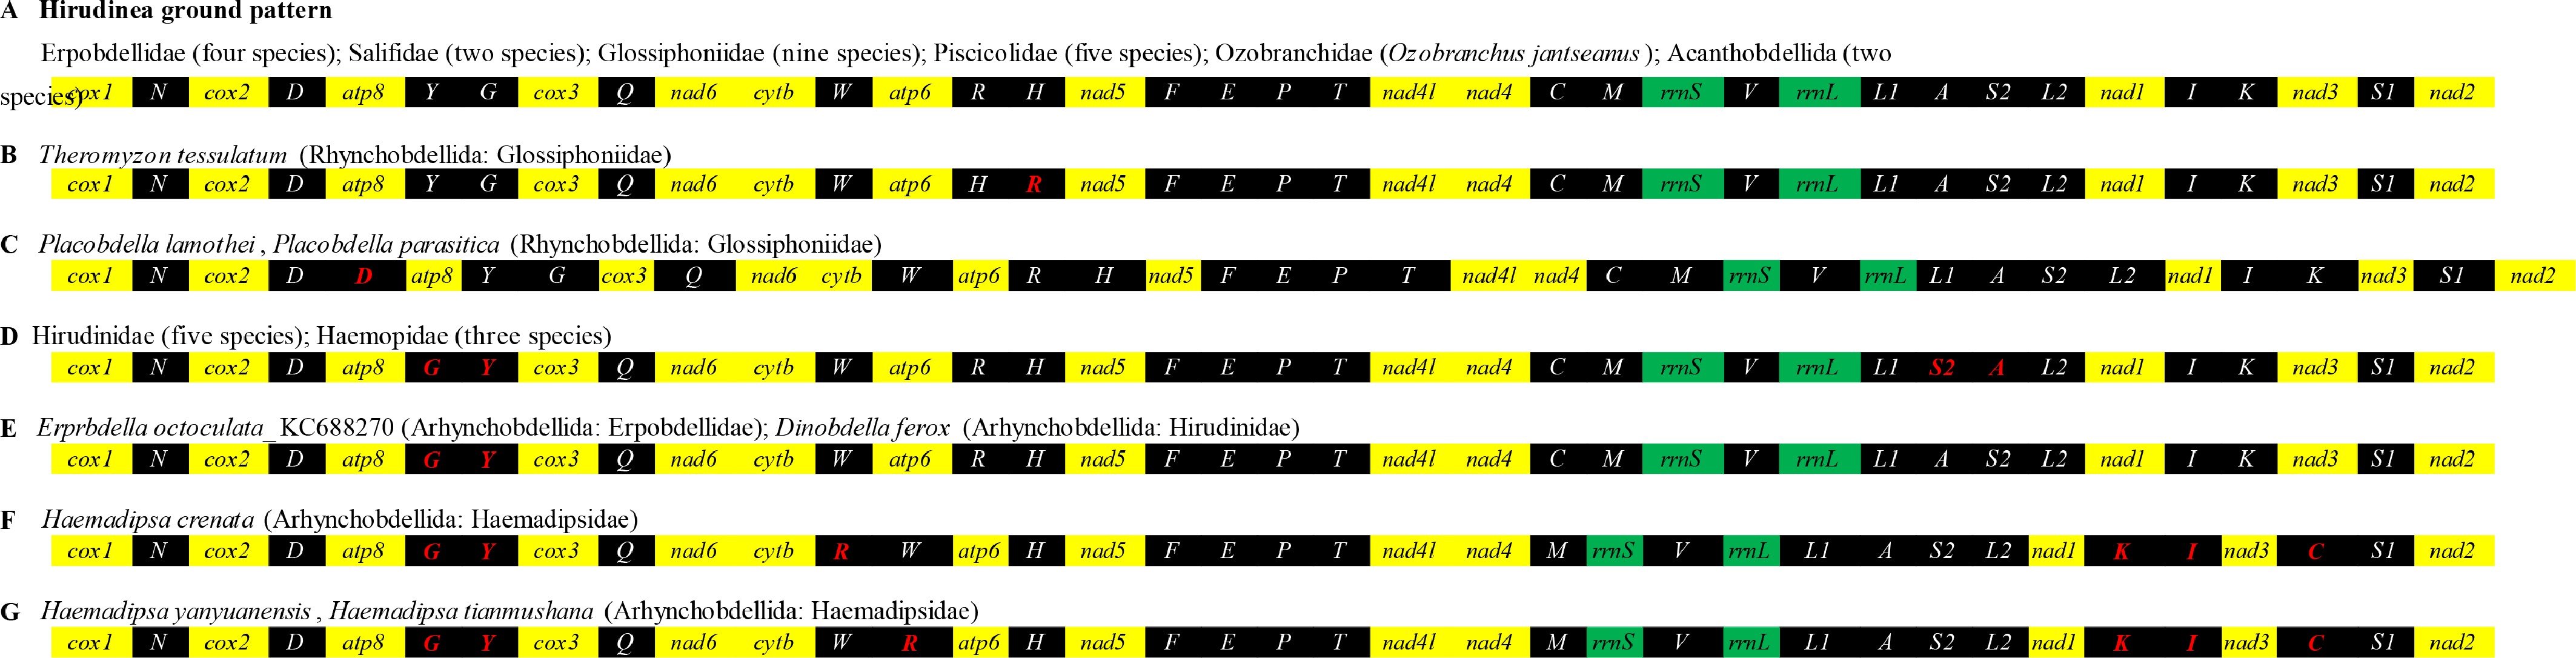
Figure 5.
Seven gene order patterns identified among the Hirudinea mitogenomes in this study. All genes are encoded on the same strand. PCGs, tRNAs, and rRNAs are marked by yellow, black, and green, respectively, and the rearrangements of tRNAs are shown in red.
-
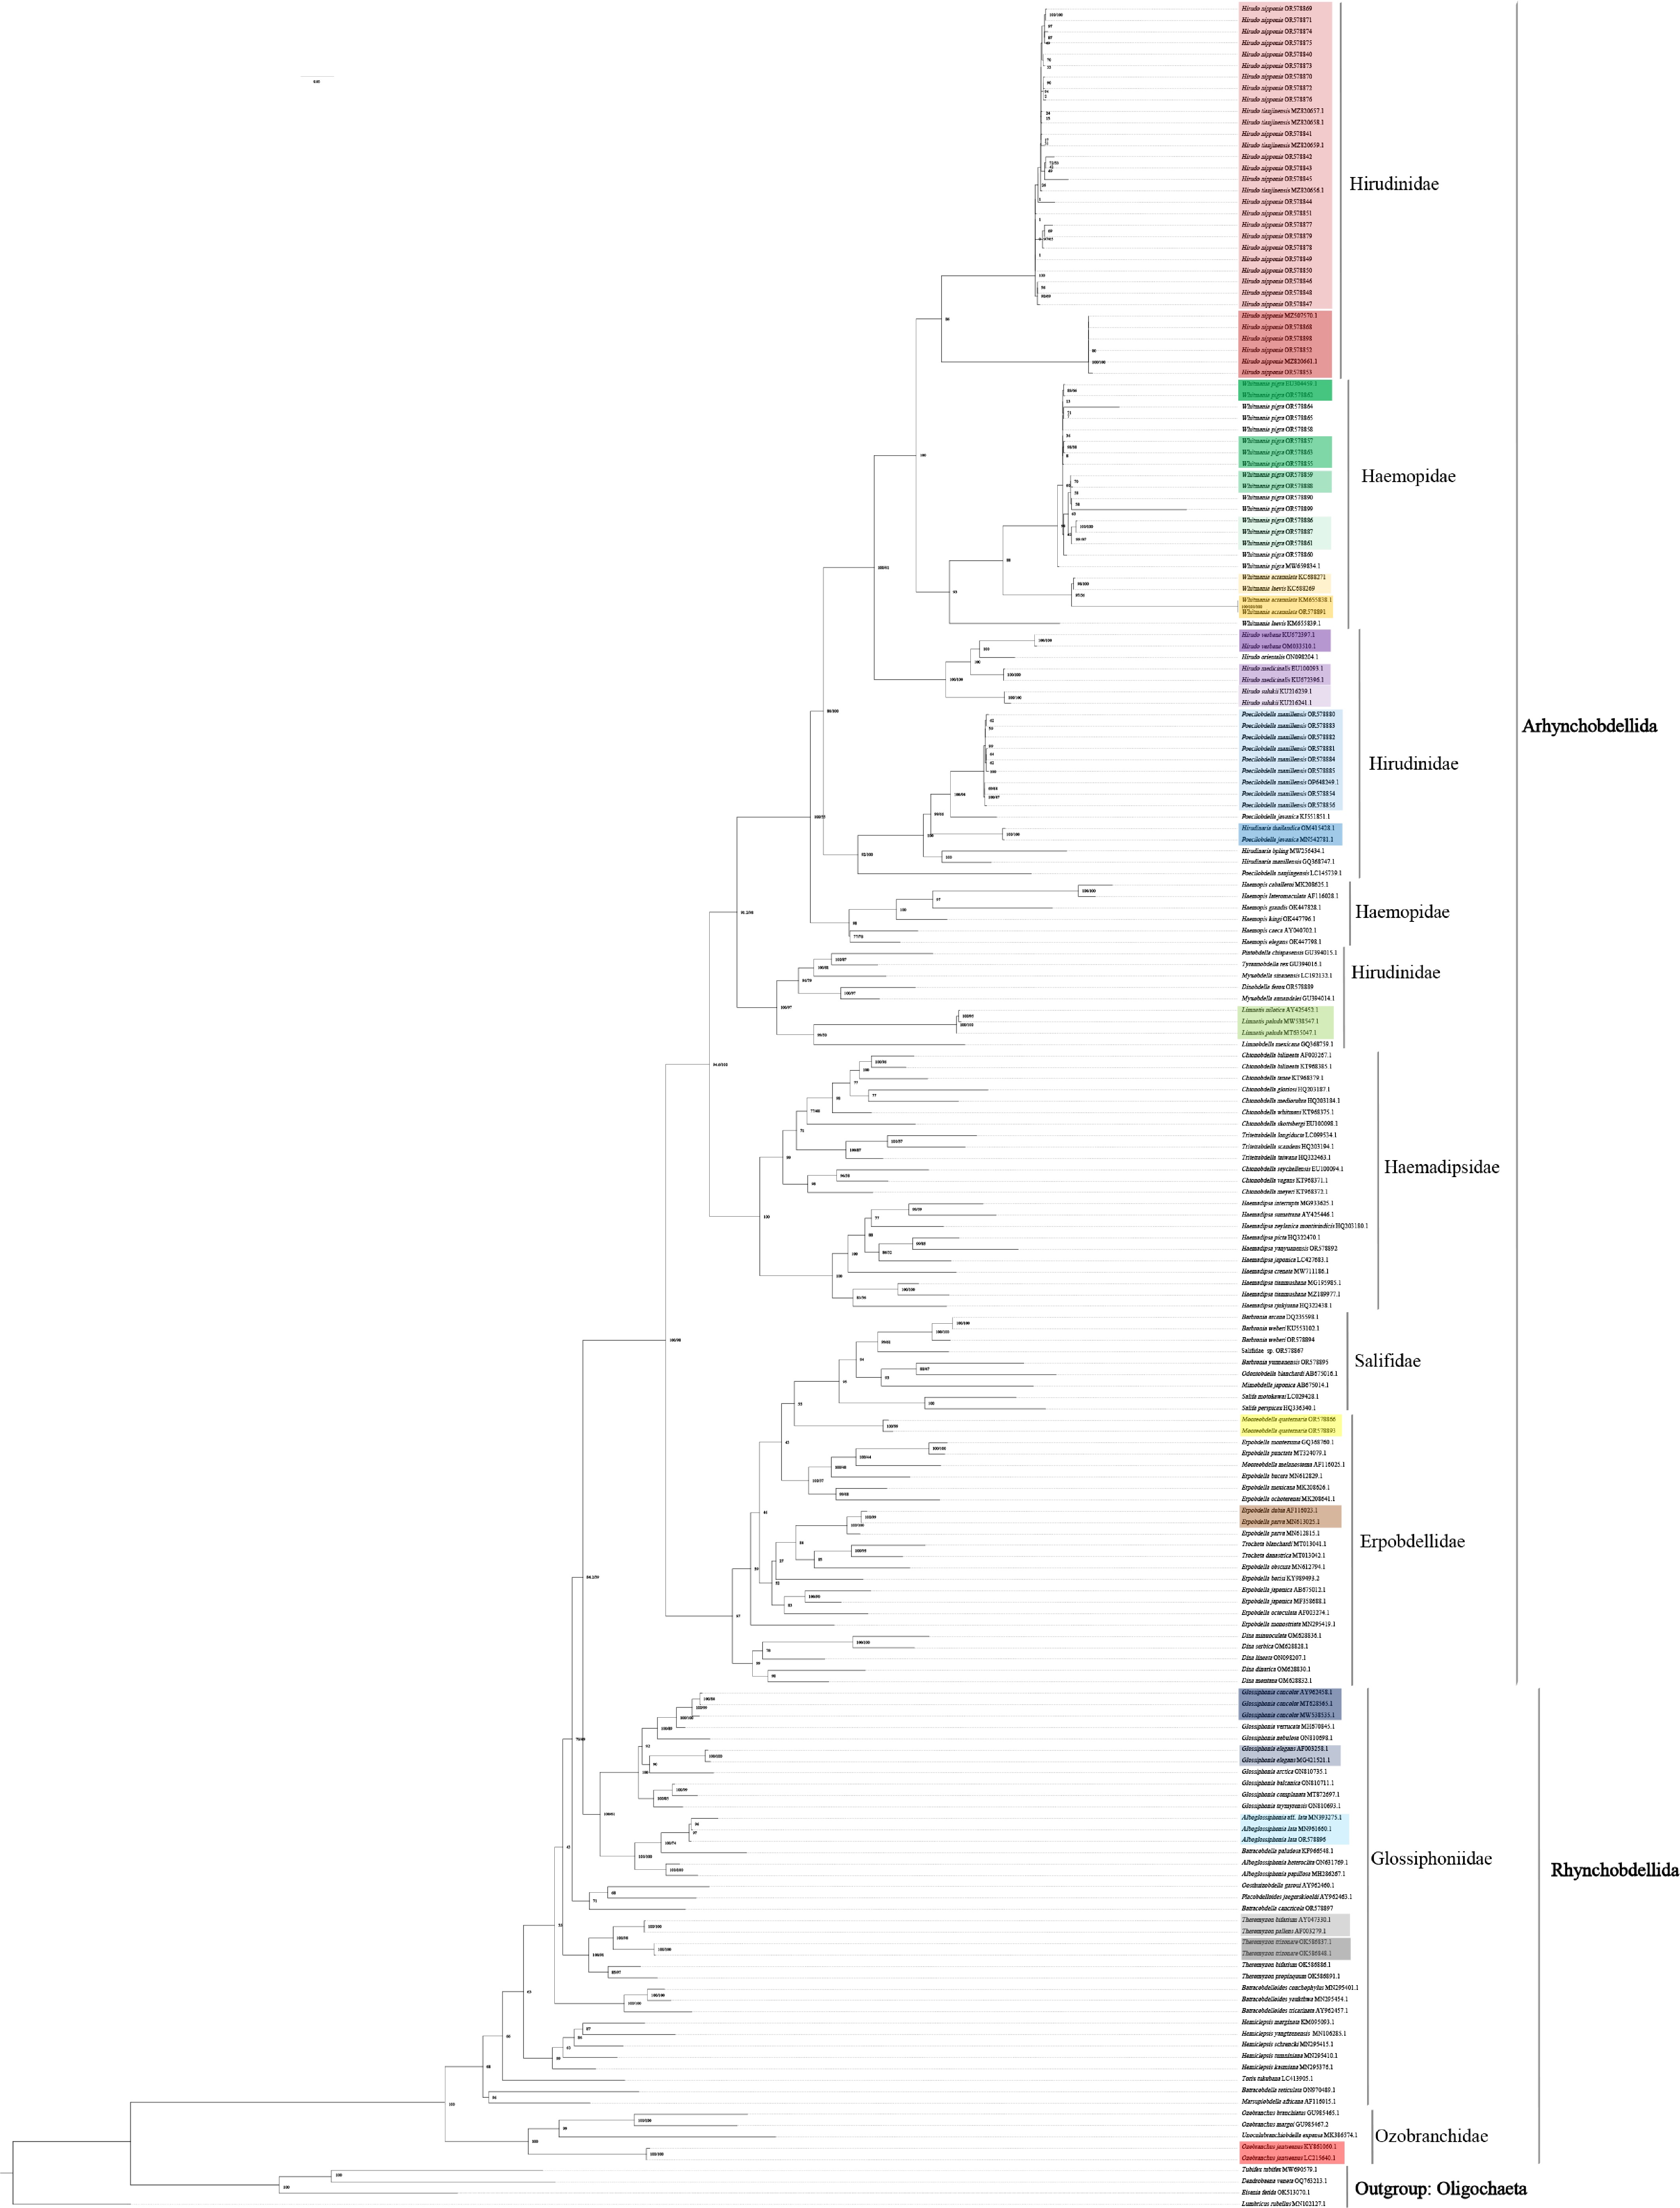
Figure 6.
Maximum likelihood phylogenetic tree based on 190 Hirudinea COX1 sequences. Numbers are bootstrap values. Species represented by the same color block are delimited as a single MOTU (molecular operational taxonomic unit) by species delimitation analysis, and each unmarked species corresponds to an individual MOTU.
Figures
(6)
Tables
(0)