-
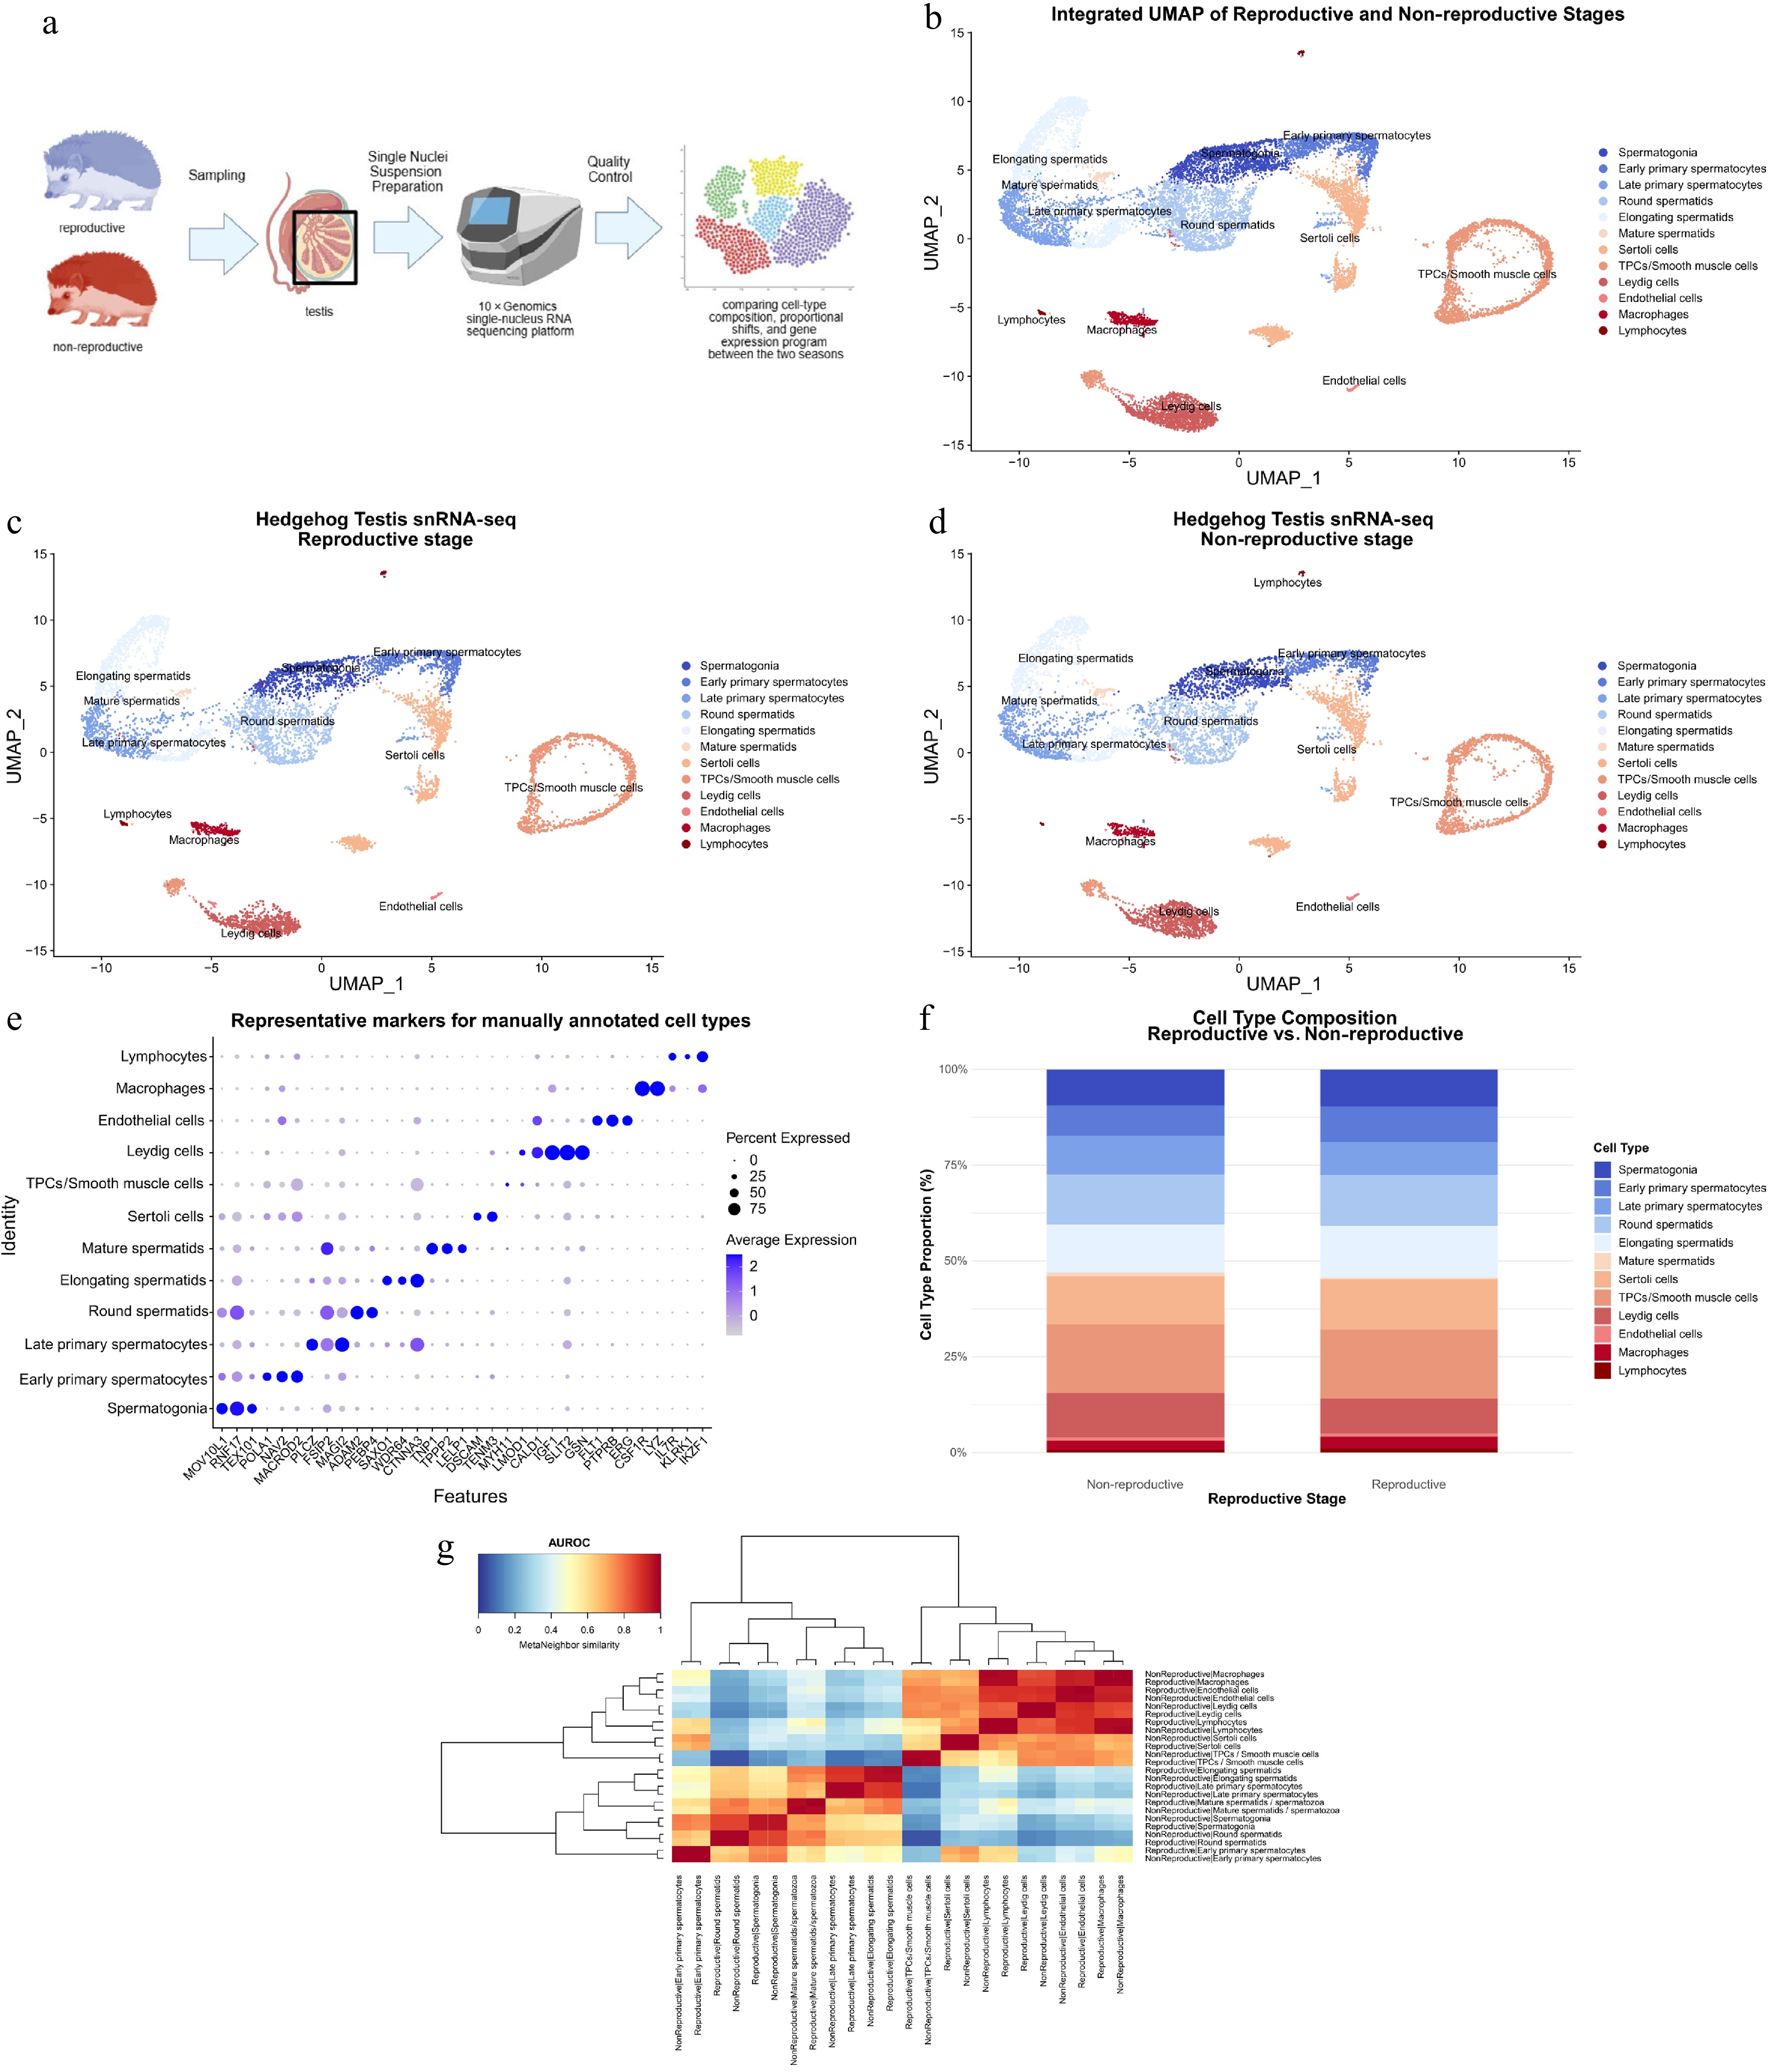
Figure 1.
Single-nucleus transcriptomic landscape of the testis across reproductive and non-reproductive stages. (a) Schematic workflow of the experimental design, including testis tissue sampling from individuals in reproductive and non-reproductive stages, single-nuclei suspension preparation, 10× Genomics snRNA-seq, and downstream bioinformatic analysis. Created with BioGDP.com[42]. (b) Integrated UMAP (Uniform Manifold Approximation and Projection) visualization of the combined dataset, showing the distribution of testicular cell populations. Twelve distinct cell clusters were identified, encompassing both germ cells and somatic cells. (c) Stage-specific UMAP plot illustrating the cellular distribution in the reproductive stage. (d) Stage-specific UMAP plot illustrating the cellular distribution in the non-reproductive stage. (e) Dot plot showing the expression of representative marker genes used for the manual annotation of the 12 cell types. The size of each dot represents the percentage of cells within a cluster expressing the gene (Percent Expressed), and the color intensity reflects the average expression level (Average Expression). (f) Comparison of cell type composition between reproductive and non-reproductive stages. The stacked bar chart shows the relative proportion (%) of each cell type, highlighting the shift in the cellular landscape during different reproductive cycles. (g) Heatmap of pairwise AUROC values from MetaNeighbor cross-validation of matched cell types across stages (average AUROC = 0.985), demonstrating high transcriptomic conservation.
-
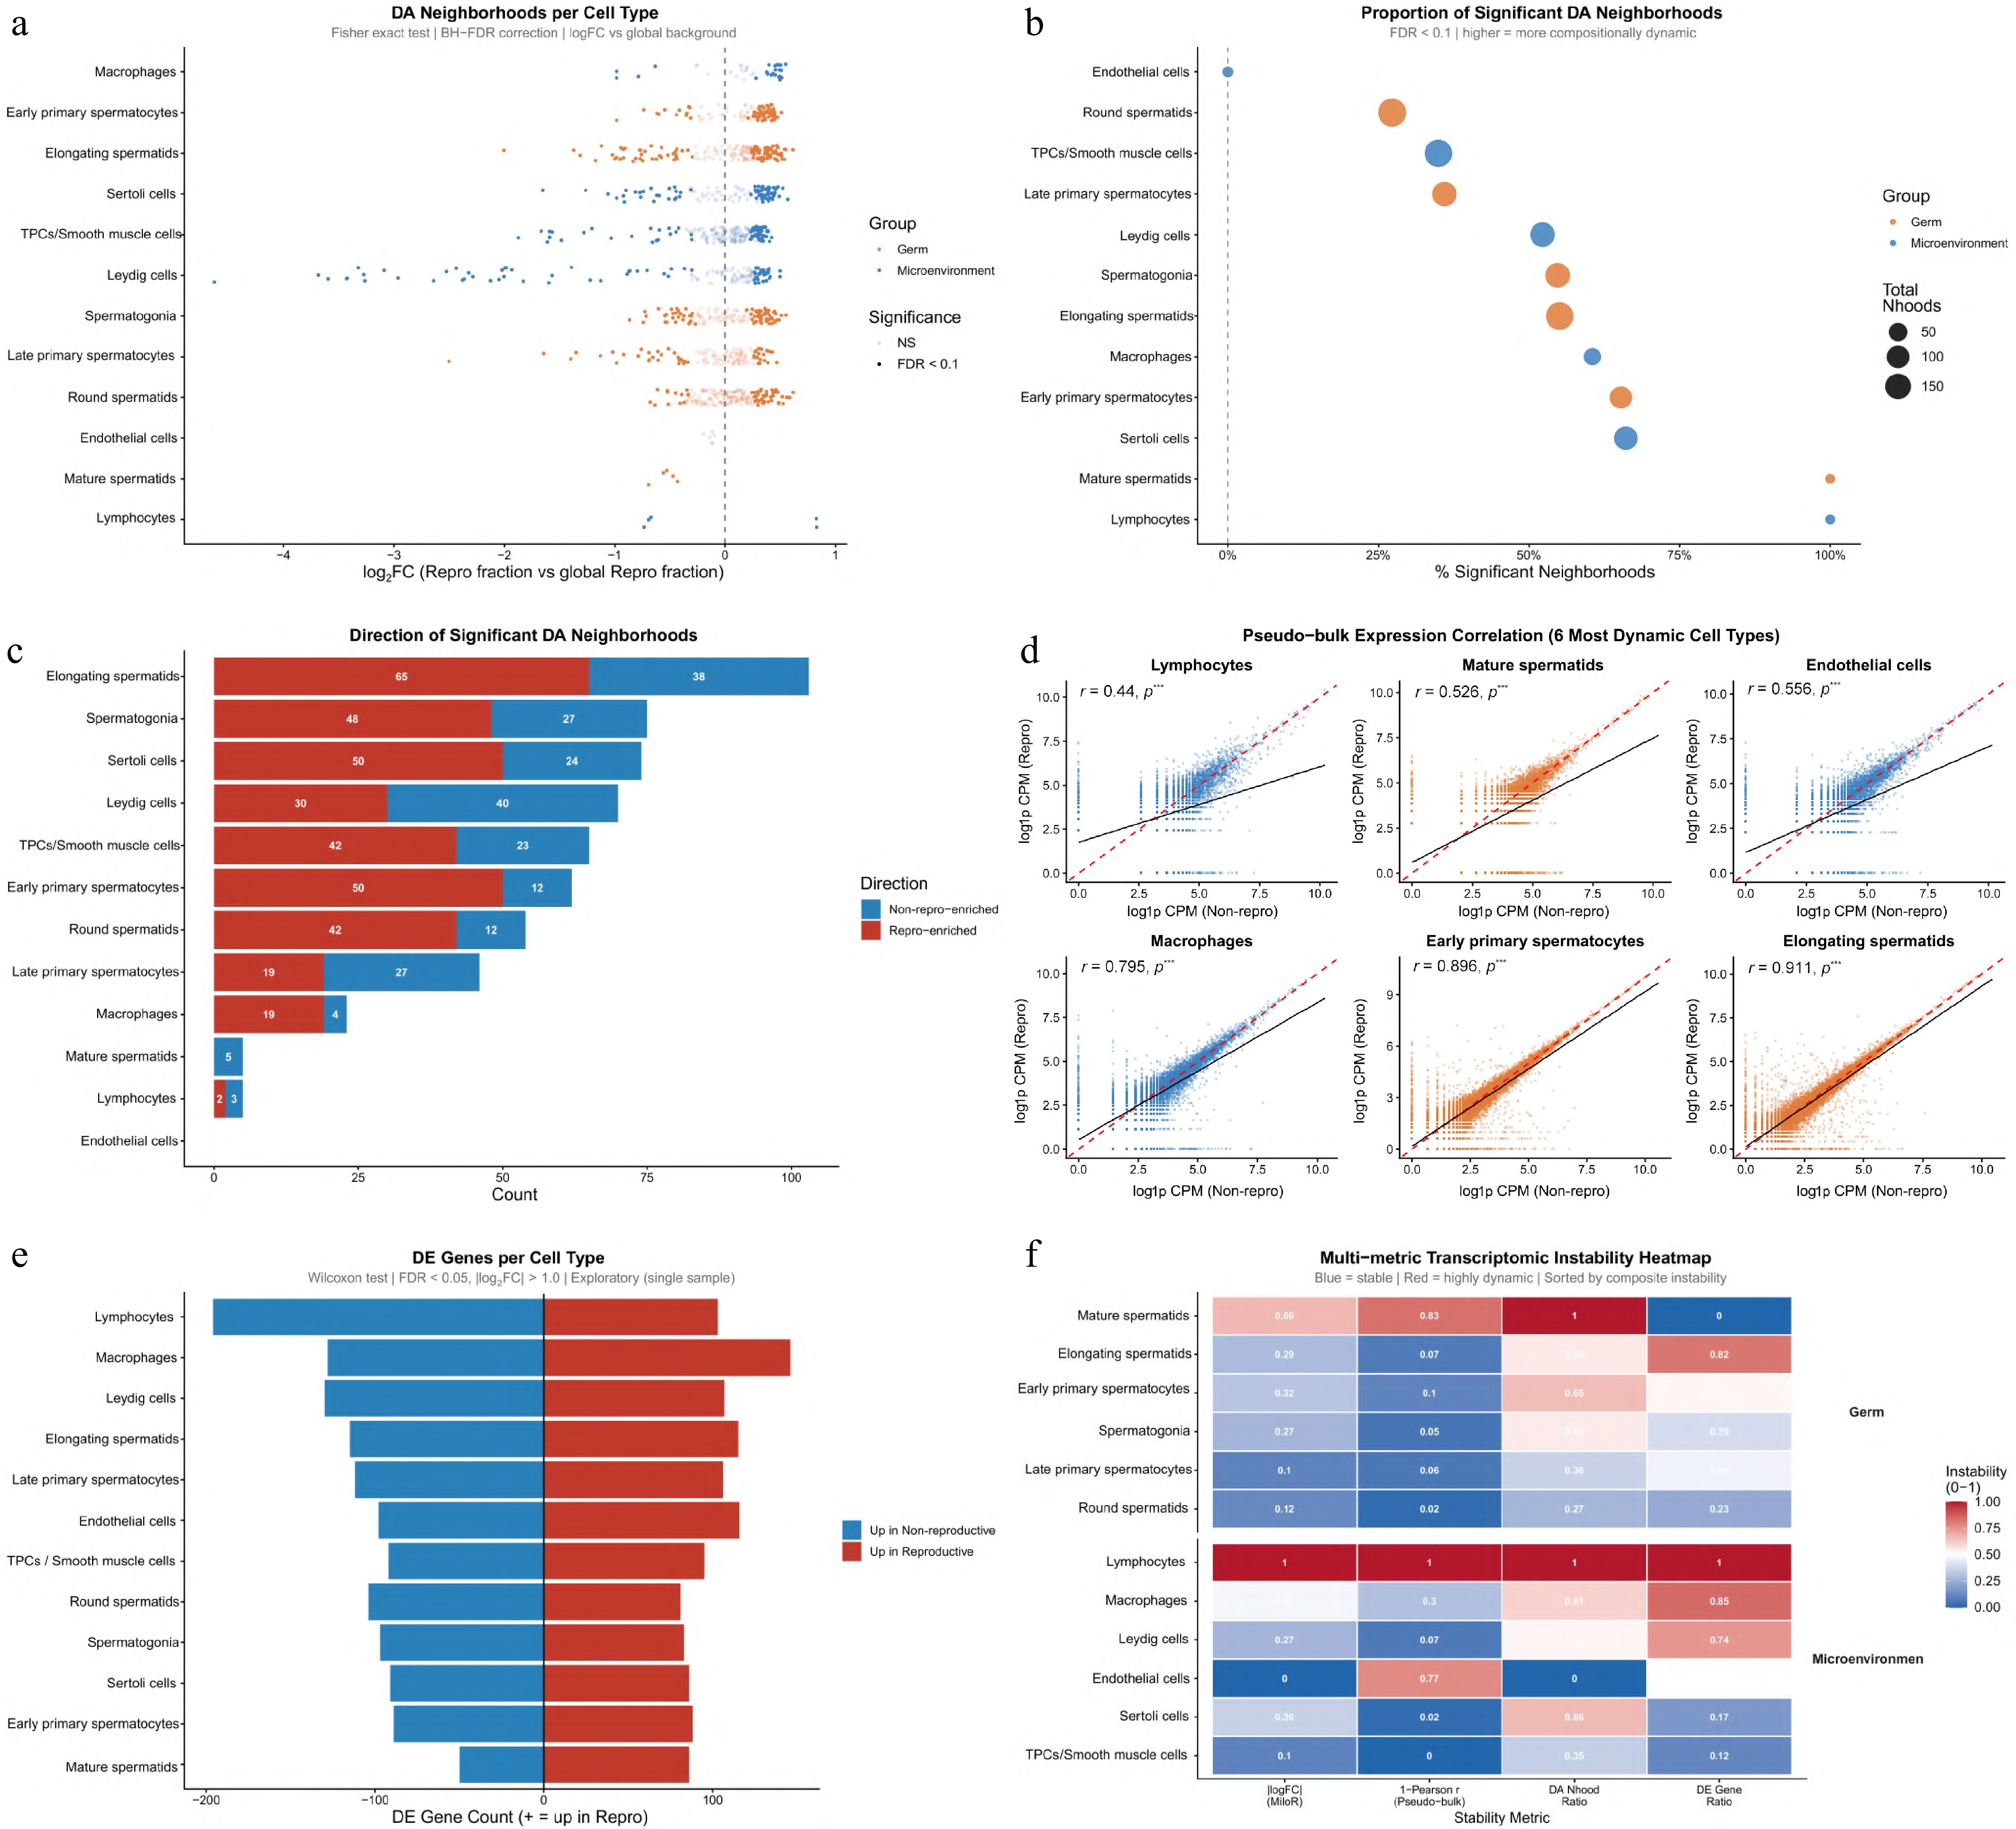
Figure 2.
Comparative transcriptomic analysis and differential abundance of testicular cell populations between reproductive and non-reproductive stages. (a) DA neighborhoods per cell type identified by MiloR analysis. (b) Proportion of significant DA neighborhoods (SpatialFDR < 0.1) per cell type. (c) Direction of significant DA neighborhoods (enrichment in reproductive vs non-reproductive stage), with positive logFC indicating enrichment in the reproductive stage. (d) Pseudo-bulk expression correlation for the six most dynamic cell types. Scatter plots illustrate the correlation of log10-transformed counts per million (CPM) between the reproductive and non-reproductive stages. Pearson correlation coefficients (r) are indicated, highlighting the global transcriptional shifts within each lineage. (e) Quantitative distribution of differentially expressed genes (DEGs) per cell type. The horizontal bar chart shows the number of upregulated genes in the reproductive stage (red) vs. the non-reproductive stage (blue). Cell types are ranked by the total number of DEGs. (f) Multi-metric transcriptomic instability heatmap integrating proportion of significant DA neighborhoods, absolute log2FC, DE gene ratio, and 1−Pearson r (ranked by composite instability index). Higher scores (red) indicate increased transcriptomic instability between stages.
-
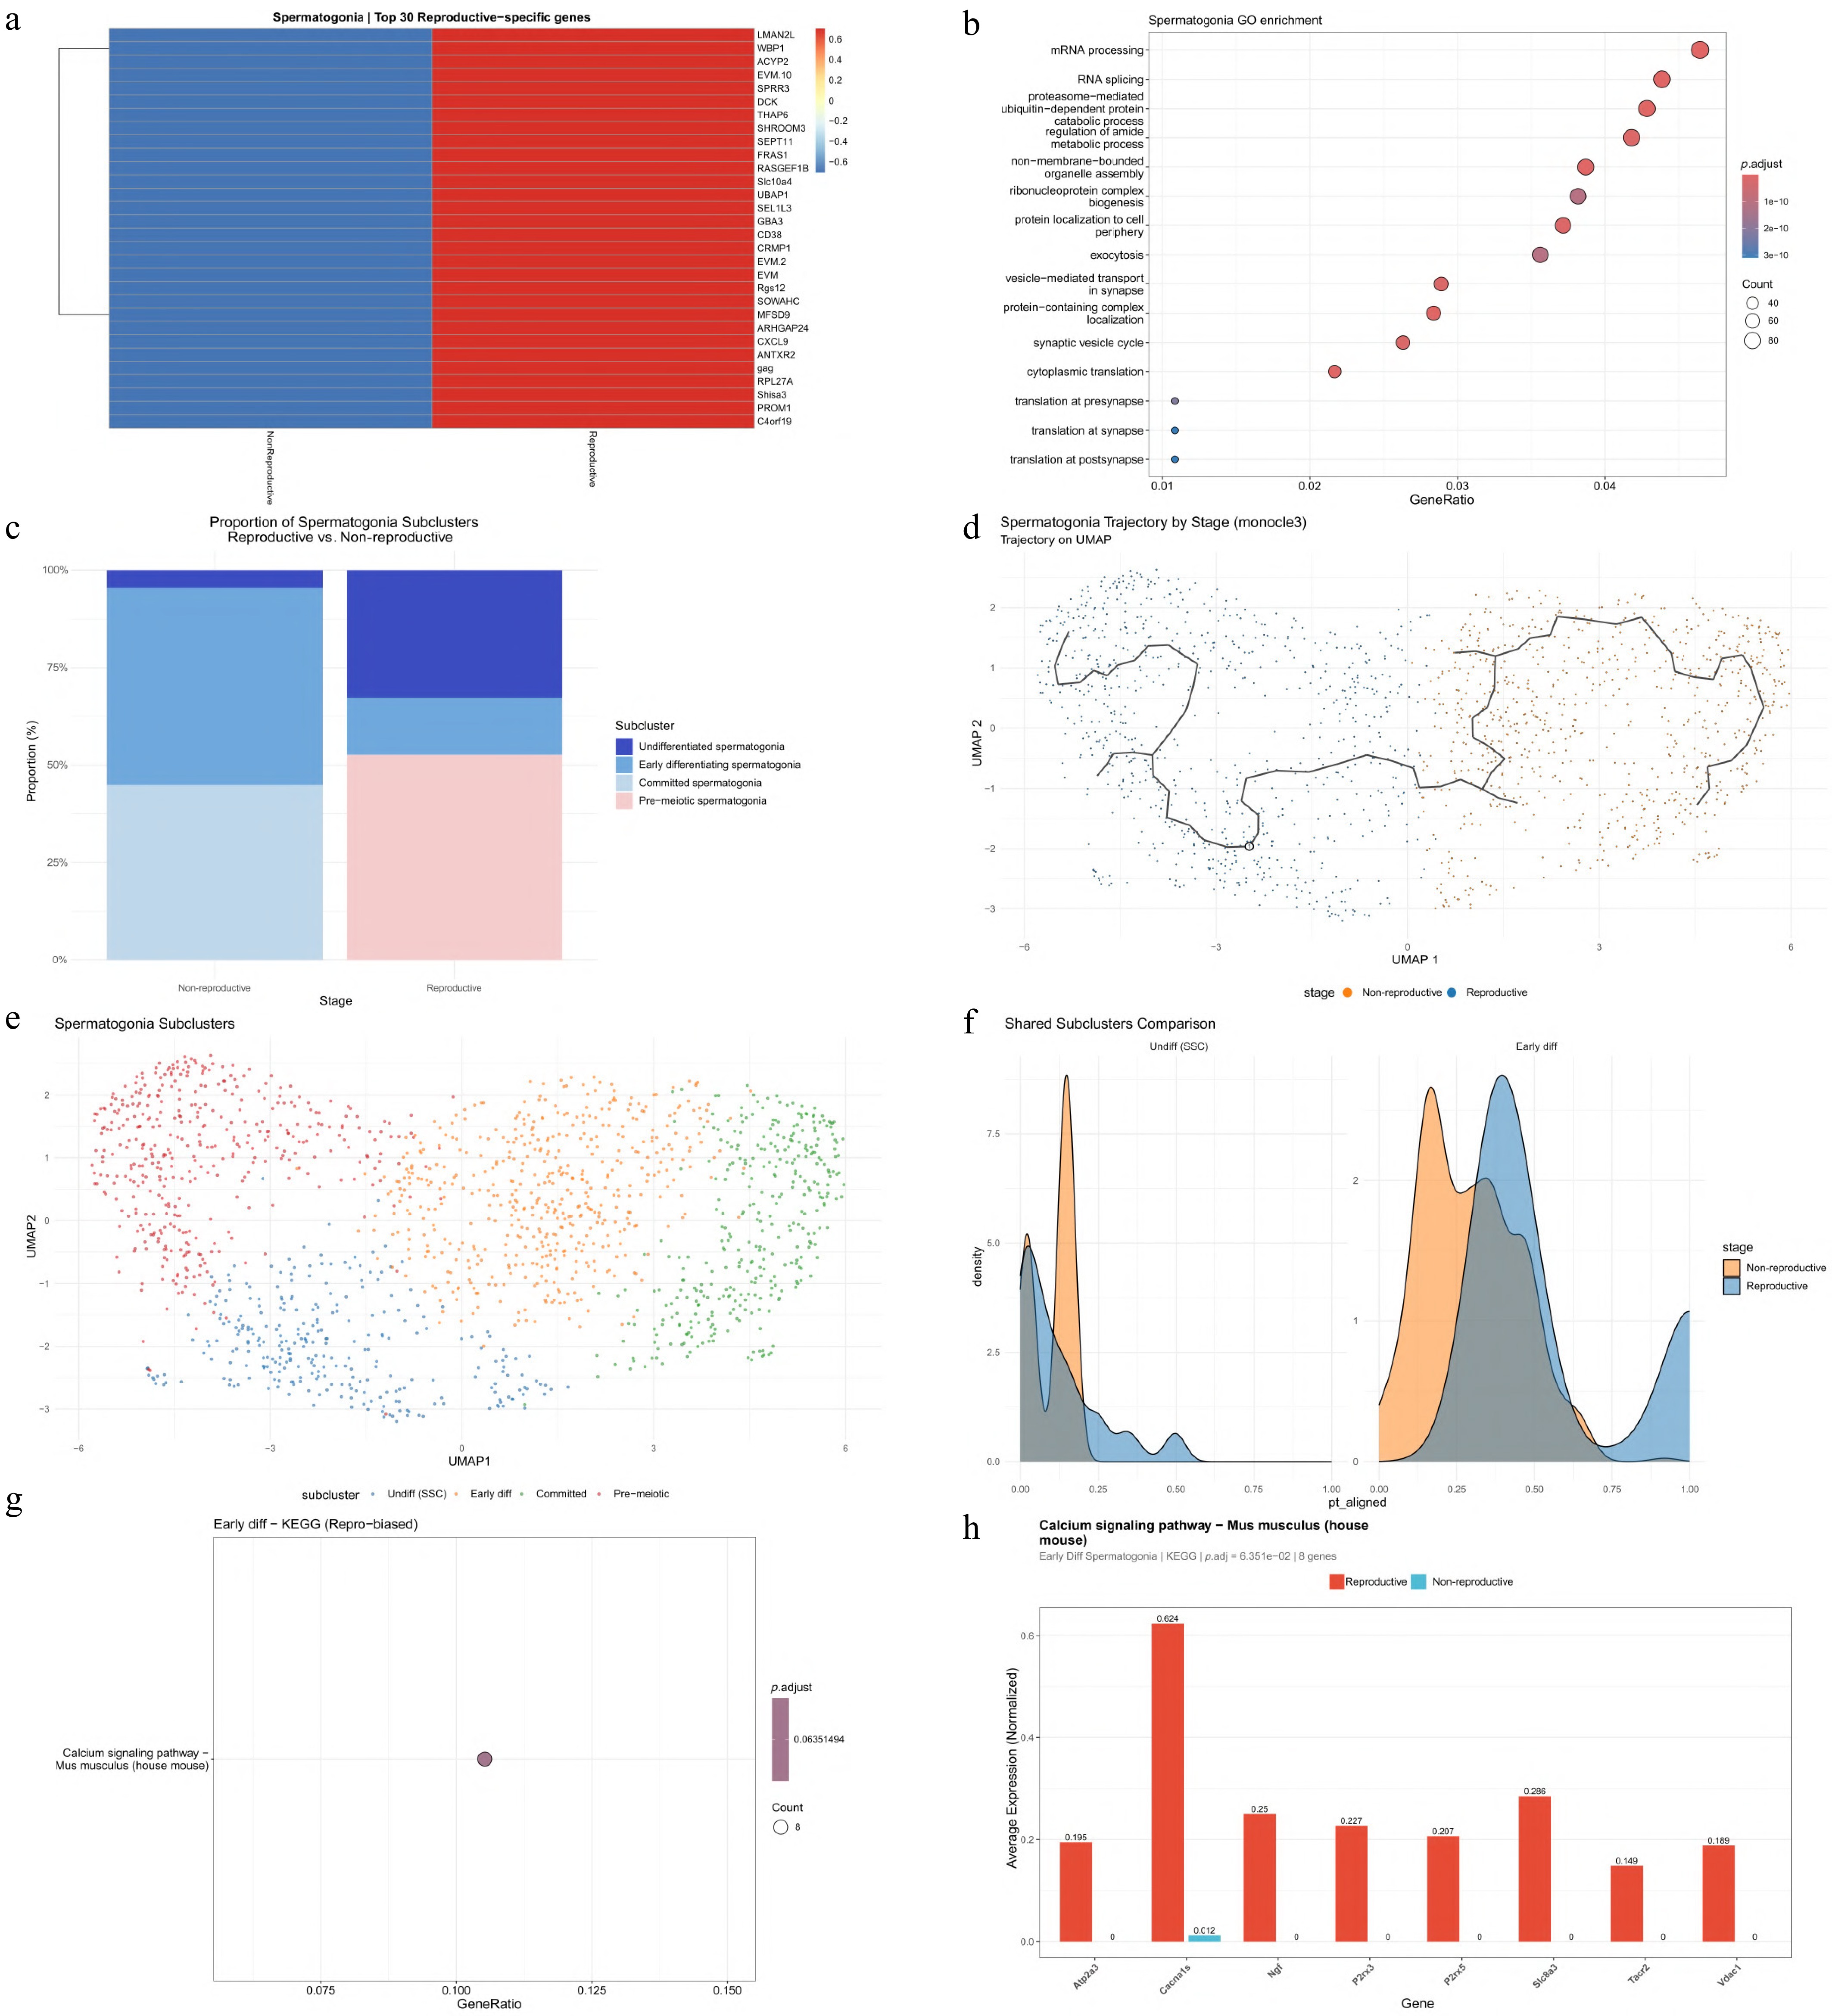
Figure 3.
Transcriptional divergence, subpopulation dynamics, and pseudotime trajectory of spermatogonia between reproductive and non-reproductive stages. (a) Heatmap of the top 30 reproductive-stage-biased genes in spermatogonia (ranked by specificity score). (b) Gene Ontology (GO) enrichment analysis of reproductive-stage-biased genes in spermatogonia. (c) Stacked bar plot showing the proportion of spermatogonial subclusters in reproductive and non-reproductive stages. (d) Monocle3 pseudotime trajectory of spermatogonia colored by reproductive and non-reproductive stages. (e) UMAP of spermatogonial subclusters highlighting subcluster identity. (f) Density plot comparing shared spermatogonial subclusters between reproductive and non-reproductive stages. (g) KEGG pathway enrichment analysis for early differentiating spermatogonia (reproductive-biased). (h) Bar plot showing expression of key calcium signaling pathway genes (mmu04020) in reproductive and non-reproductive stages.
-
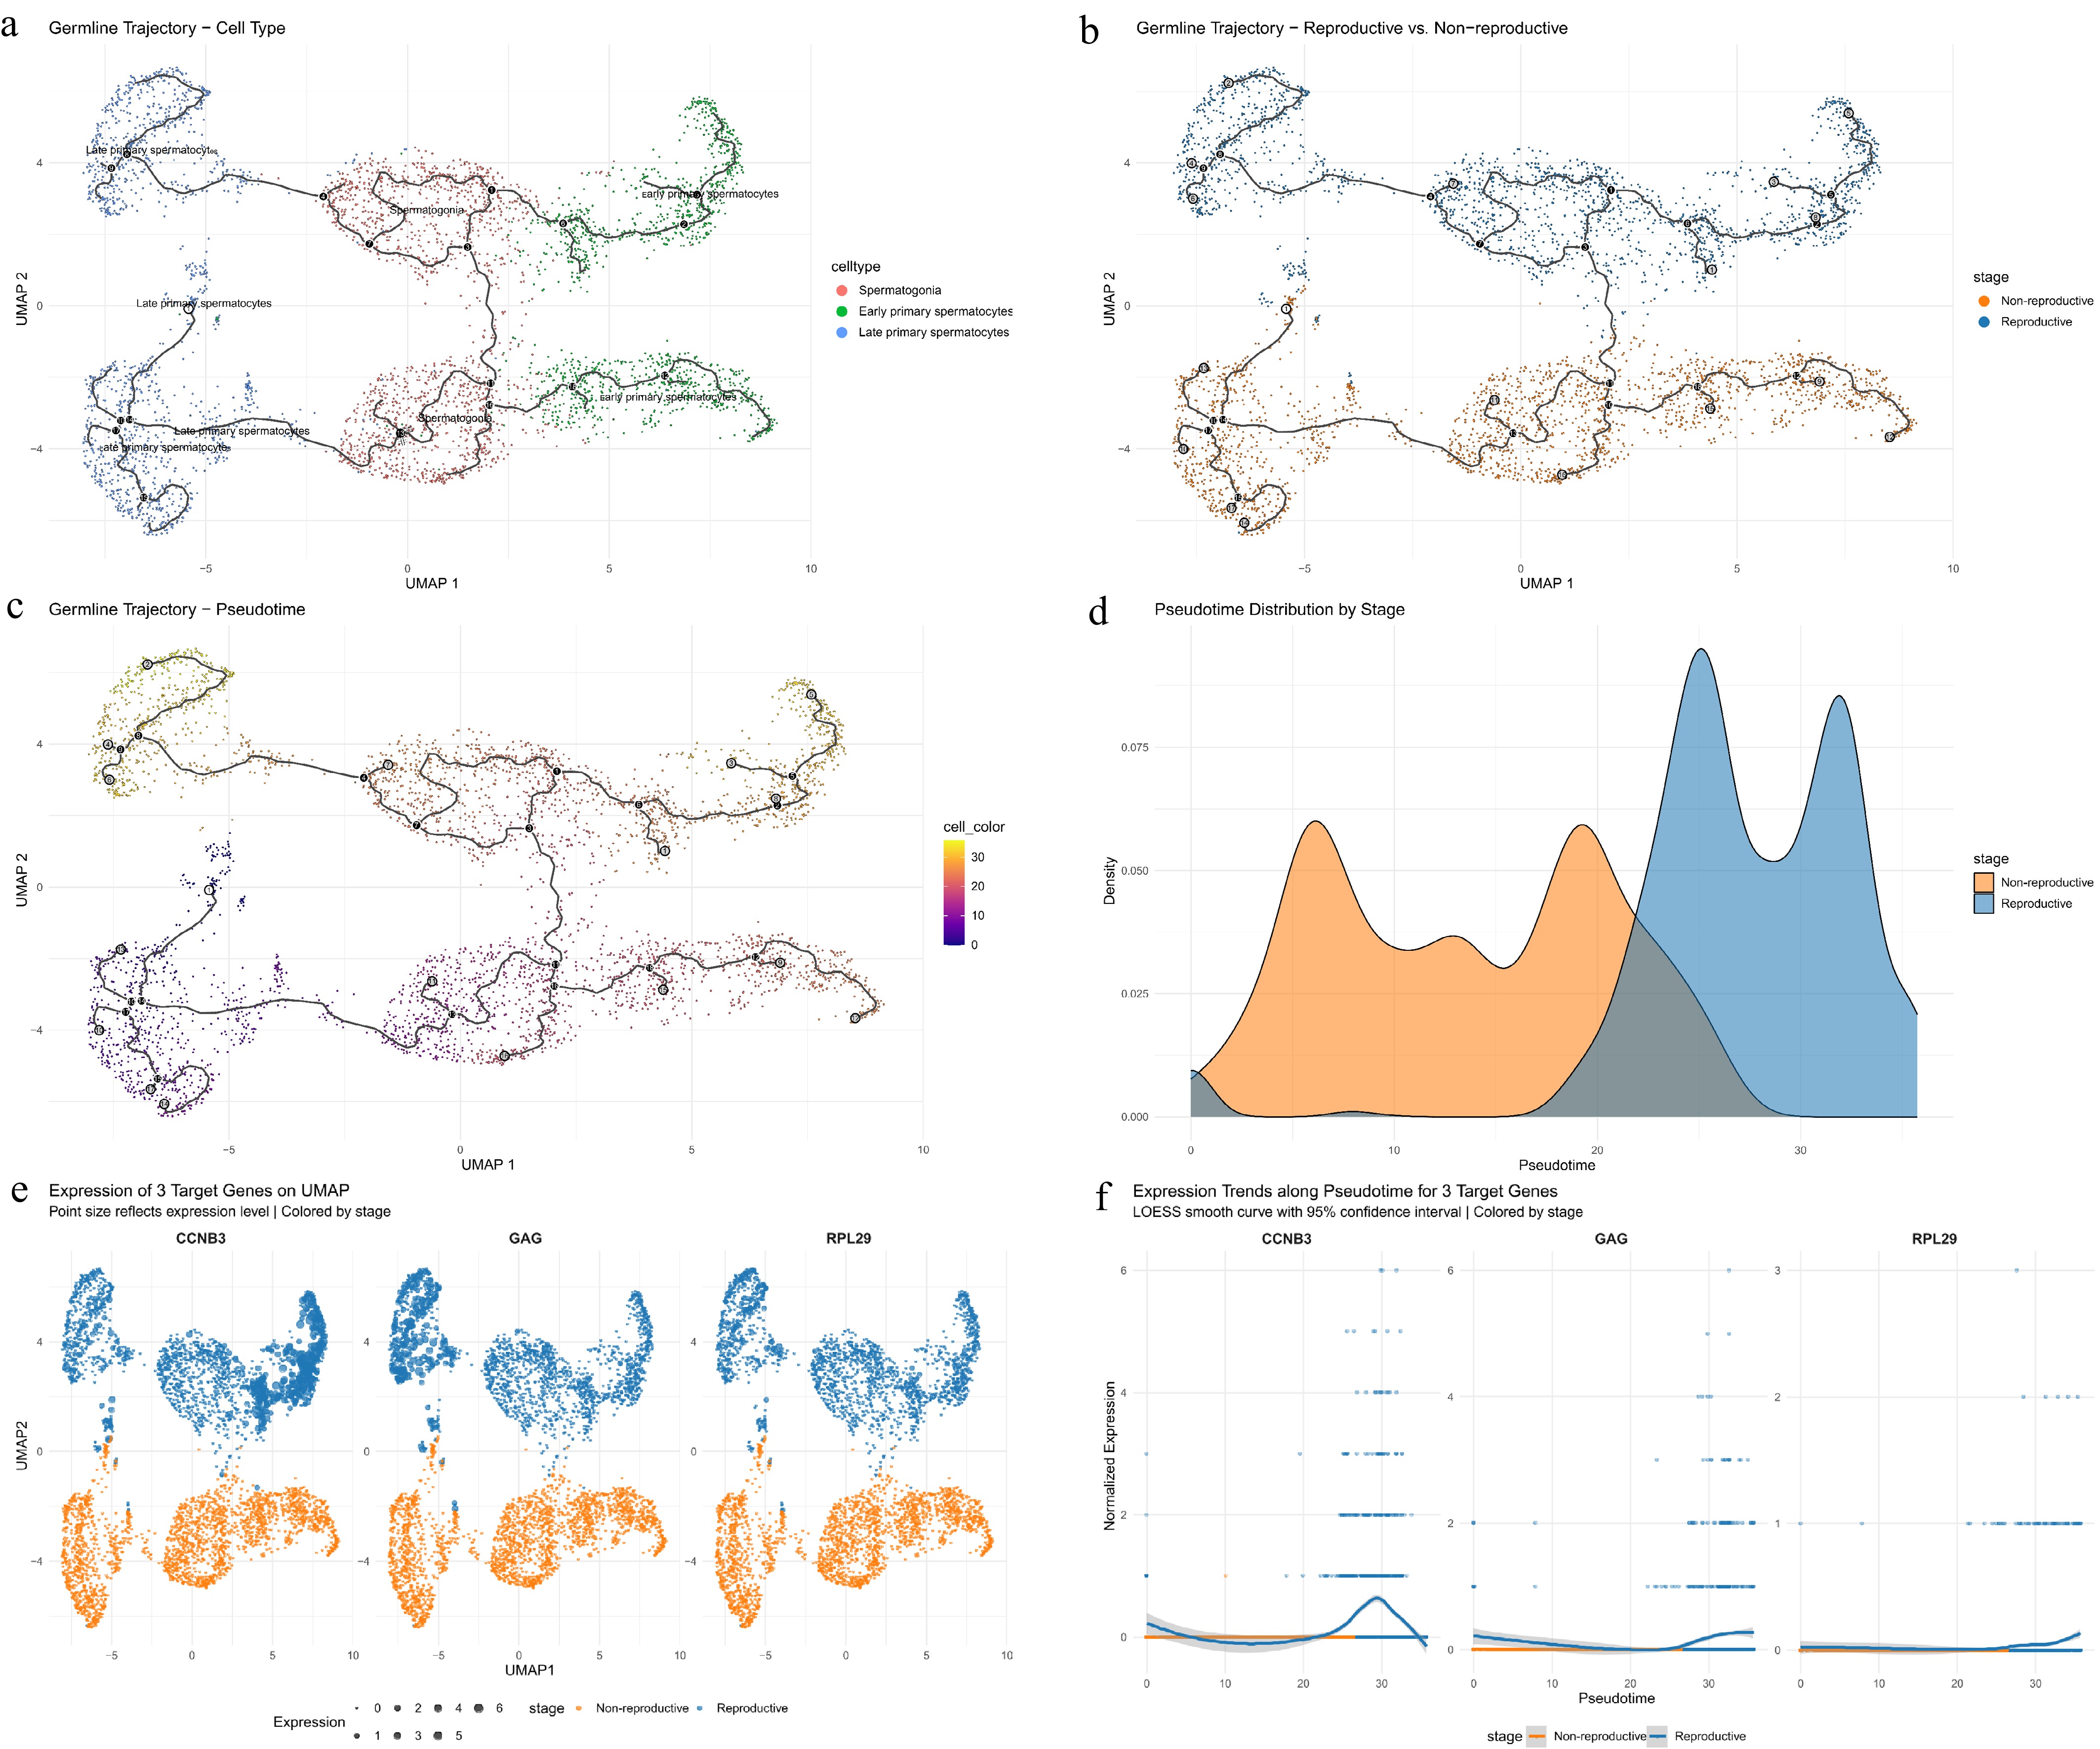
Figure 4.
Pseudotime trajectory analysis of spermatogonia and spermatocytes reveals developmental dynamics and gene expression between reproductive and non-reproductive stages. (a) Developmental trajectory of spermatogonia and spermatocytes colored by manually annotated cell types. (b) Trajectory colored by reproductive vs. non-reproductive stage (blue and orange, respectively). (c) Monocle3 pseudotime trajectory of spermatogonia and spermatocytes. (d) Pseudotime density distribution of spermatogonia and spermatocytes in reproductive and non-reproductive stages. (e) UMAP expression patterns of three representative trajectory-driving genes (CCNB3, GAG, RPL29) across cell types and stages. (f) Expression trends of CCNB3, GAG, and RPL29 along pseudotime, with LOESS smooth curves and 95% confidence intervals.
-
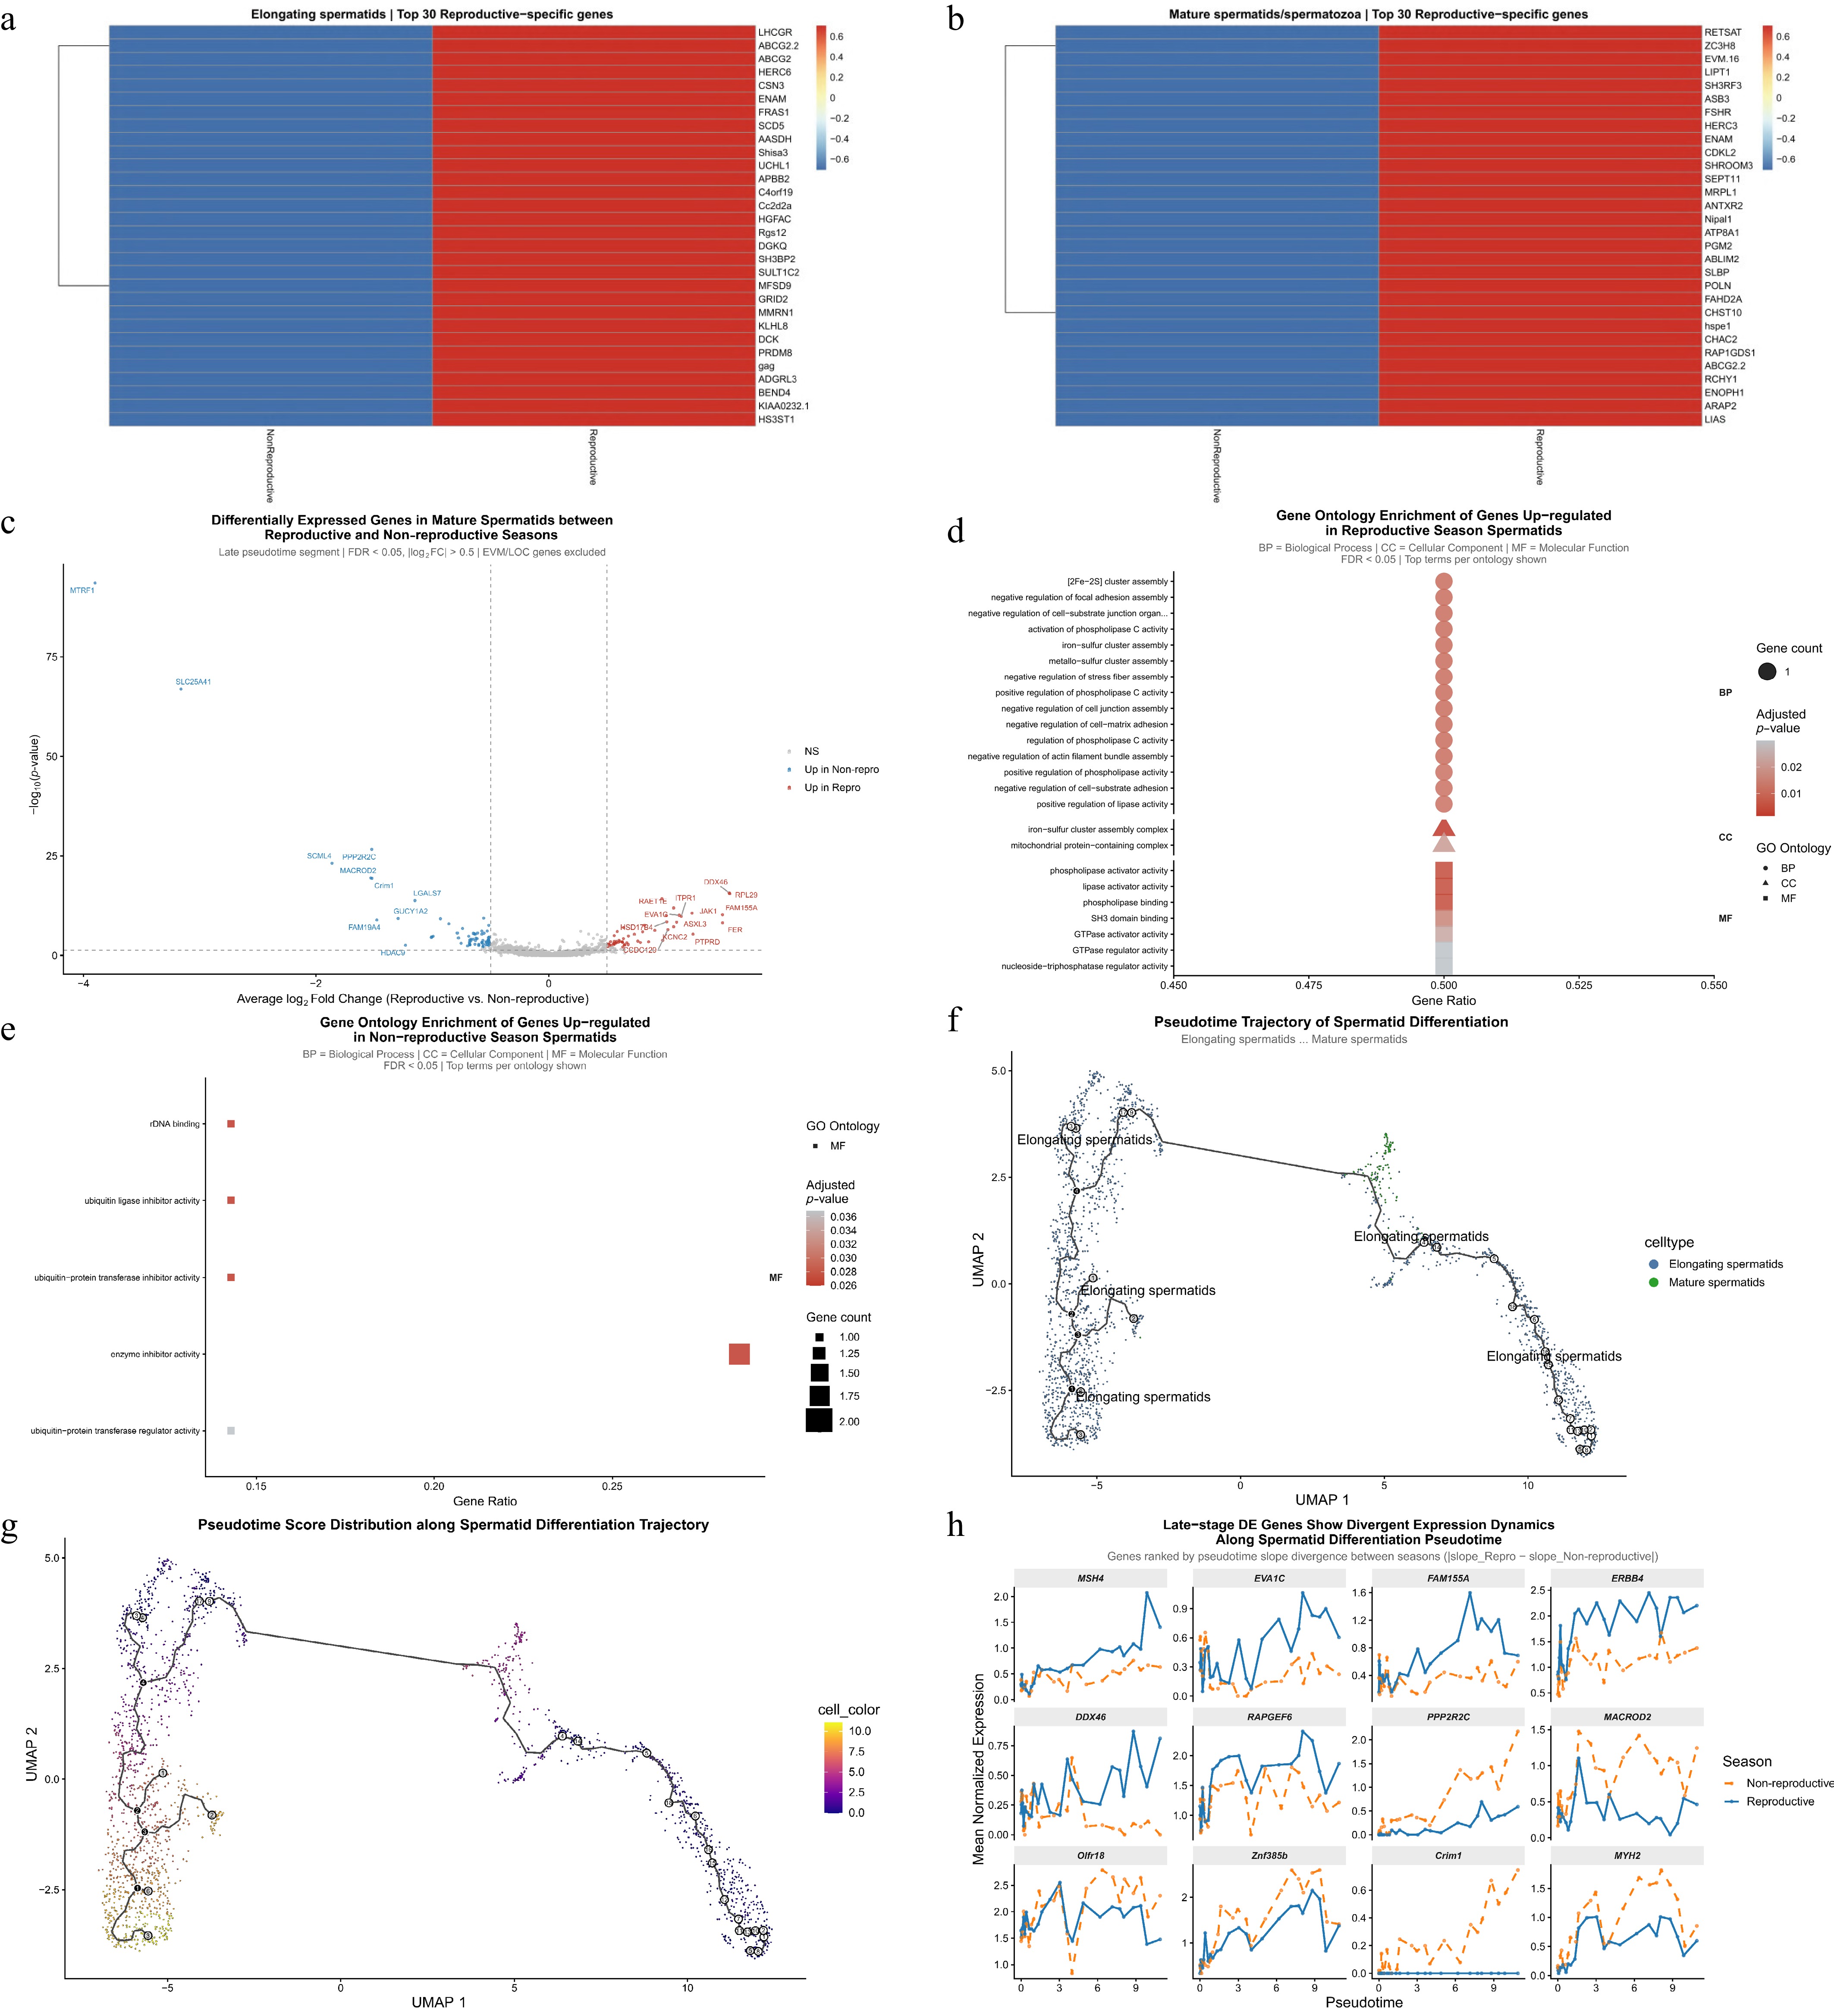
Figure 5.
Transcriptional dynamics, subpopulation proportions, pseudotime trajectory, and functional enrichment of elongating spermatids and mature spermatids/spermatozoa between reproductive and non-reproductive stages. (a) Heatmap of the top 30 reproductive-stage-specific genes in elongating spermatids (ranked by specificity score). (b) Heatmap of the top 30 reproductive-stage-specific genes in mature spermatids/spermatozoa (ranked by specificity score). (c) Volcano plot of differentially expressed genes in mature spermatids/spermatozoa between reproductive and non-reproductive stages. (d) Gene Ontology (GO) enrichment analysis of genes upregulated in reproductive mature spermatids/spermatozoa. (e) Gene Ontology (GO) enrichment analysis of genes upregulated in non-reproductive mature spermatids/spermatozoa. (f) Monocle3 pseudotime trajectory of spermatid differentiation colored by cell type. (g) Pseudotime trajectory of spermatid differentiation colored by pseudotime score. (h) Expression dynamics of season-specific genes along the spermatid differentiation pseudotime trajectory.
-
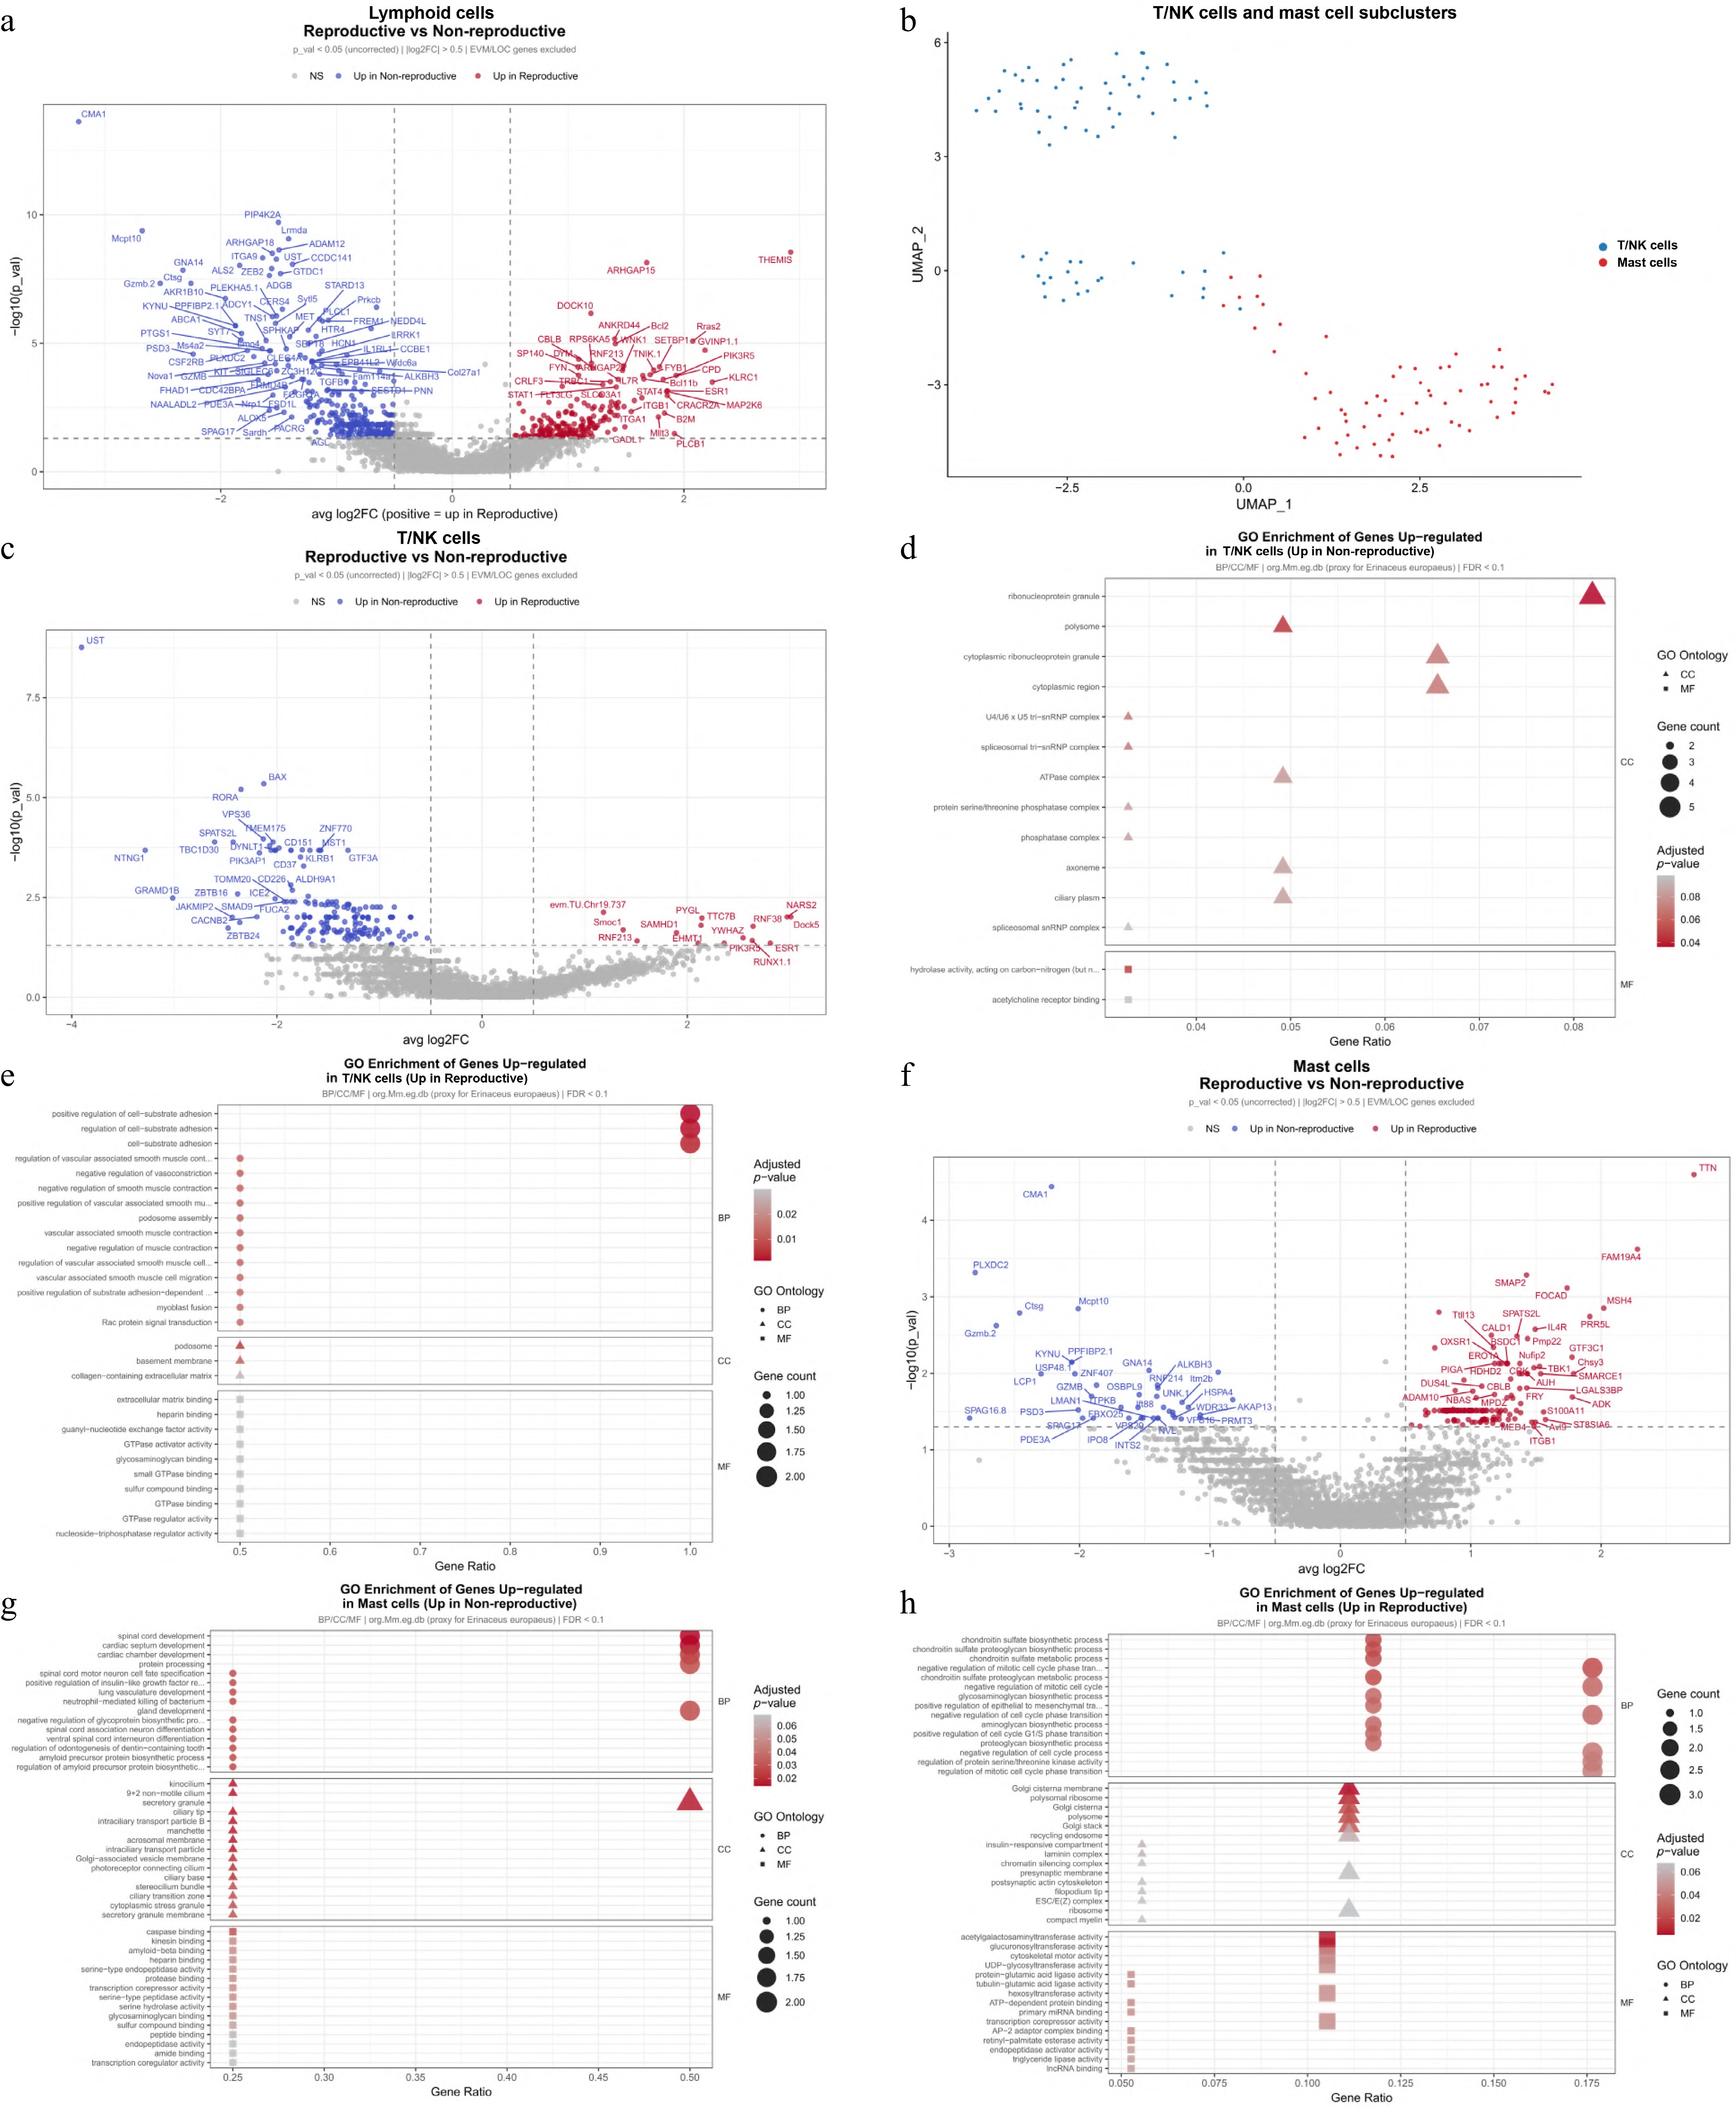
Figure 6.
Dynamic remodeling of T/NK and mast cells in the testicular immune microenvironment between reproductive and non-reproductive stages. (a) Volcano plot showing differentially expressed genes in lymphoid population between reproductive and non-reproductive stages. (b) UMAP visualization of annotated subclusters of T/NK and mast cells. (c) Volcano plot of differentially expressed genes in T/NK cells between reproductive and non-reproductive stages. (d) Gene Ontology (GO) enrichment analysis of genes upregulated in T/NK cells in the non-reproductive stage. (e) Gene Ontology (GO) enrichment analysis of genes upregulated in T/NK cells in the reproductive stage. (f) Volcano plot of differentially expressed genes in mast cells between reproductive and non-reproductive stages. (g) Gene Ontology (GO) enrichment analysis of genes upregulated in mast cells in the non-reproductive stage. (h) Gene Ontology (GO) enrichment analysis of genes upregulated in mast cells in the reproductive stage.
-
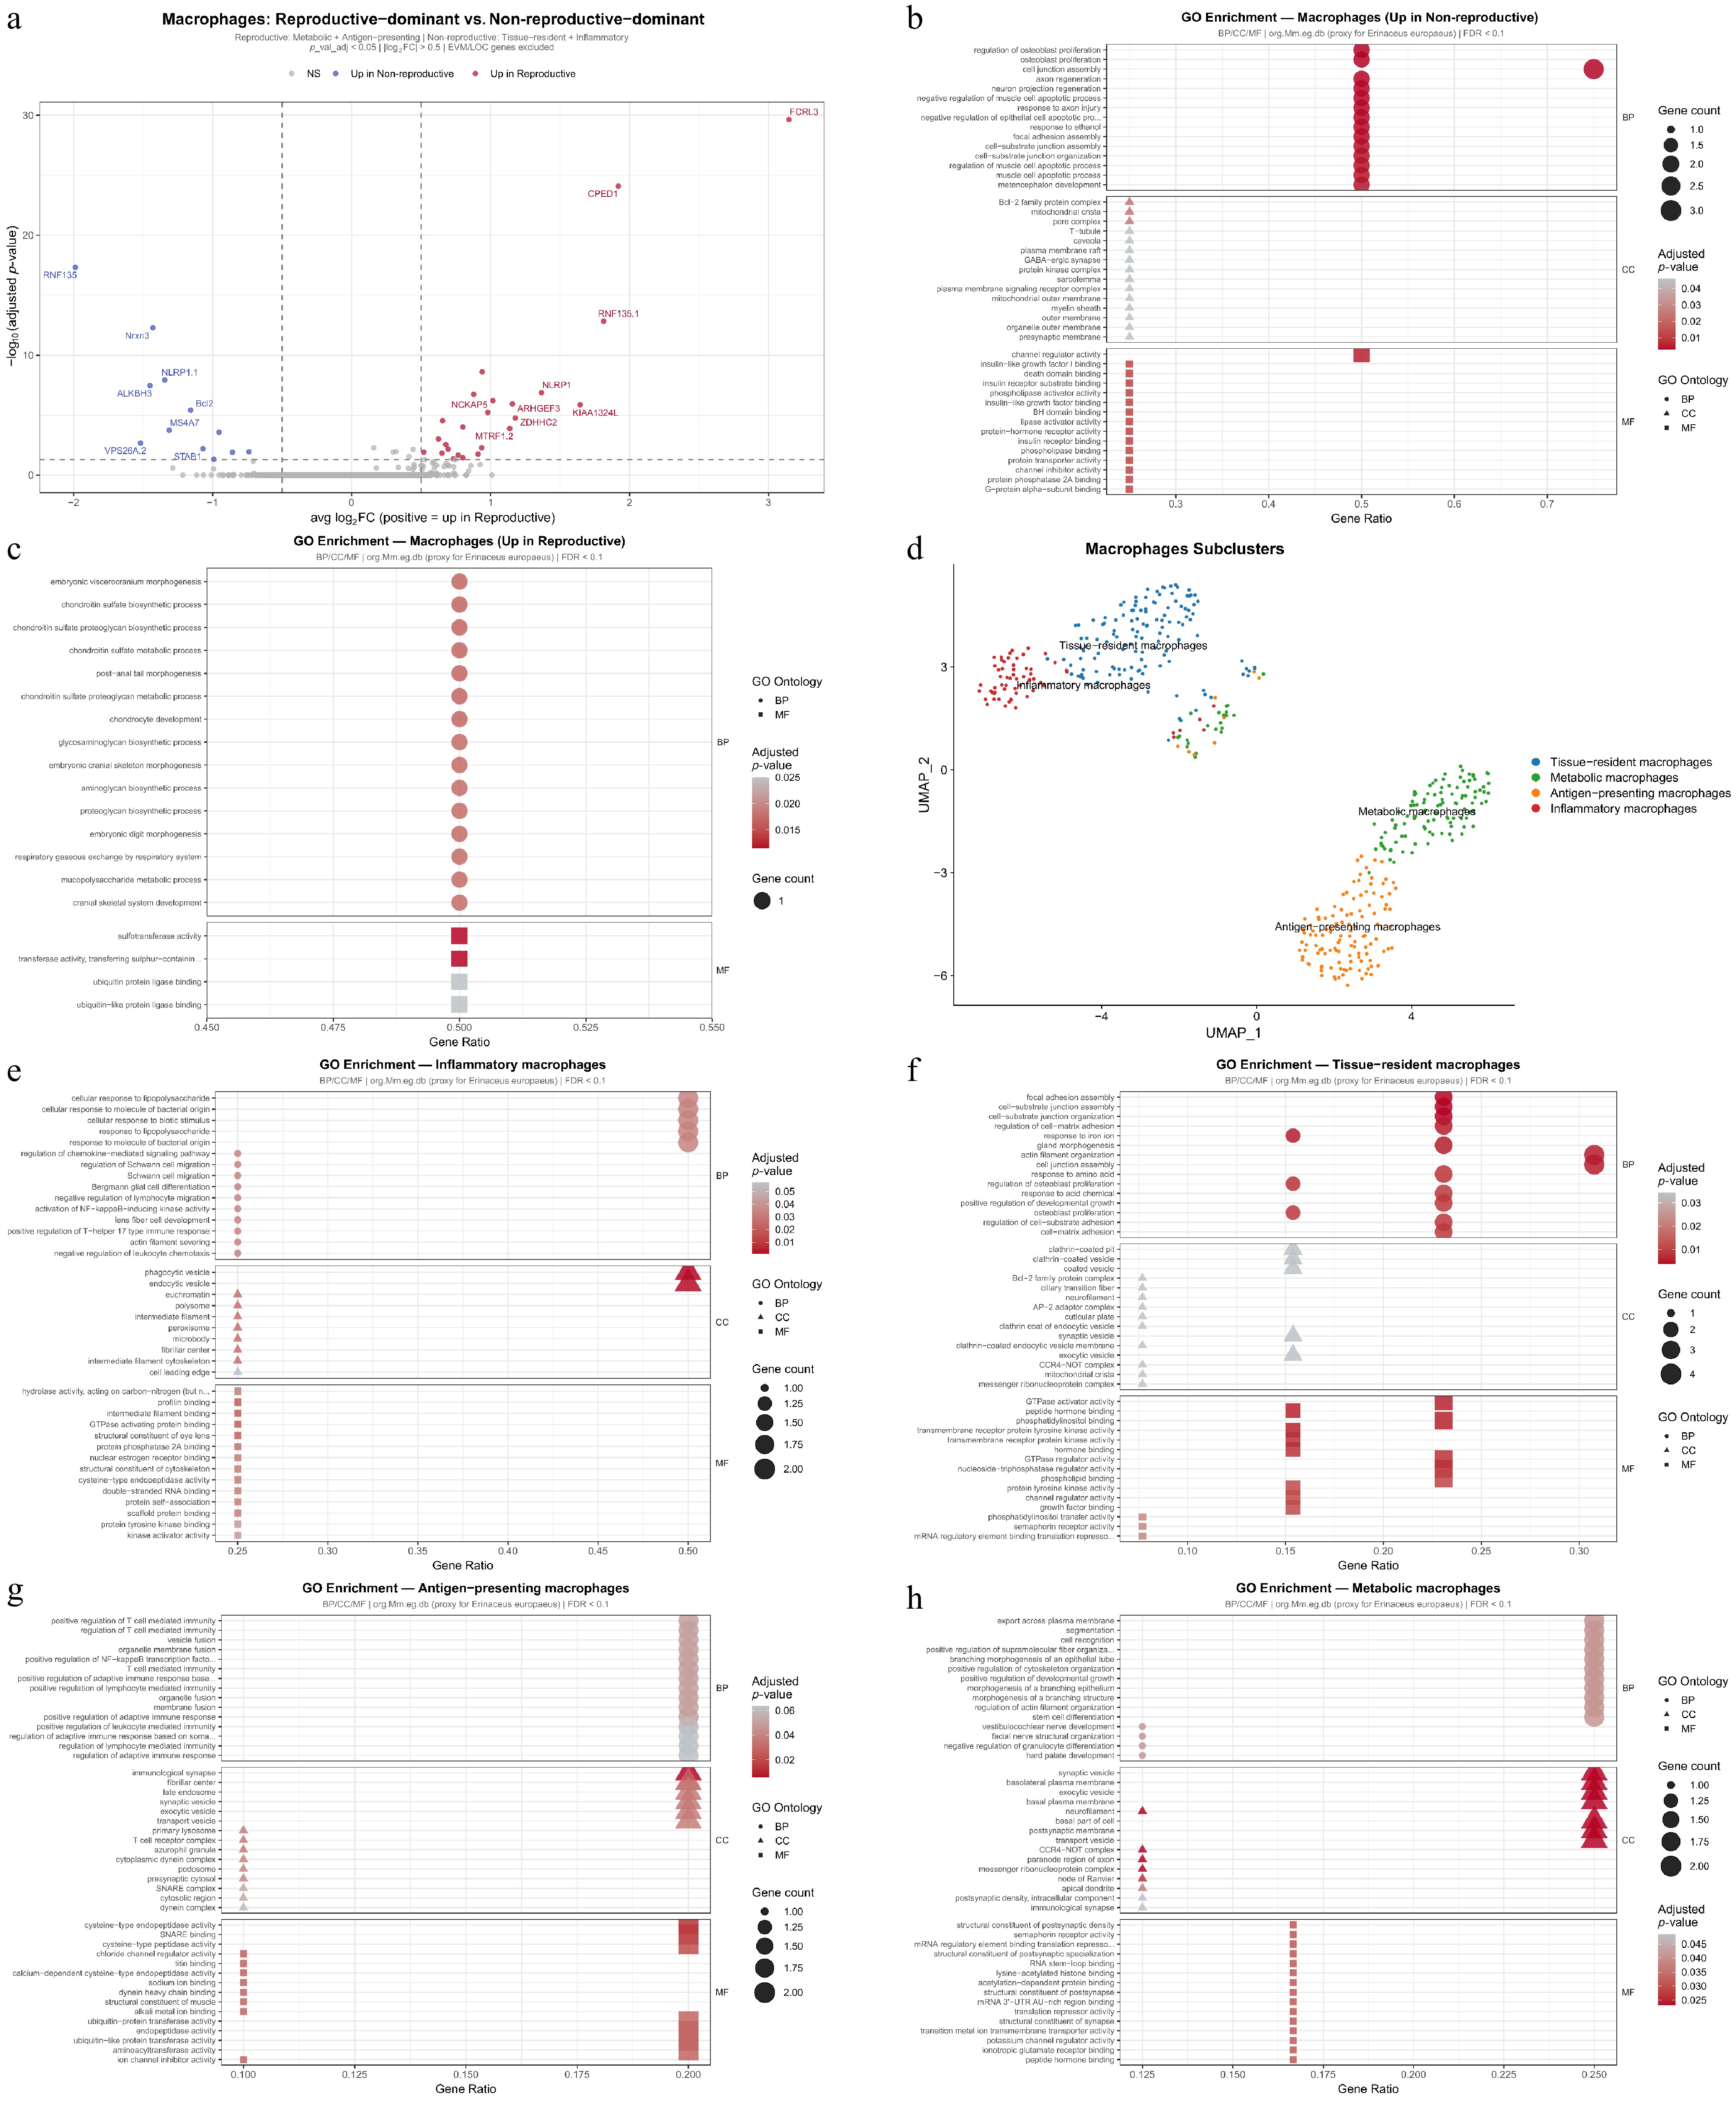
Figure 7.
Dynamic remodeling of macrophages in the testicular immune microenvironment between reproductive and non-reproductive stages. (a) Volcano plot of differentially expressed genes in macrophages between reproductive and non-reproductive stages. (b) Gene Ontology (GO) enrichment analysis of genes upregulated in macrophages in the non-reproductive stage. (c) Gene Ontology (GO) enrichment analysis of genes upregulated in macrophages in the reproductive stage. (d) UMAP visualization of annotated macrophage subclusters. (e) Gene Ontology (GO) enrichment analysis of genes upregulated in inflammatory macrophages. (f) Gene Ontology (GO) enrichment analysis of genes upregulated in tissue-resident macrophages. (g) Gene Ontology (GO) enrichment analysis of genes upregulated in antigen-presenting macrophages. (h) Gene Ontology (GO) enrichment analysis of genes upregulated in metabolic macrophages.
Figures
(7)
Tables
(0)