-
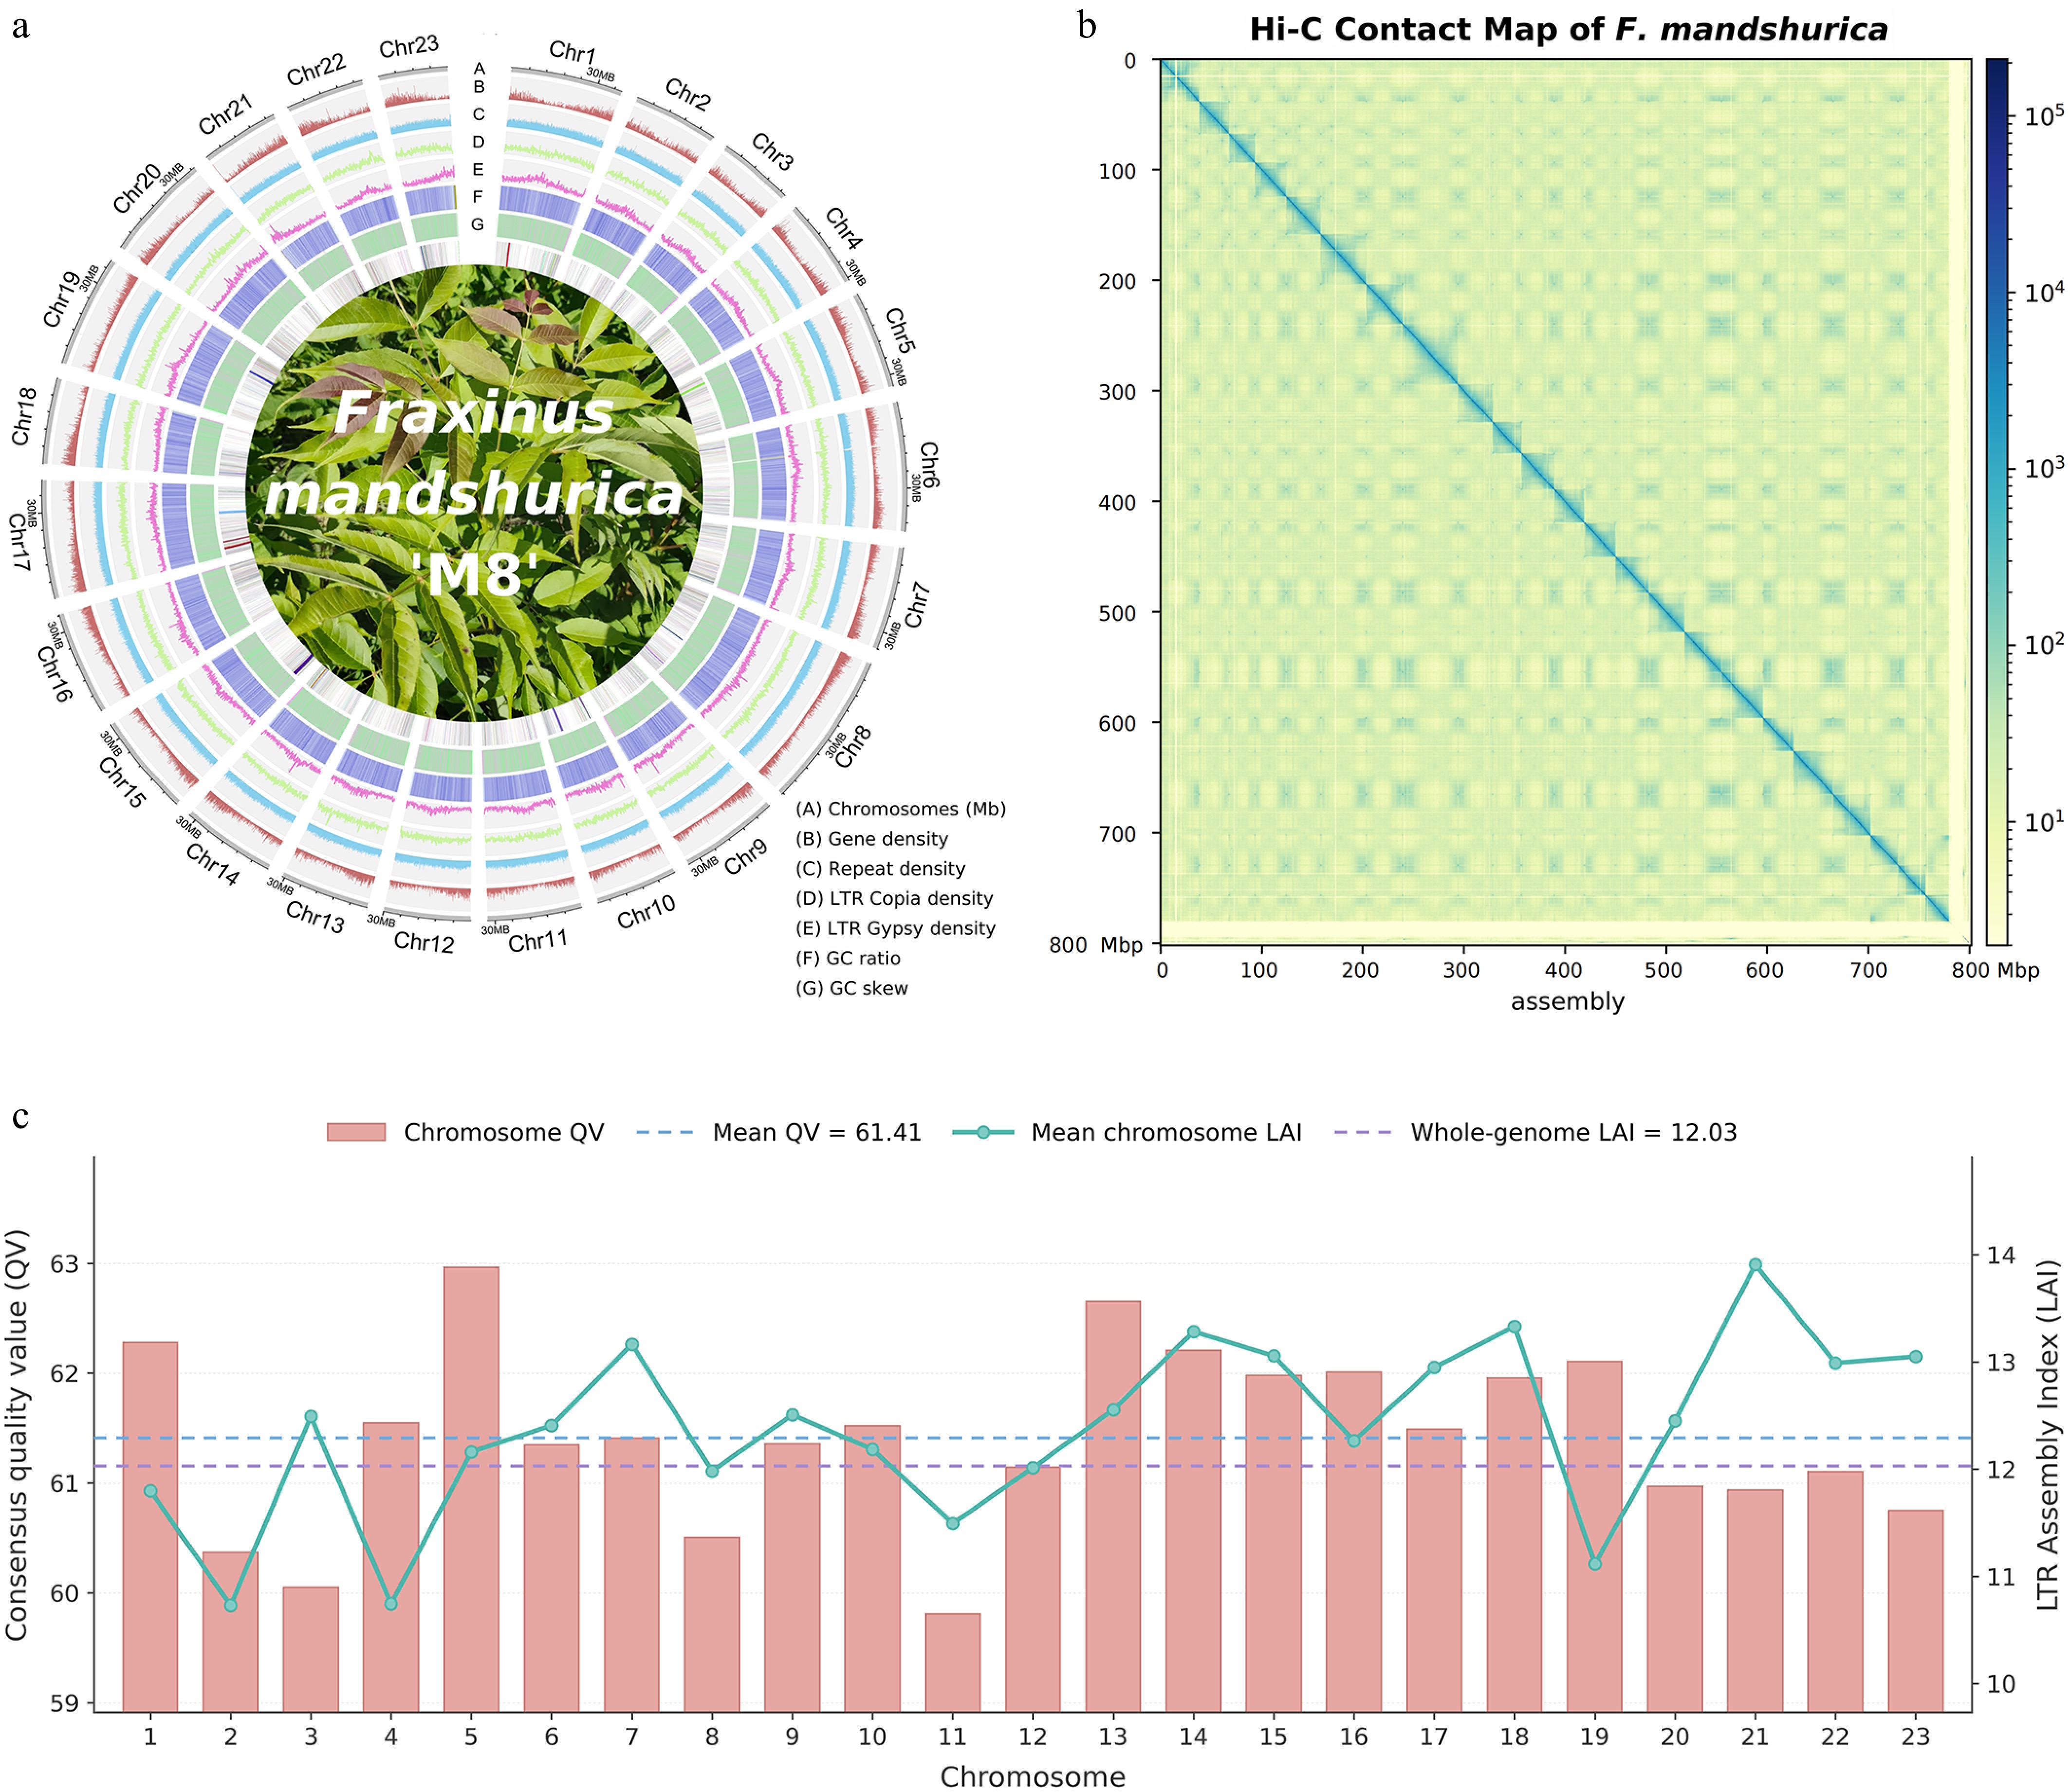
Figure 1.
Assembly and landscape of the F. mandshurica genome. (a) Circos representation of genomic features across the 23 pseudochromosomes. Tracks are arranged from the periphery inward: (A) Karyotype of the assembled chromosomes (Mb). (B) Gene density. (C) Density of total transposable elements (TEs). (D) Distribution of Copia-like LTR retrotransposons. (E) Distribution of Gypsy-like LTR retrotransposons. (F) GC content. (G) GC skew. All features were calculated in non-overlapping windows of 500 kb. The innermost lines depict intragenomic syntenic blocks. (b) Genome-wide Hi-C interaction map. The heatmap displays the interaction intensity of chromatin contacts, with the clear diagonal squares resolving the 23 pseudochromosomes, indicating a high-quality chromosome-scale assembly. (c) Chromosome-level assembly quality assessment showing Merqury consensus QV values and chromosome-averaged LTR Assembly Index (LAI). Dashed lines indicate the mean chromosome-level QV and the whole-genome LAI, respectively.
-
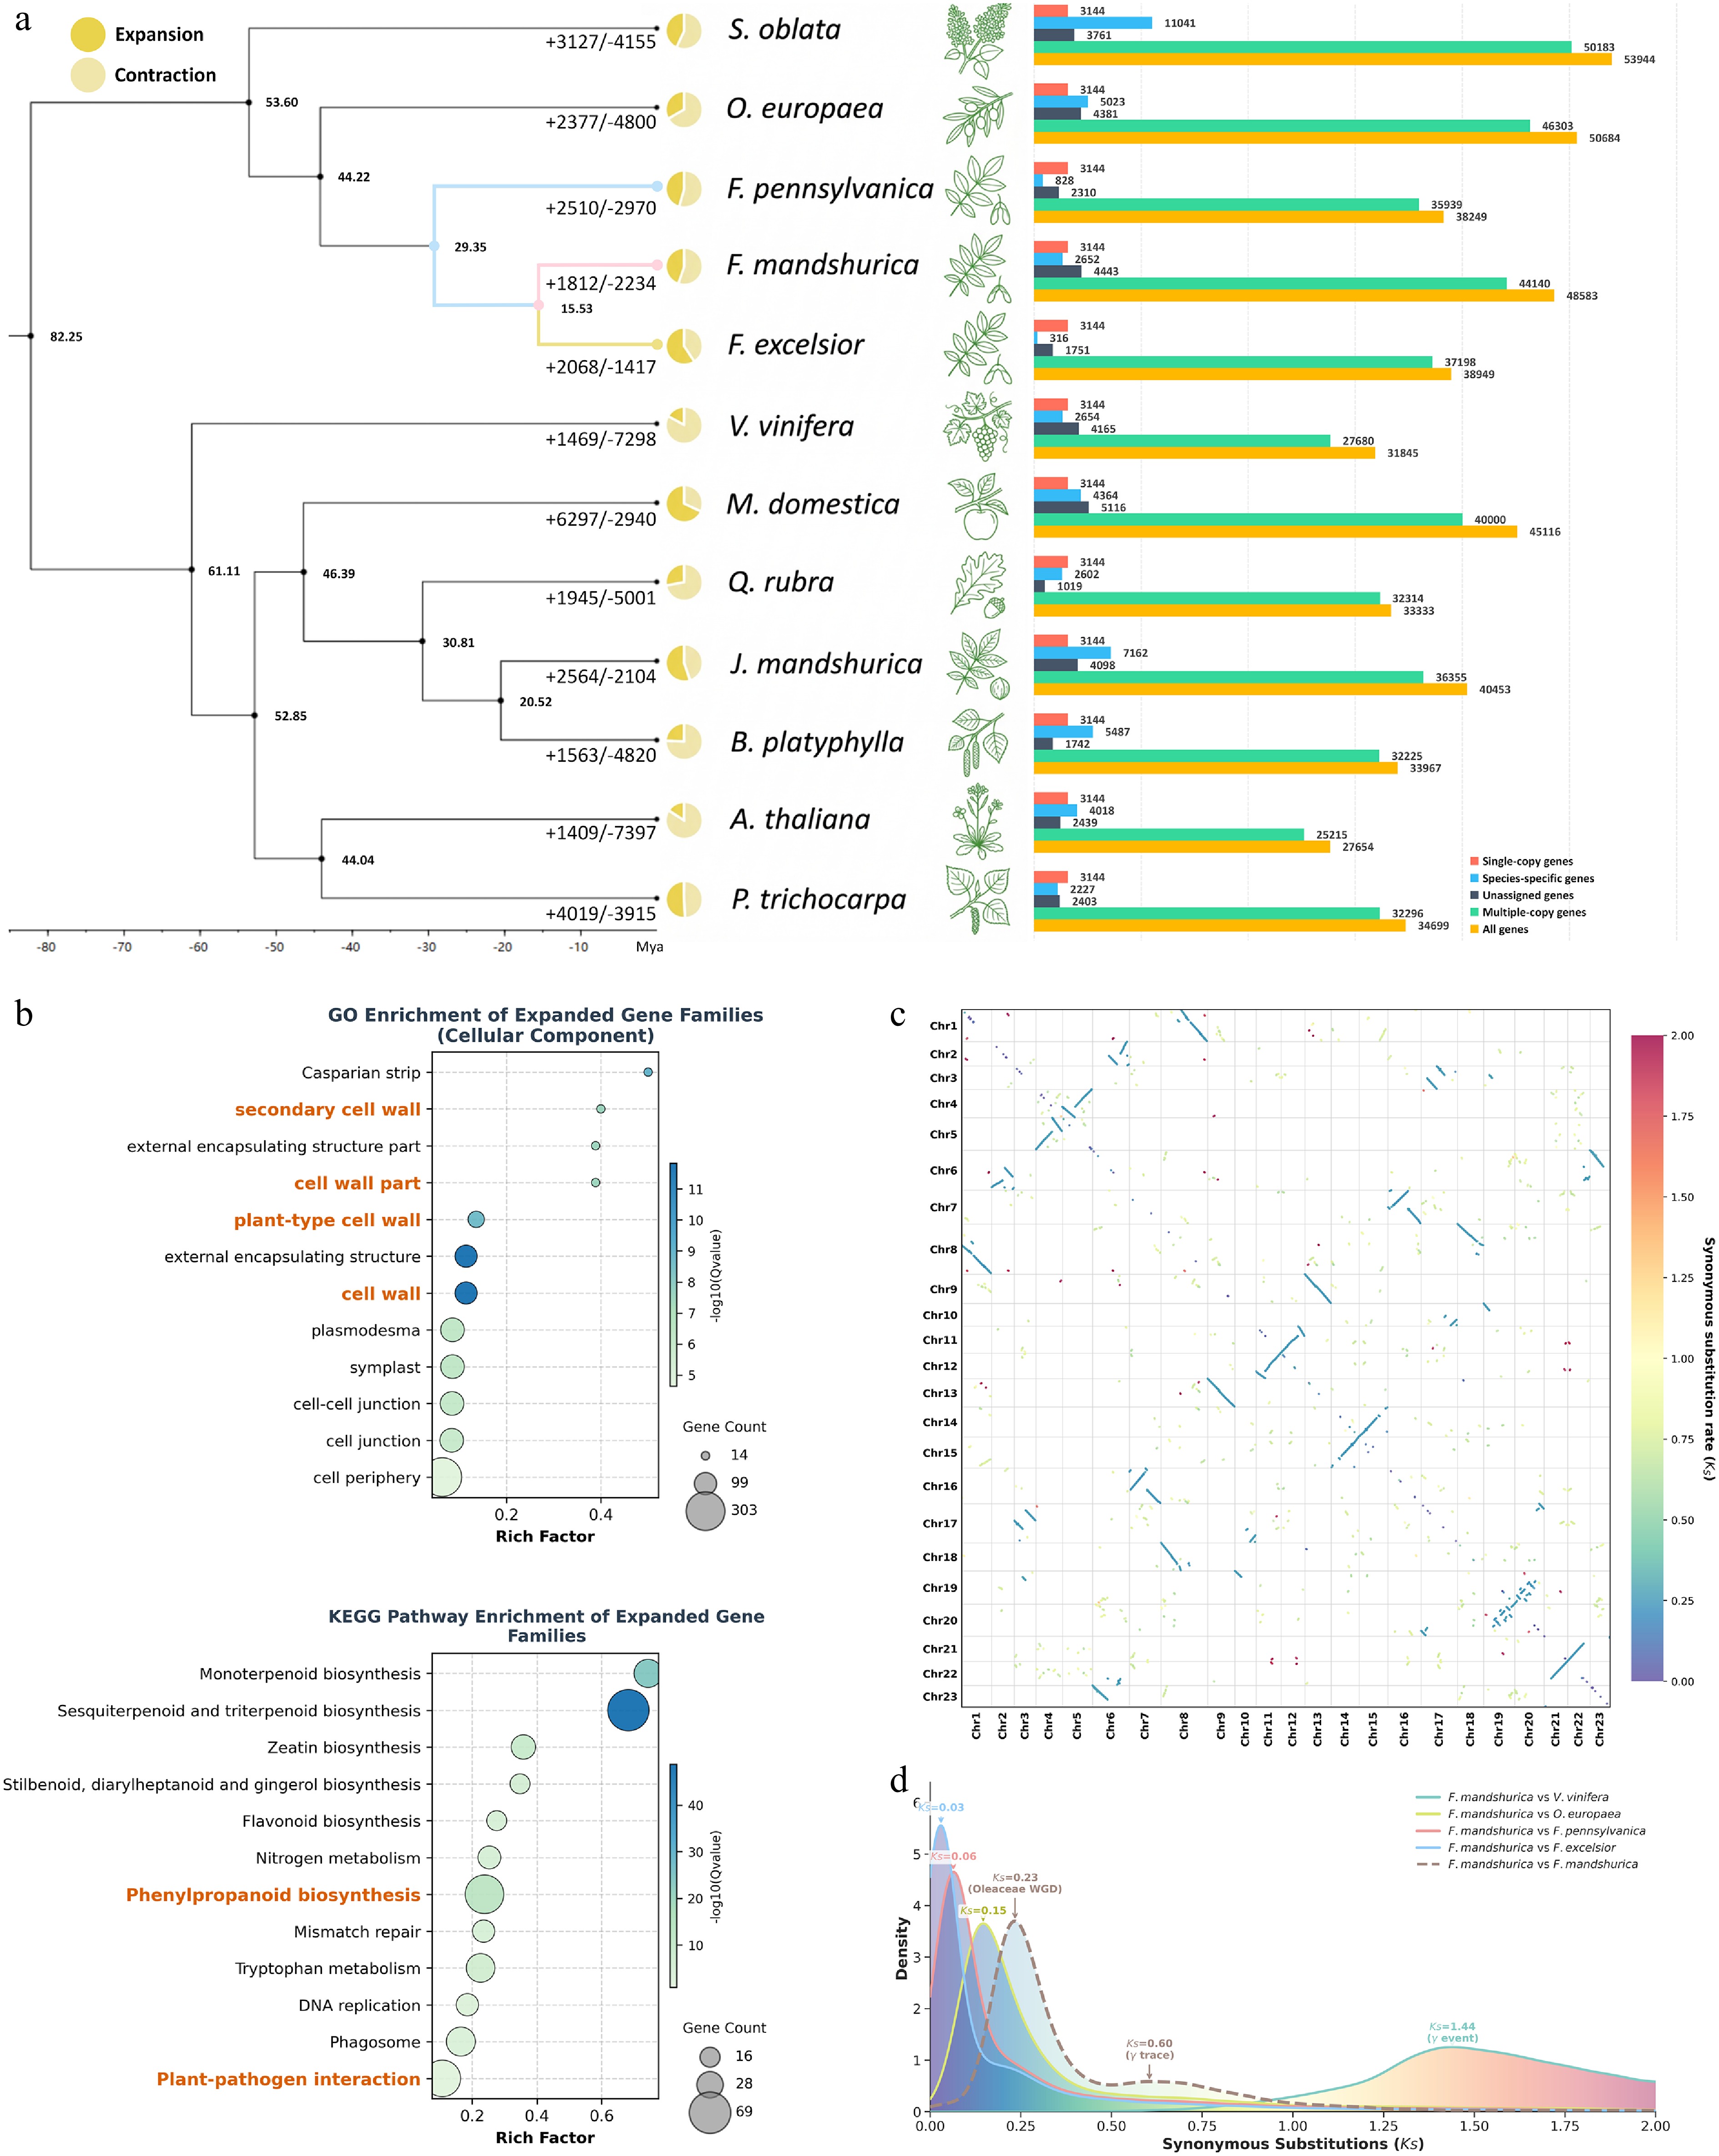
Figure 2.
Phylogeny, gene family evolution, and ancient WGD in Fraxinus mandshurica. (a) Time-calibrated phylogeny of F. mandshurica and 11 other angiosperms based on 151 single-copy orthologs. Node labels indicate estimated divergence times (Mya), and numbers beside terminal branches indicate expanded (+) and contracted (−) gene families. Bar plots show the proportions of single-copy, multi-copy, and species-specific genes. (b) GO and KEGG enrichment of expanded gene families in F. mandshurica, highlighting terms and pathways related to cell wall biogenesis and plant defense. Bubble size represents gene count, and color indicates significance (−log10 Q-value). (c) Intra-genomic synteny dot-plot of the 23 chromosomes. The color gradient reflects the median Ks of collinear blocks, ranging from blue/cyan (younger duplications, low Ks) to orange/red (ancient duplications, high Ks). (d) Ks distributions of syntenic gene pairs. The dashed line represents F. mandshurica paralogs (self-alignment), while solid lines represent orthologs between F. mandshurica and other species. Key peaks are marked: the Oleaceae-wide WGD (O-α, Ks ≈ 0.23), the divergence from O. europaea (Ks ≈ 0.15), and the ancestral eudicot γ triplication traces (Ks ≈ 0.60 in self-alignment; Ks ≈ 1.44 vs V. vinifera).
-
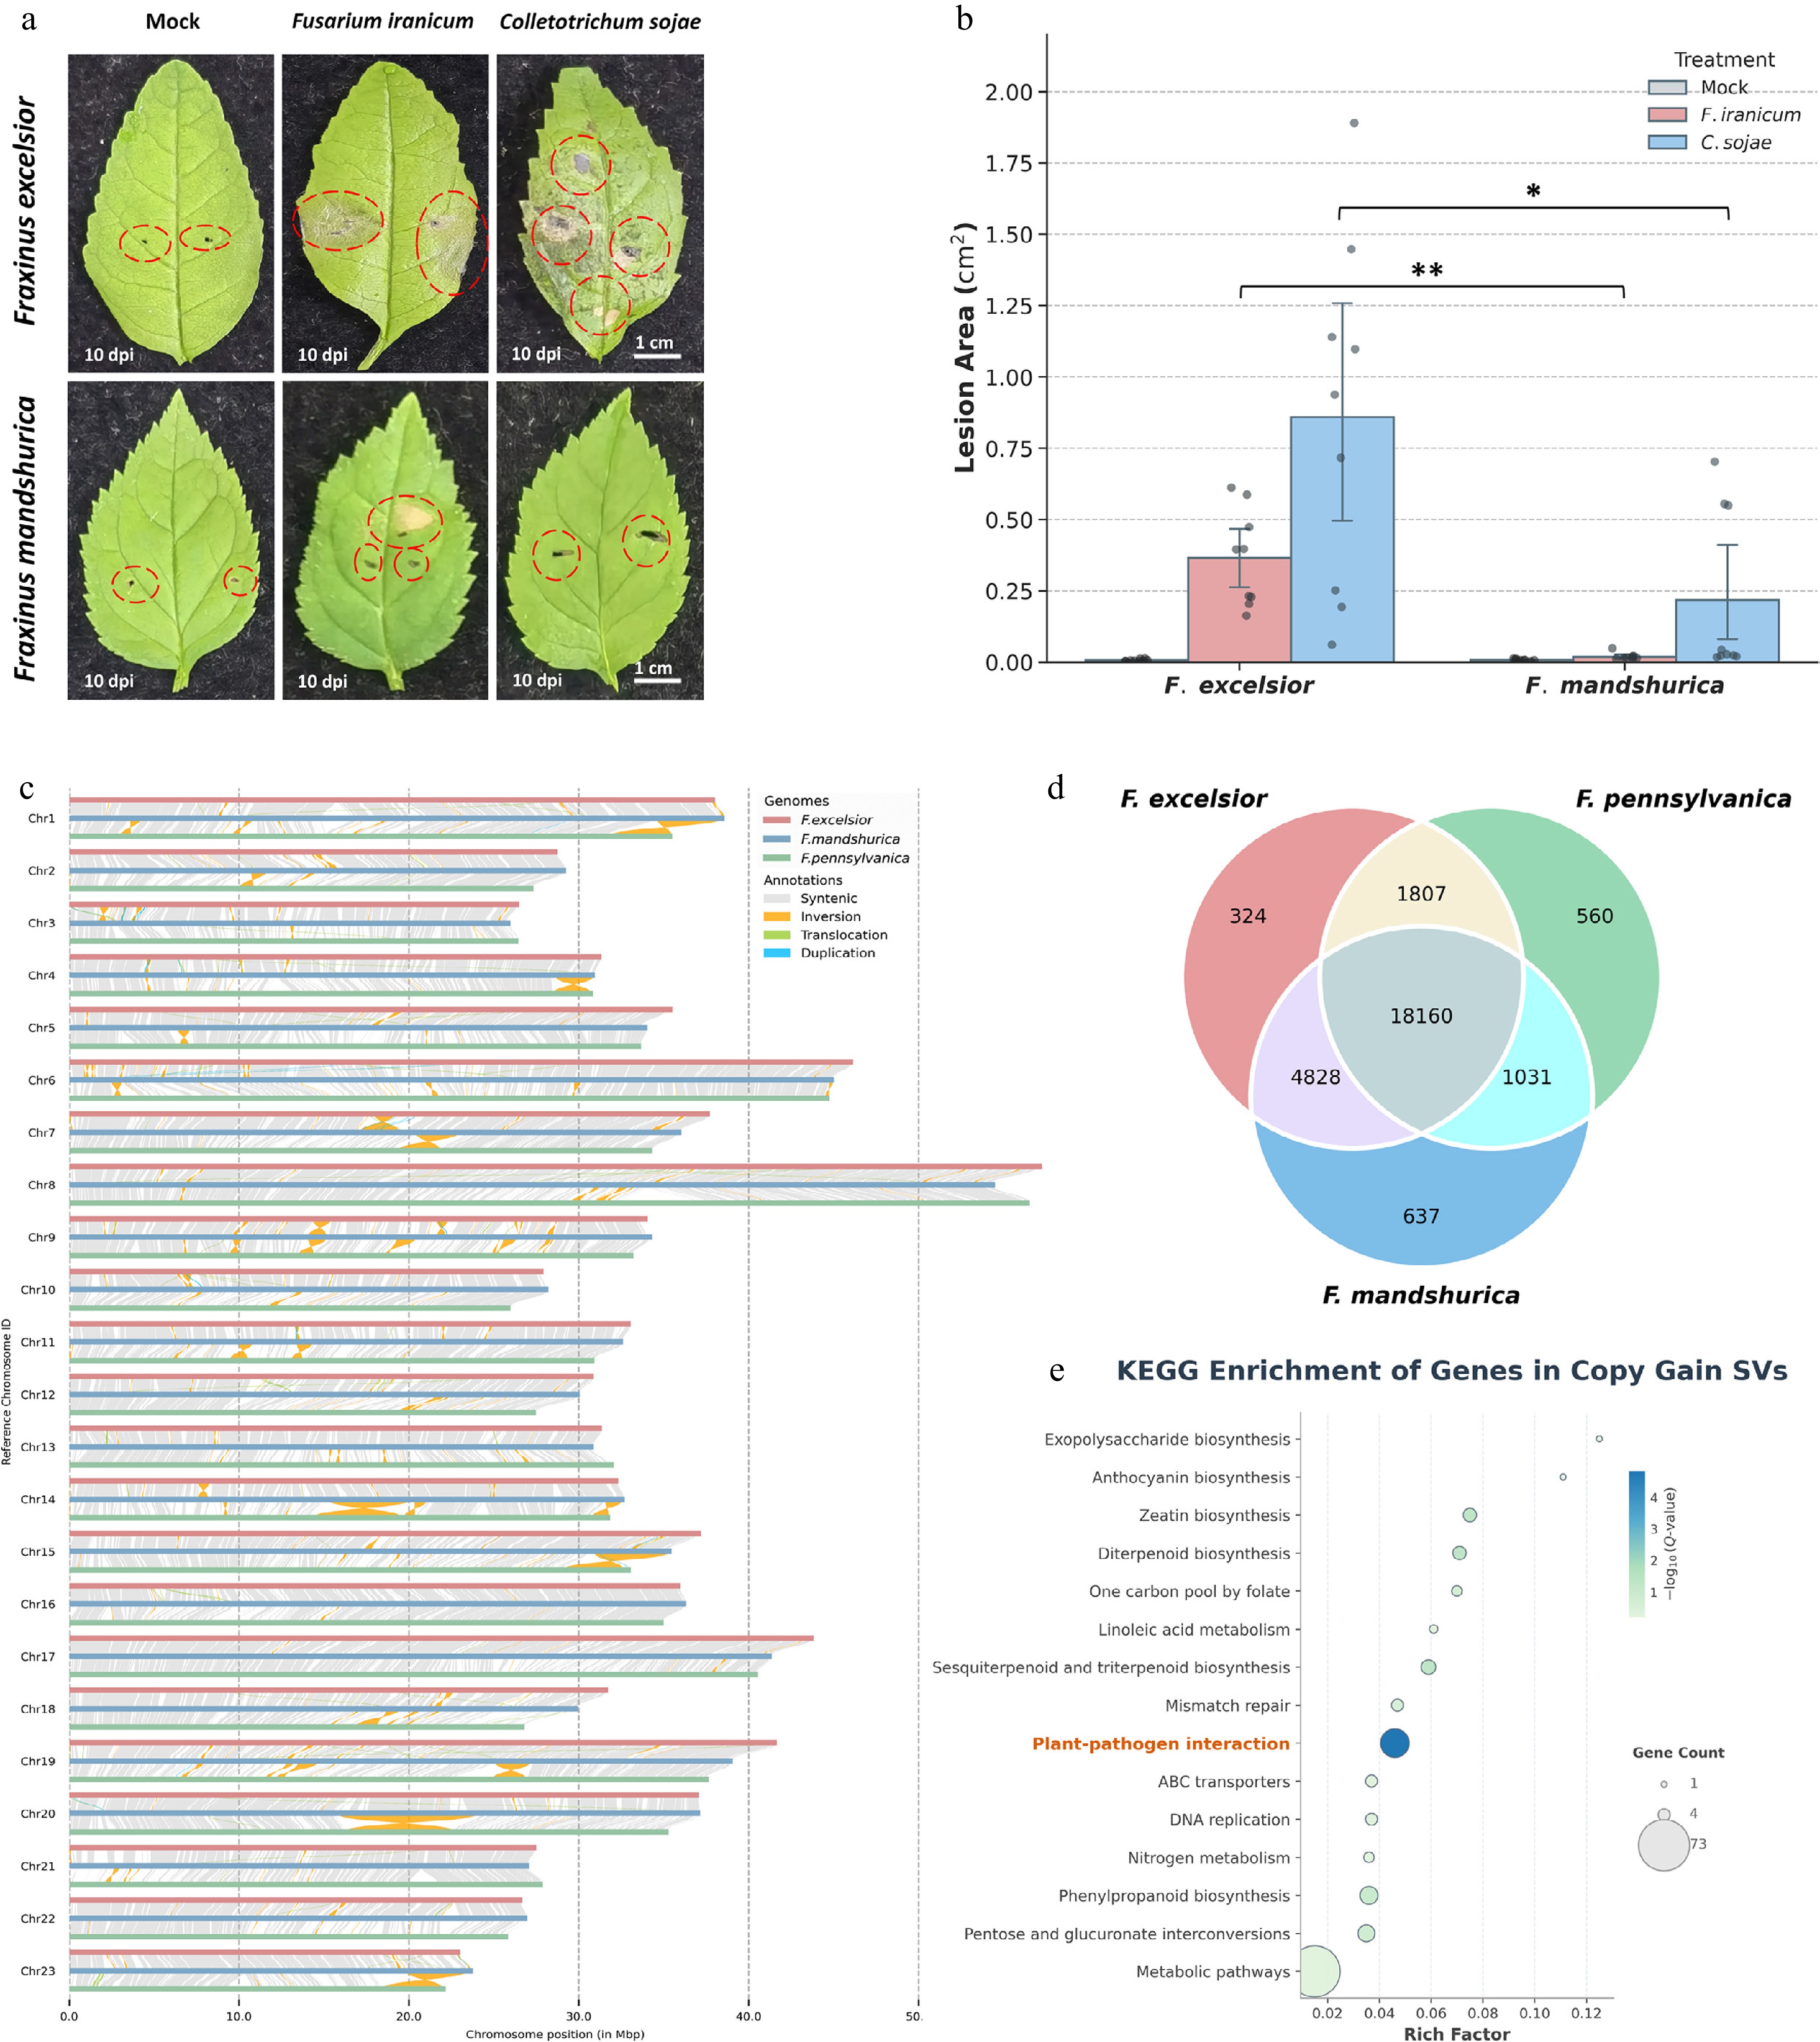
Figure 3.
Comparative genomics and defense-related structural variations in F. mandshurica. (a) Broad-spectrum disease resistance phenotypes. Leaves of F. excelsior (susceptible) and F. mandshurica (resistant) were inoculated with Fusarium iranicum and Colletotrichum sojae. (b) Quantitative analysis showed significantly smaller lesion areas in F. mandshurica than in F. excelsior. Data represent mean ± SD (n = 9); asterisks indicate significant differences (Student's t-test, * p < 0.05, ** p < 0.01). (c) Chromosome-level structural variation survey comparing F. mandshurica (center, blue bars) with F. excelsior (top, red bars) and F. pennsylvanica (bottom, green bars). Symbols indicate inversions, translocations, and duplications detected along homologous chromosomes. (d) Venn diagram showing the overlap of orthologous gene families among the three Fraxinus species. The core genome (center) and lineage-specific clusters are indicated. (e) KEGG pathway enrichment of genes located in Copy Gain structural variation (SV) regions in F. mandshurica. The 'plant–pathogen interaction' pathway is significantly enriched, suggesting a genomic basis for enhanced immunity. Bubble size indicates gene count, and color intensity represents significance (−log10 Q-value).
-
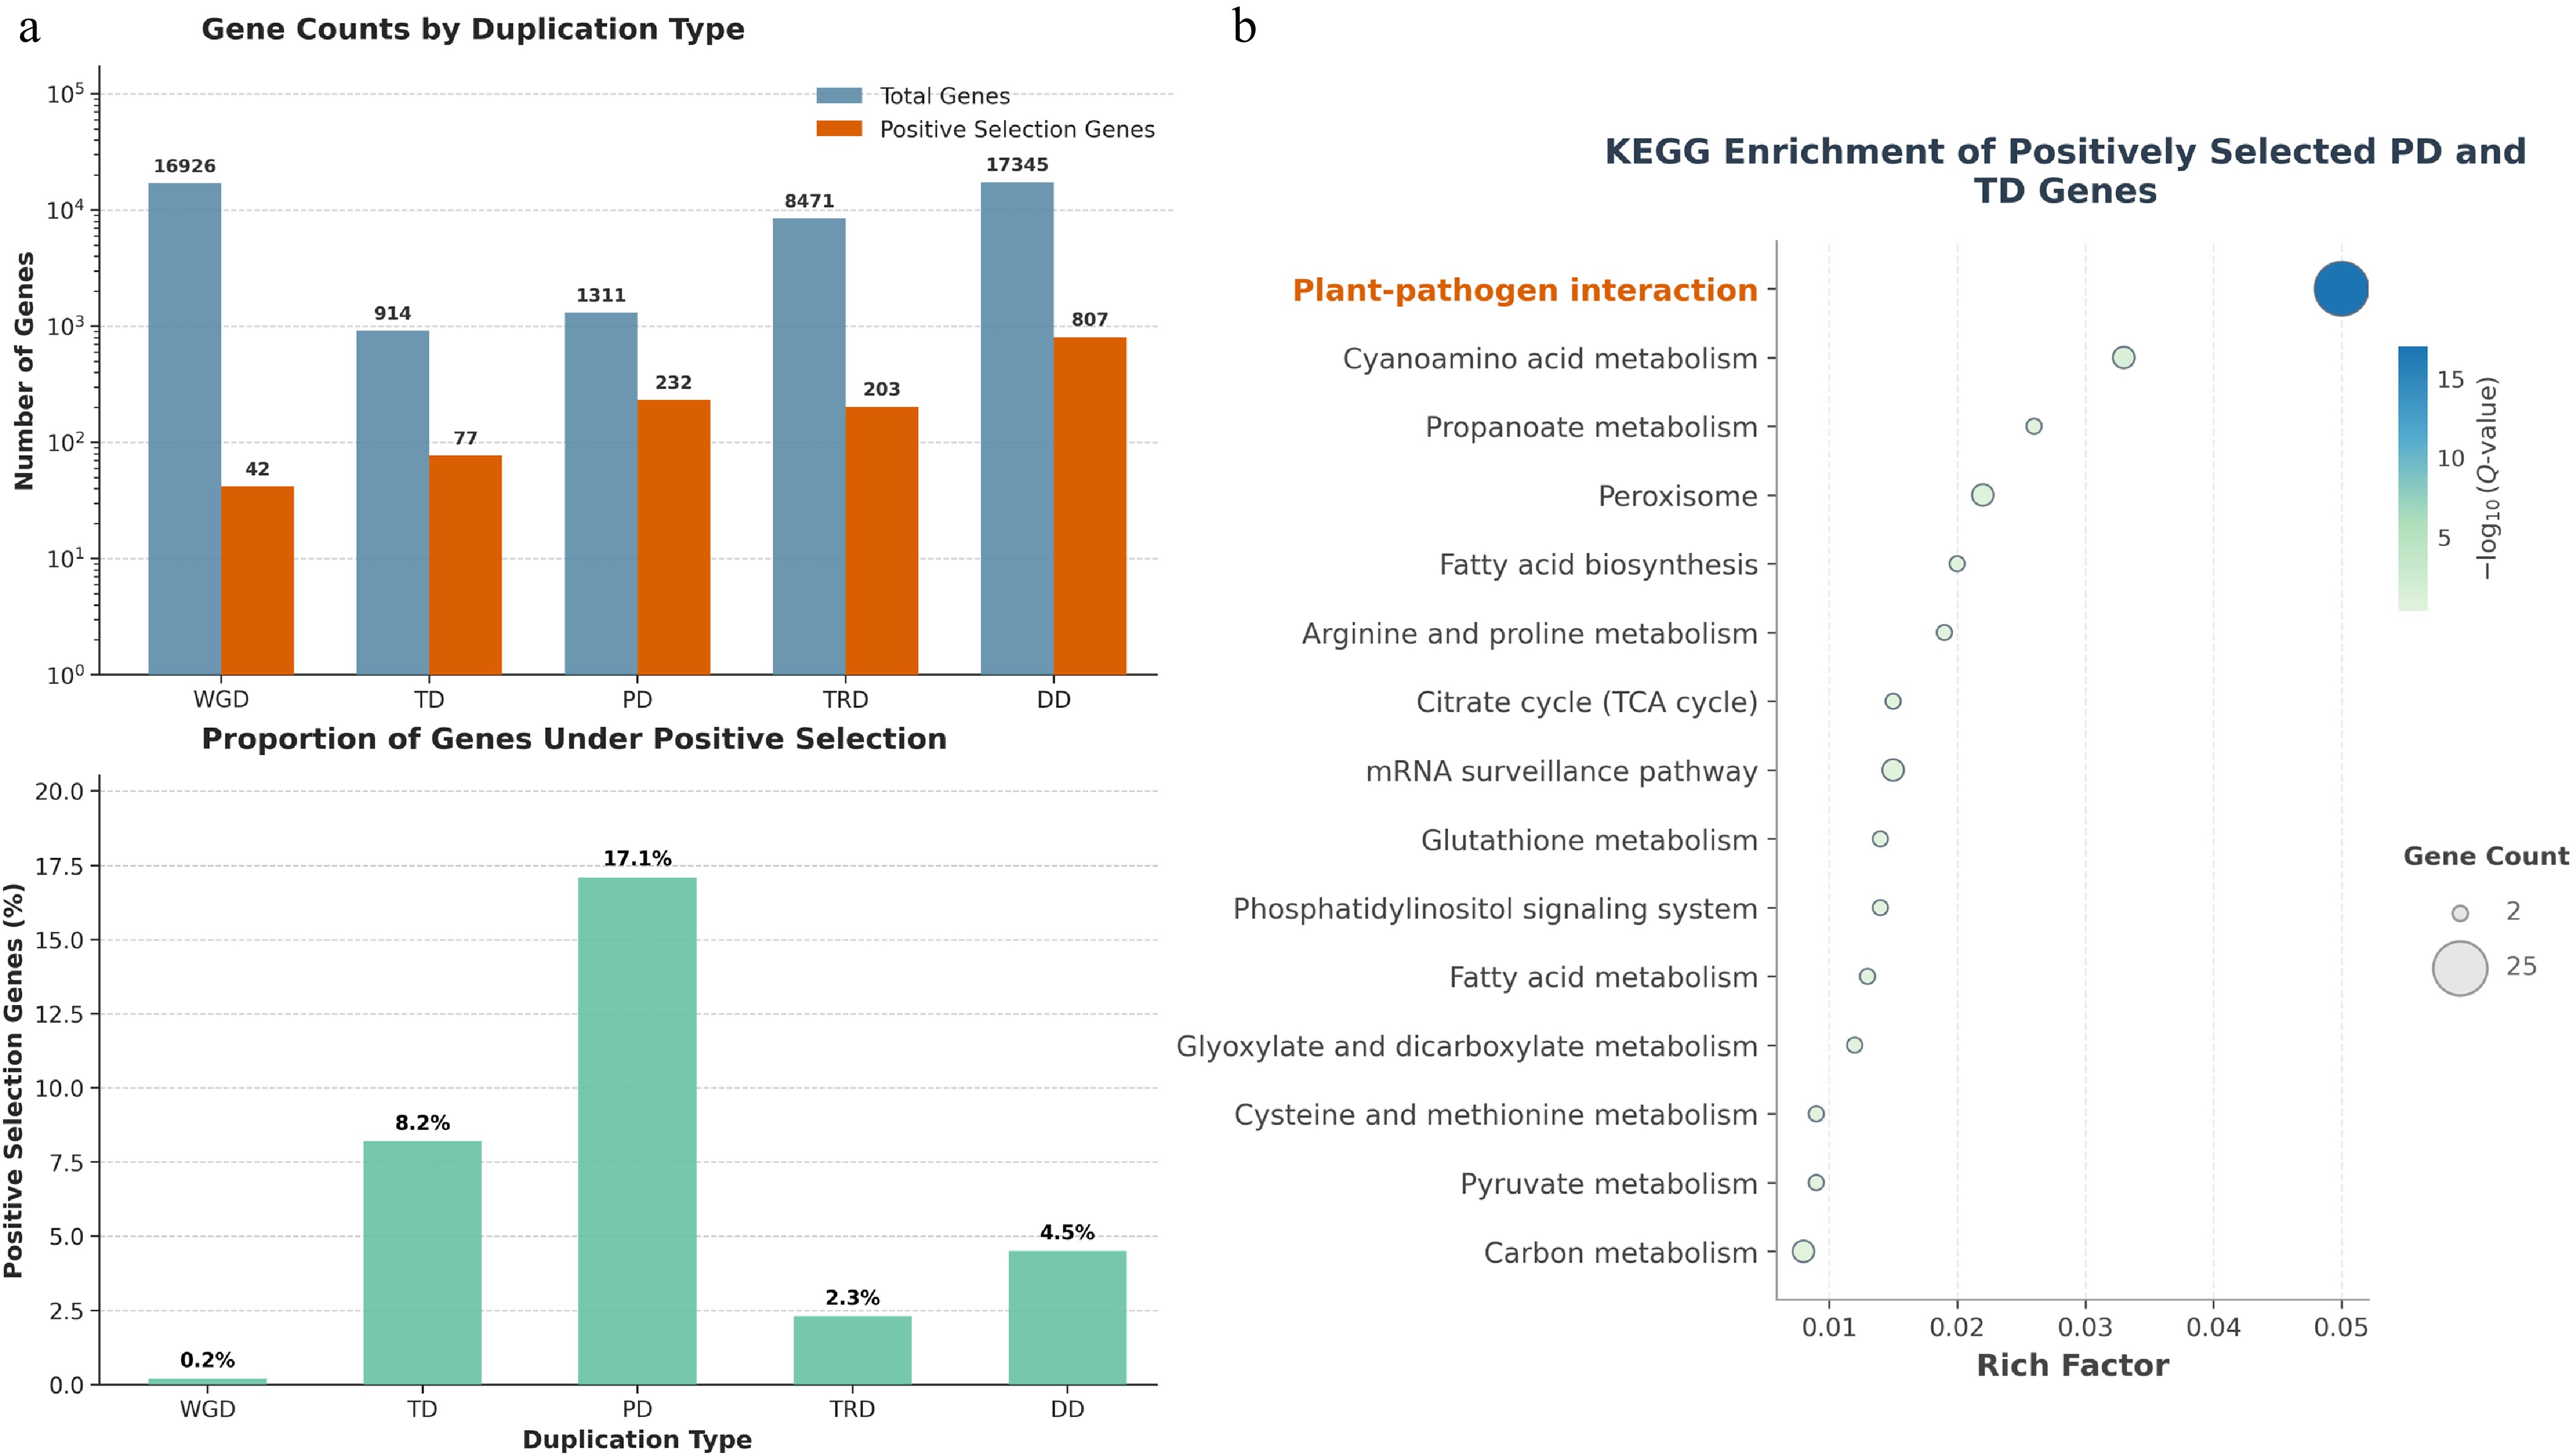
Figure 4.
Local duplications under positive selection enrich for defense pathways in F. mandshurica. (a) Gene duplication landscape and selection pressure. Top panel: Total number of genes (blue bars) and genes under positive selection (Ka/Ks > 1; orange bars) classified by duplication mode: WGD (whole-genome), TD (tandem), PD (proximal), TRD (transposed), and DD (dispersed). Bottom panel: The proportion (%) of positively selected genes within each duplication category. PD and TD duplicates showed the highest proportions of candidate positively selected genes, at 17.1% and 8.2%, respectively. (b) KEGG pathways enriched in positively selected genes derived from TD and PD events. The 'plant–pathogen interaction' pathway shows the most significant enrichment, suggesting a potential contribution of local duplications to defense-related gene diversification. Bubble size represents gene number, and color intensity indicates significance (−log10 Q-value).
-
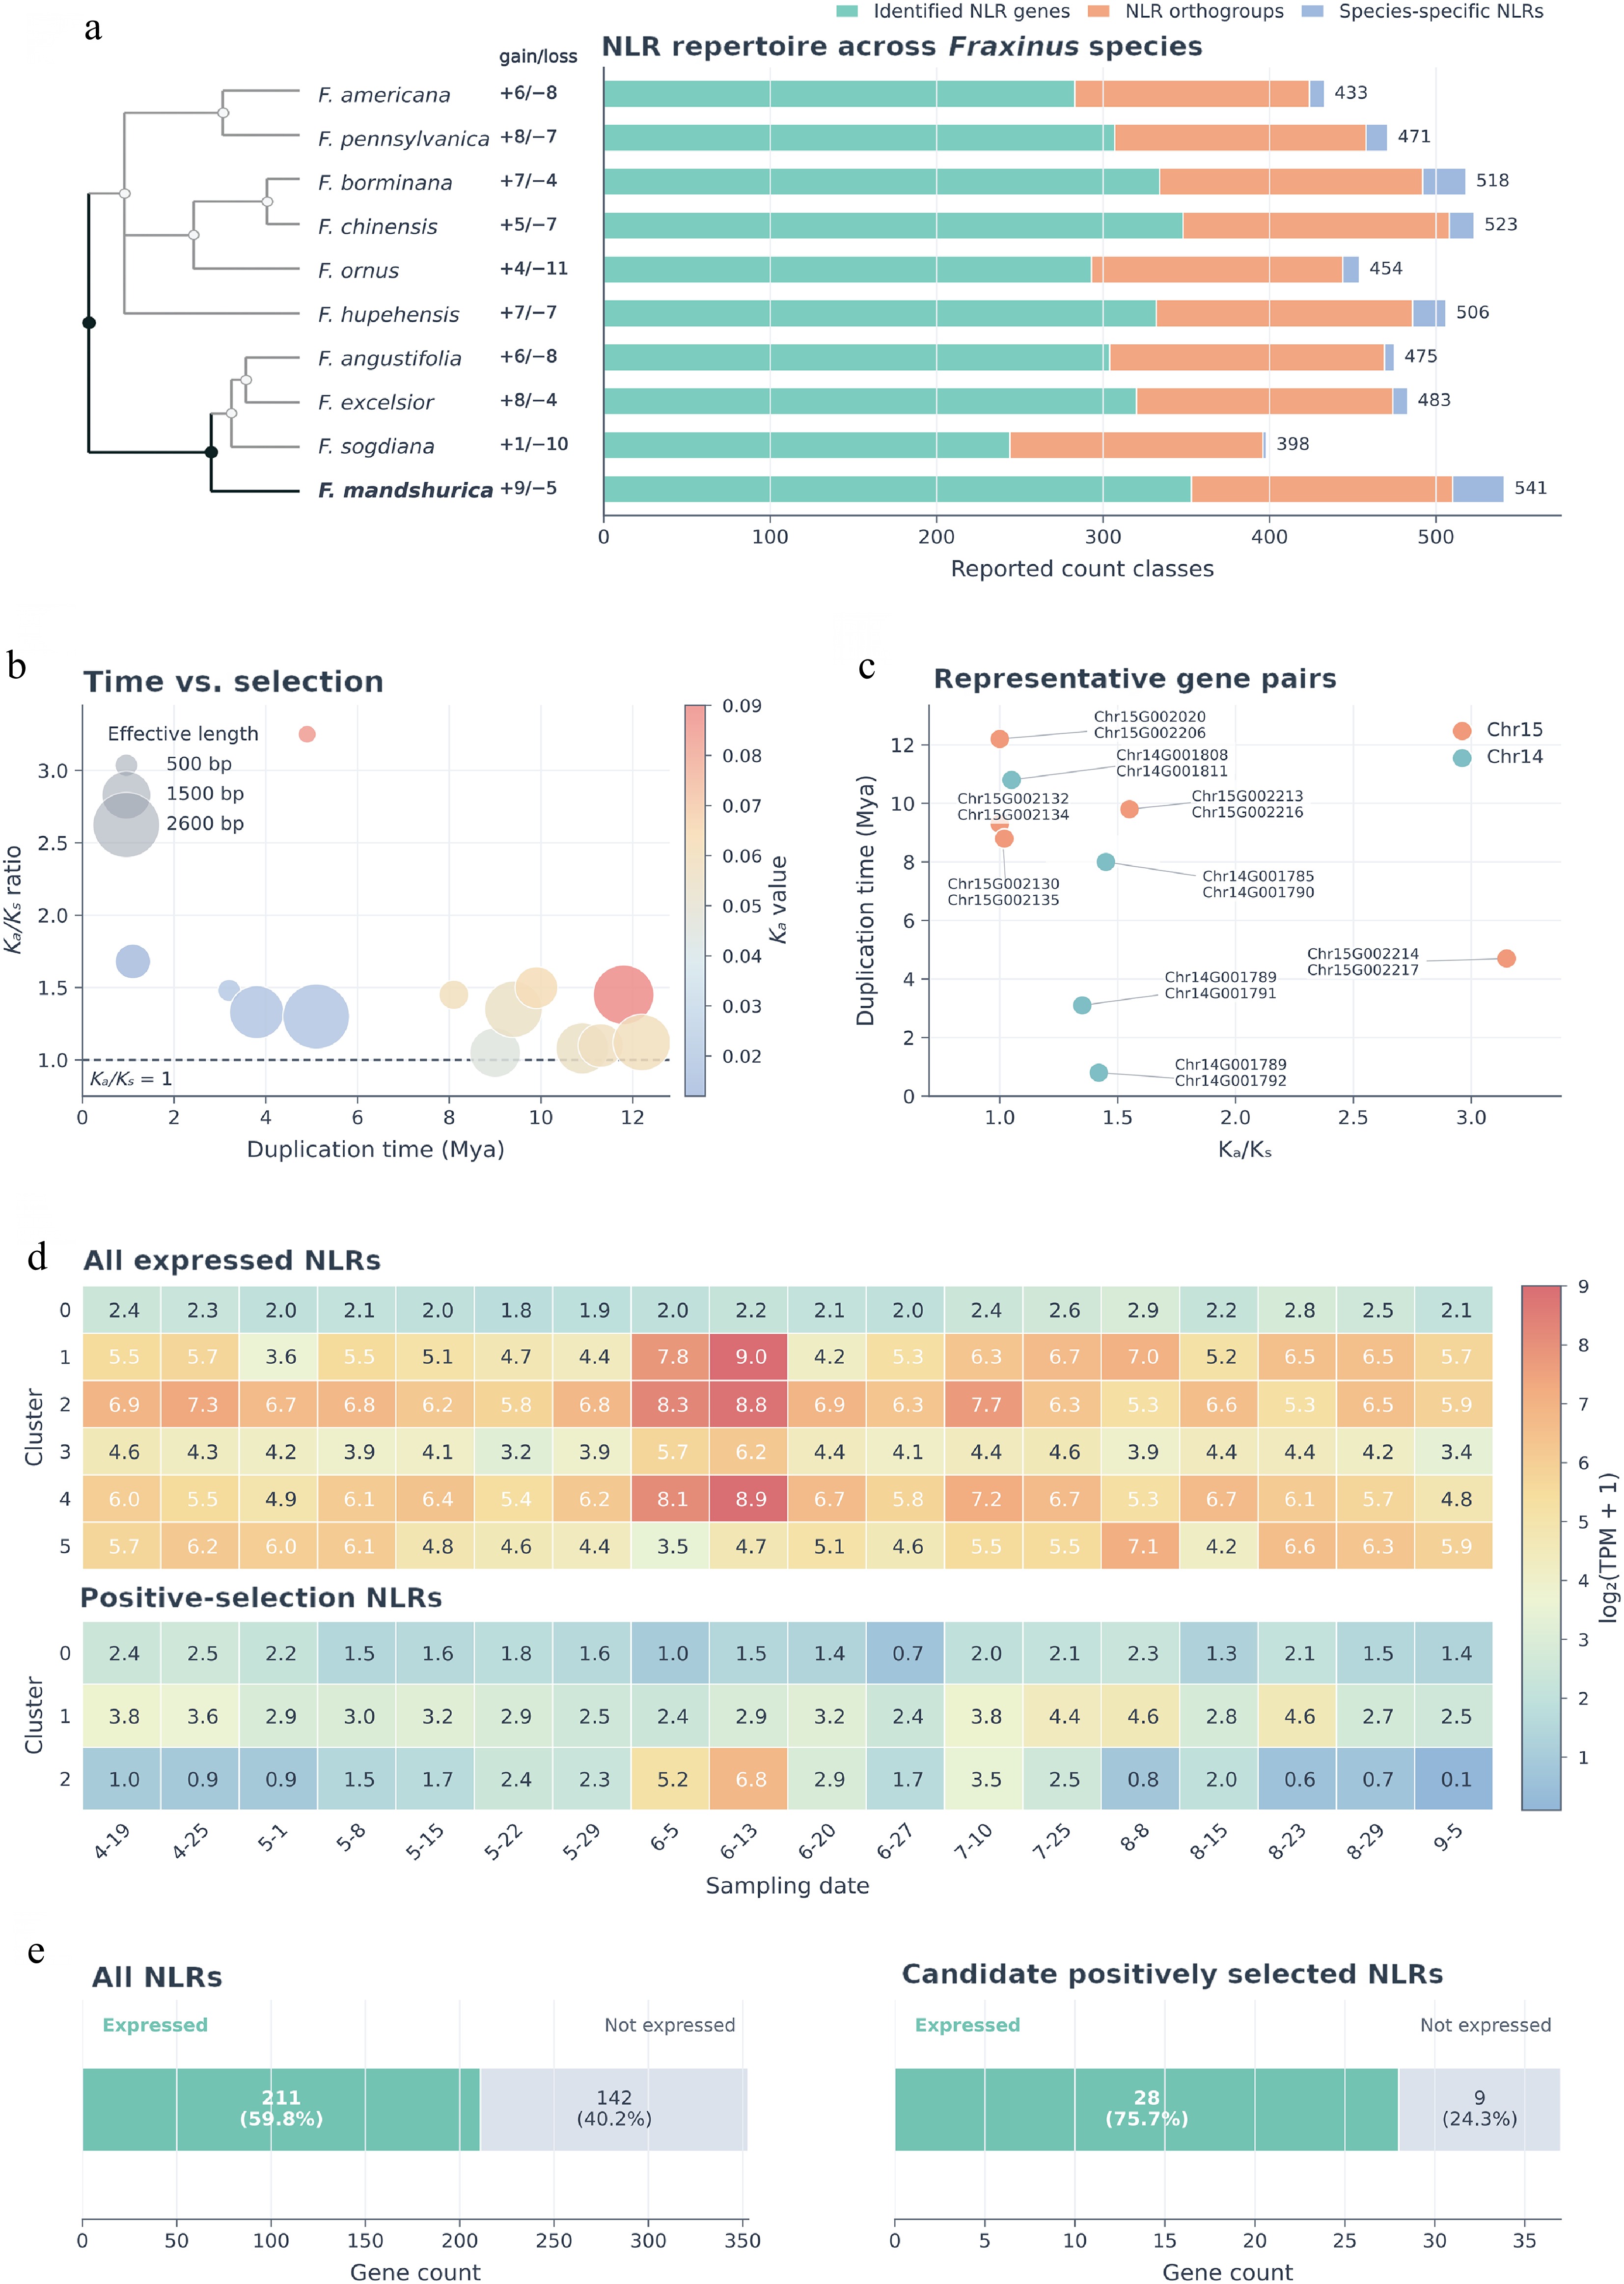
Figure 5.
Expansion, adaptive evolution, and functional deployment of NLR genes in F. mandshurica. (a) Evolutionary dynamics of NLR repertoires across ten Fraxinus species. The phylogeny (left) shows inferred gene family gains (+) and losses (−) along each branch. The stacked bars (right) summarize three count classes: identified NLR genes, NLR orthogroups, and species-specific NLRs; the number at the end of each bar indicates the total reported count across these three classes. F. mandshurica exhibits one of the largest overall NLR profiles among the sampled species. (b) Relationship between duplication time and selective pressure among NLR paralogs. Each bubble represents an NLR gene pair; the x-axis indicates duplication time (Mya), the y-axis indicates Ka/Ks ratio, bubble size represents effective length, bubble color represents Ka value, and the dashed horizontal line marks Ka/Ks = 1. (c) Representative candidate positively selected NLR gene pairs on chromosomes 14 and 15. The scatter plot shows duplication time vs Ka/Ks ratio, with point color indicating chromosome identity and labels denoting representative gene pairs. (d) Temporal expression heatmaps of NLR genes during xylem development. The upper panel shows all 211 expressed NLRs grouped into six clusters, and the lower panel shows 28 expressed candidate positively selected NLRs grouped into three clusters. Expression values are shown as log2(TPM + 1). (e) Expression status of the total NLR set and the candidate positively selected subset. Stacked horizontal bar charts show the proportions of expressed and not expressed genes for all NLRs (211 expressed, 142 not expressed) and candidate positively selected NLRs (28 expressed, nine not expressed), respectively.
-
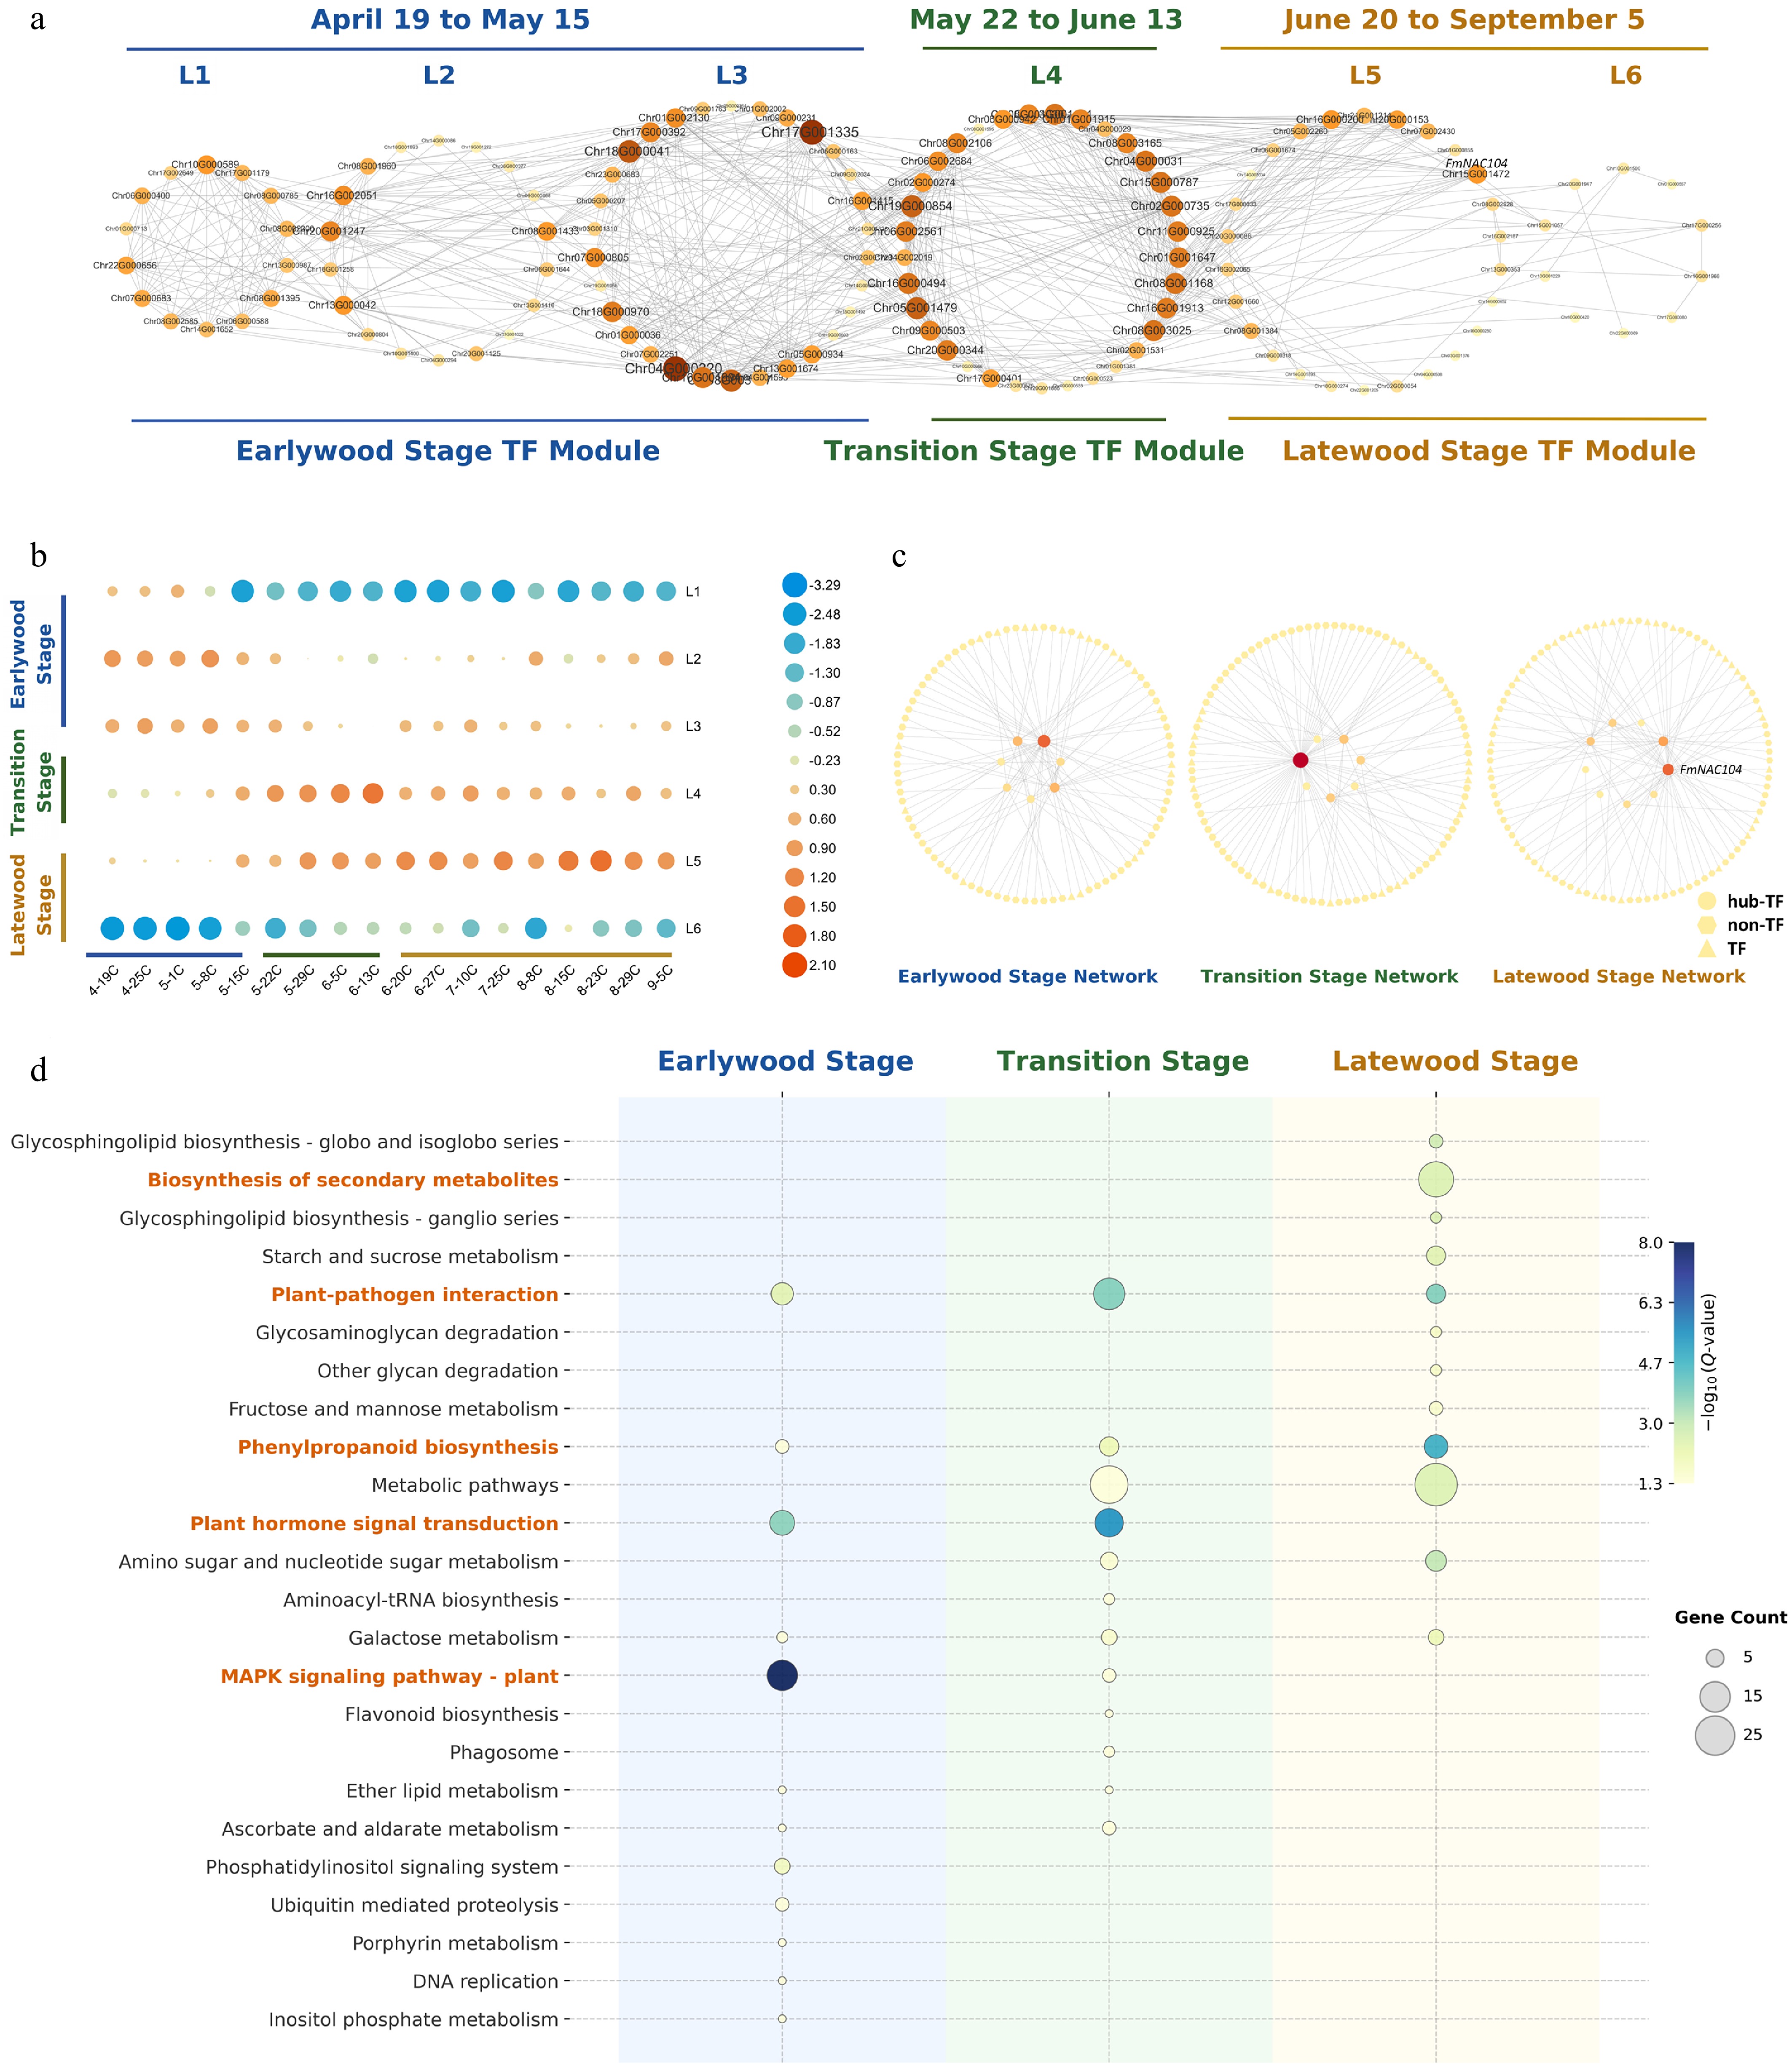
Figure 6.
Stage-resolved transcription factor networks controlling wood development in F. mandshurica. (a) Time-ordered TF co-expression network (TO-GCN) showing six temporal modules (L1–L6) aligned with the three developmental phases: Earlywood Stage, Transition Stage, and Latewood Stage. (b) Mean expression profiles of each TF module across sampling dates, defining the distinct physiological stages of wood formation. (c) Directed regulatory networks constructed via GENIE3 for each stage. Central nodes represent hub TFs (larger nodes indicate higher connectivity), and peripheral nodes represent downstream targets. Note the prominent hub FmNAC104 (red node) in the Latewood network. (d) KEGG pathway enrichment of TF targets at each stage, illustrating a functional shift from signaling-dominated programs in Earlywood/Transition to phenylpropanoid and secondary metabolism in Latewood. Bubble size indicates gene count, and color intensity represents significance (−log10 Q-value).
-
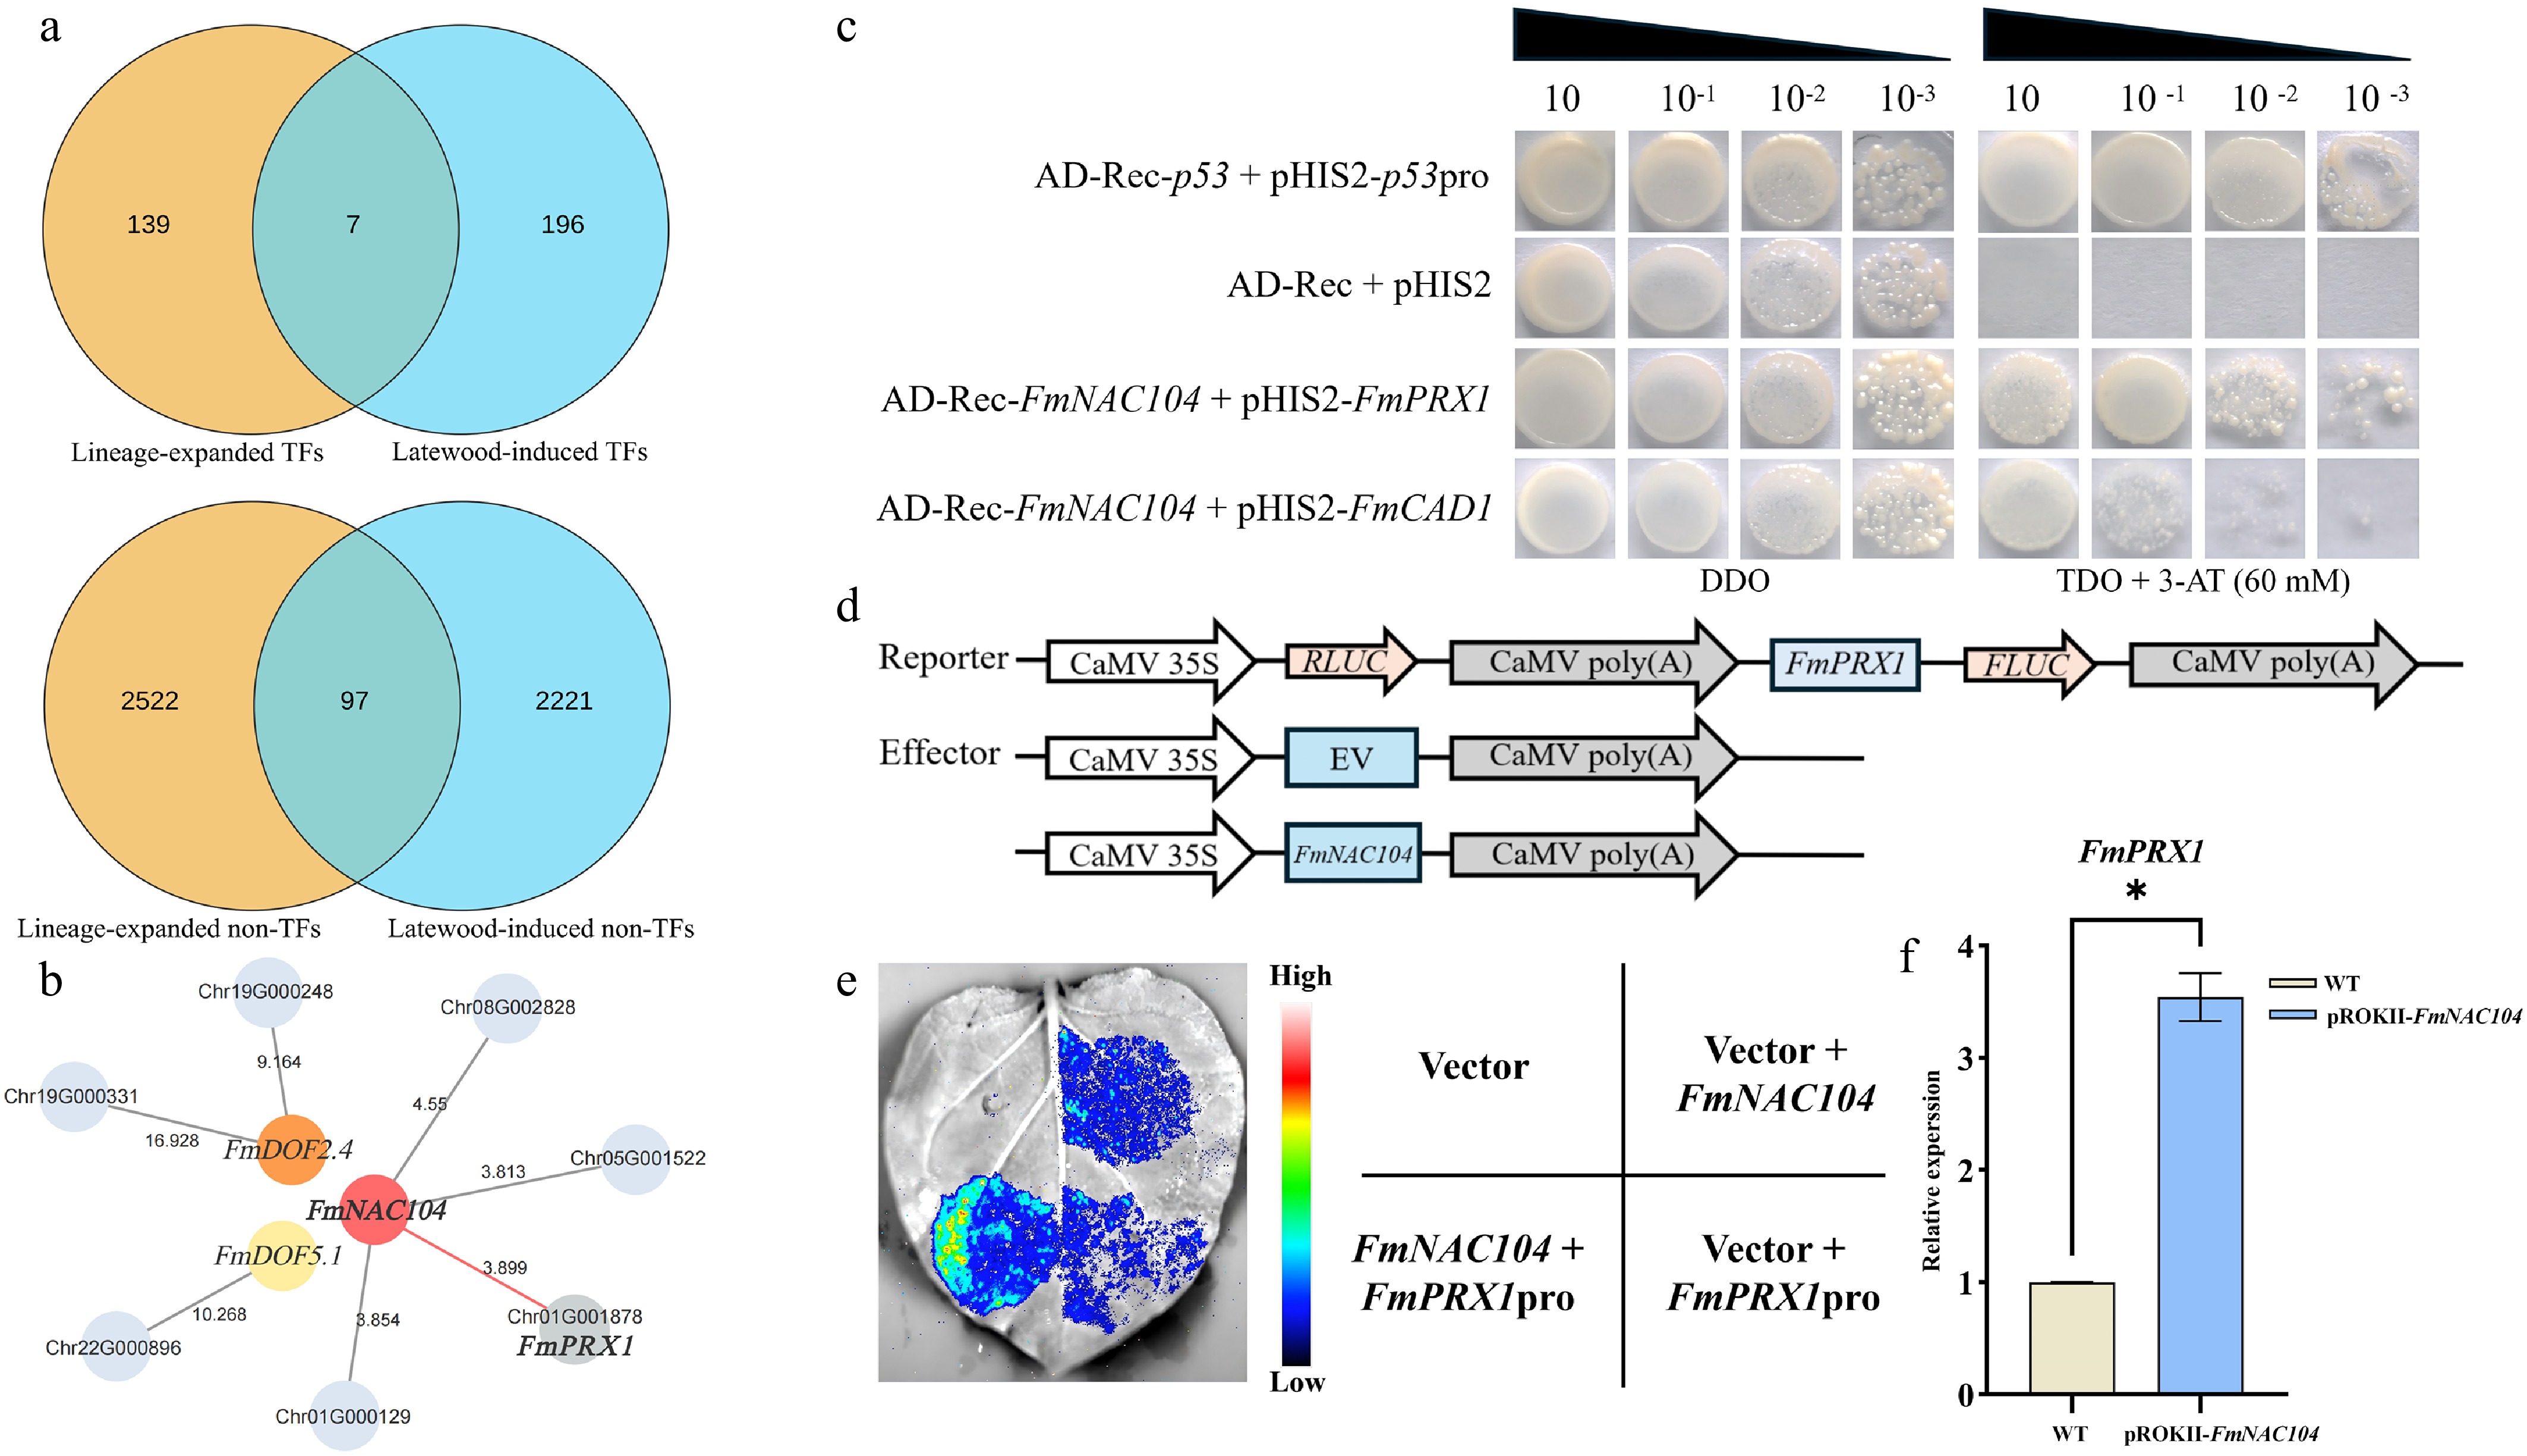
Figure 7.
A latewood-recruited FmNAC104–FmPRX1 regulatory module in F. mandshurica. (a) Identification of high-priority candidates. Top Venn diagram: Intersection of lineage-expanded TFs and Latewood-induced TFs yields seven candidates (including FmNAC104). Bottom Venn diagram: Intersection strategy for identifying expanded, Latewood-induced target genes. (b) High-confidence regulatory sub-network integrating GENIE3 weights and motif analysis. The network highlights the interaction between FmNAC104 (red node) and FmPRX1 (target), alongside other candidates like FmDOF2.4. (c) Yeast one-hybrid (Y1H) assay showing specific binding of FmNAC104 to the FmPRX1 promoter (pFmPRX1) but not to the negative control promoter (pFmCAD1) or empty vectors on selective media (TDO/3-AT). (d) Schematic of the dual-luciferase reporter constructs used to test transcriptional activation. (e) Dual-luciferase assay in Nicotiana benthamiana leaves showing strong activation of pFmPRX1 by FmNAC104 (LUC signal). (f) In planta validation. qRT-PCR analysis shows the relative expression of endogenous FmPRX1 in F. mandshurica seedlings transiently overexpressing FmNAC104 (pROKII-FmNAC104) compared with empty-vector controls (EV). Data represent the mean ± SD (n = 3); asterisk indicates significance (Student's t-test, p < 0.05).
-
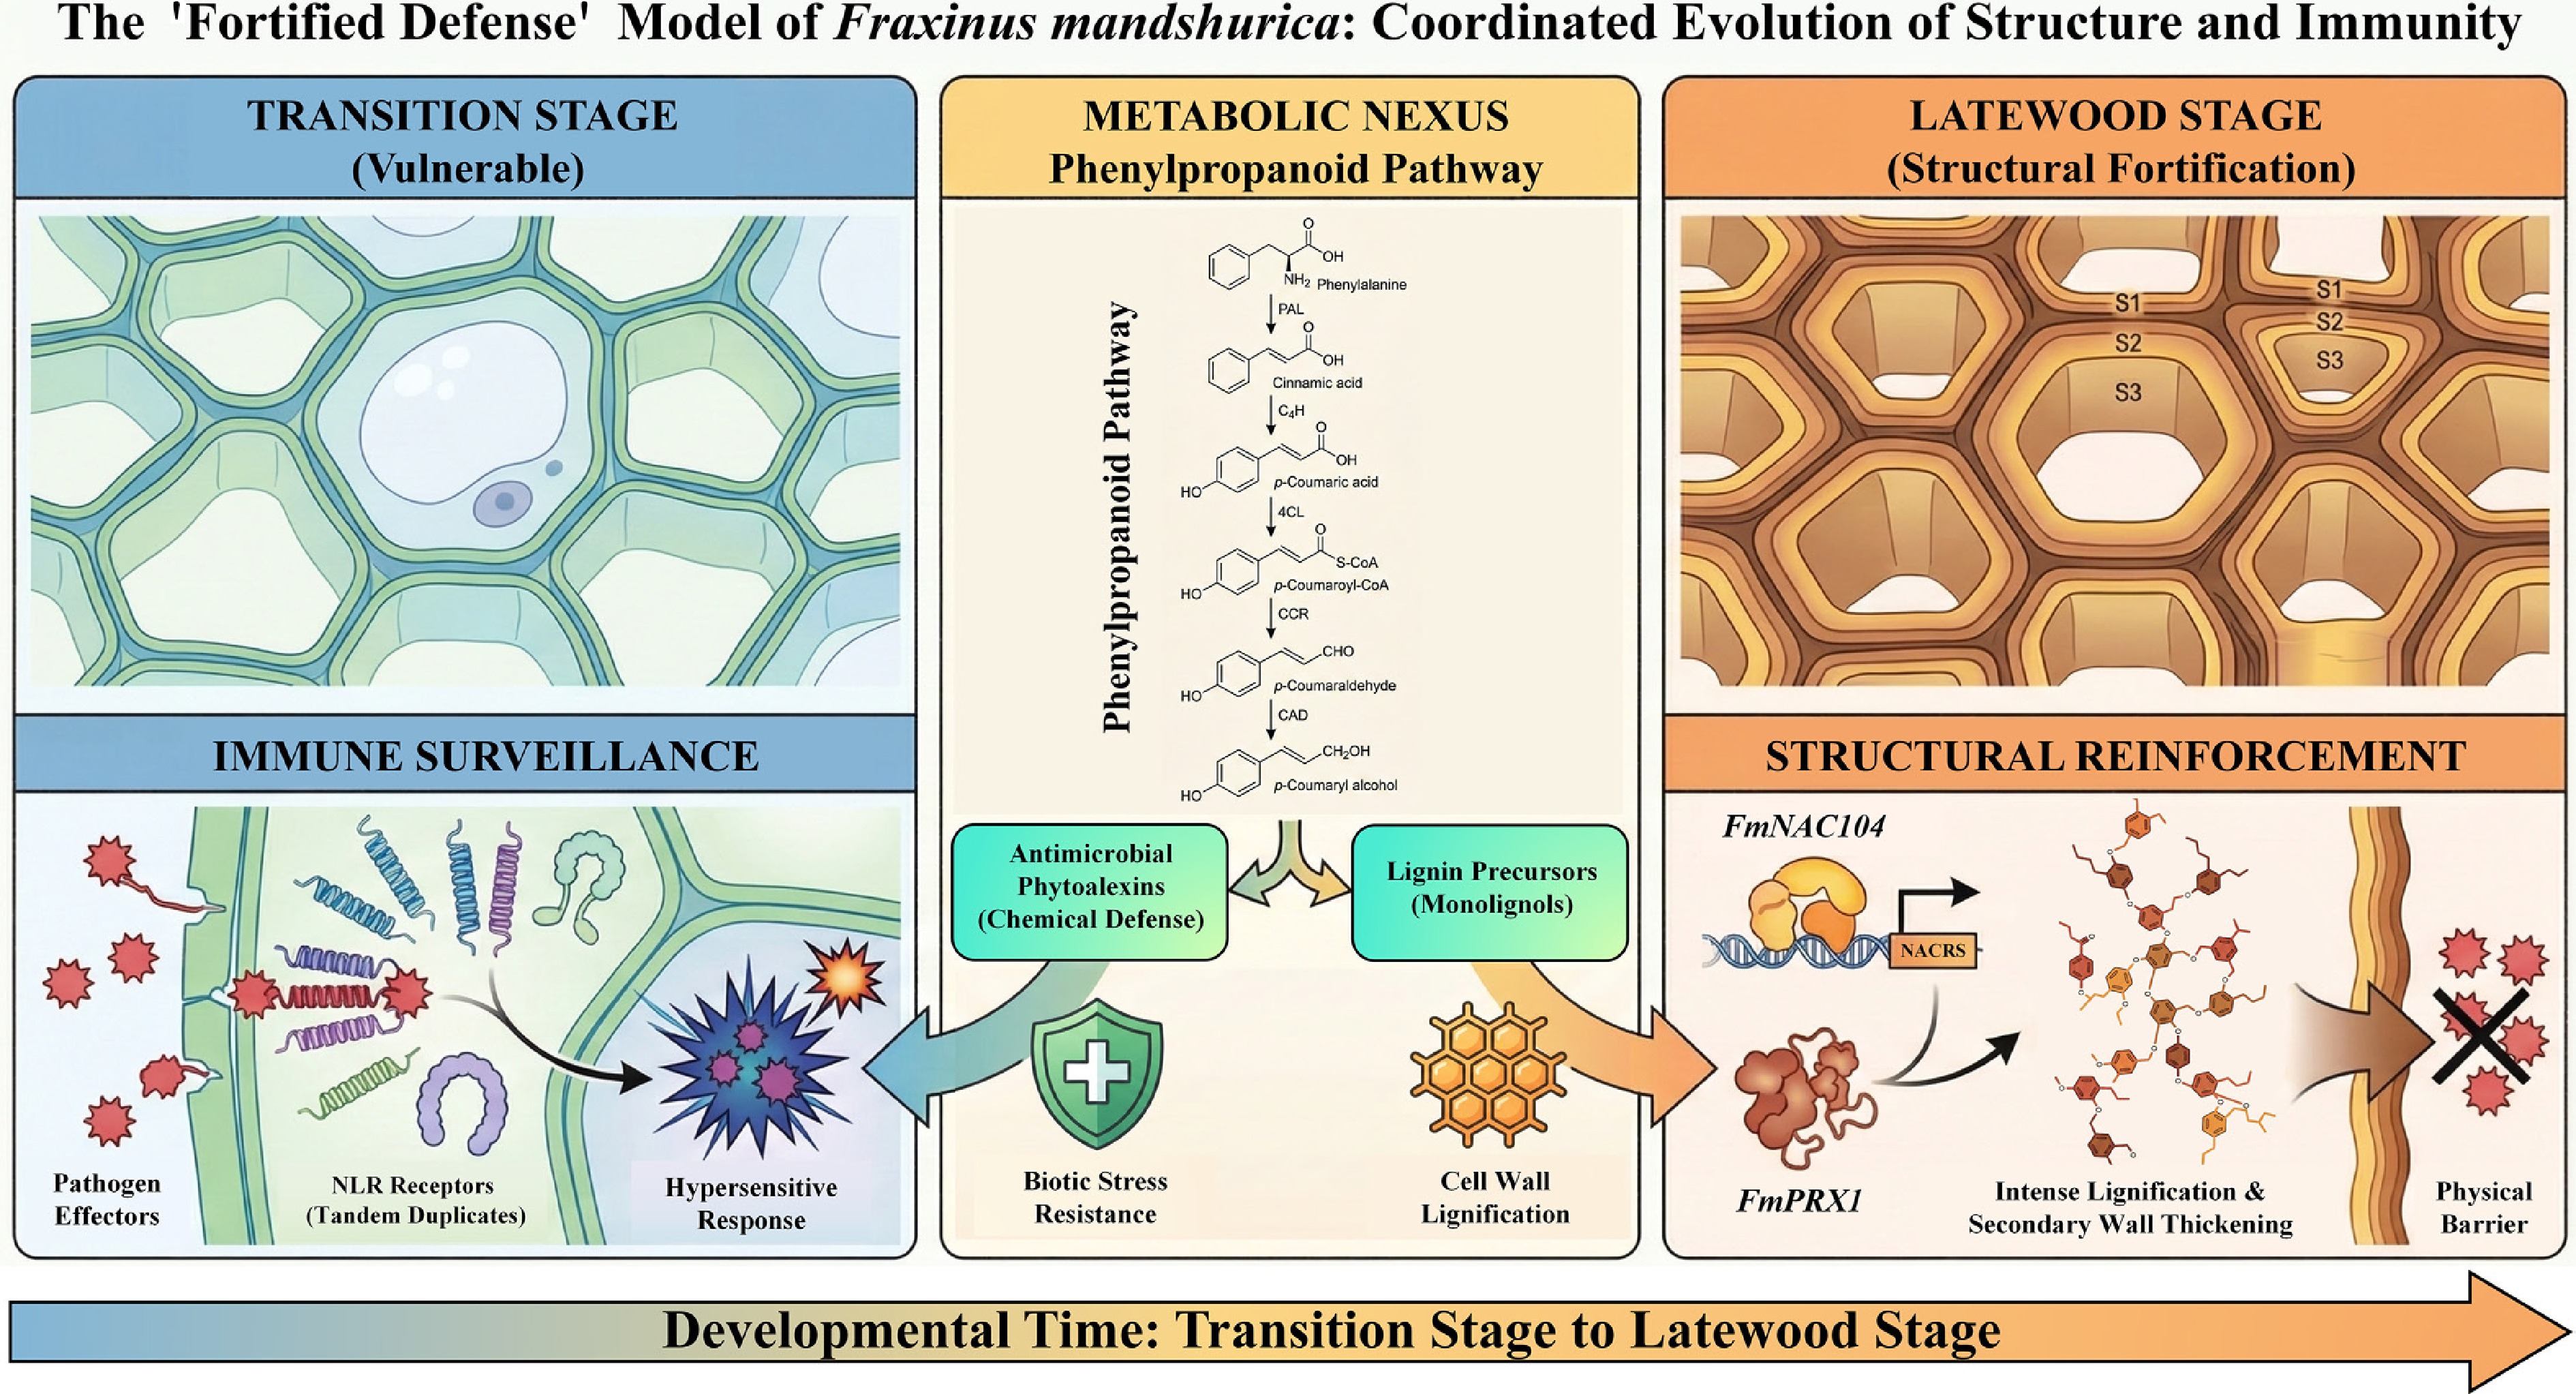
Figure 8.
The 'Fortified Defense' working model of F. mandshurica. NLR-associated immune surveillance is transcriptionally active during the Transition Stage, whereas phenylpropanoid metabolism and the FmNAC104–FmPRX1 candidate regulatory module are associated with latewood lignification and structural reinforcement. This model provides a testable framework for the temporal coordination of immune and structural programs during xylem development.
-
Category Statistic Value Sequencing data Sequence platform PacBio Sequel II, Illumina HiSeq X Ten Polymerase read bases (Gb) 286.9 HiFi read bases (Gb) 16.6 Hi-C raw data (Gb) 70 Illumina WGS raw data (Gb) 108 Genome assembly results Genome size (Mb) 774 Number of contigs 564 Contig N50 (Mb) 9.00 Number of scaffolds (post-Hi-C) 450 Scaffold N50 (Mb) 34.02 Chromosomal anchoring rate (%) 97.28 Assembly quality and completeness BUSCO completeness (Genome) (%) 98.70 GC content (%) 35.54 Mean chromosome-level Merqury QV 61.41 Whole-genome LAI 12.03 Table 1.
Statistics of the F. mandshurica genome assembly.
-
Category Statistic Value Gene annotation Protein-coding genes 50,092 Mean gene length (bp) 1,828 Mean CDS length (bp) 1,201 BUSCO completeness (Proteins) (%) 96.80 Non-coding RNAs miRNAs 1129 snoRNAs 1597 rRNAs 562 tRNAs 692 Repeat sequences Total repetitive sequences (Mb) 529.39 Repetitive sequence content (%) 67.85 LTR-Copia (%) 20.77 LTR-Gypsy (%) 14.15 LINE (%) 1.17 SINE (%) 0.01 DNA transposons (%) 6.61 Functional annotation Annotated in at least one database (%) 89.96 NR (%) 89.87 eggNOG (%) 80.29 Pfam (%) 73.14 COG (%) 75.63 Swiss-Prot (%) 65.43 GO (%) 40.20 KEGG KO (%) 39.44 Table 2.
Statistics of F. mandshurica genome annotation.
Figures
(8)
Tables
(2)