-
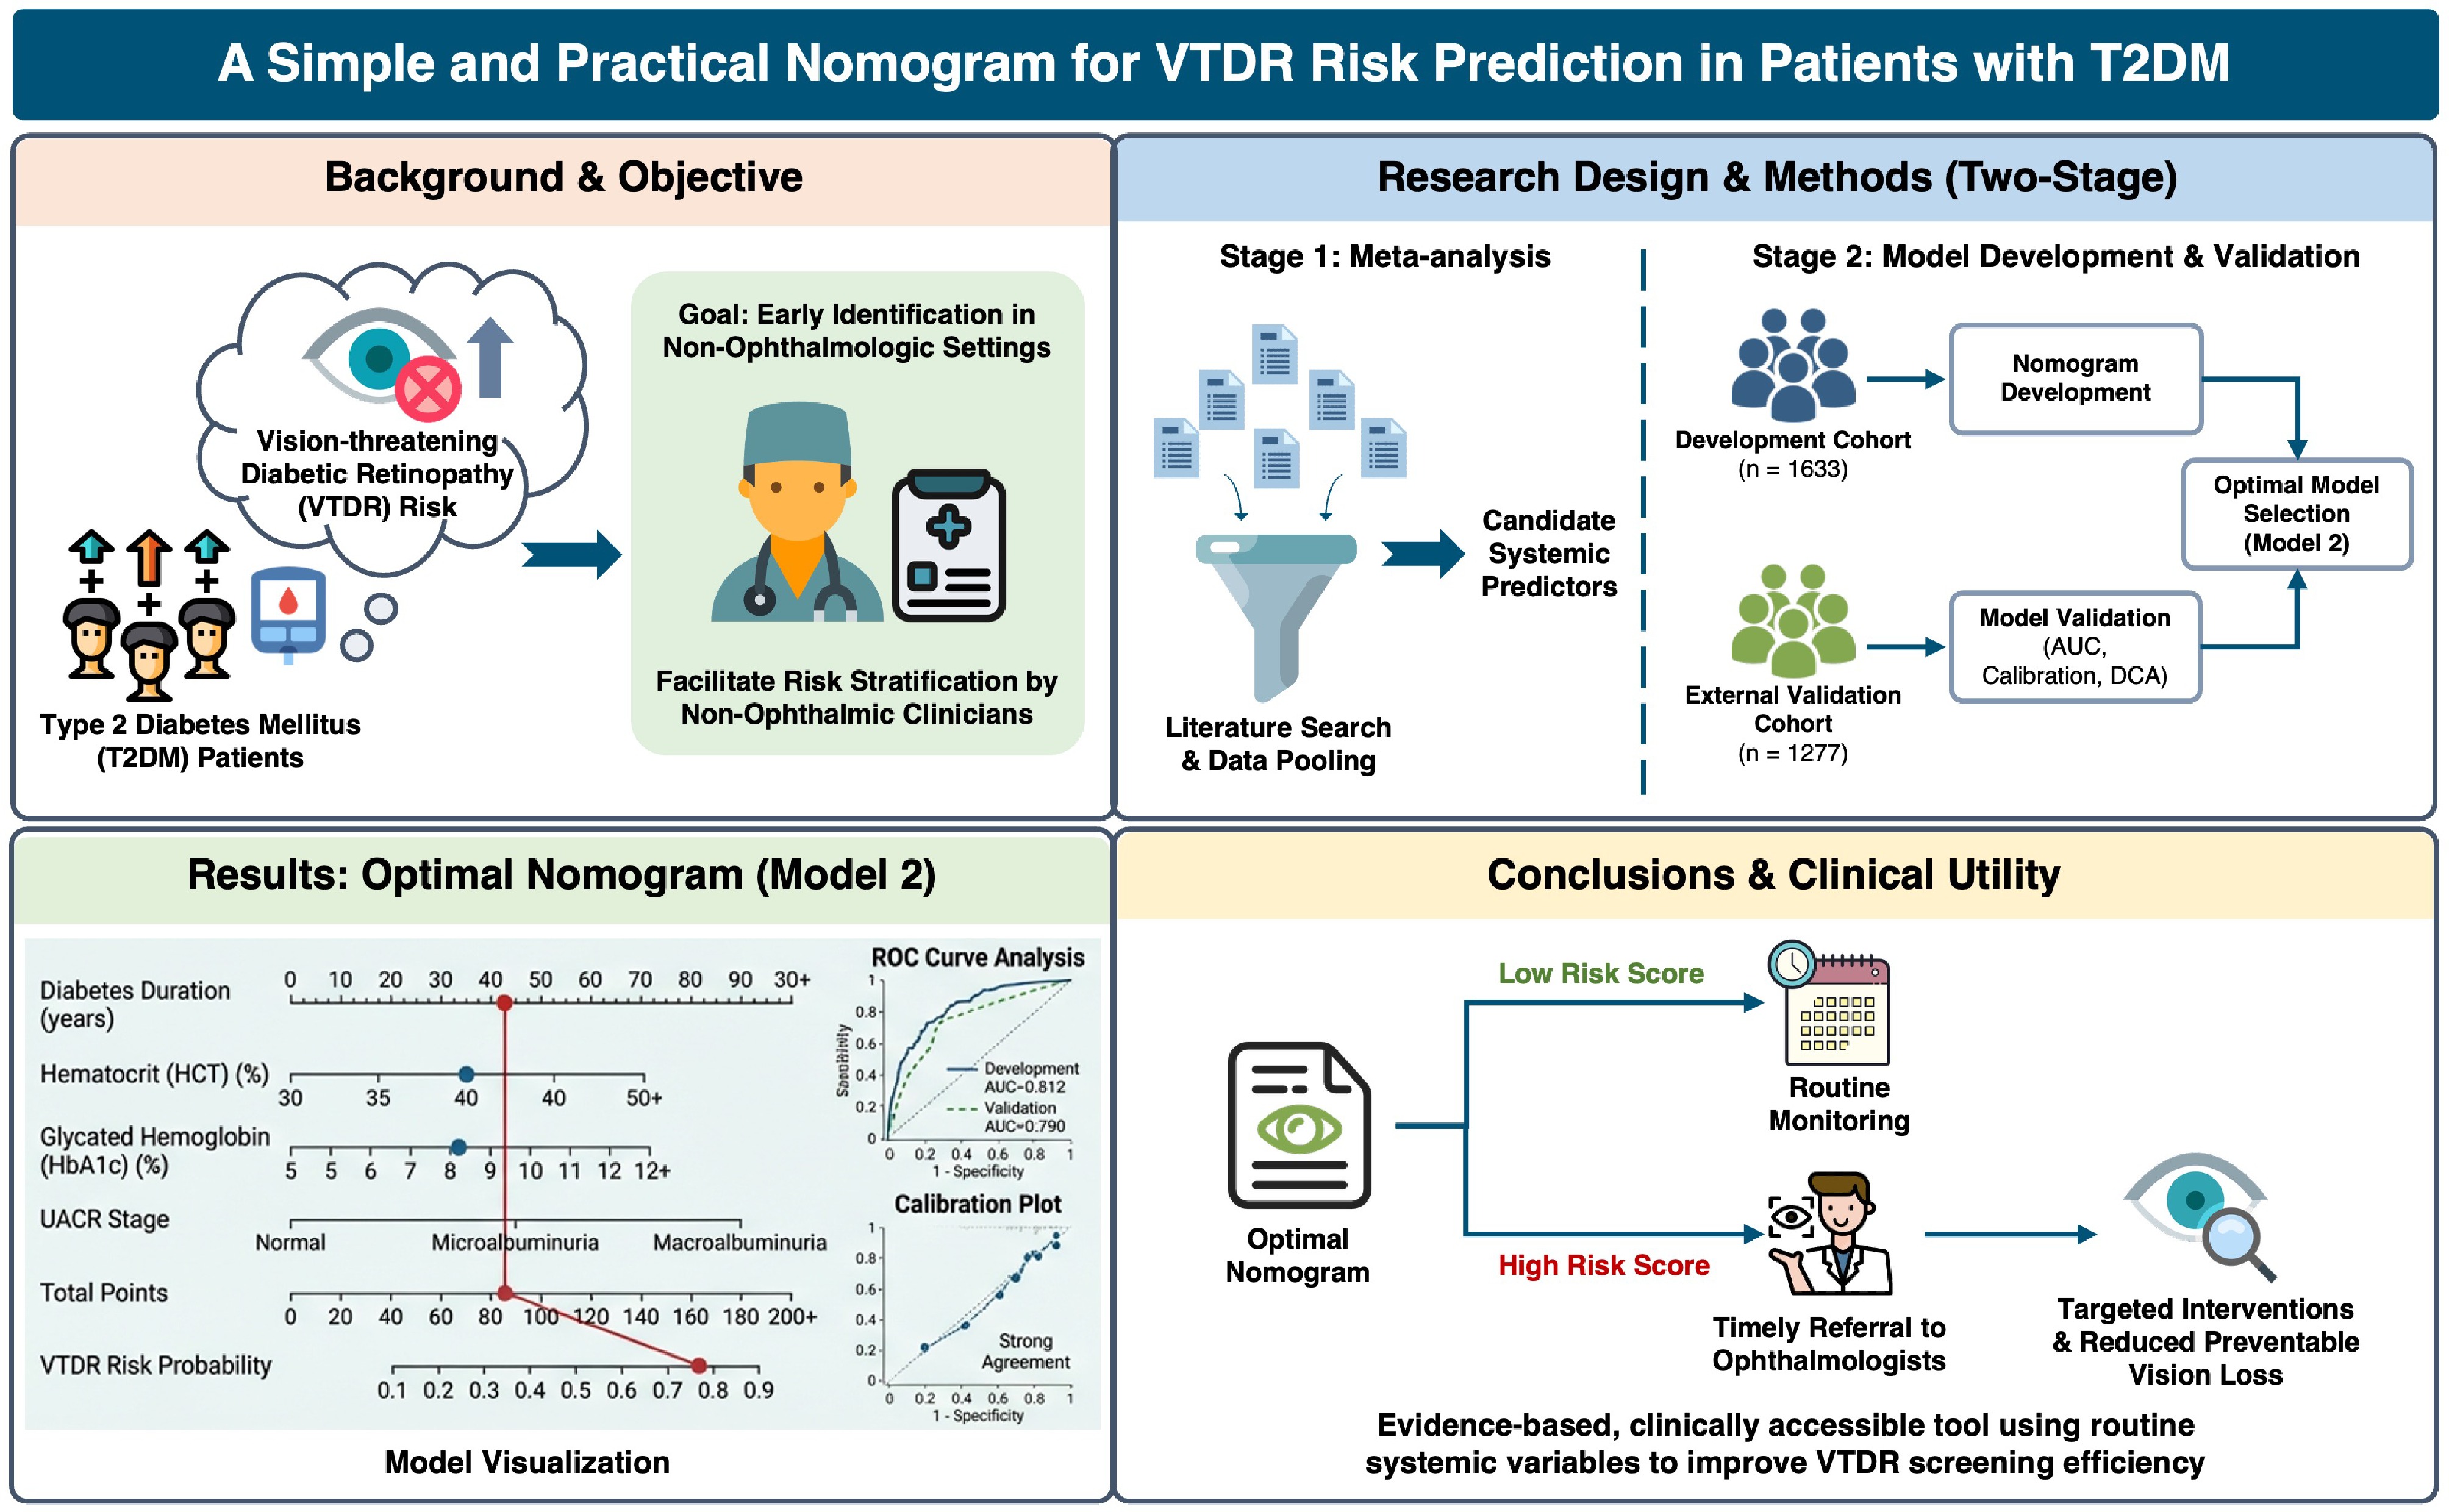
Figure 1.
Illustration of the whole study design.
-
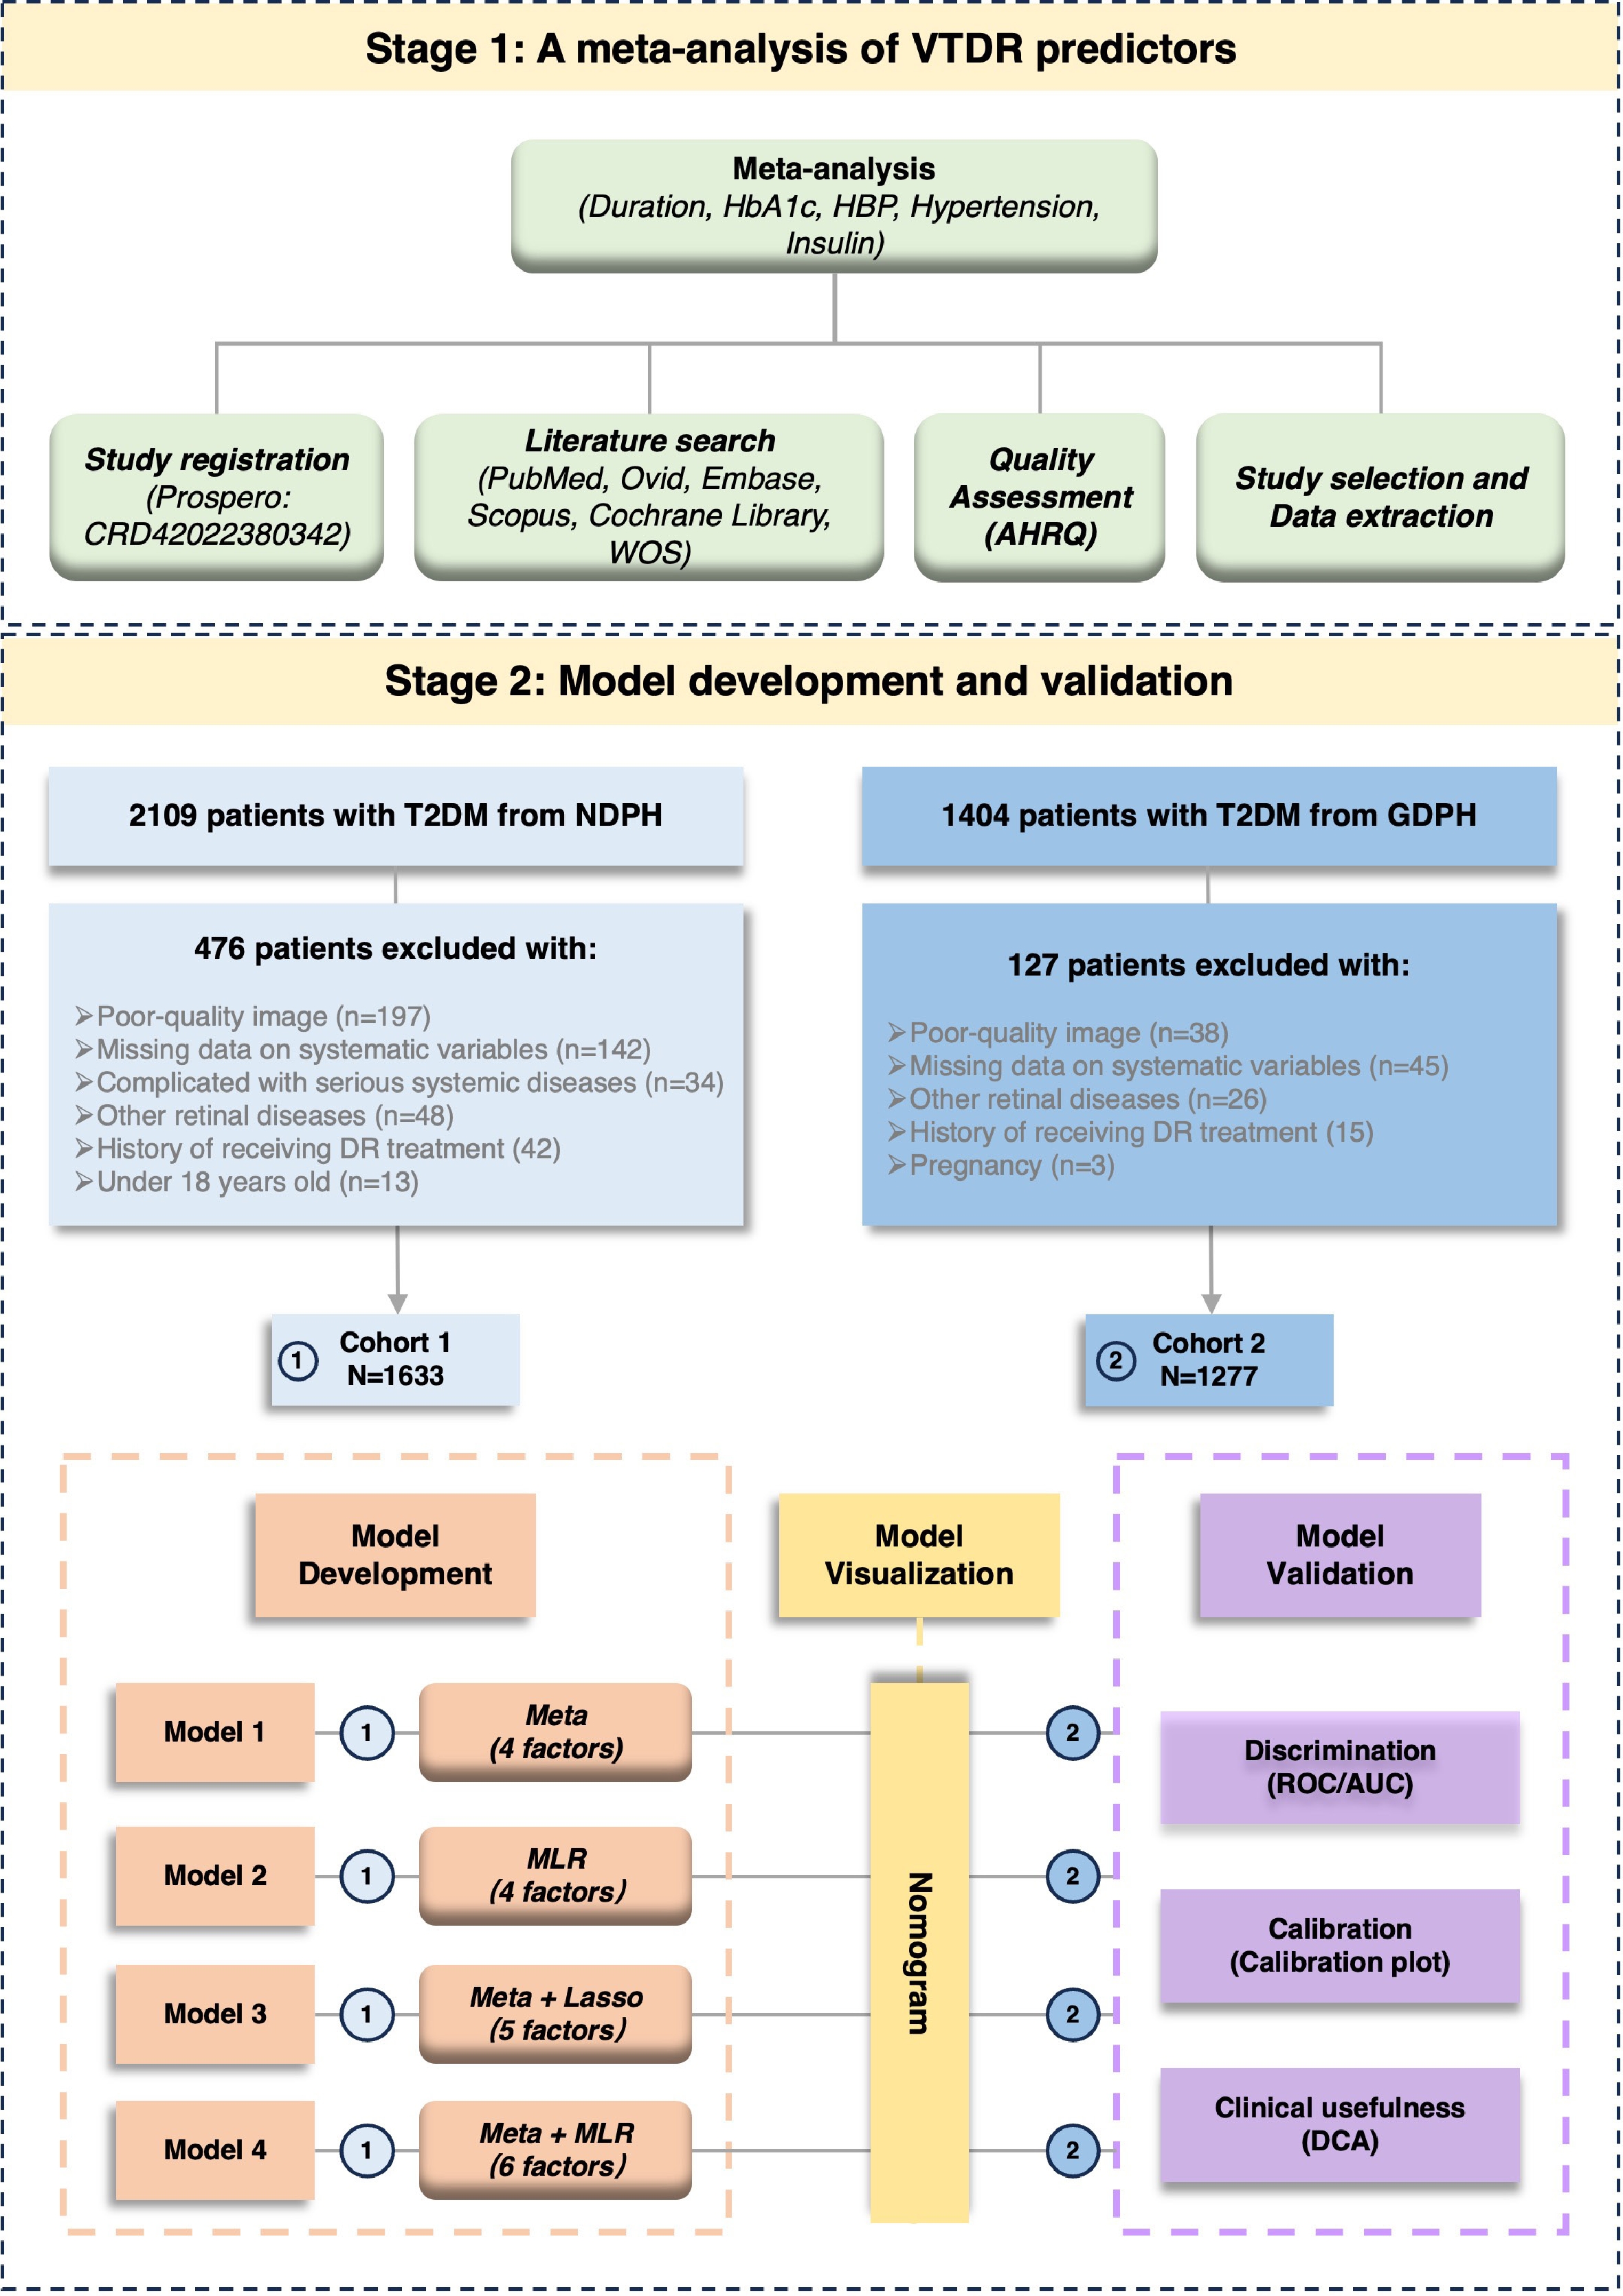
Figure 2.
Flowchart to show the development and validation of the VTDR prediction models. Abbreviations: HBP, hypertension; NDPH, Nanhai District People's Hospital; GDPH, Guangdong Provincial People's Hospital; MLR, multivariate logistic regression; LASSO, least absolute shrinkage and selection operator; ROC, receiver operating characteristic; AUC, area under the ROC curve; DCA, decision curve analysis.
-
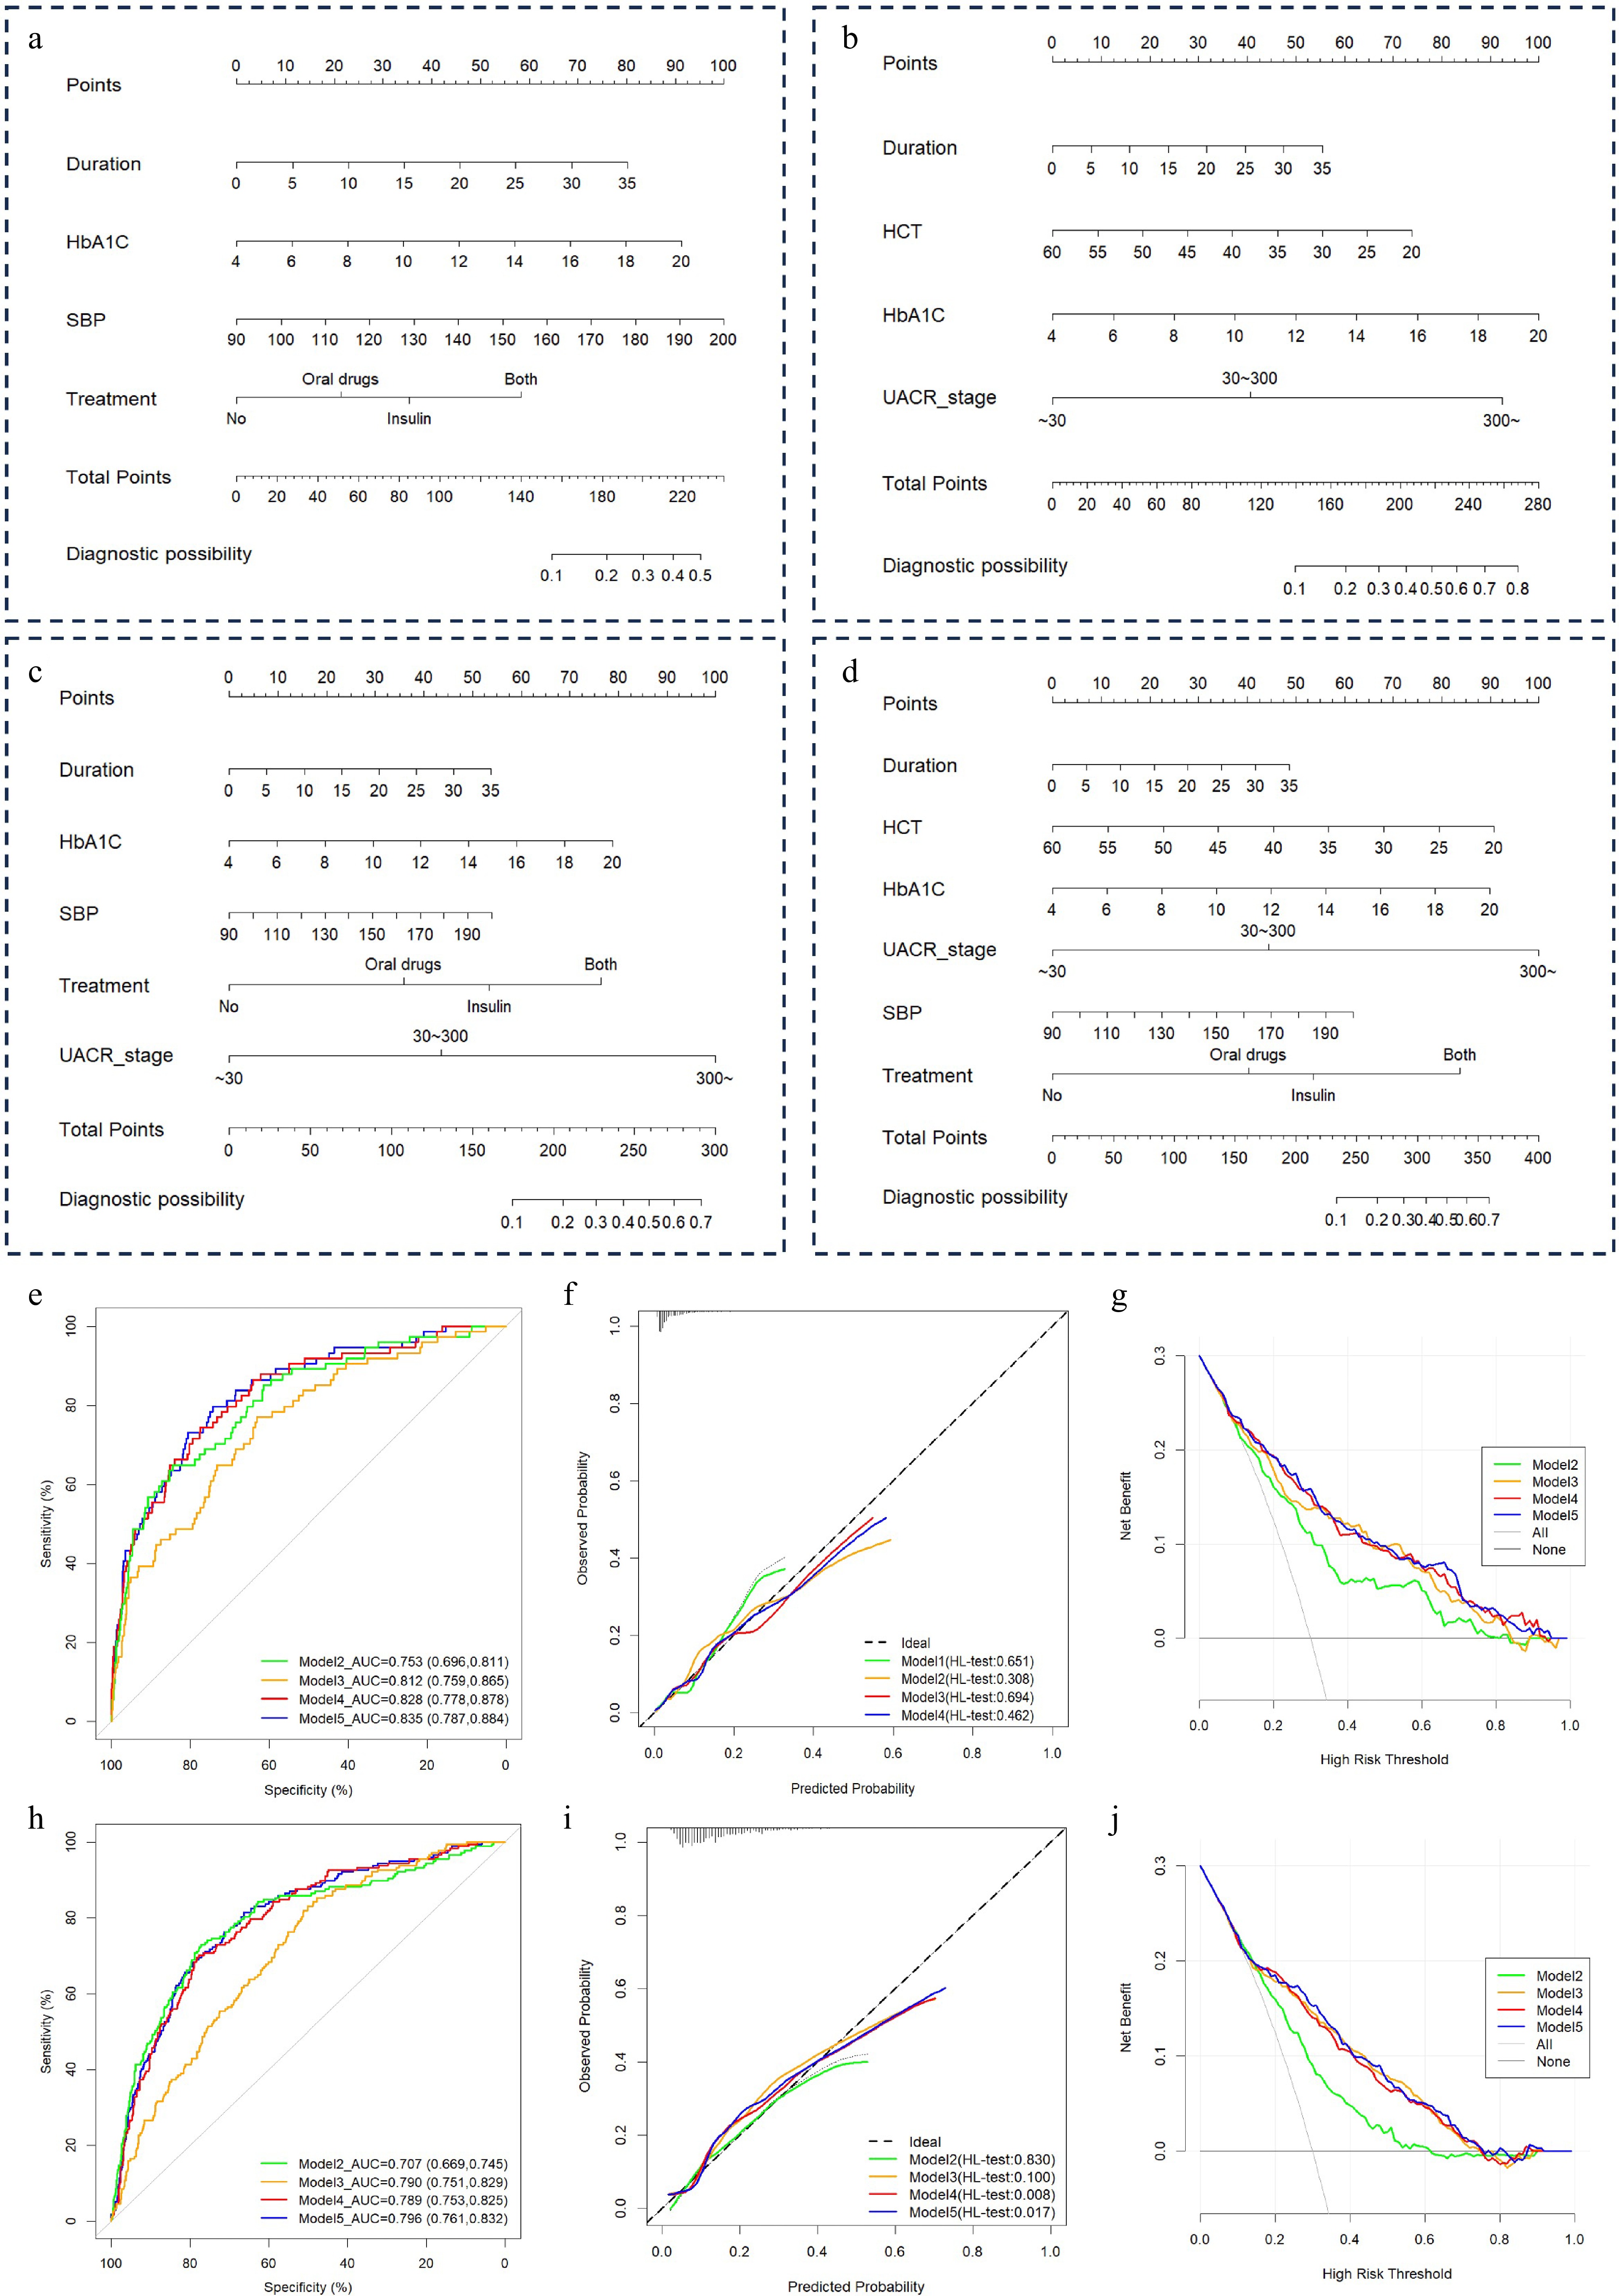
Figure 3.
Nomograms were established to predict VTDR in patients with T2DM. Nomograms of (a) Model 1, (b) Model 2, (c) Model 3, and (d) Model 4 are from the development cohort. 'Points' refers to points for the individual variable and adds to the 'Total points'. 'VTDR risk of T2DM' was calculated according to the 'Total points'. ROC curves of the nomograms of Models 1, 2, 3, and 4 are derived from (e) development and (h) validation cohorts. The x-axis represents the false positive rate of the risk prediction. The y-axis represents the true positive rate of the risk prediction. Calibration curves of the nomograms generated from (f) development and (i) validation cohorts. The ordinate represents the actual probability of VTDR, while the abscissa represents the nomogram-predicted probability of VTDR. The diagonal dashed line means that the predicted probability is equal to the actual probability, and the greater the deviation from the diagonal, the greater the error of prediction. Decision curve analysis for nomograms established in (g) development and (j) validation cohorts. The abscissa shows the threshold probability, while the ordinate shows the net benefit. The gray line represents the assumption of all VTDR-positive cases, and the black line represents the assumption of all VTDR-negative cases.
-
Variables Development cohort Validation cohort No VTDR (n = 1,559) Yes VTDR (n = 74) p value No VTDR (n = 1,100) Yes VTDR (n = 177) p value Sex (n, %) 0.344 1.000 Male 871 (55.9%) 46 (62.2%) 666 (60.5%) 107 (60.5%) Female 688 (44.1%) 28 (37.8%) 434 (39.5%) 70 (39.5%) Age (years) 57.0 [48.0, 64.5] 56.5 [45.8, 63.8] 0.670 56.0 [48.0, 65.0] 57.0 [50.0, 64.0] 0.647 Diabetes duration (years) 3.33 [0.00, 9.50] 8.62 [1.44, 13.0] < 0.001 5.88 [0.50, 11.4] 10.2 [6.67, 17.0] < 0.001 SBP (mm Hg) 126 [120, 138] 132 [121, 145] 0.021 129 [117, 141] 141 [125, 153] < 0.001 DBP (mm Hg) 78 [72.0, 83] 79 [72, 86] 0.066 76 [68, 84] 78 [71, 87] 0.004 FBG (mmol/L) 8.01 [6.24, 10.70] 9.47 [7.02, 12.60] 0.009 7.44 [5.81, 9.45] 8.17 [5.95, 10.7] 0.063 PG-2h (mmol/L) 14.5 [11.4, 18.0] 14.4 [10.7, 17.0] 0.529 12.2 [8.93, 15.4] 11.0 [8.52, 15.5] 0.106 Scr (μmol/L) 65.0 [53.0, 79.0] 66.5 [57.2, 106] 0.028 70.6 [57.8, 84.6] 81.0 [65.4, 123] < 0.001 eGFR (mL/min/1.73 m2) 101 [77.9, 130] 87.4 [67.5, 110] 0.009 96.5 [78.3, 108] 83.6 [52.5, 100] < 0.001 UA (μmol/L) 368 [298, 452] 402 [342, 481] 0.006 365 [296, 434] 387 [326, 467] 0.001 TG (mmol/L) 1.63 [1.06, 2.65] 1.54 [1.06, 2.58] 0.65 1.54 [1.09, 2.26] 1.41 [0.97, 2.31] 0.223 TC (mmol/L) 4.99 [4.20, 5.80] 4.80 [4.17, 5.81] 0.646 4.89 [4.06, 5.70] 5.00 [4.20, 6.30] 0.008 HDLc (mmol/L) 1.23 [1.05, 1.46] 1.23 [1.02, 1.51] 0.895 0.99 [0.85, 1.15] 1.02 [0.88, 1.28] 0.05 LDLc (mmol/L) 2.75 [2.06, 3.46] 2.74 [1.99, 3.42] 0.749 3.20 [2.59, 3.81] 3.40 [2.75, 4.18] 0.022 RBC (1012/L) 4.76 [4.38, 5.23] 4.54 [4.21, 4.91] 0.002 4.66 [4.27, 5.04] 4.29 [3.86, 4.75] < 0.001 WBC (109/L) 7.16 [5.97, 8.49] 7.46 [6.53, 8.85] 0.052 7.05 [5.92, 8.38] 7.47 [6.17, 8.71] 0.064 PLT (109/L) 247 [208, 290] 242 [206, 297] 0.949 236 [197, 281] 232 [185, 301] 0.721 HCT (%) 41.7 [38.6, 44.9] 39.3 [35.9, 42.8] < 0.001 40.6 [38.0, 43.0] 36.0 [32.0, 41.0] < 0.001 Hb (g/L) 138 [126, 150] 131 [118, 145] < 0.001 136 [126, 147] 122 [109, 137] < 0.001 HbA1c (%) 8.80 [6.90, 11.3] 10.80 [8.83, 12.20] < 0.001 9.50 [7.70, 11.3] 9.80 [8.20, 11.5] 0.03 UACR (mg/g) < 0.001 < 0.001 < 30 1,193 (76.5%) 25 (33.8%) 834 (75.8%) 61 (34.5%) 30−300 309 (19.8%) 23 (31.1%) 190 (17.3%) 44 (24.9%) ≥ 300 57 (3.66%) 26 (35.1%) 76 (6.91%) 72 (40.7%) BMI (kg/m2) 0.254 0.126 < 24 629 (40.3%) 37 (50.0%) 448 (40.7%) 85 (48.0%) 24−28 618 (39.6%) 25 (33.8%) 443 (40.3%) 67 (37.9%) ≥ 28 312 (20.0%) 12 (16.2%) 209 (19.0%) 25 (14.1%) CVD 0.269 0.955 No 1,482 (95.1%) 68 (91.9%) 958 (87.1%) 155 (87.6%) Yes 77 (4.94%) 6 (8.11%) 142 (12.9%) 22 (12.4%) Hypertension 0.972 < 0.001 No 976 (62.6%) 47 (63.5%) 647 (58.8%) 77 (43.5%) Yes 583 (37.4%) 27 (36.5%) 453 (41.2%) 100 (56.5%) Hypoglycemic therapy < 0.001 < 0.001 No 76 (4.87%) 1 (1.35%) 351 (31.9%) 24 (13.6%) Oral drugs 943 (60.5%) 22 (29.7%) 421 (38.3%) 77 (43.5%) Insulin 79 (5.07%) 4 (5.41%) 71 (6.45%) 17 (9.60%) Oral drugs and insulin 461 (29.6%) 47 (63.5%) 257 (23.4%) 59 (33.3%) Continuous variables are presented as median [interquartile range], and categorical variables as frequency (percentage). p-values < 0.05 were considered statistically significant, indicating a significant difference between the No-VTDR and Yes-VTDR groups. Bold values represent key outcome-related indicators. Table 1.
Clinical characteristics of the development and validation cohorts.
-
Variables Univariate analysis Multivariate analysis OR (95% CI) p value OR (95% CI) p value Sex (n, %) Male Reference Female 0.77 (0.48–1.25) 0.291 Age (years) 1.00 (0.98–1.02) 0.642 Diabetes duration (years) 1.07 (1.04–1.10) < 0.001 1.04 (1.00–1.08) 0.051# SBP (mm Hg) 1.03 (1.01–1.04) < 0.001 1.02 (1.00–1.03) 0.091# DBP (mm Hg) 1.03 (1.00–1.05) 0.042 FBG (mmol/L) 1.04 (0.99–1.08) 0.103 PG-2h (mmol/L) 0.98 (0.93–1.03) 0.392 Scr (μmol/L) 1.00 (1.00–1.00) 0.233 eGFR (mL/min/1.73 m2) 0.99 (0.99–1.00) 0.042 1.01 (1.00–1.01) 0.072# UA (μmol/L) 1.00 (1.00–1.00) 0.030 1.00 (1.00–1.00) 0.091# TG (mmol/L) 0.96 (0.87–1.07) 0.492 TC (mmol/L) 1.01 (0.85–1.21) 0.890 HDLc (mmol/L) 0.96 (0.58–1.61) 0.880 LDLc (mmol/L) 1.03 (0.84–1.26) 0.790 RBC (1012/L) 0.57 (0.40–0.82) < 0.001 WBC (109/L) 1.00 (0.98–1.02) 0.942 PLT (109/L) 1.00 (1.00–1.00) 0.673 HCT (%) 0.90 (0.86–0.94) < 0.001 0.94 (0.89–0.99) 0.020#, * Hb (g/L) 0.98 (0.97–0.99) < 0.001 HbA1c (%) 1.16 (1.07–1.26) < 0.001 1.16 (1.05–1.28) < 0.001#, * BMI (kg/m²) 0.98 (0.92–1.04) 0.542 UACR (mg/g) < 30 30−300 3.55 (1.99–6.34) < 0.001 2.81 (1.53–5.15) < 0.001#, * ≥ 300 21.77 (11.83–40.04) < 0.001 11.69 (5.67–24.09) < 0.001#, * CVD No Reference Yes 1.70 (0.71–4.04) 0.231 Hypertension No Reference Yes 0.96 (0.59–1.56) 0.873 Hypoglycemic therapy No Reference Reference Oral drugs 1.77 (0.24–13.32) 0.582 2.59 (0.29–22.88) 0.392 Insulin 3.85 (0.42–35.18) 0.231 3.75 (0.34–40.95) 0.281 Oral drugs and insulin 7.75 (1.06–56.87) 0.043 7.83 (0.92–66.61) 0.062# # represents variables with p < 0.10 in the MRL that were used to construct Model 1, including duration, SBP, eGFR, UA, HCT, HbA1c, UACR, and hypoglycemic therapy. * represents variables with p < 0.05 in the MRL that were used to construct Model 2, including duration, HCT, HbA1c, and UA. Bold values indicate key outcome-related indicators. Table 2.
Univariate and multivariable logistic regression analyses for risk of VTDR in the development cohort.
Figures
(3)
Tables
(2)