-
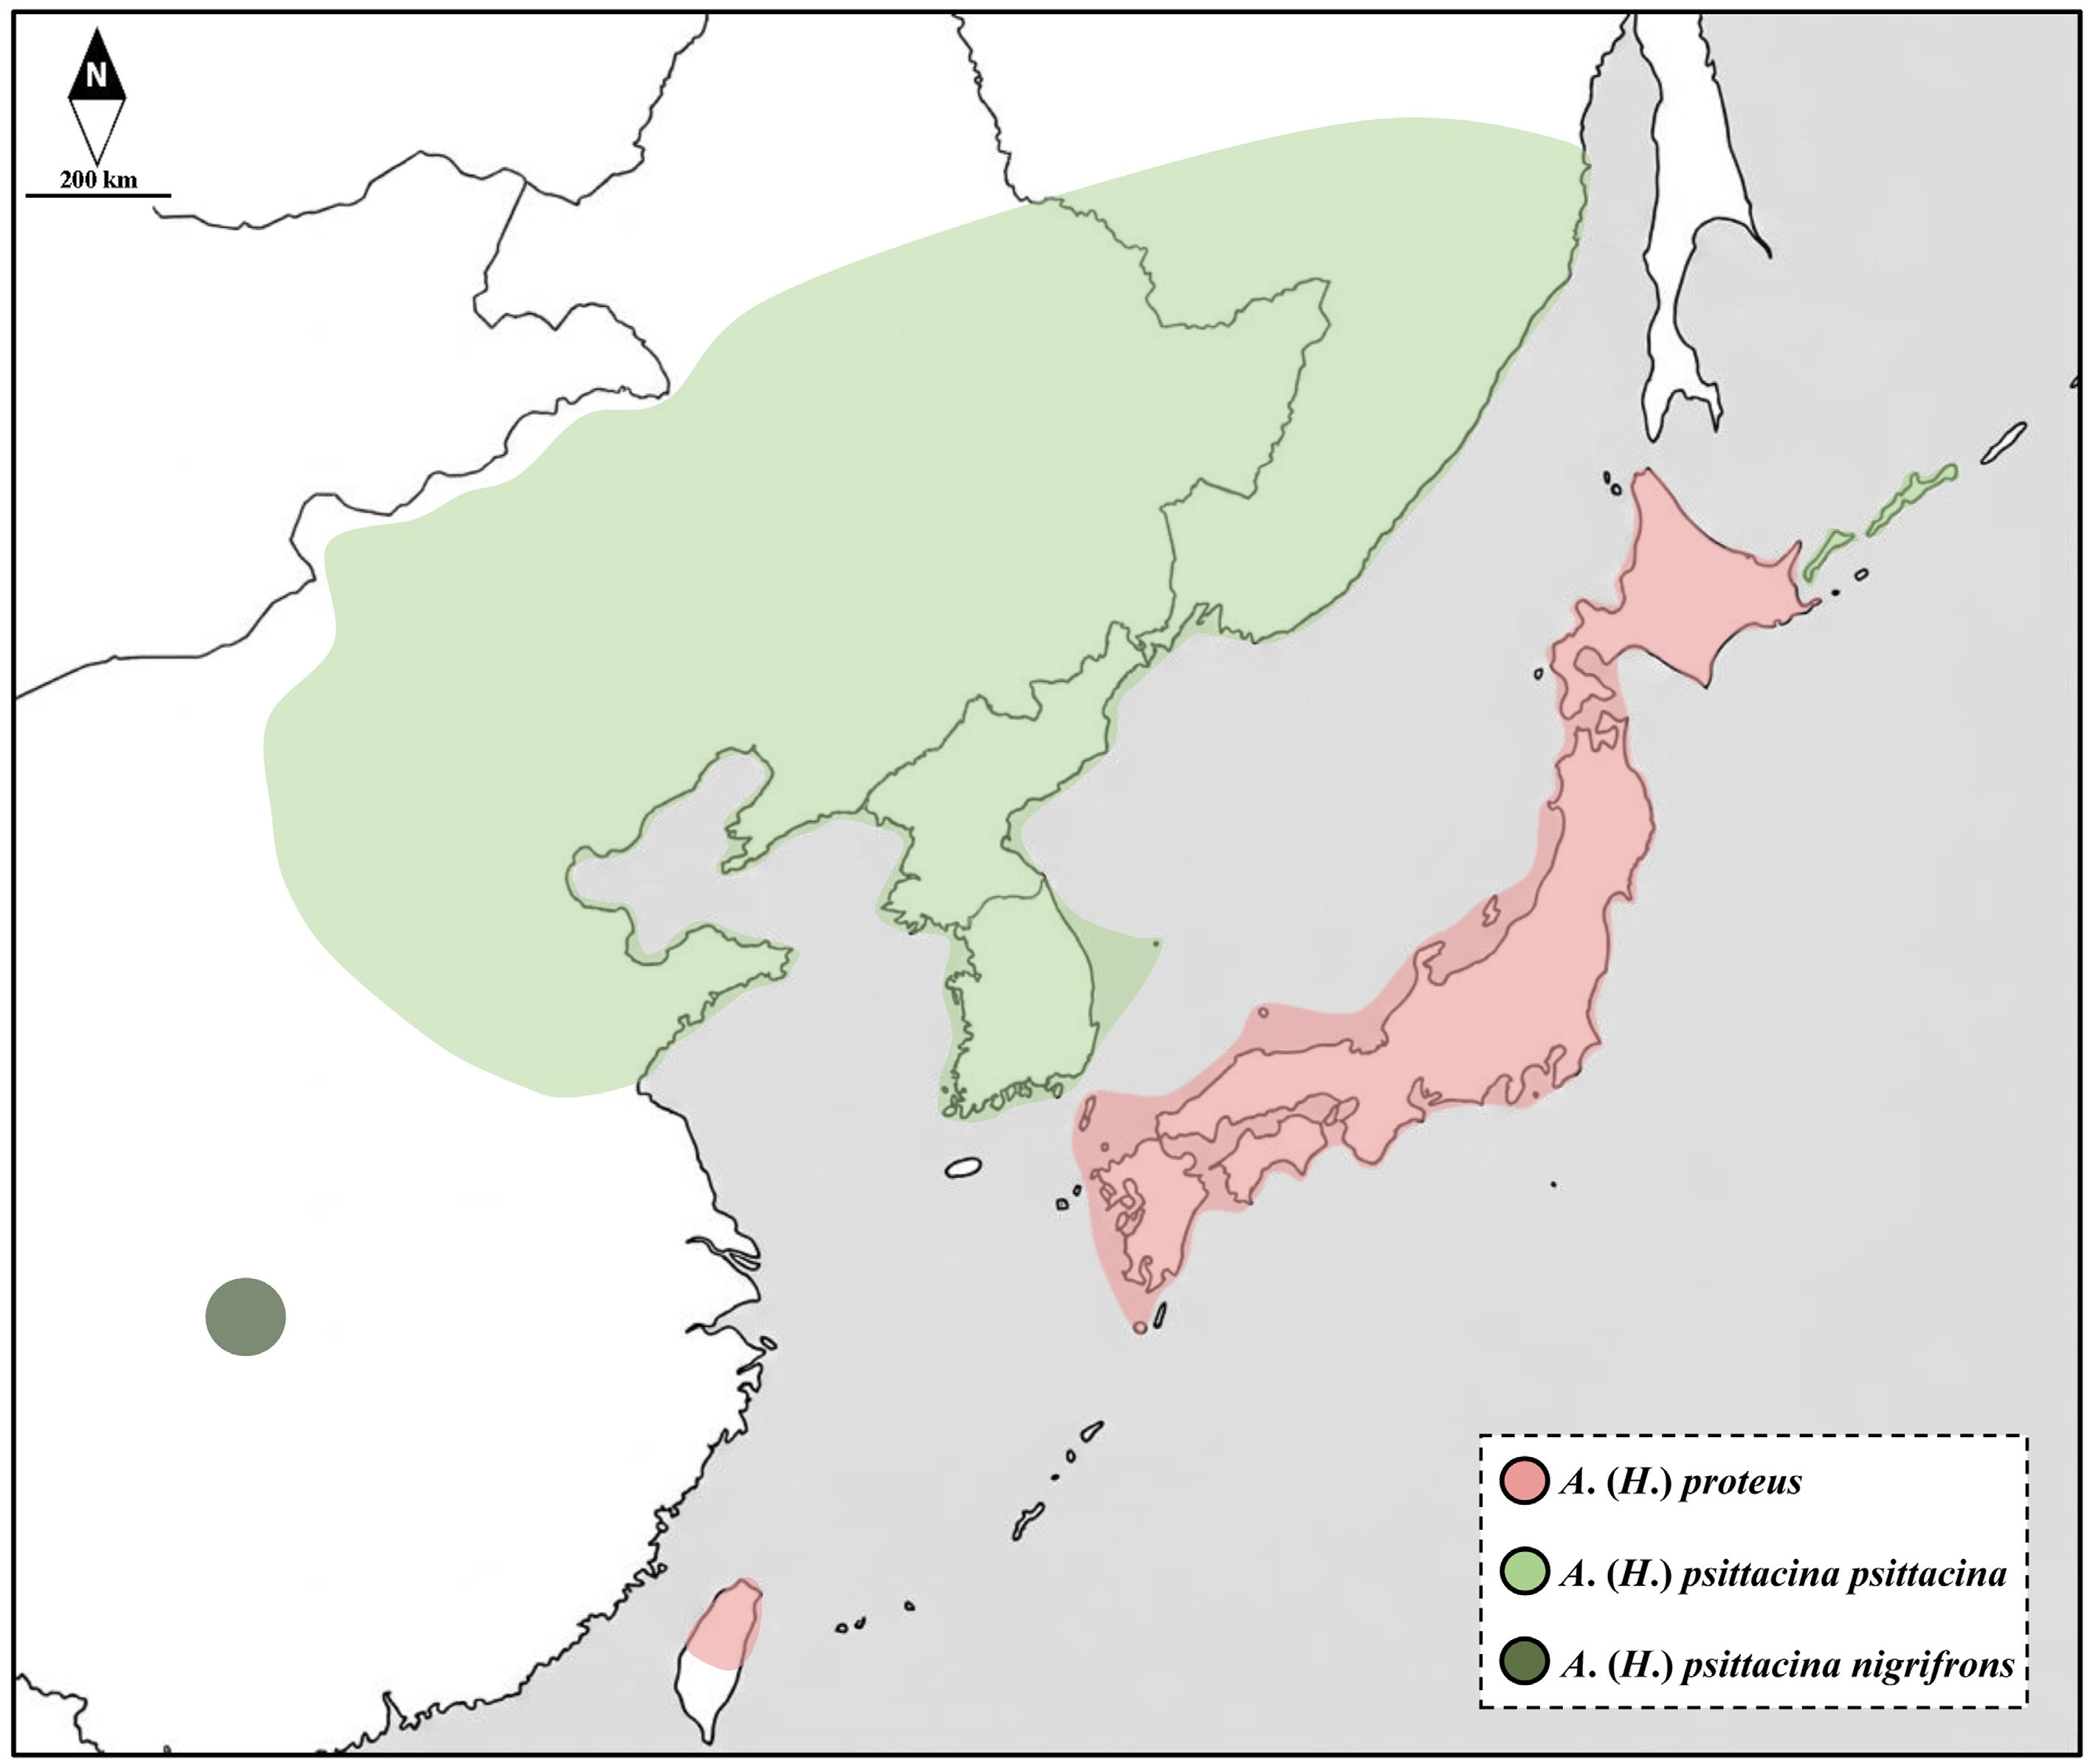
Figure 1.
Distribution map of Anthaxia proteus and A. psittacina. The map was taken from Snazzy Maps (
https://snazzymaps.com ) and edited using Adobe Photoshop 21.2.0 (Adobe Systems Inc.). -
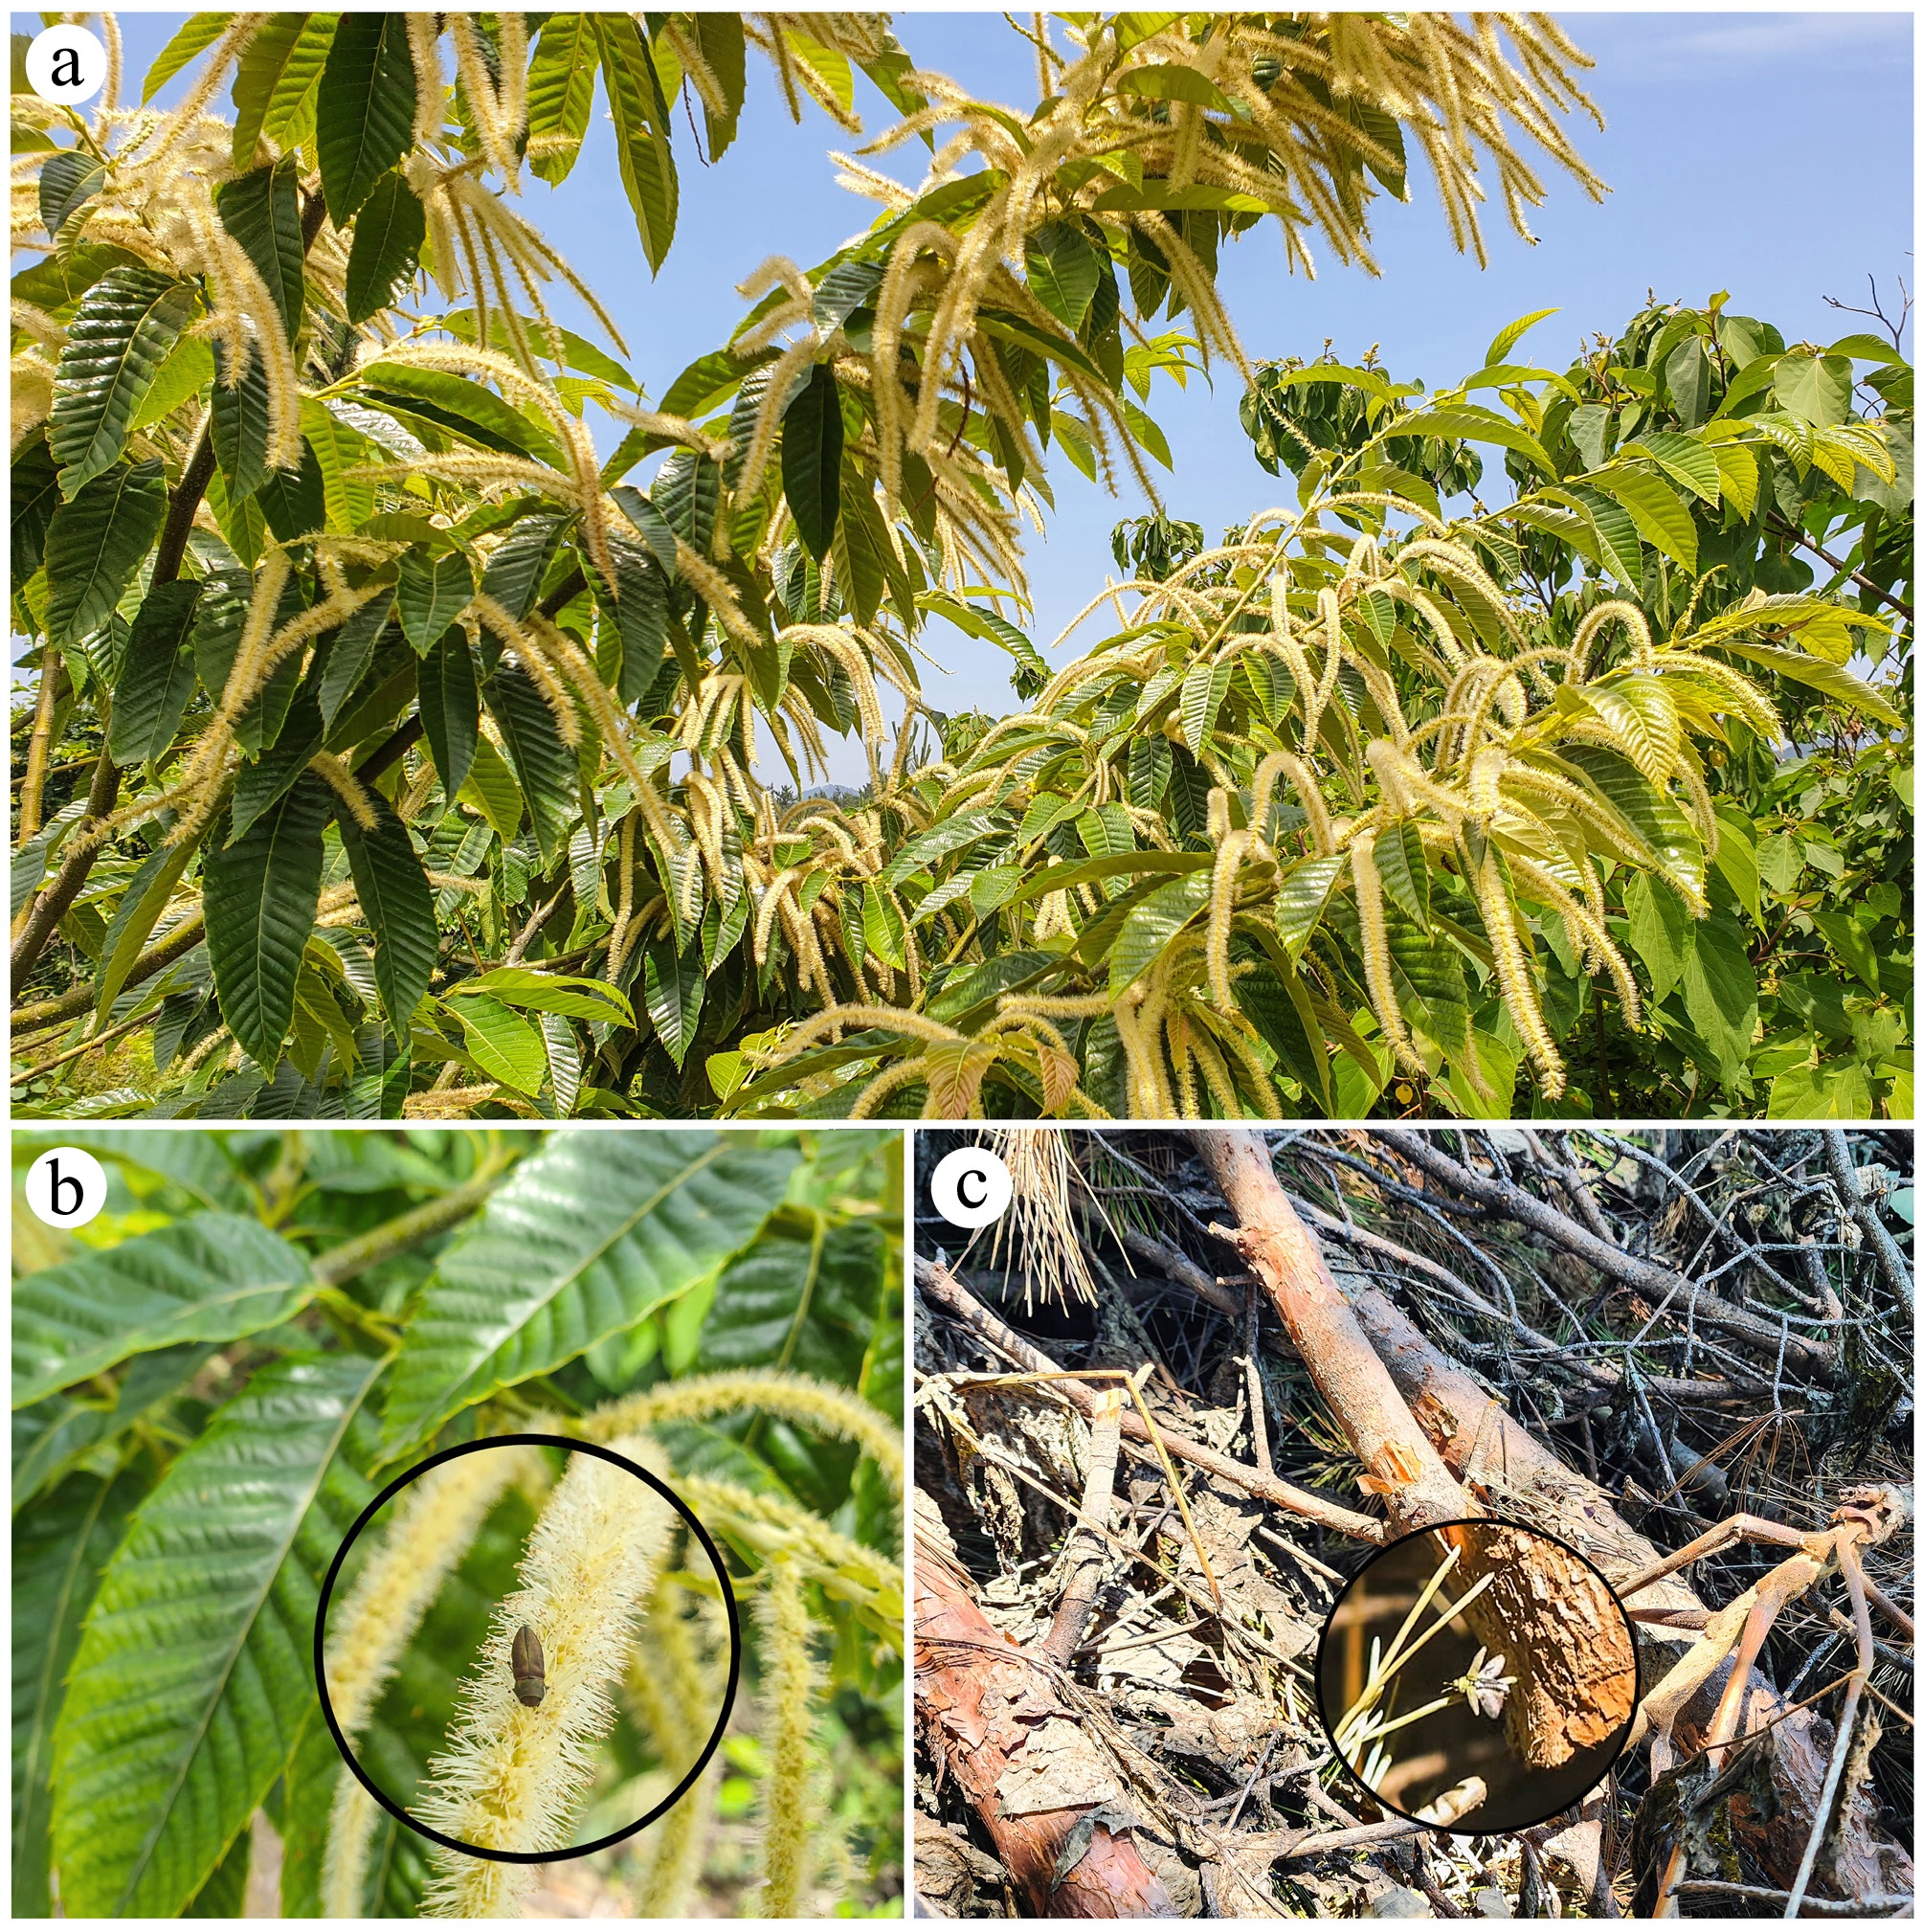
Figure 2.
Ecology of Anthaxia proteus: (a) Habitat. (b) Adult on flowers of Castanea (Fagaceae). (c) Female adult flying to pine branches for oviposition.
-
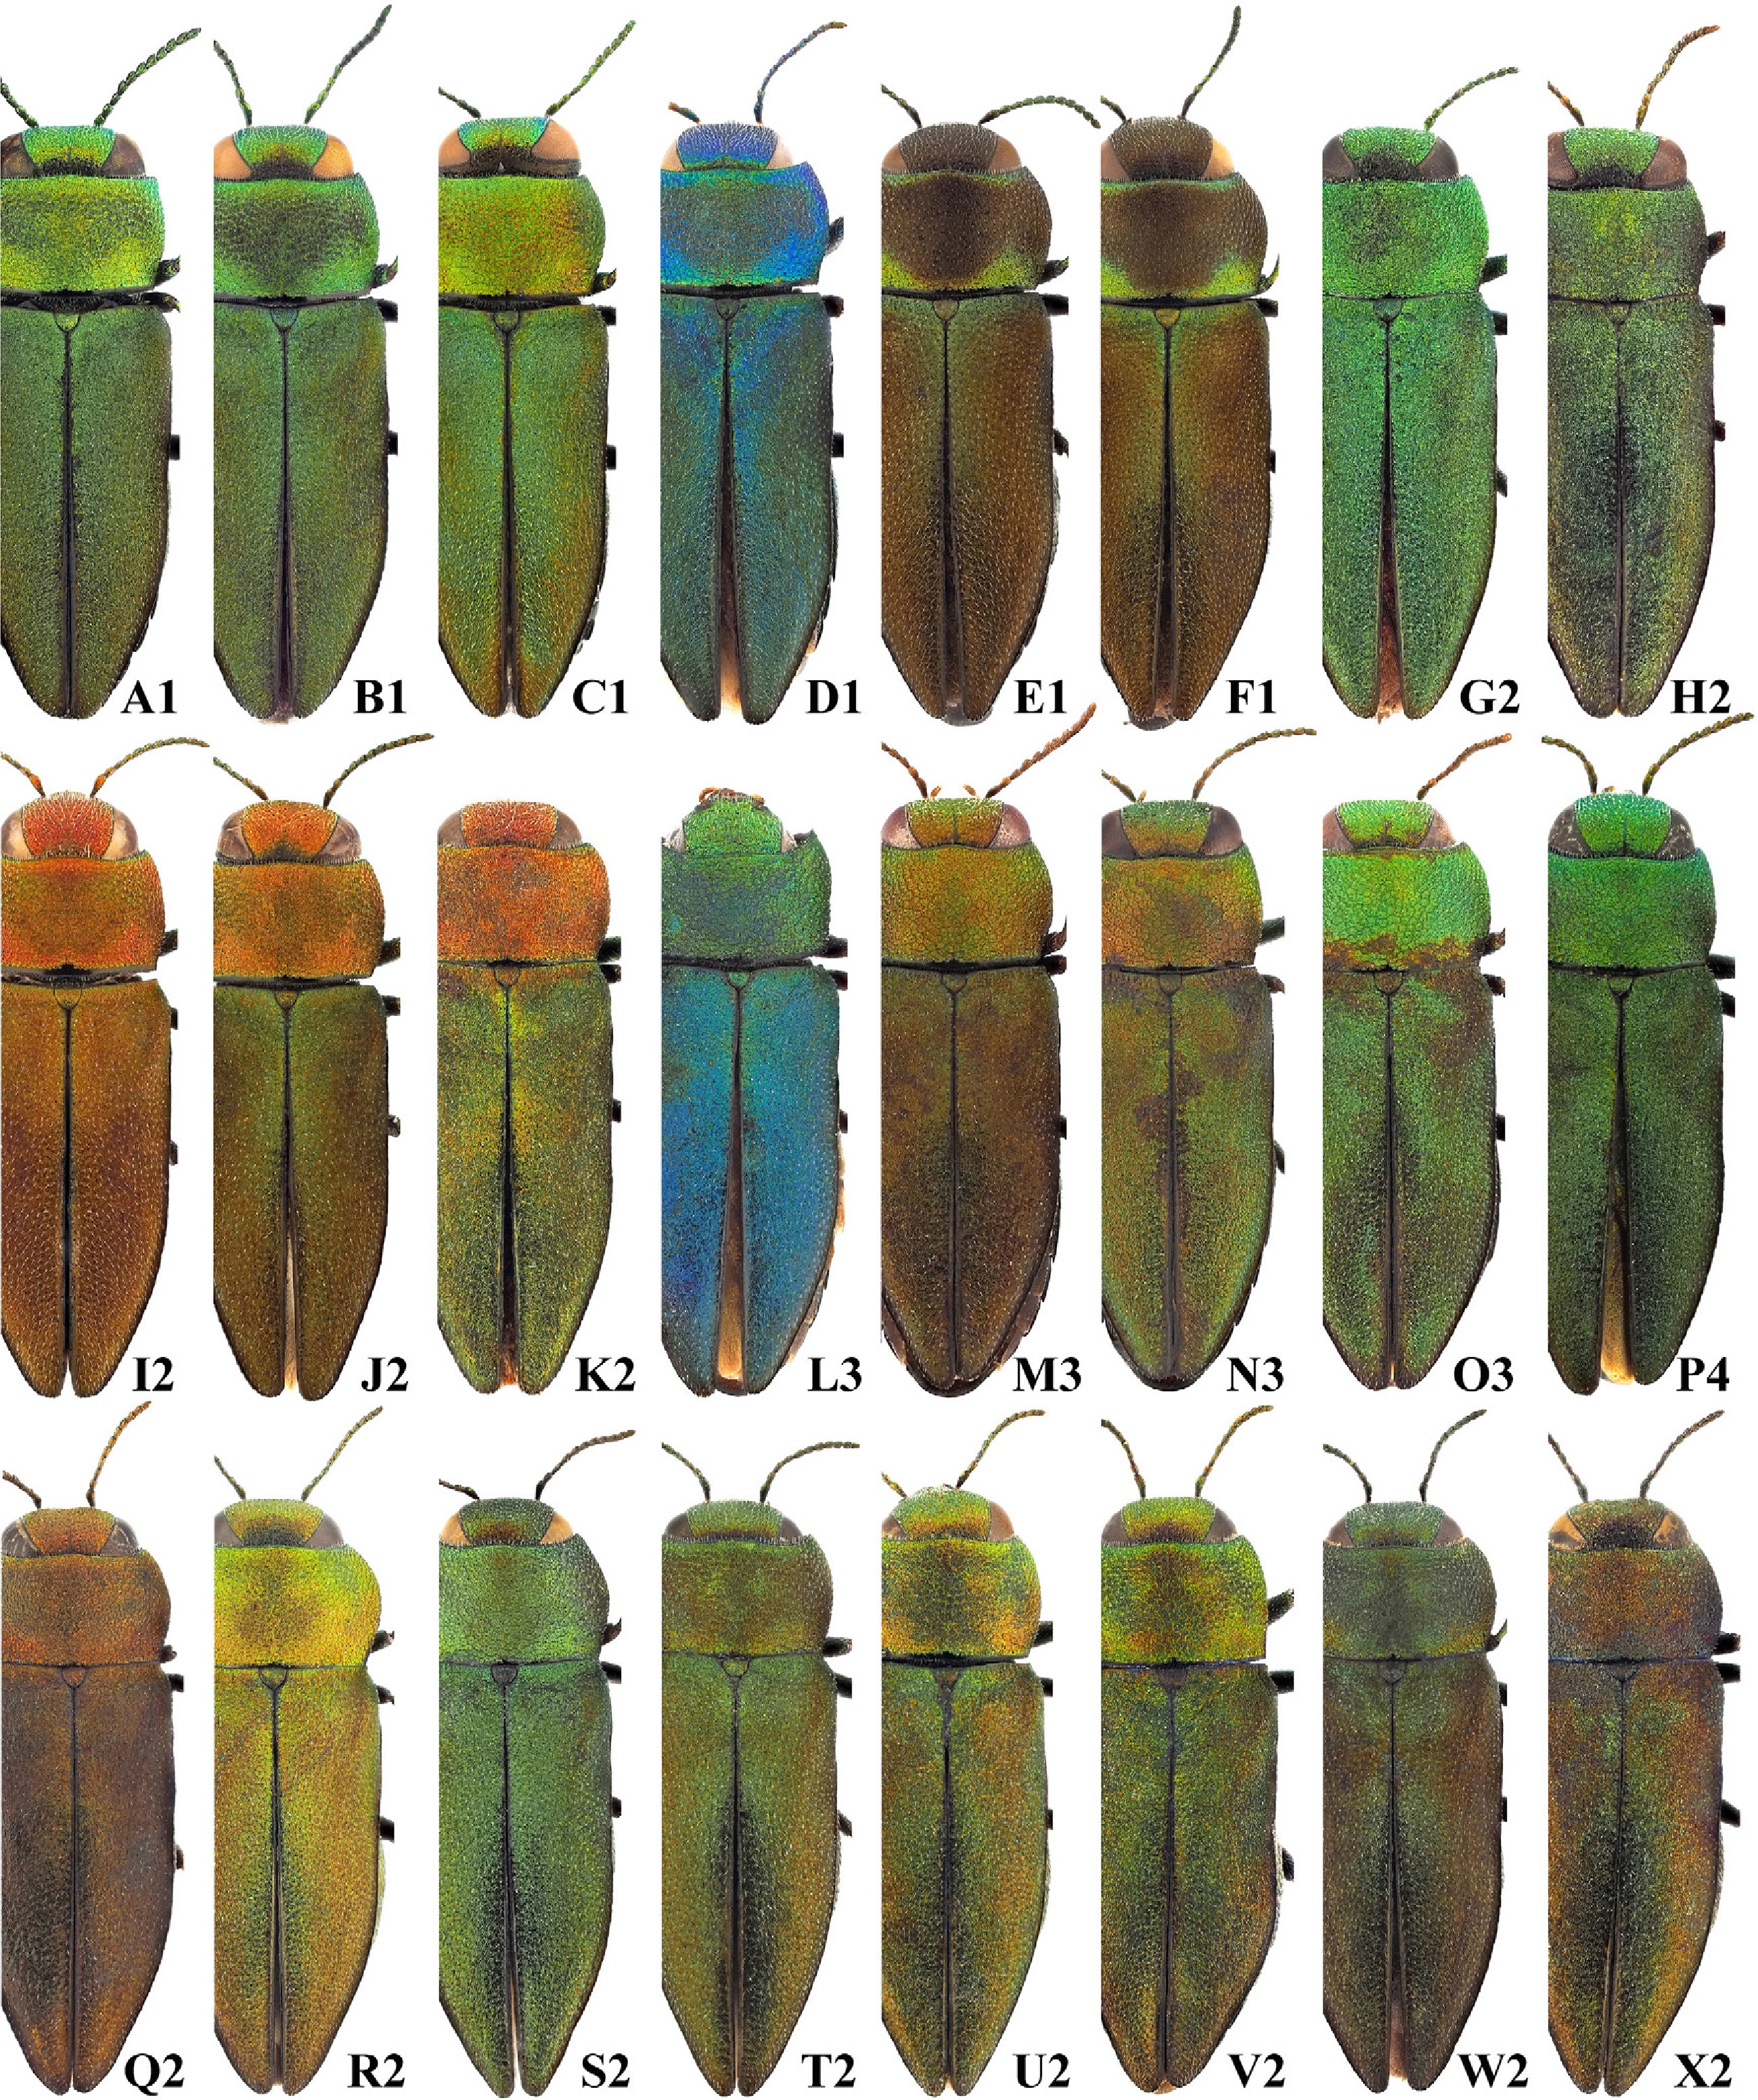
Figure 3.
Morphological variations of A. proteus and A. psittacina (dorsal view of habitus). (A)–(F) A. proteus. (A)–(D) Males. (E), (F) Females. (G)–(X) A. psittacina. (G)–(P) Males. (Q)–(X) Females. Numbers refer to collection localities: 1. Japan; 2. Korea; 3. China; 4. Russia.
-
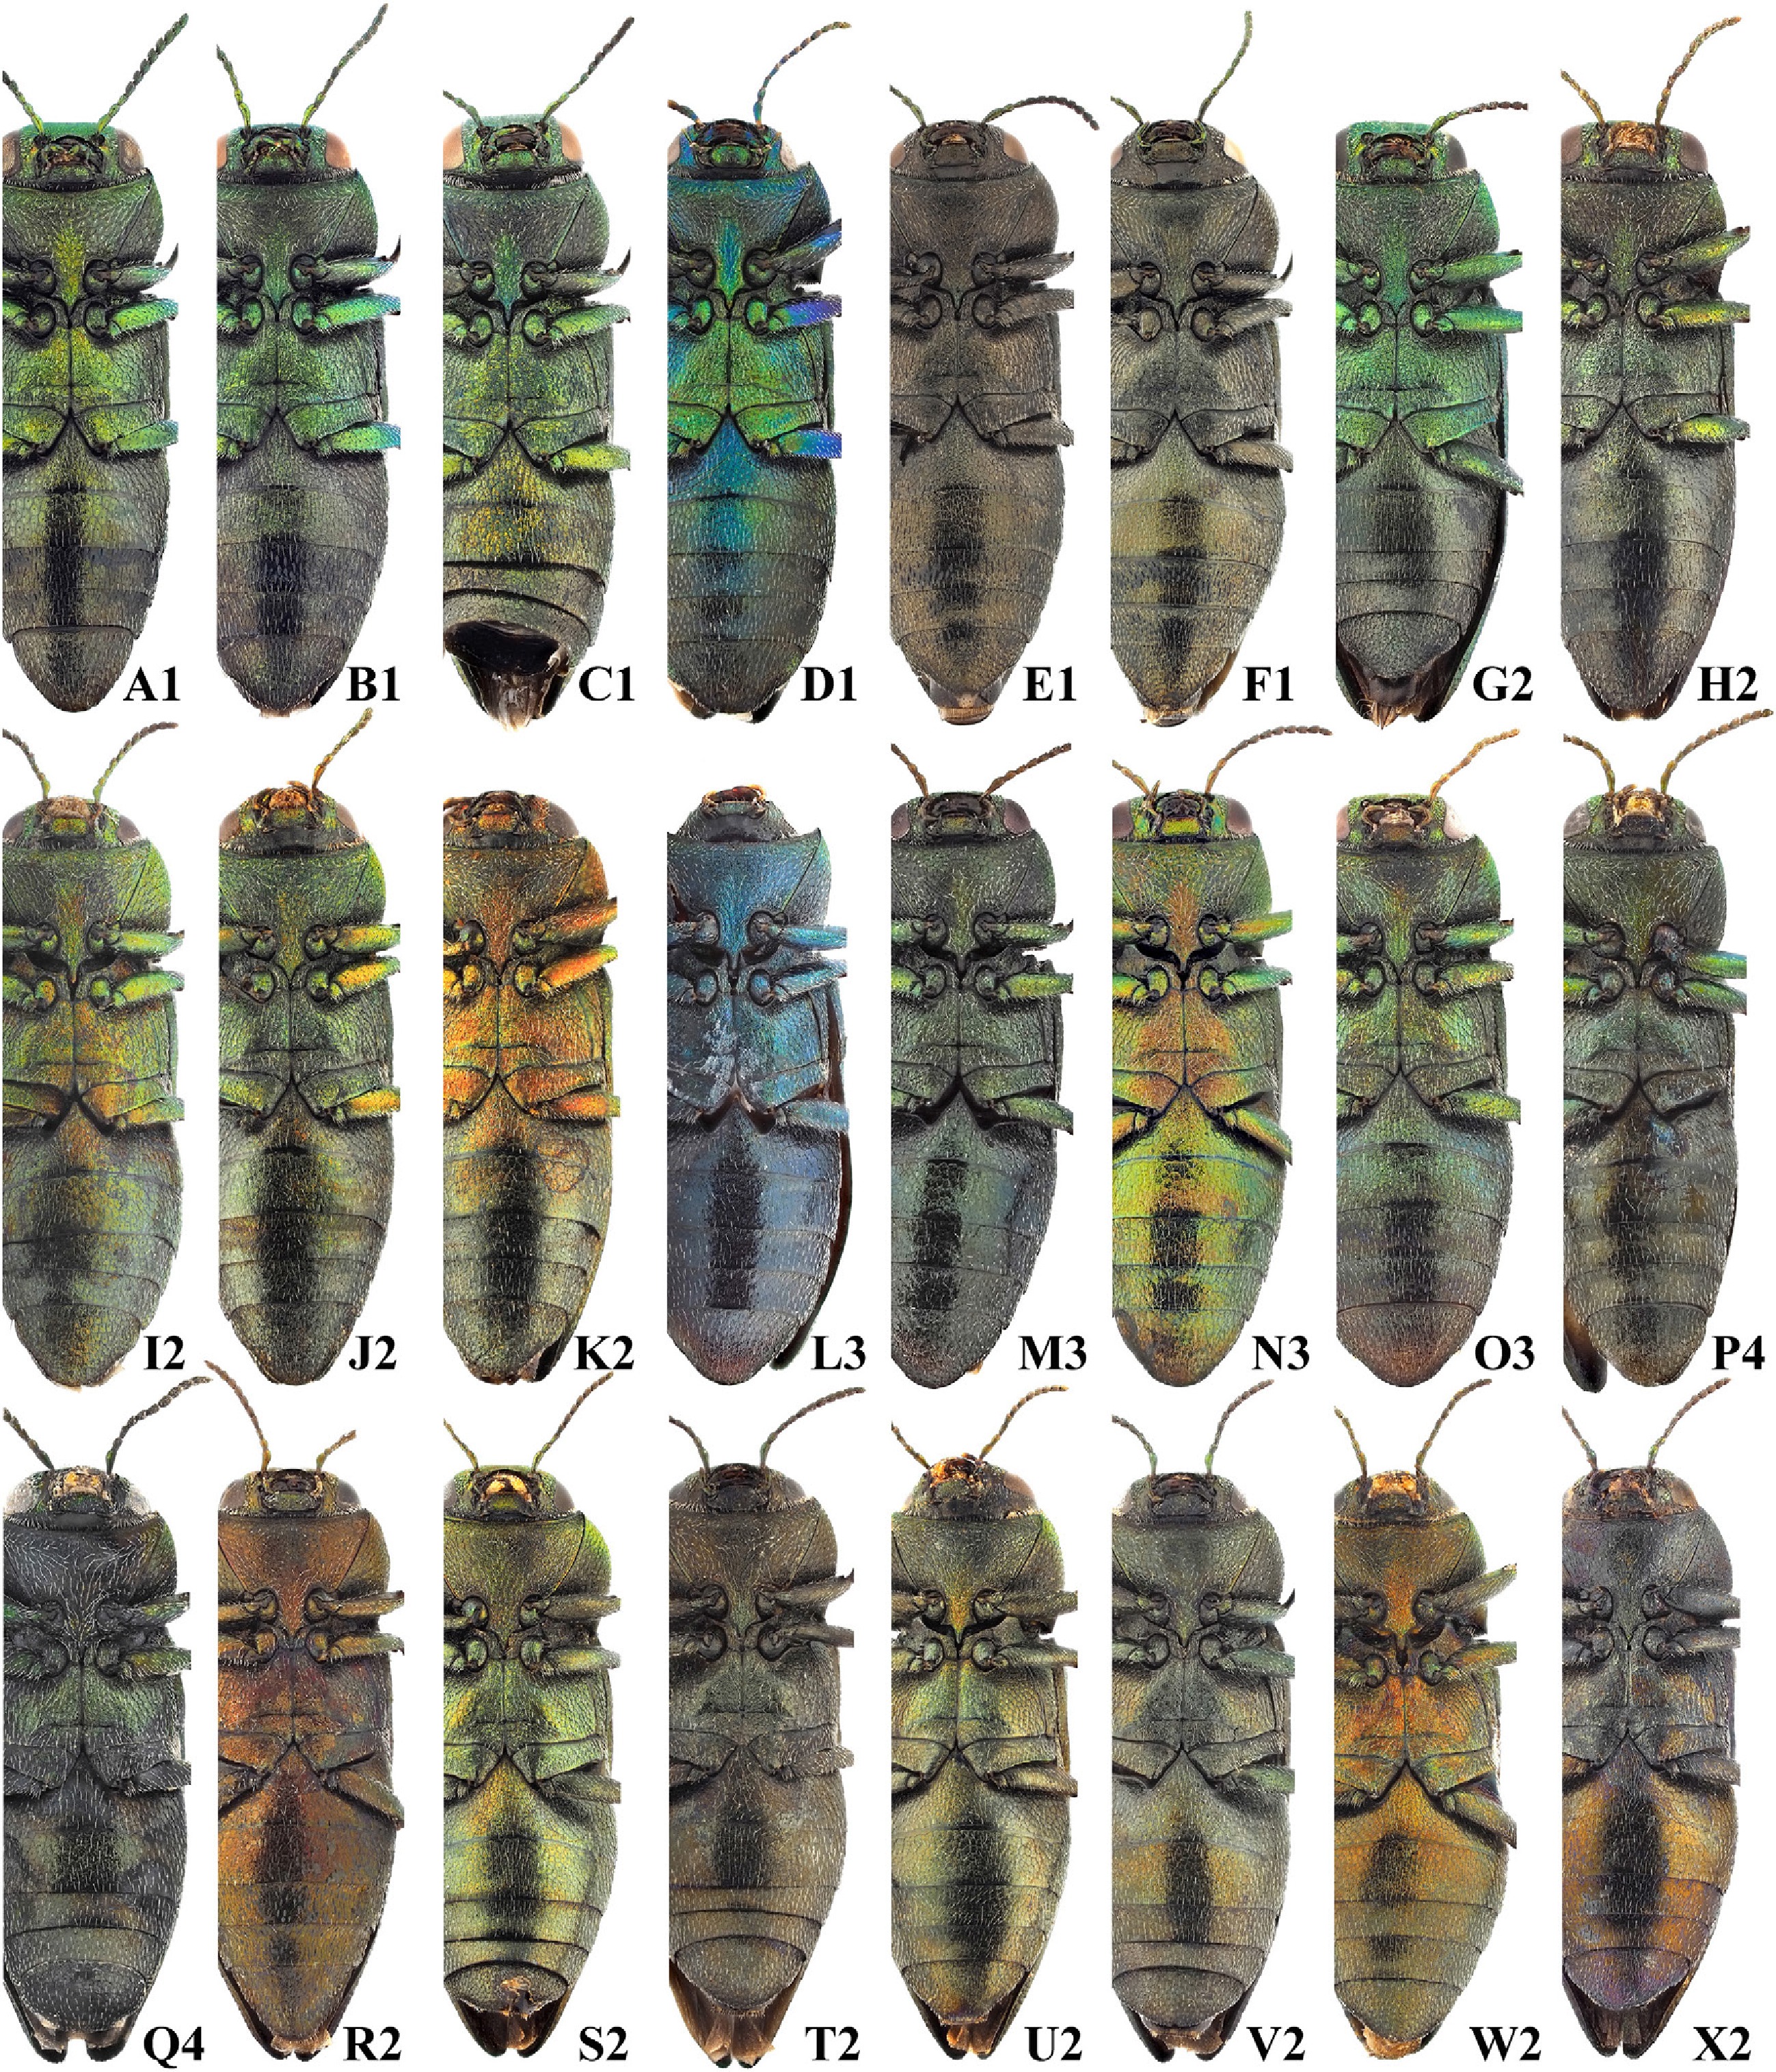
Figure 4.
Morphological variations of A. proteus and A. psittacina (ventral view of habitus). (A)–(F) A. proteus. (A)–(D) males. (E), (F) Females. (G)–(X) A. psittacina. (G)–(Q) Males. (R)–(X) Females. Numbers refer to collection localities: 1. Japan; 2. Korea; 3. China; 4. Russia.
-
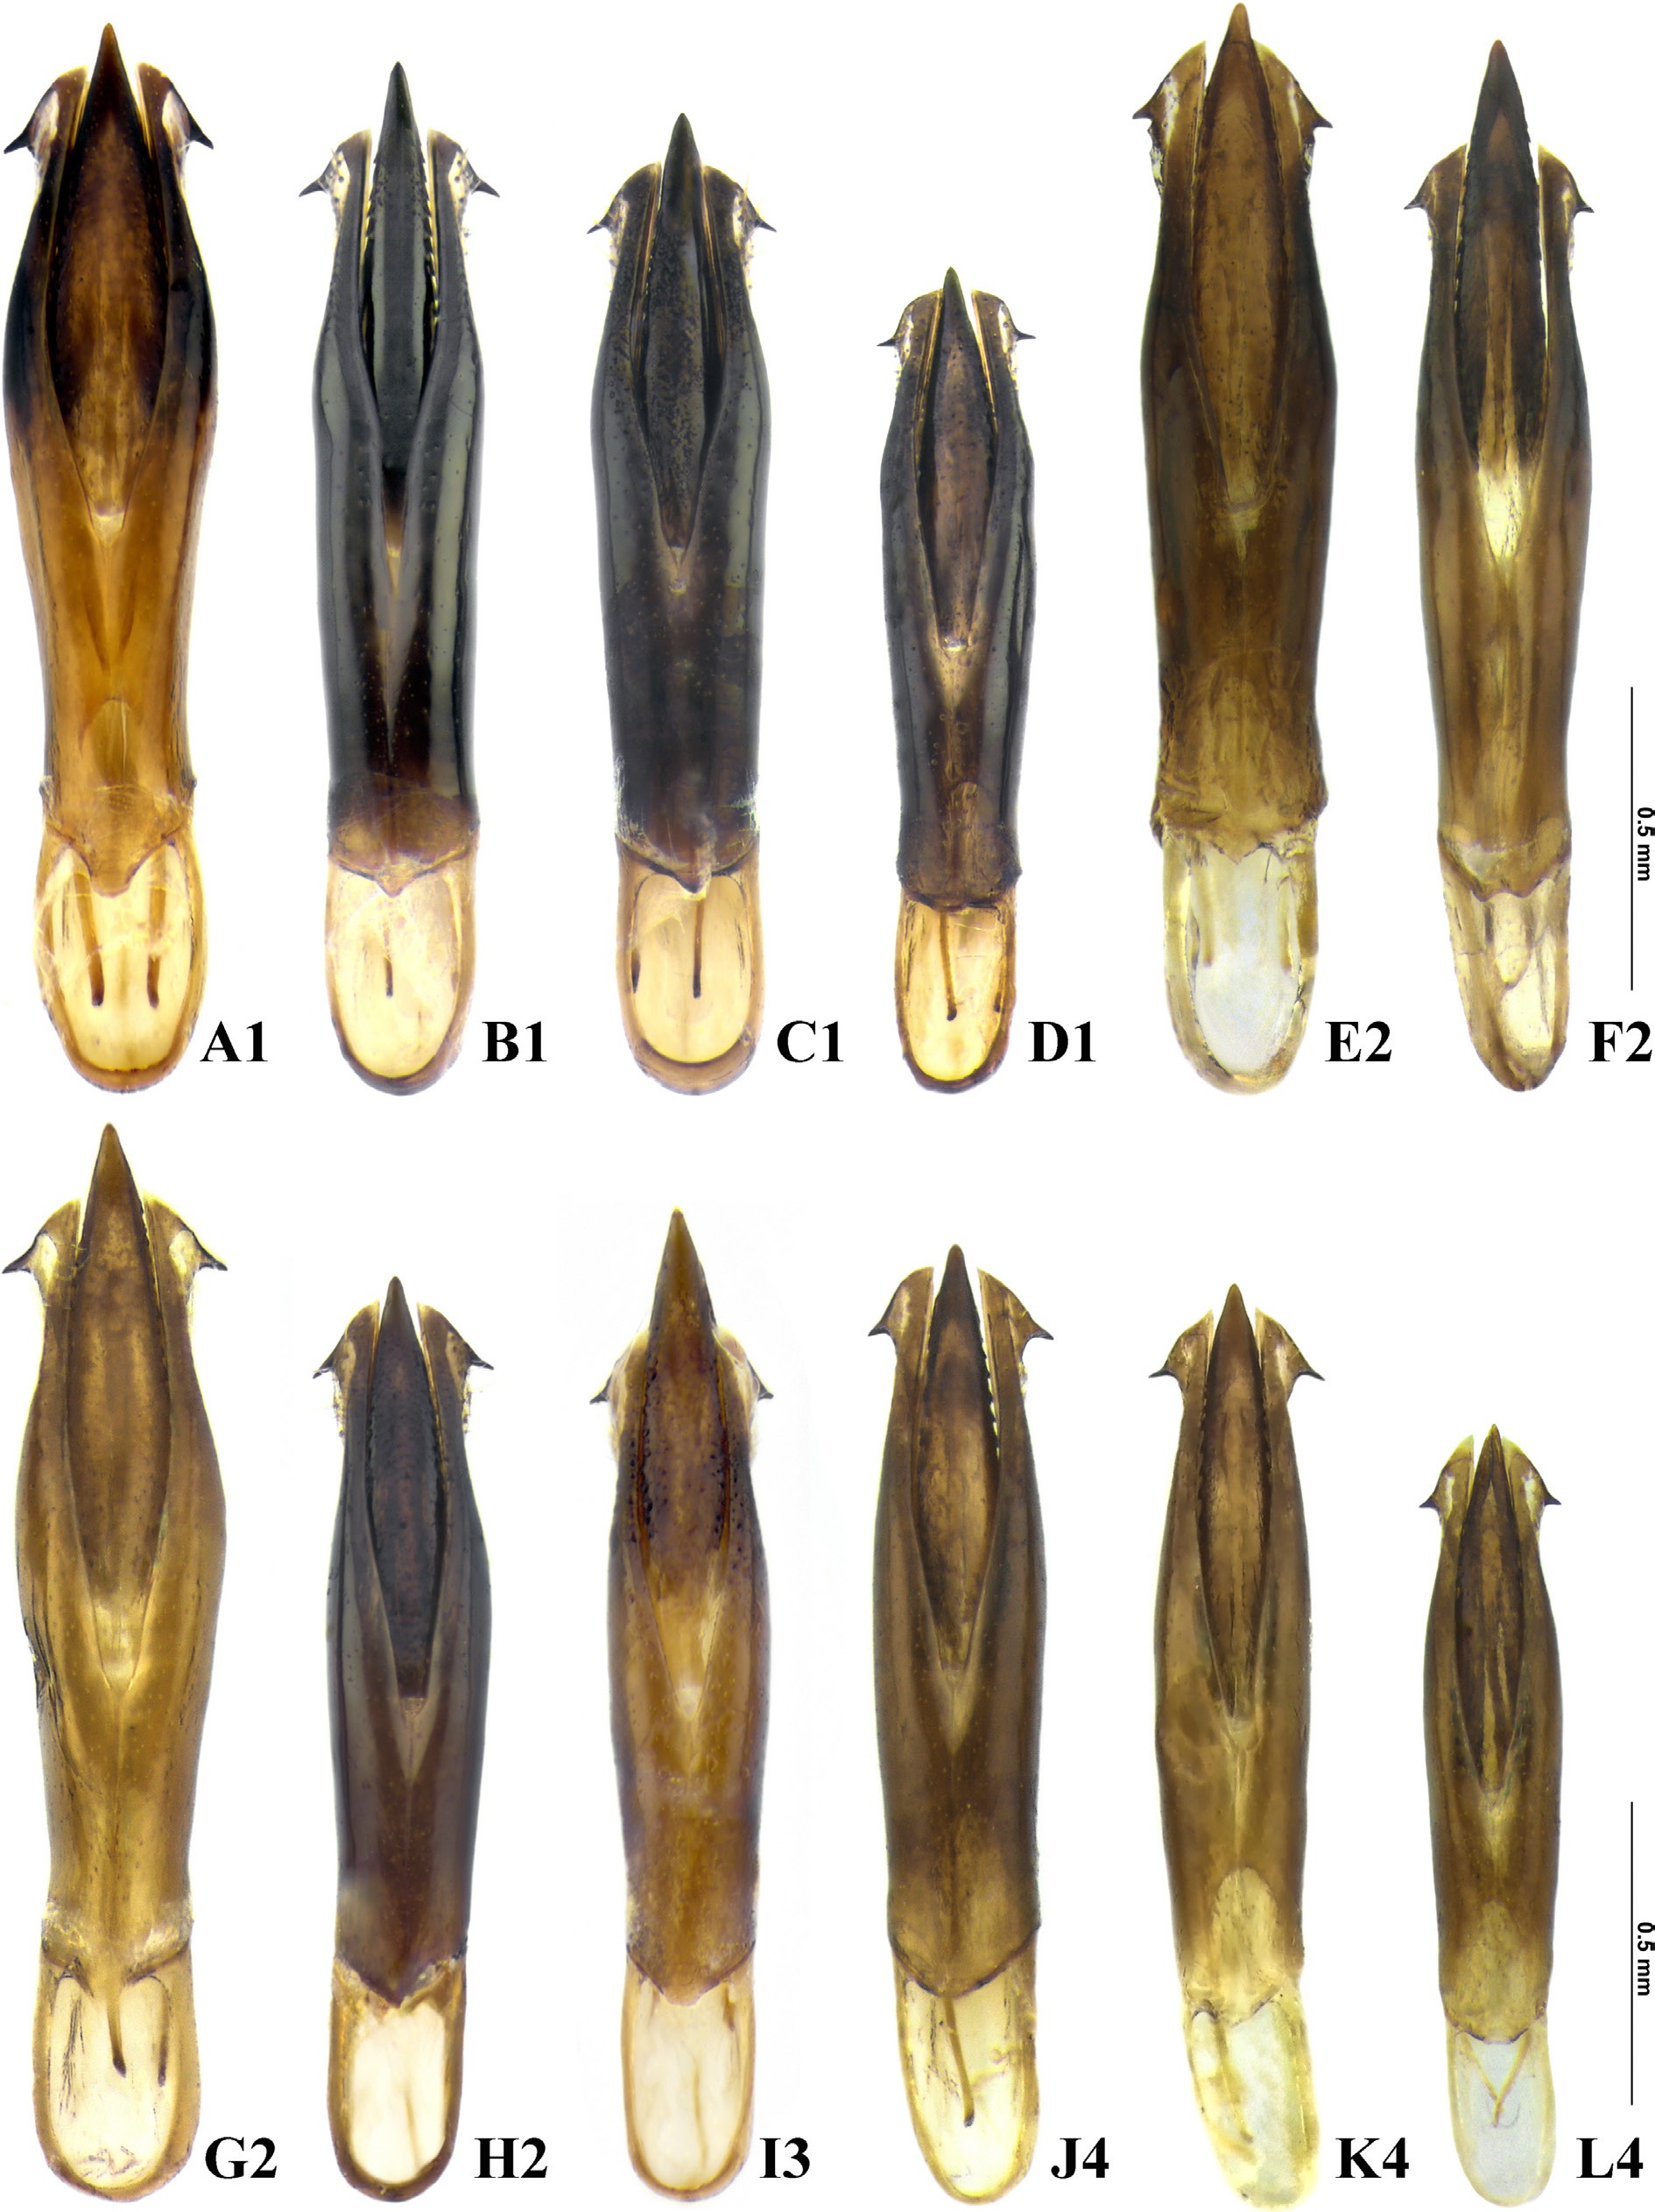
Figure 5.
Morphological variations of A. proteus and A. psittacina (male genitalia). (A)–(D) A. proteus. (E)–(L) A. psittacina. Numbers refer to collection localities: 1. Japan; 2. Korea; 3. China; 4. Russia.
-
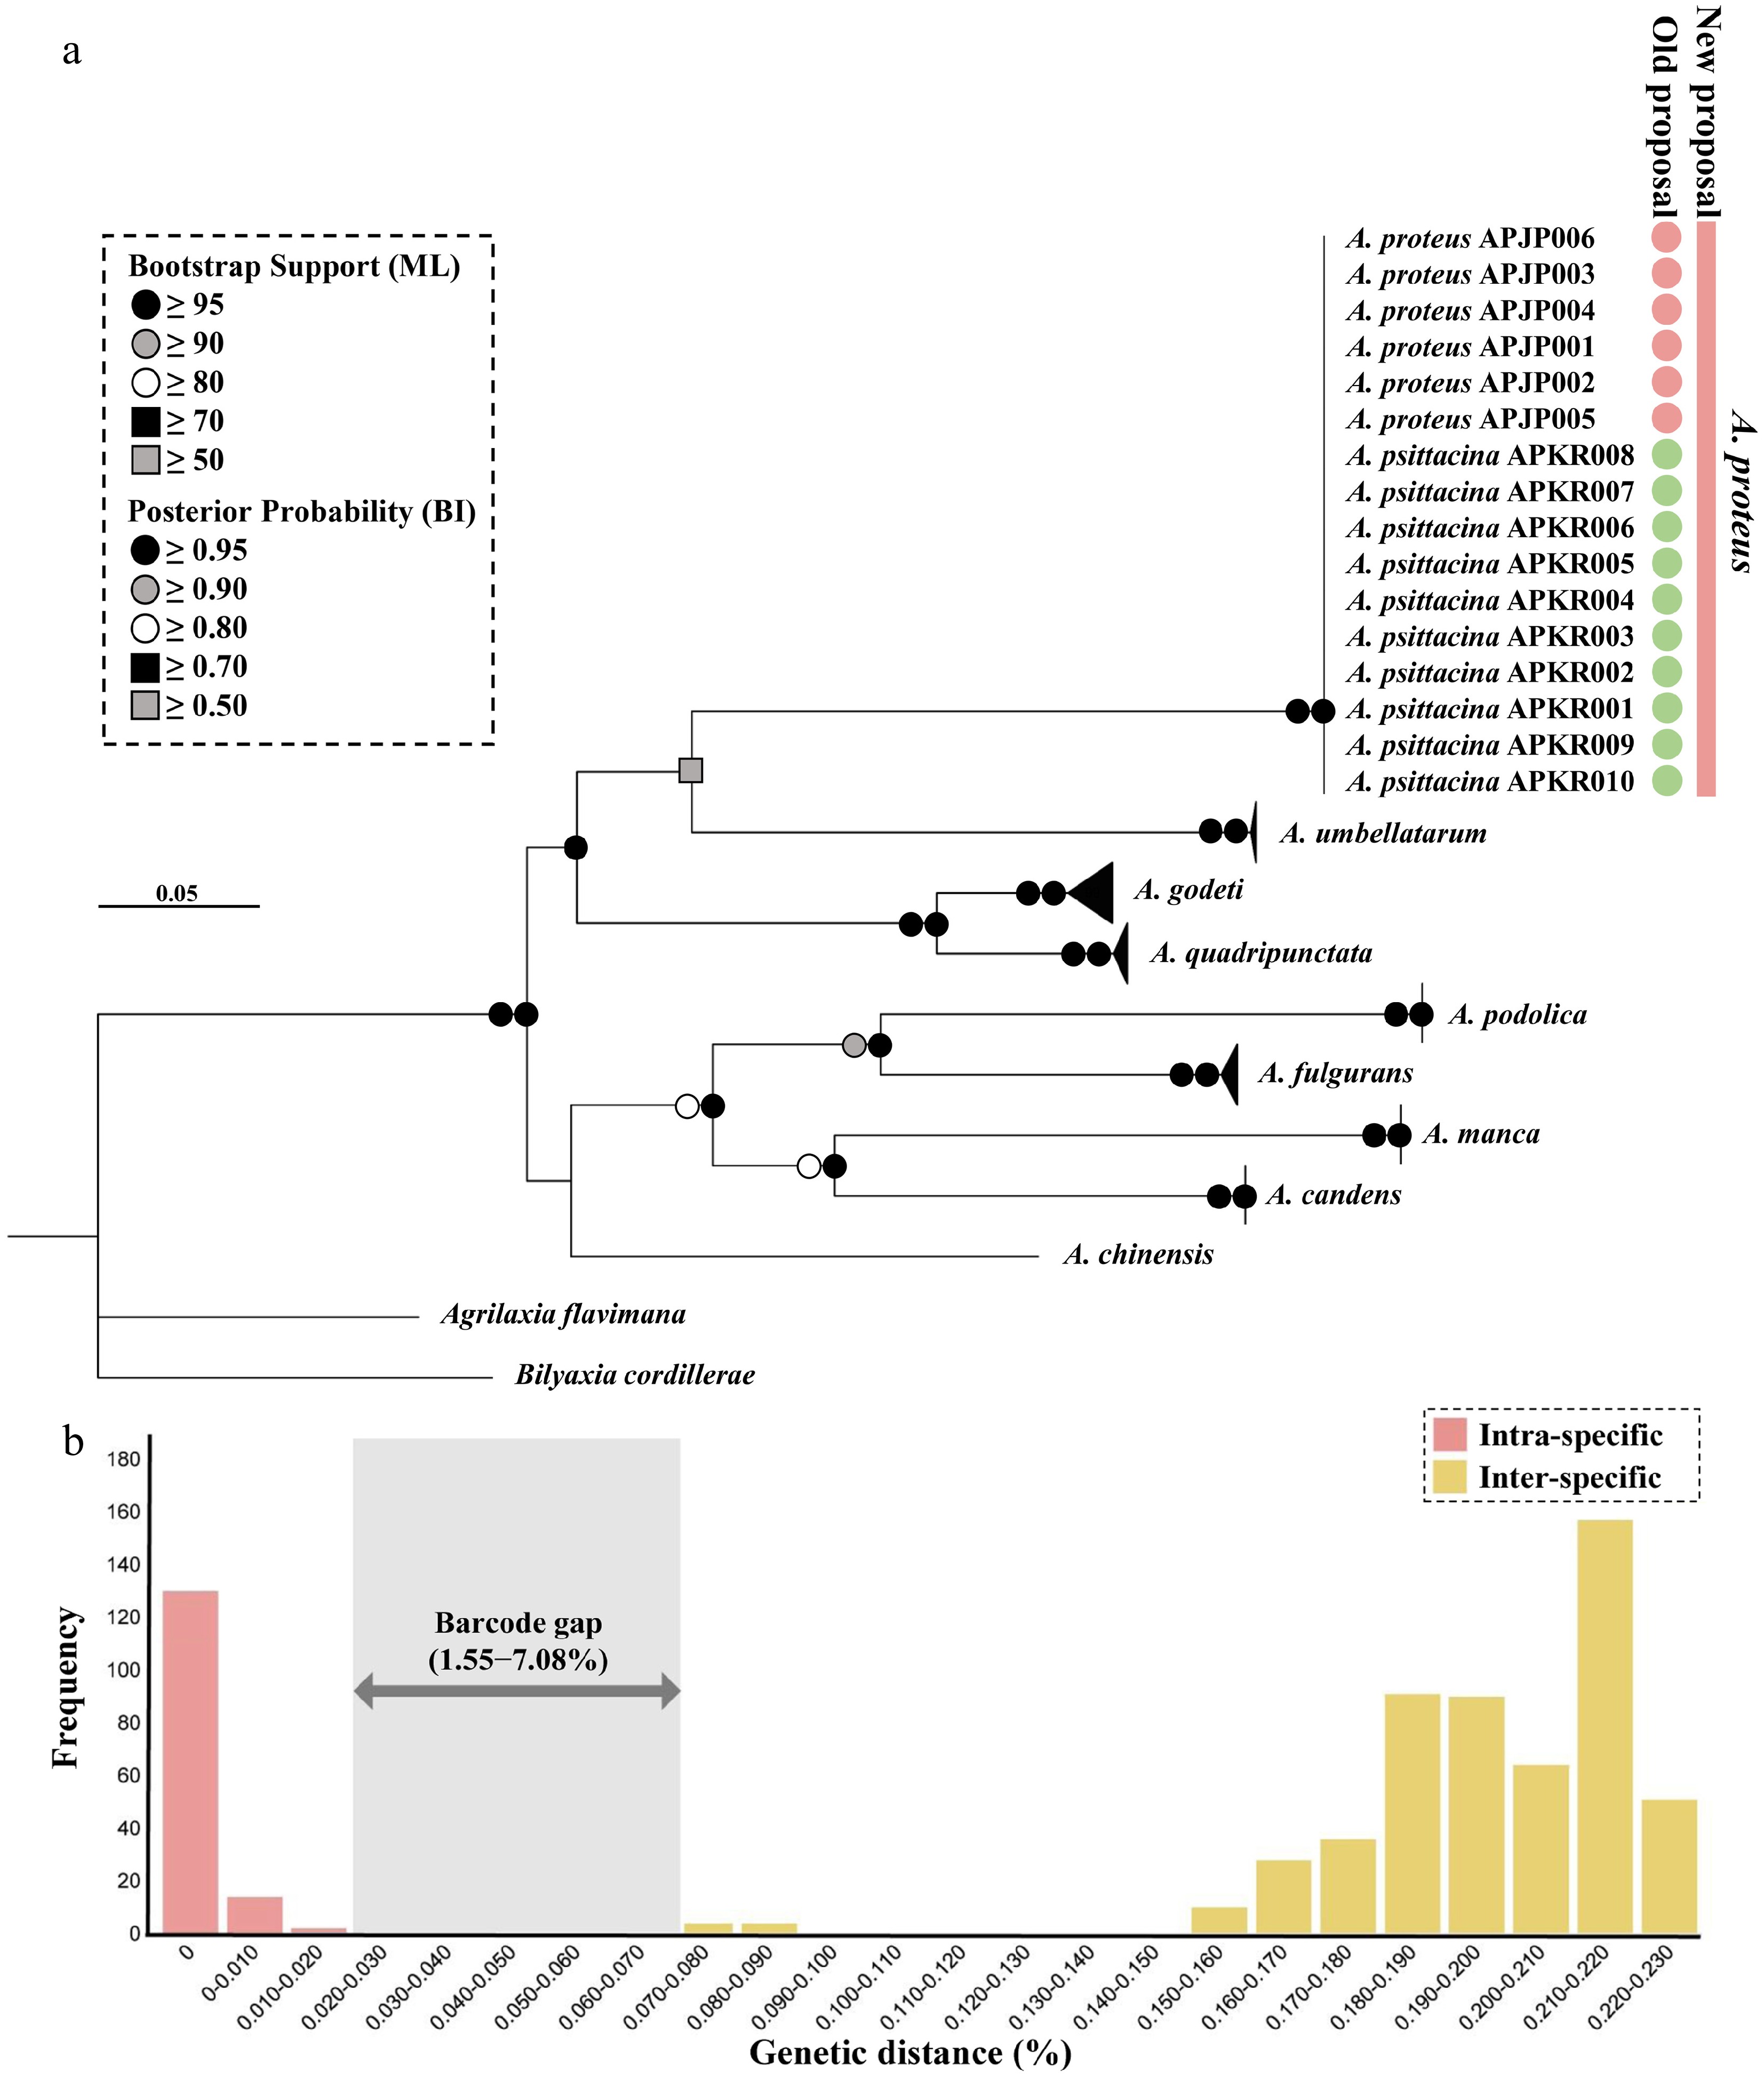
Figure 6.
Phylogenetic relationships and genetic distance distribution of Anthaxia species based on COI: (a) Maximum likelihood (ML) tree topology inferred from the COI. Support values are indicated by symbols at each node: the left side represents Bootstrap support (ML) and the right side represents Posterior Probability (BI). Only support values ≥ 50% (ML) or ≥ 0.50 (BI) are shown. Black circles indicate high support (ML ≥ 95%; BI ≥ 0.95), with other symbols following the thresholds defined in the legend box; (b) Distribution of intra- and inter-specific genetic distances (K2P) based on the COI barcoding region. The red bars represent intra-specific variation, while the yellow bars represent inter-specific distances. A distinct barcode gap (1.55%–7.08%) is highlighted by the gray shaded area.
-
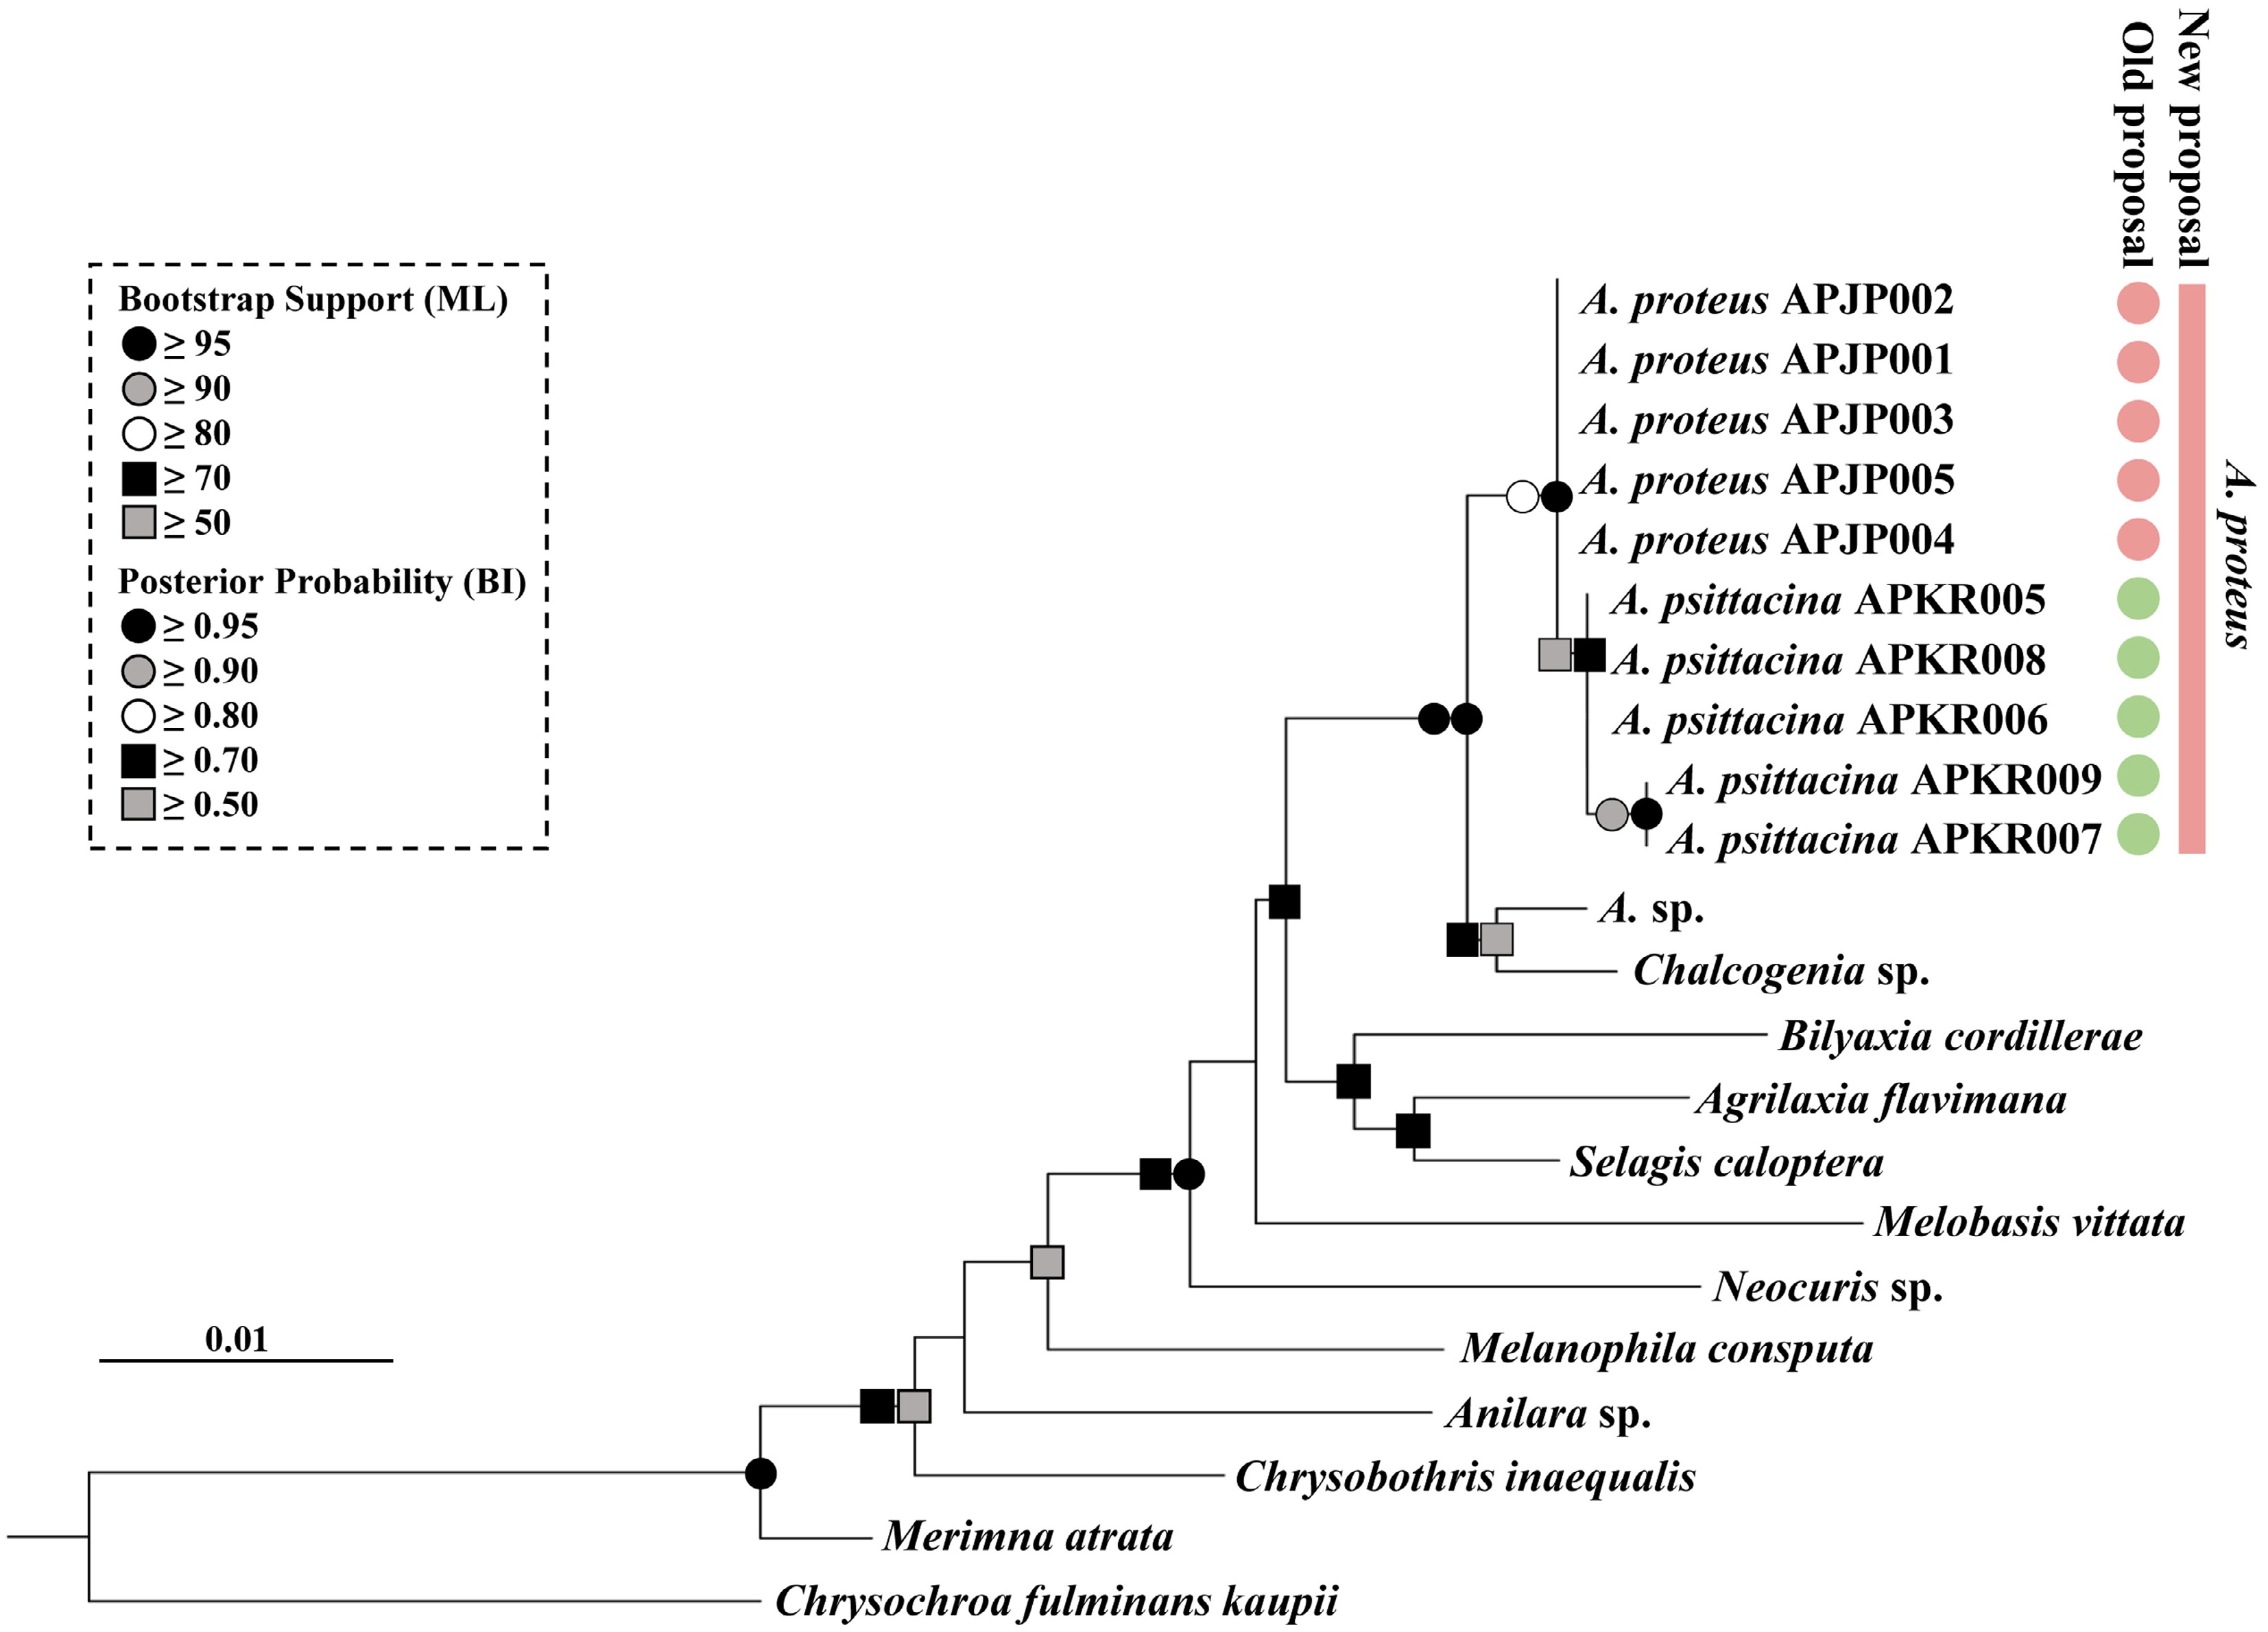
Figure 7.
Phylogenetic relationships of Anthaxia species based on 28S rDNA. Bayesian inference (BI) phylogram inferred from the 28S rDNA dataset. Support values are indicated by symbols at each node: the left side represents Bootstrap support (ML) and the right side represents Posterior Probability (BI). Only support values ≥ 50% (ML) or ≥ 0.50 (BI) are shown. Black circles indicate high support (ML ≥ 95%; BI ≥ 0.95), while other symbols correspond to the thresholds defined in the legend box.
-
Character A. proteus A. psittacina A. psittacina nigrifrons Coloration Sexual dichromatism well developed: male golden green to blue-green, often darker centrally on pronotum; female head black, pronotum black with blue-green margins, elytra green-brown with narrow green basal and sutural stripes; ventral side black Sexual dichromatism usually undeveloped: both sexes golden-green to brown-green with green frons; exceptionally female entirely brown or almost black Sexual dichromatism developed: male frons blue-green, vertex black; female head entirely black; pronotum black with blue-green anterior and lateral margins; elytra black-green in both sexes Head Frons distinctly convex and depressed medially Frons less convex Frons almost flat with very indistinct medial depression Pronotum More enlarged anteriorly, widest at anterior half; lateral pronotal margins regularly rounded or moderately angulated, often slightly incurved before posterior angles; pronotal spot absent Less enlarged anteriorly, widest at midlength; lateral pronotal margins regularly rounded and distinctly incurved before posterior angles; pronotal spot absent Less enlarged anteriorly; lateral pronotal margins more distinctly incurved before posterior angles than nominotypical subspecies; pronotal spot present in both sexes Elytra More acuminate apically; lateral margins straight before apex or slightly caudiform Less acuminate apically; lateral margins slightly rounded before apex More slender than nominotypical subspecies Aedeagus Shorter; parameres more enlarged laterally Longer; parameres more slender Slightly different from nominotypical subspecies Table 1.
Diagnostic characters for A. proteus, A. psittacina, and A. psittacina nigrifrons based on Bílý & Svoboda[3].
Figures
(7)
Tables
(1)