-
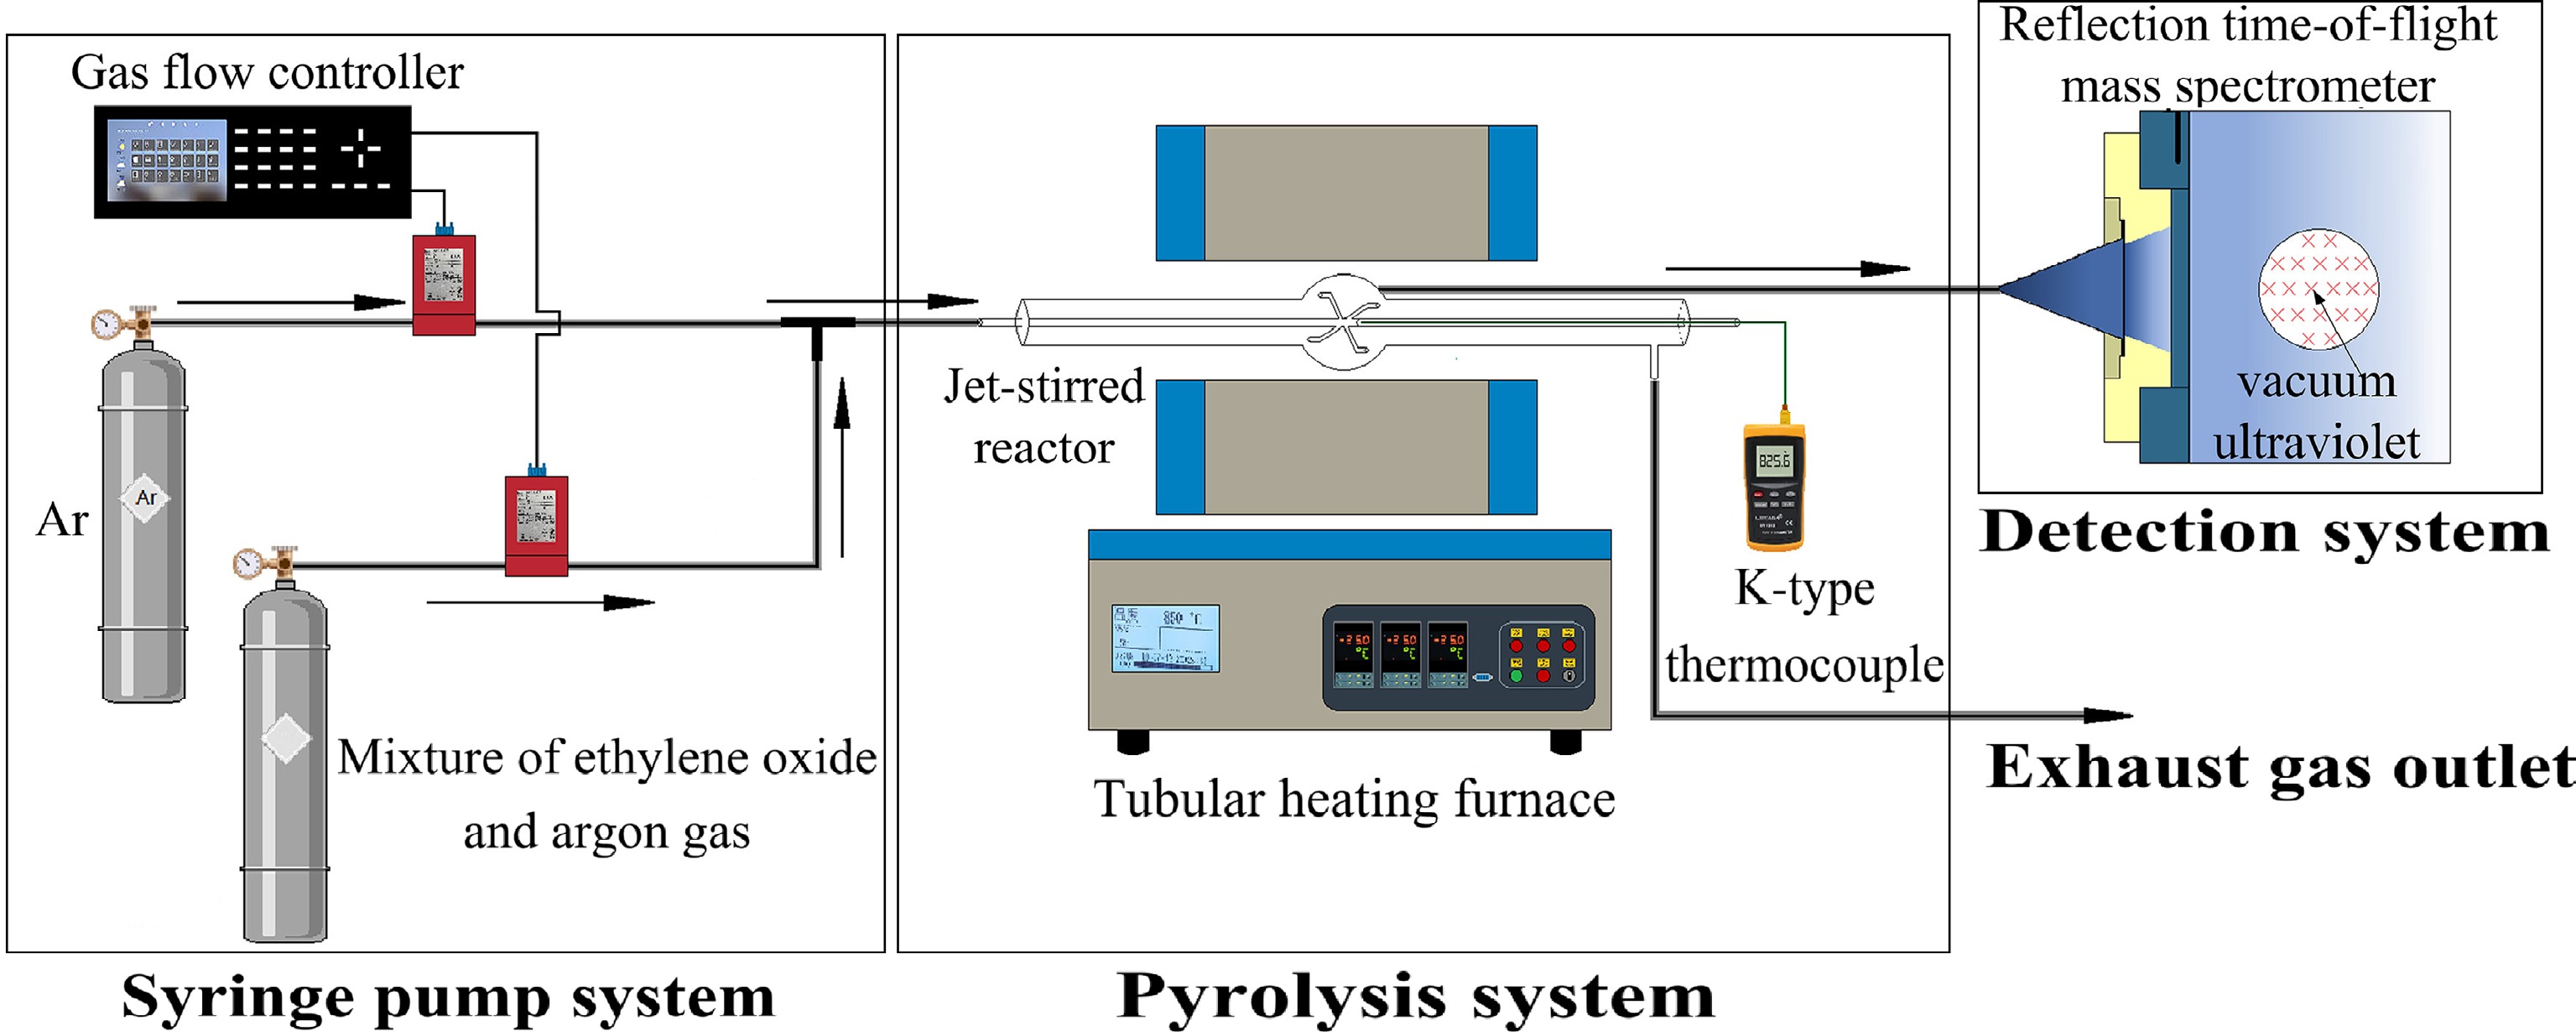
Figure 1.
Schematic sketch of the experimental apparatus for ethylene oxide pyrolysis.
-
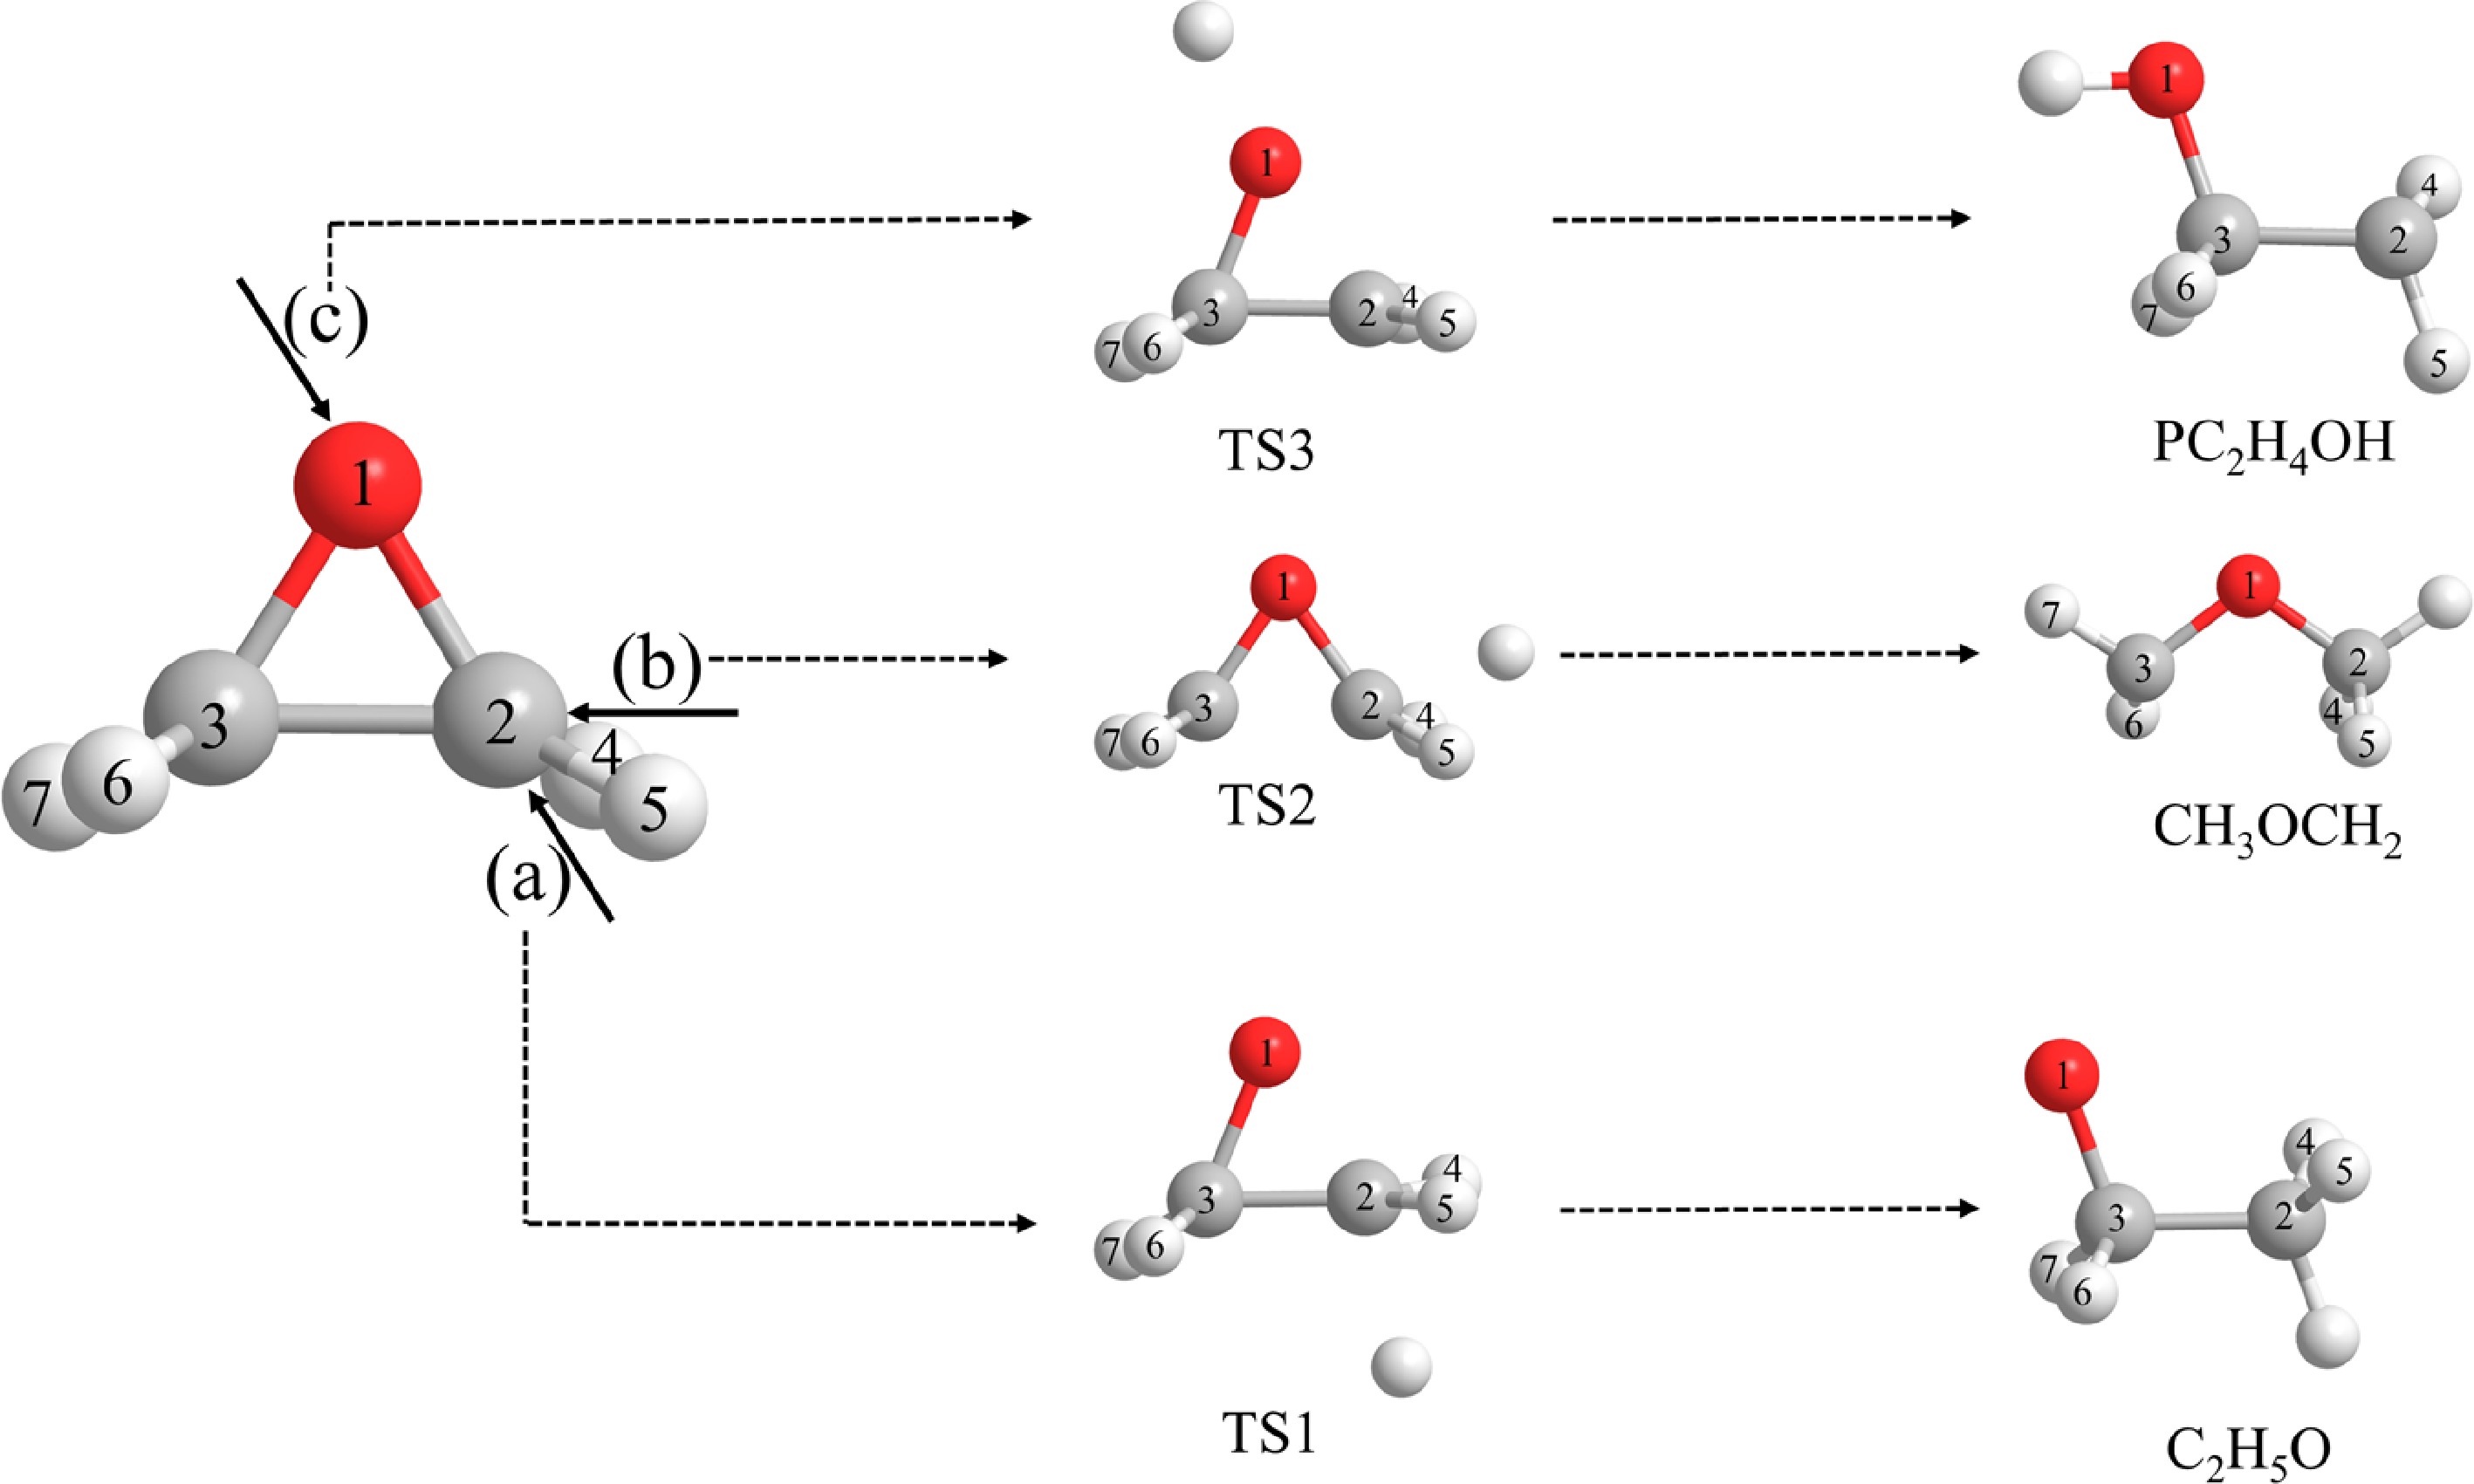
Figure 2.
The transition states and products formed in the backside attack reaction by the H atom on EO from three directions: (a) on the carbon atom from the side opposite the oxygen atom; (b) on the carbon atom from the side opposite the other carbon atom; (c) on the oxygen atom from the side opposite the carbon atom.
-
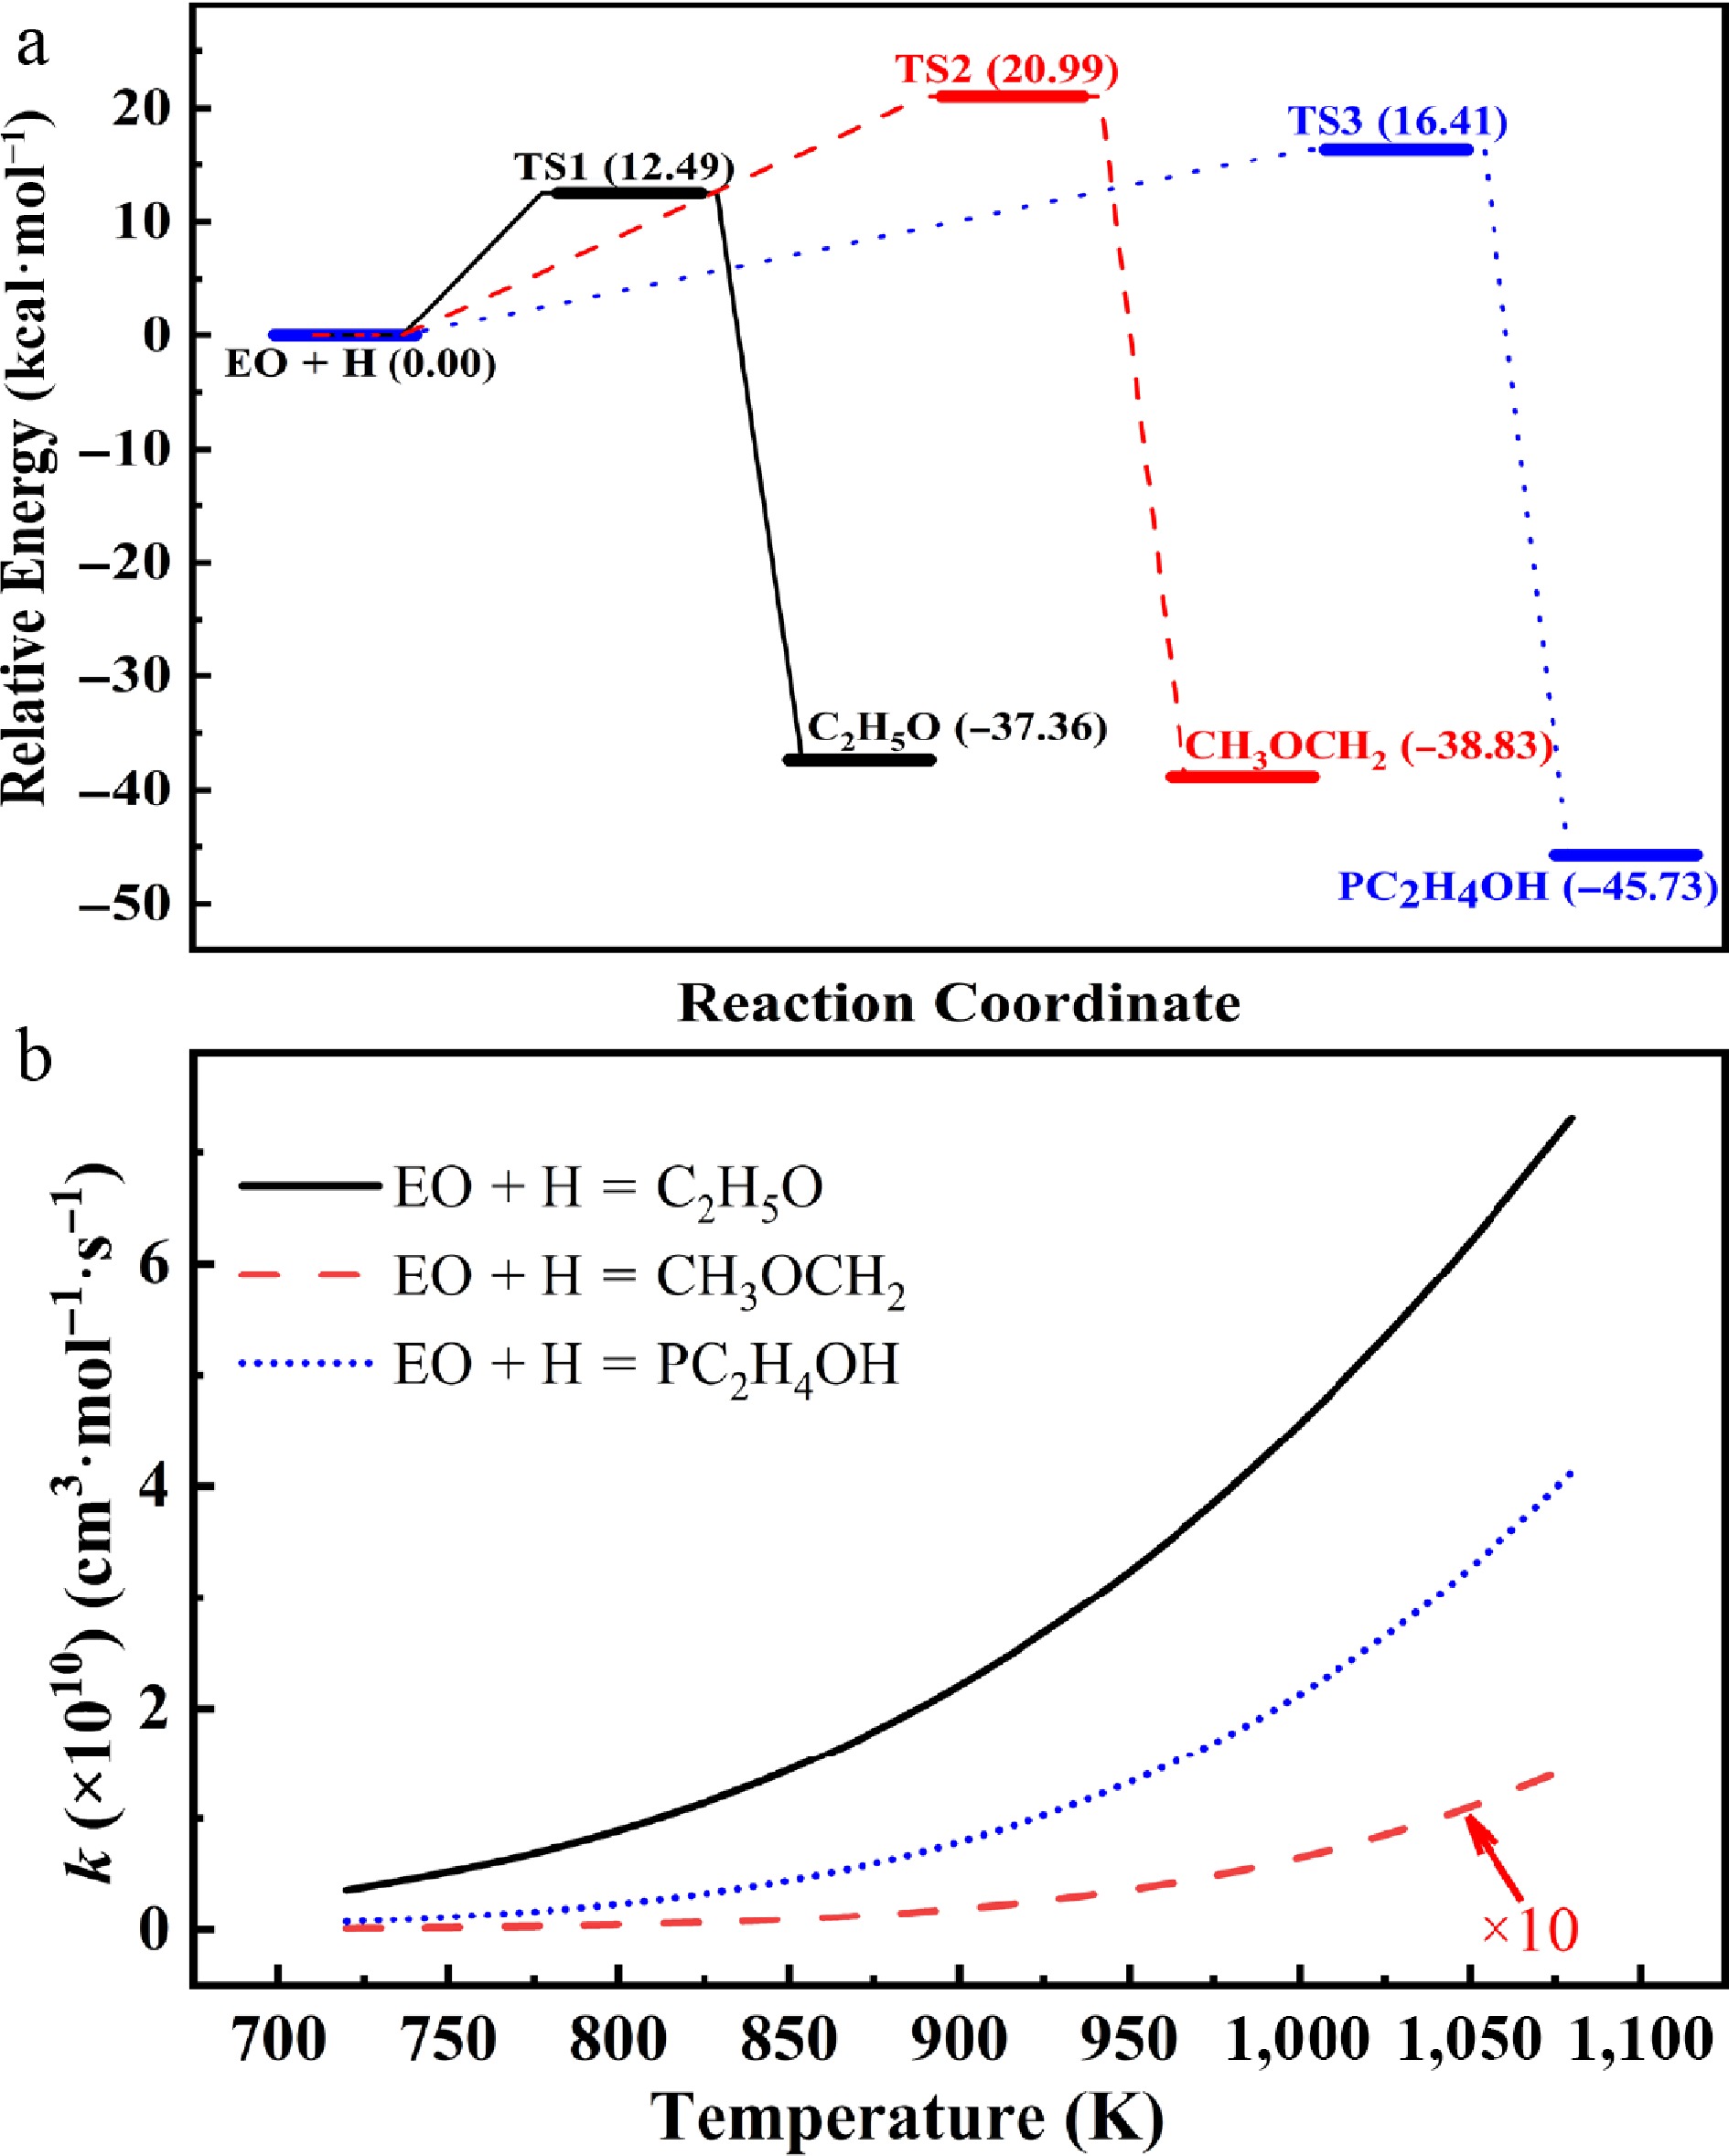
Figure 3.
Potential energy profiles (a) of the backside attack reactions by the H atom on EO, and the corresponding rate constants at 750−1,080 K and 1 atm (b).
-
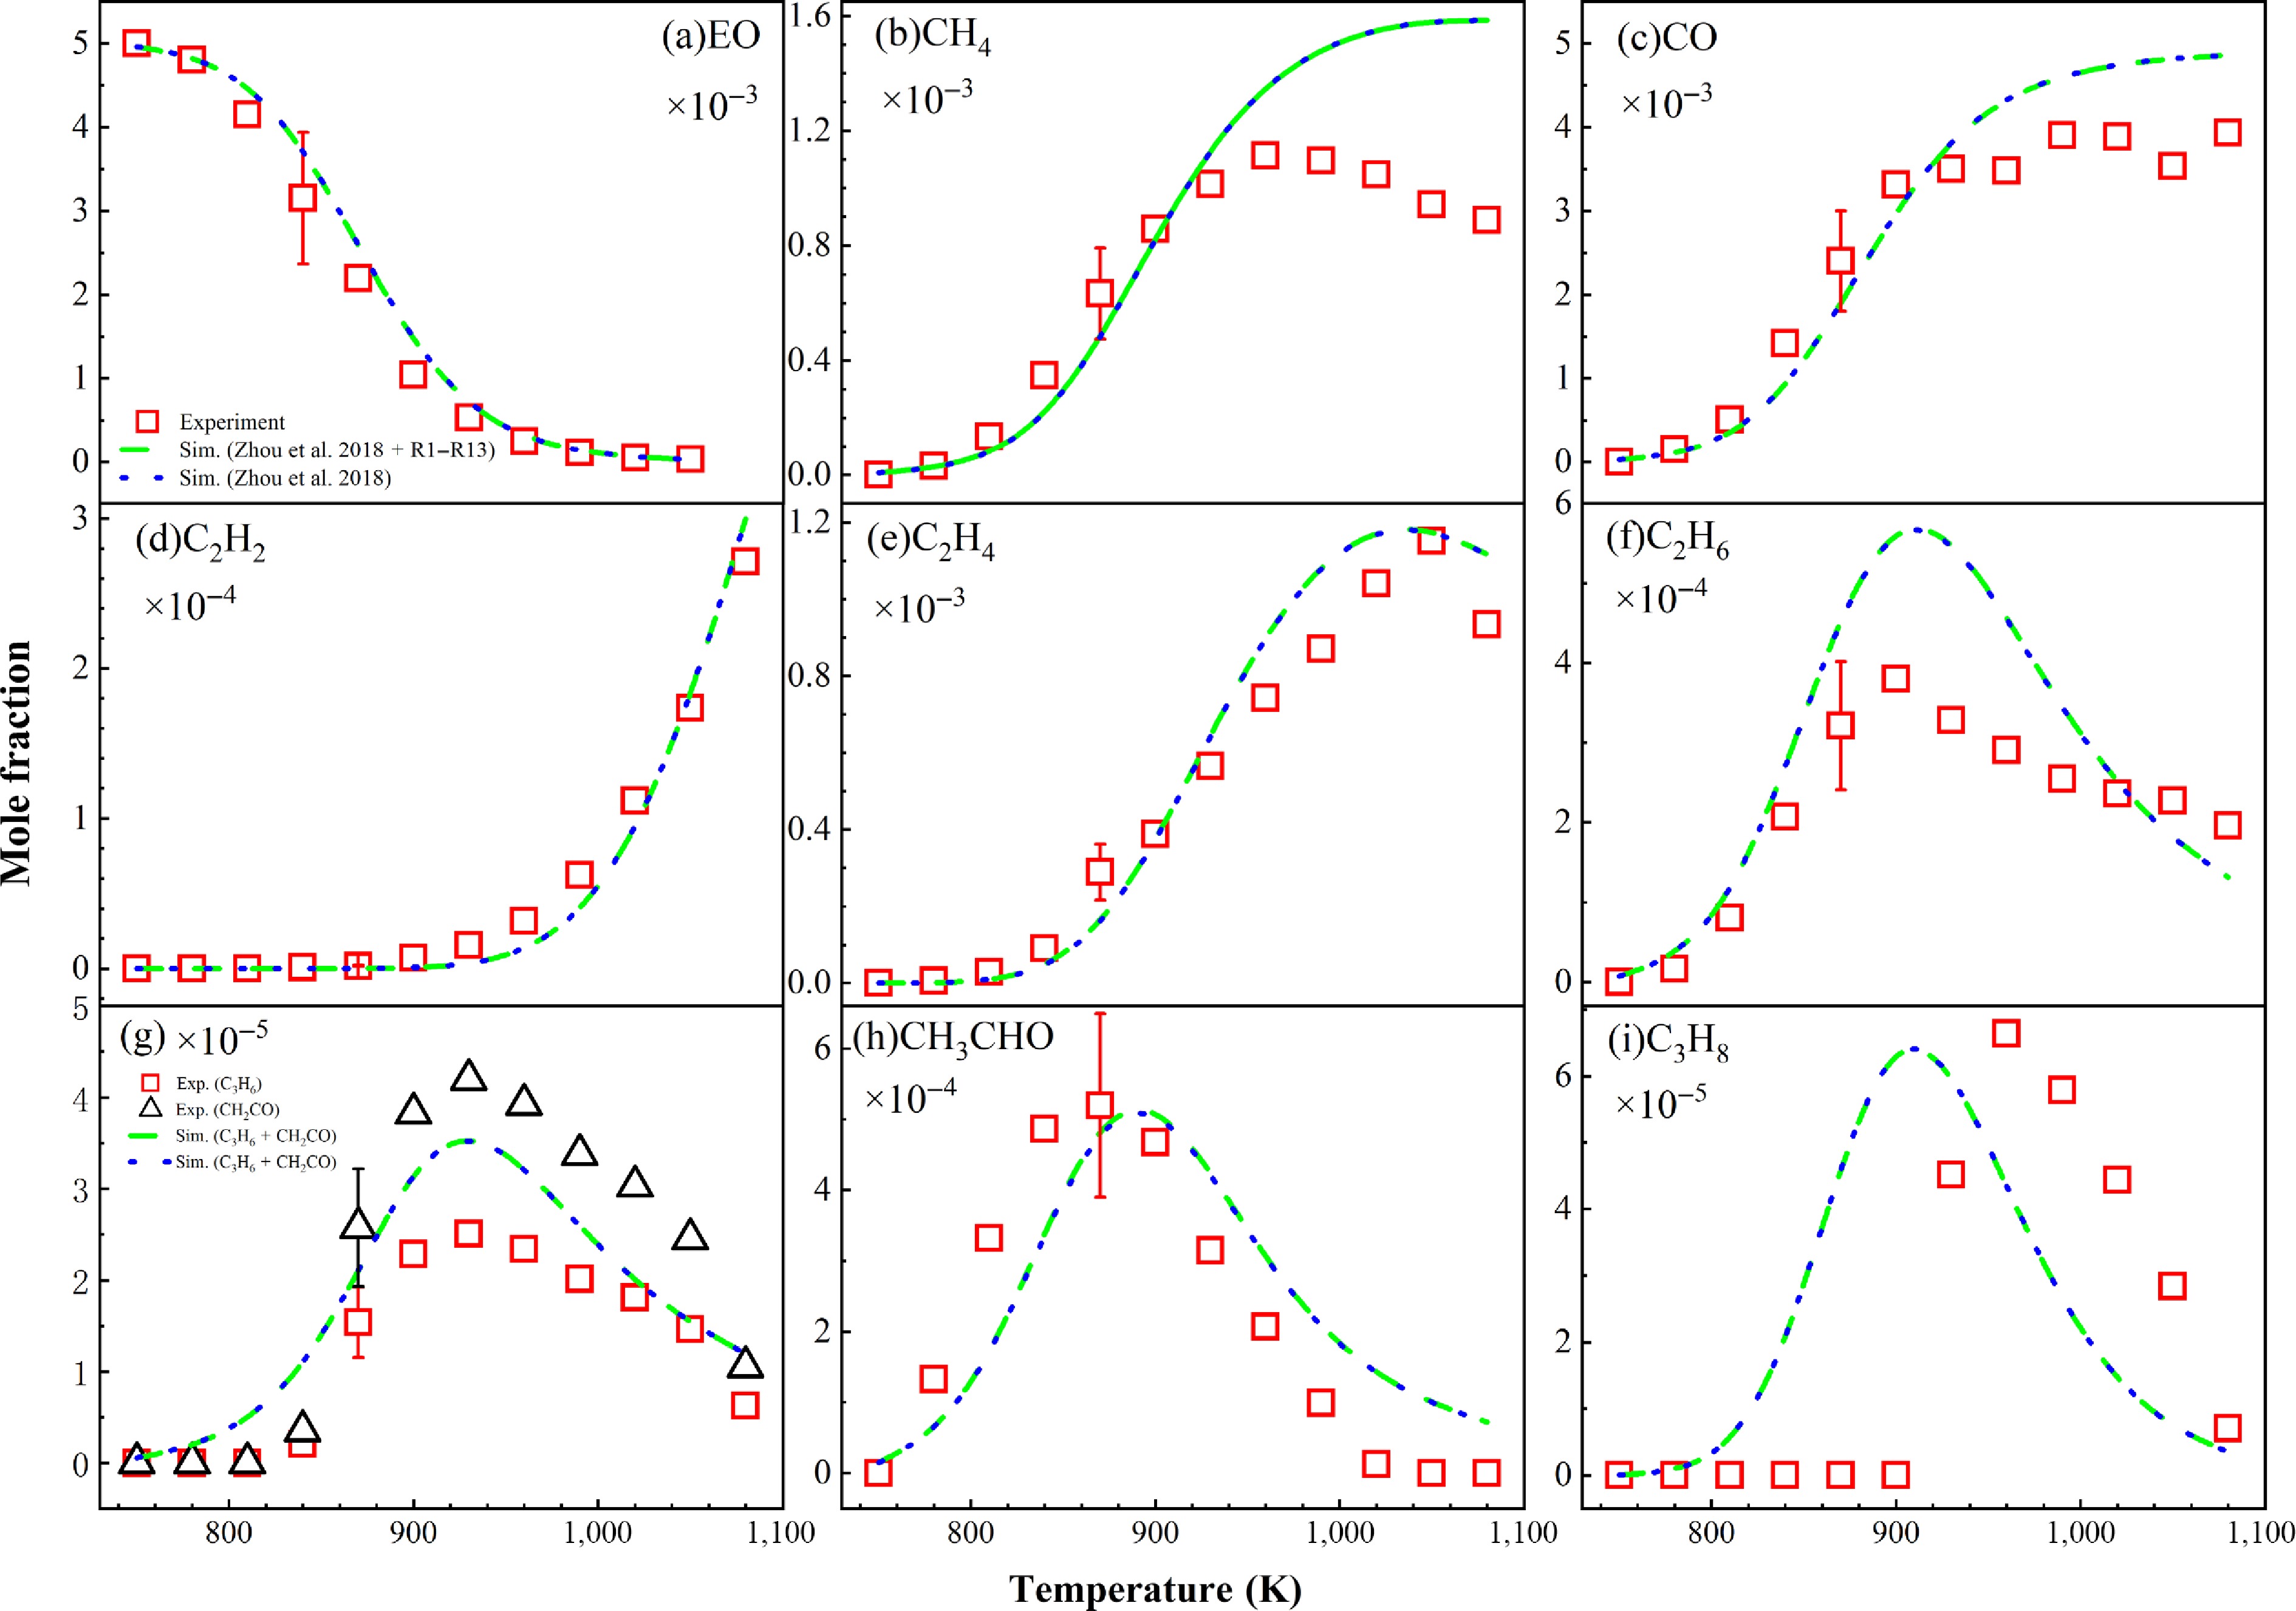
Figure 4.
Experimental mole fraction (symbol representation) and simulated mole fraction (line representation) curves of ethylene oxide pyrolysis products: (a) ethylene oxide (EO), (b) methane (CH4), (c) carbon monoxide (CO), (d) acetylene (C2H2), (e) ethylene (C2H4), and (f) ethane (C2H6). (g) Experimental mole fraction distributions for propylene (C3H6) and ketene (CH2CO), and simulated mole fraction curves for the reaction between C3H6 and CH2CO, (h) acetaldehyde (CH3CHO), and (i) propane (C3H8).
-
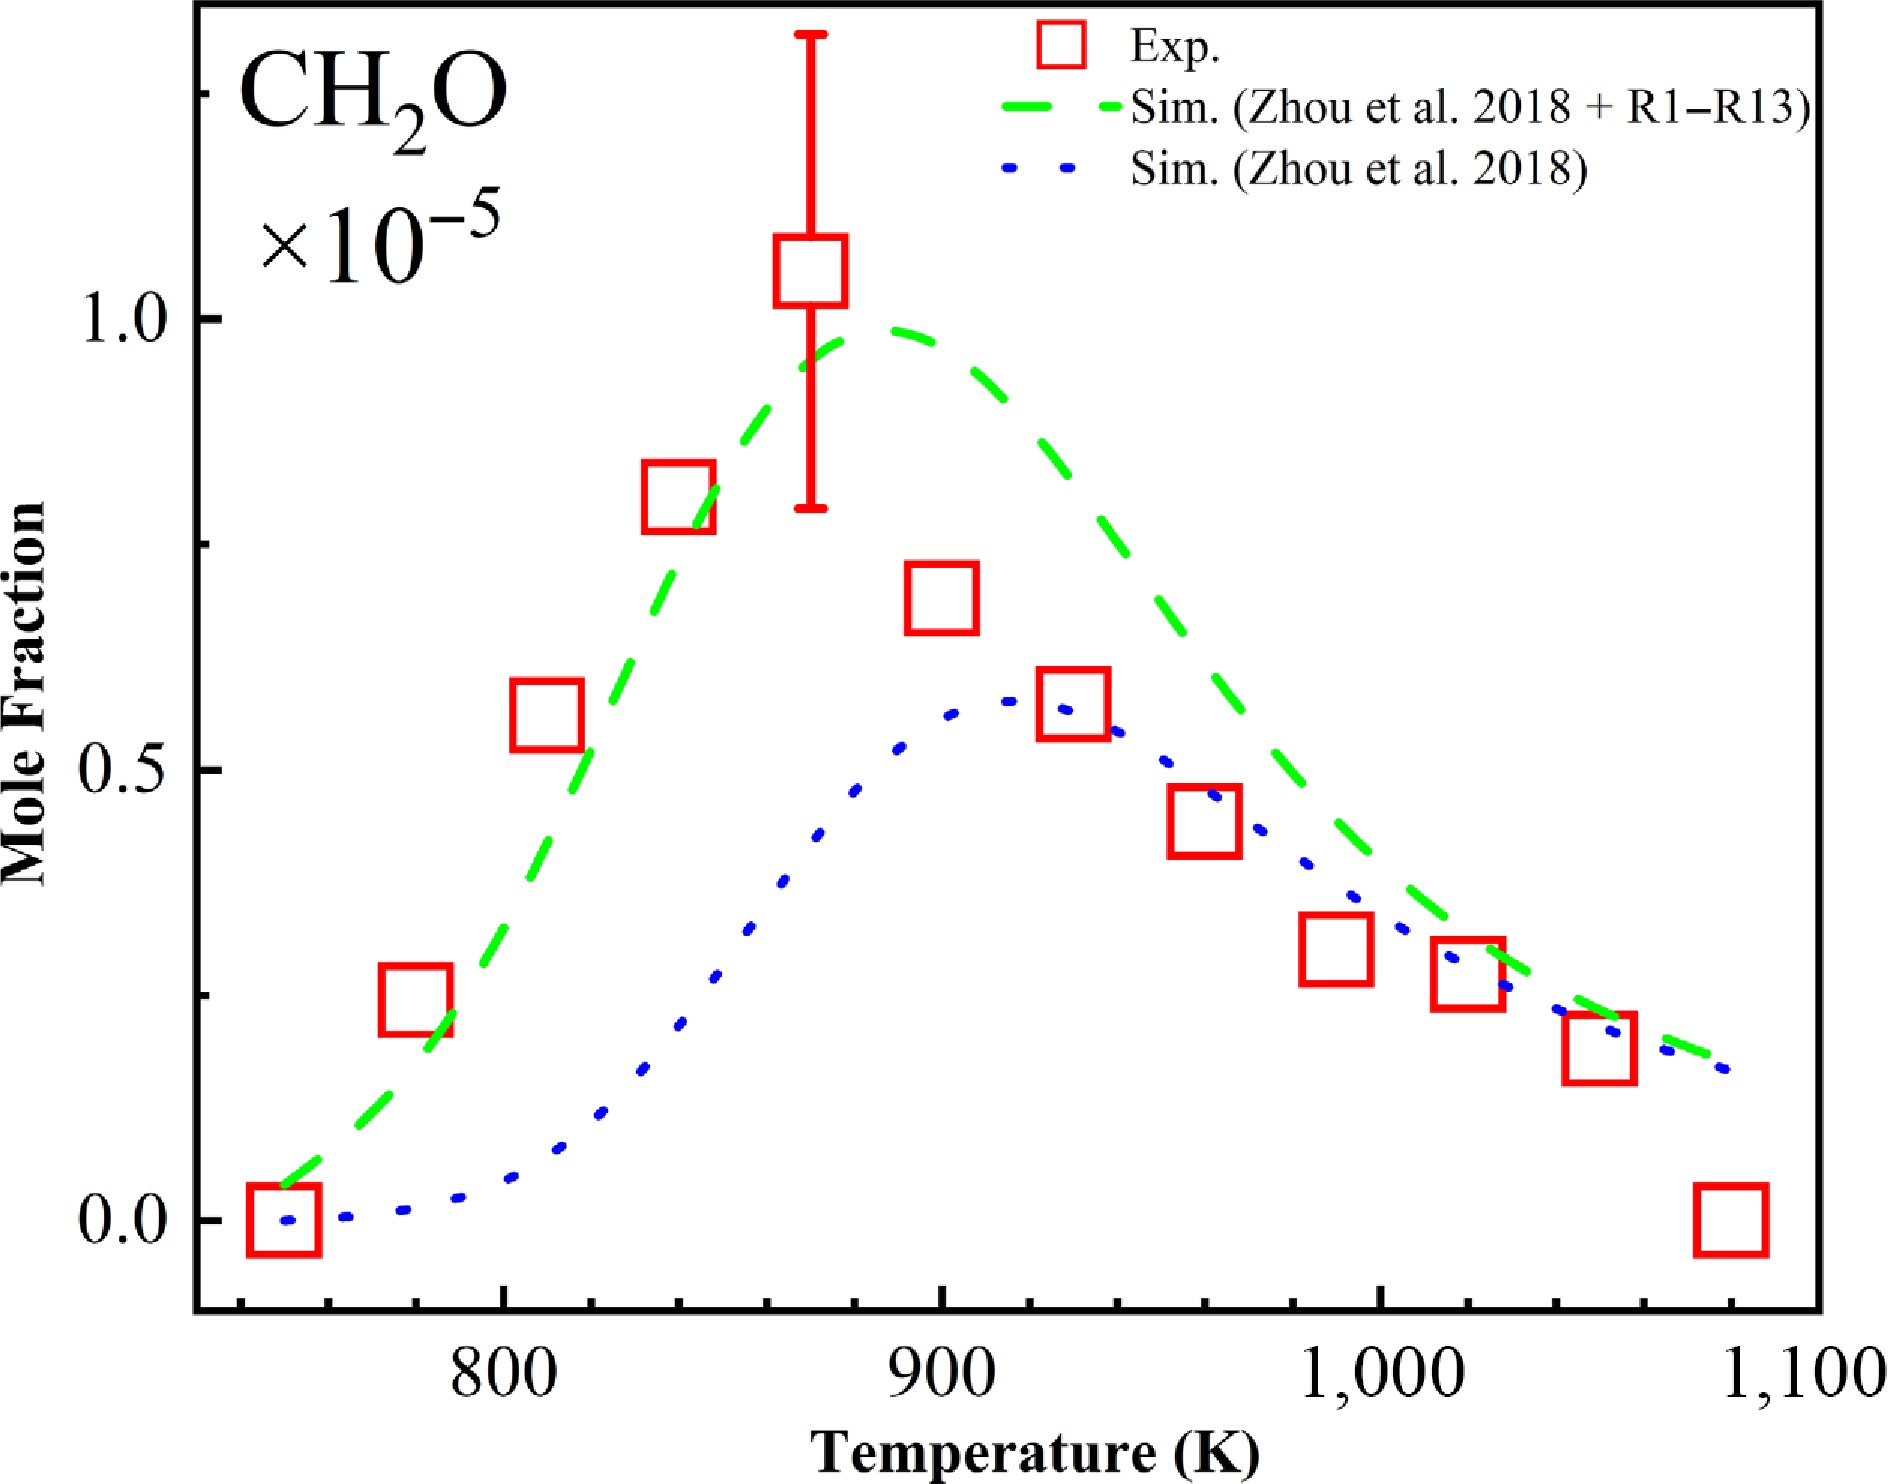
Figure 5.
Experimental mole fraction (symbol representation) and simulated mole fraction (line representation) of CH2O, a product of ethylene oxide pyrolysis.
-
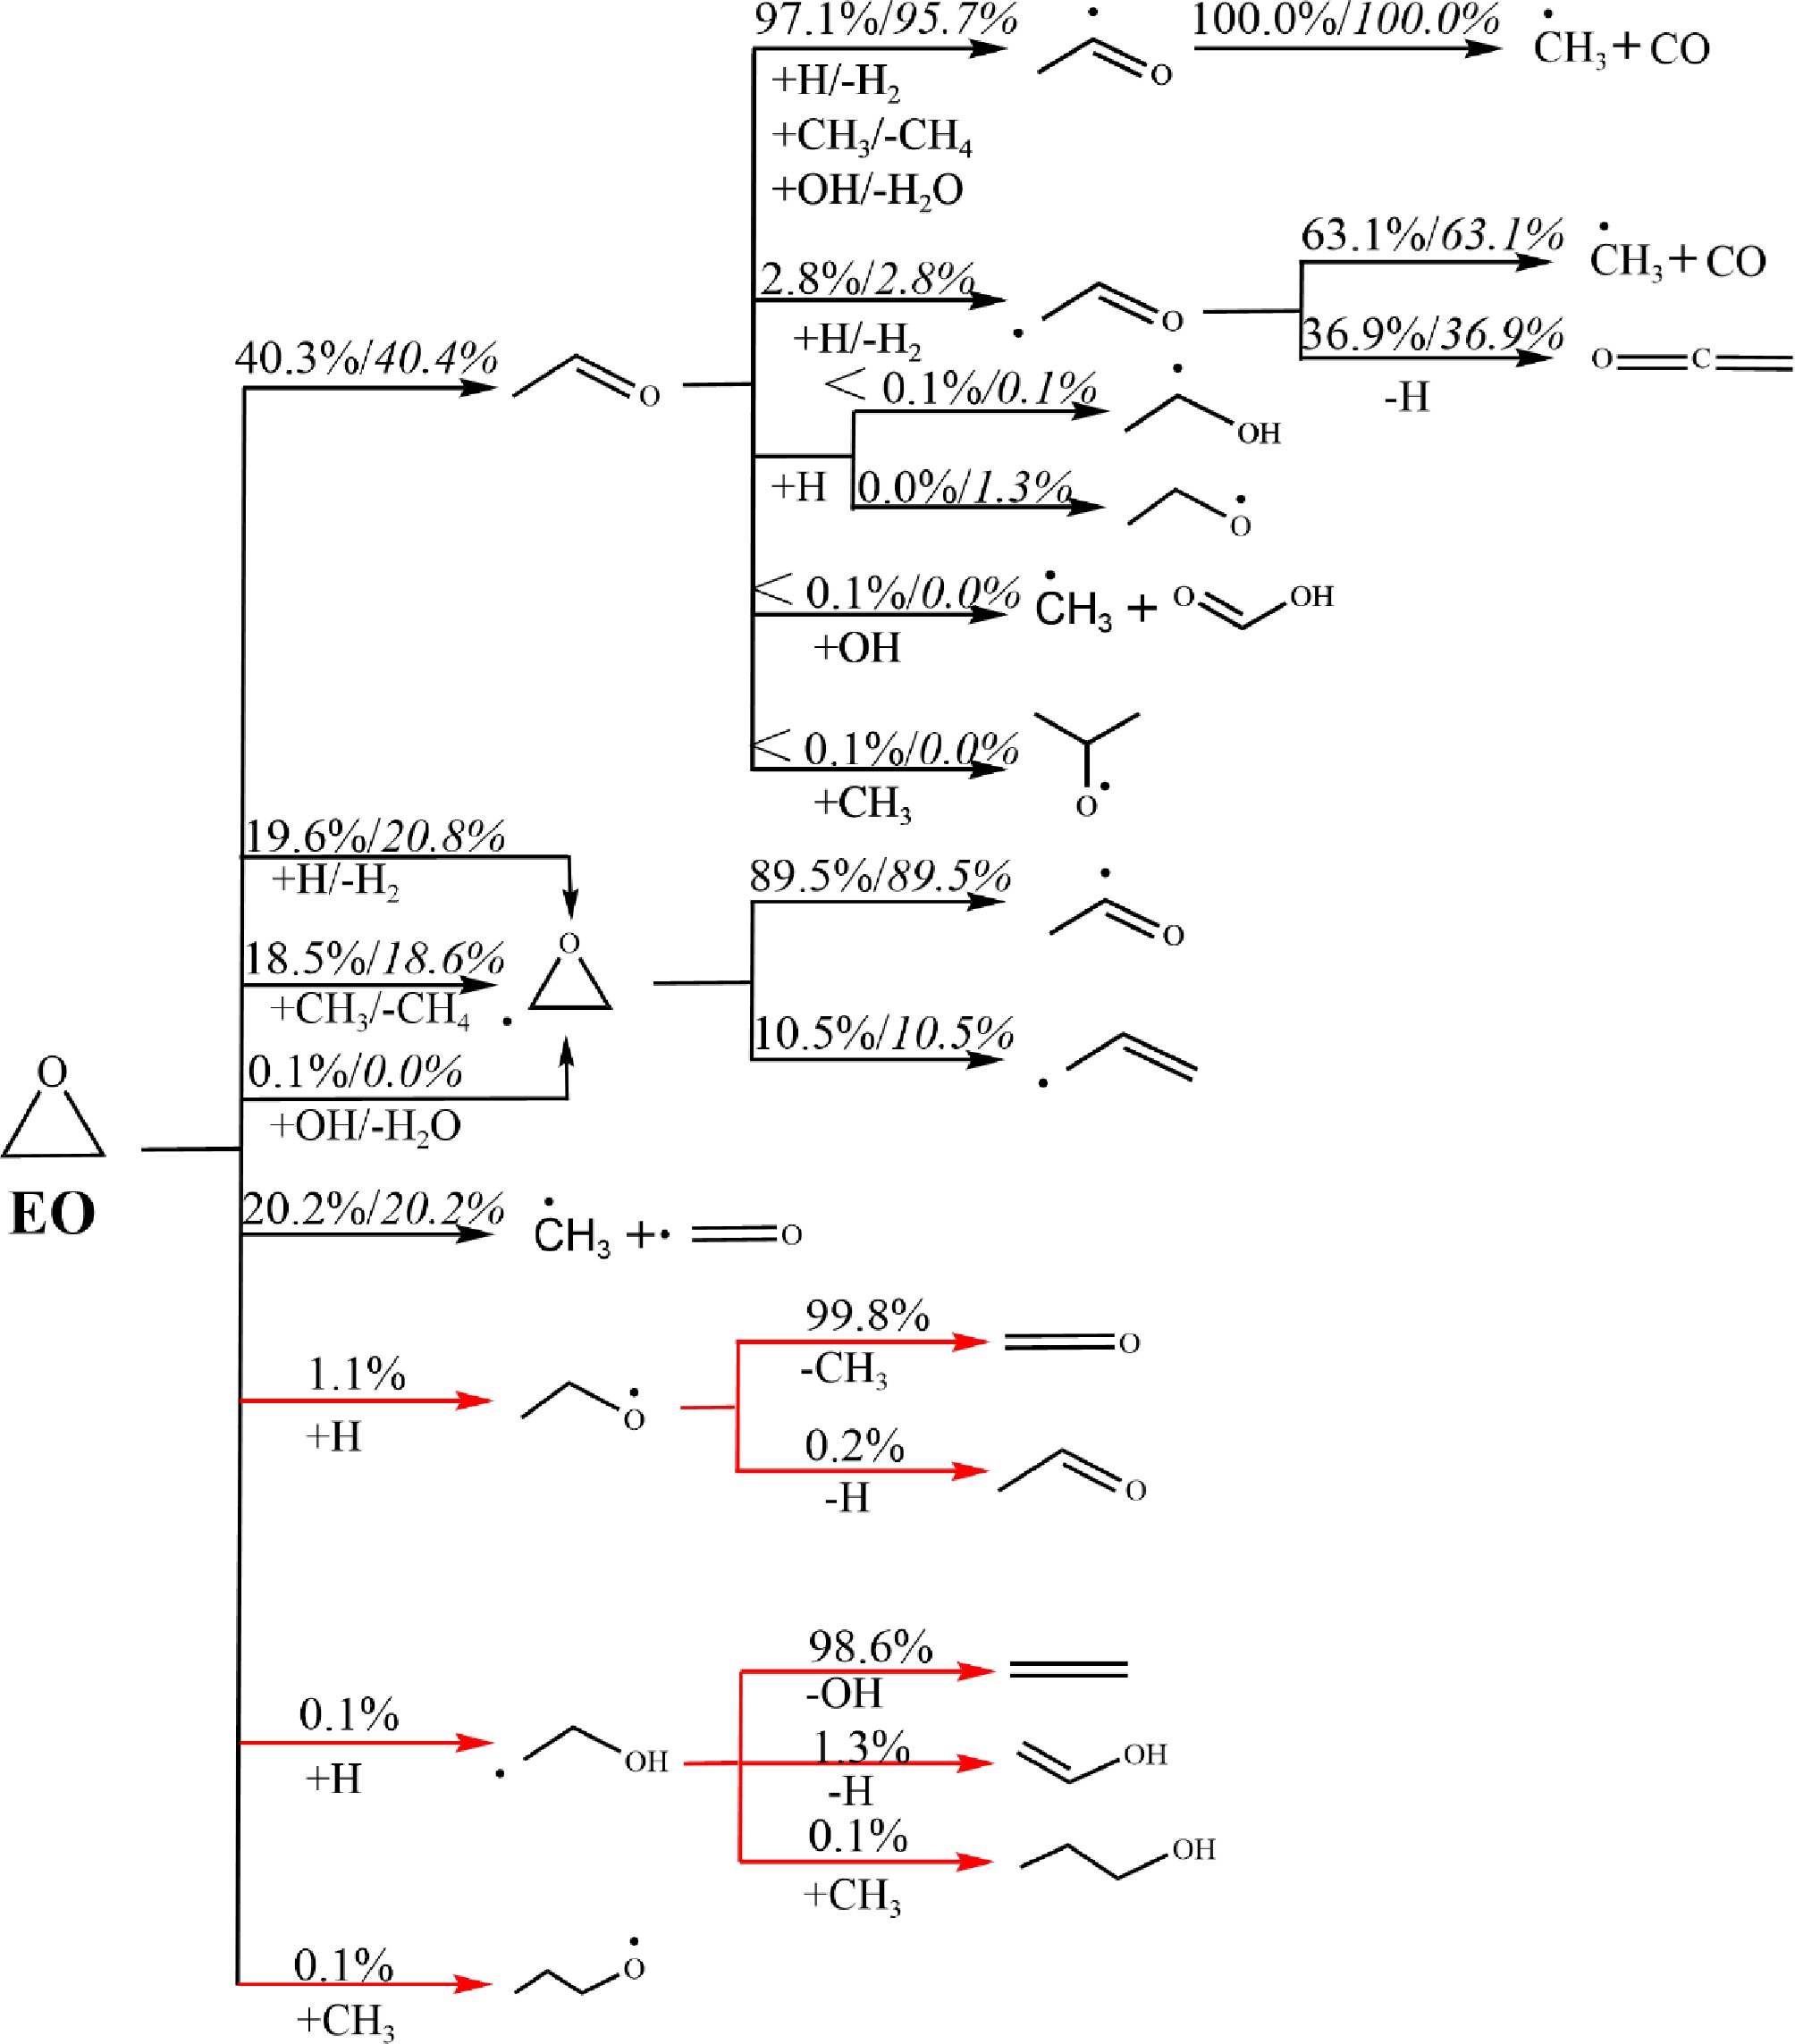
Figure 6.
Flow-rate analysis of ethylene oxide pyrolysis at 900 K. Percentages in normal font are related to the updated mechanism, while those in italics are related to the AramcoMech 3.0 mechanism.
-
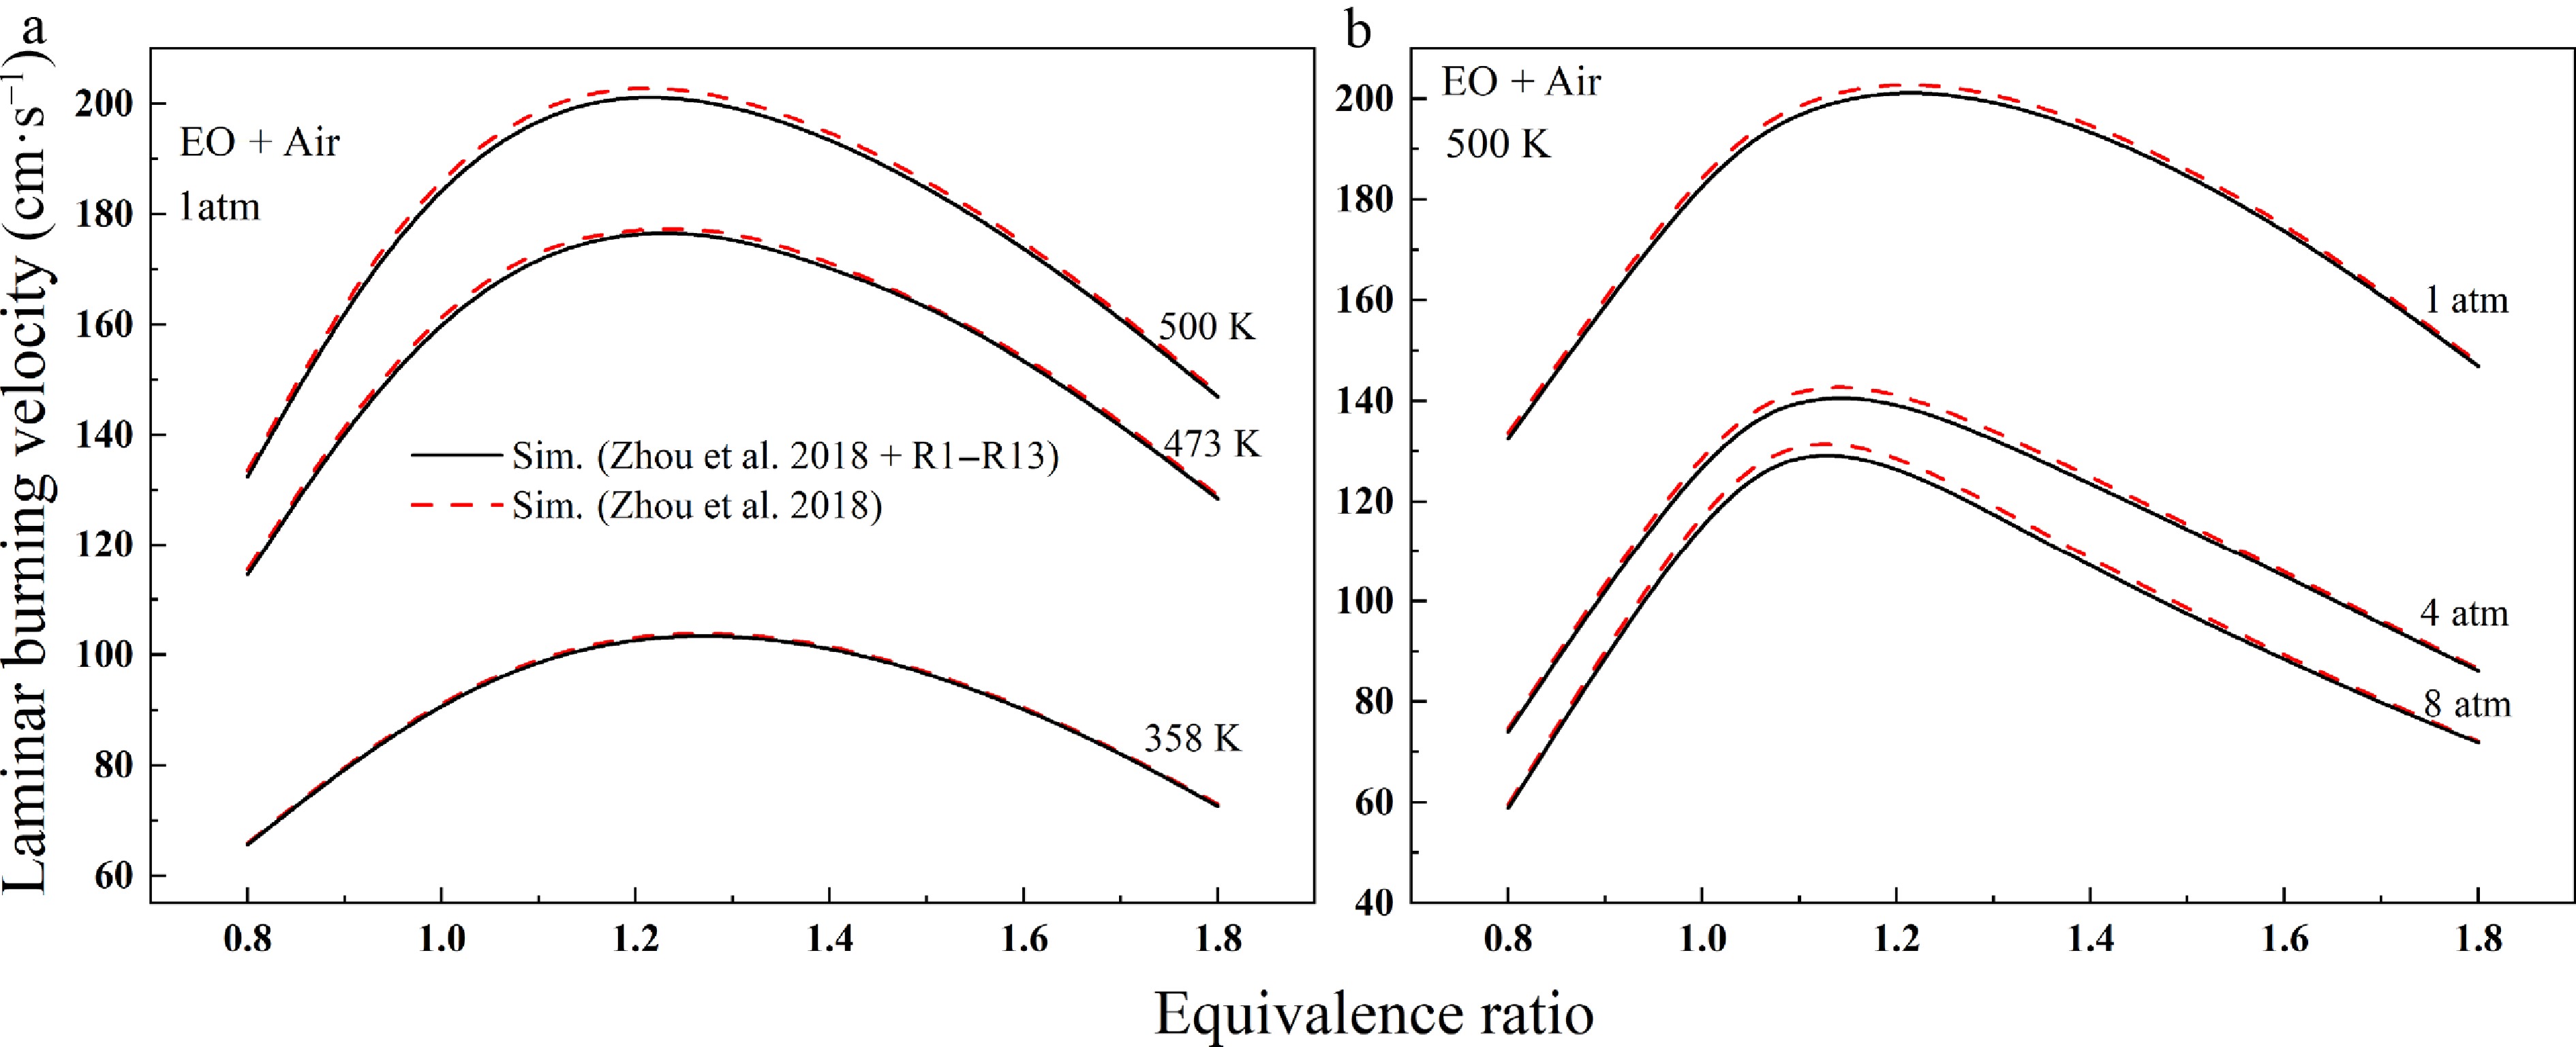
Figure 7.
The laminar burning velocity of EO (a) at 358, 473, and 500 K at 1 atm, and (b) at 1, 4, and 8 atm at 500 K.
-
Figures
(8)
Tables
(0)