-
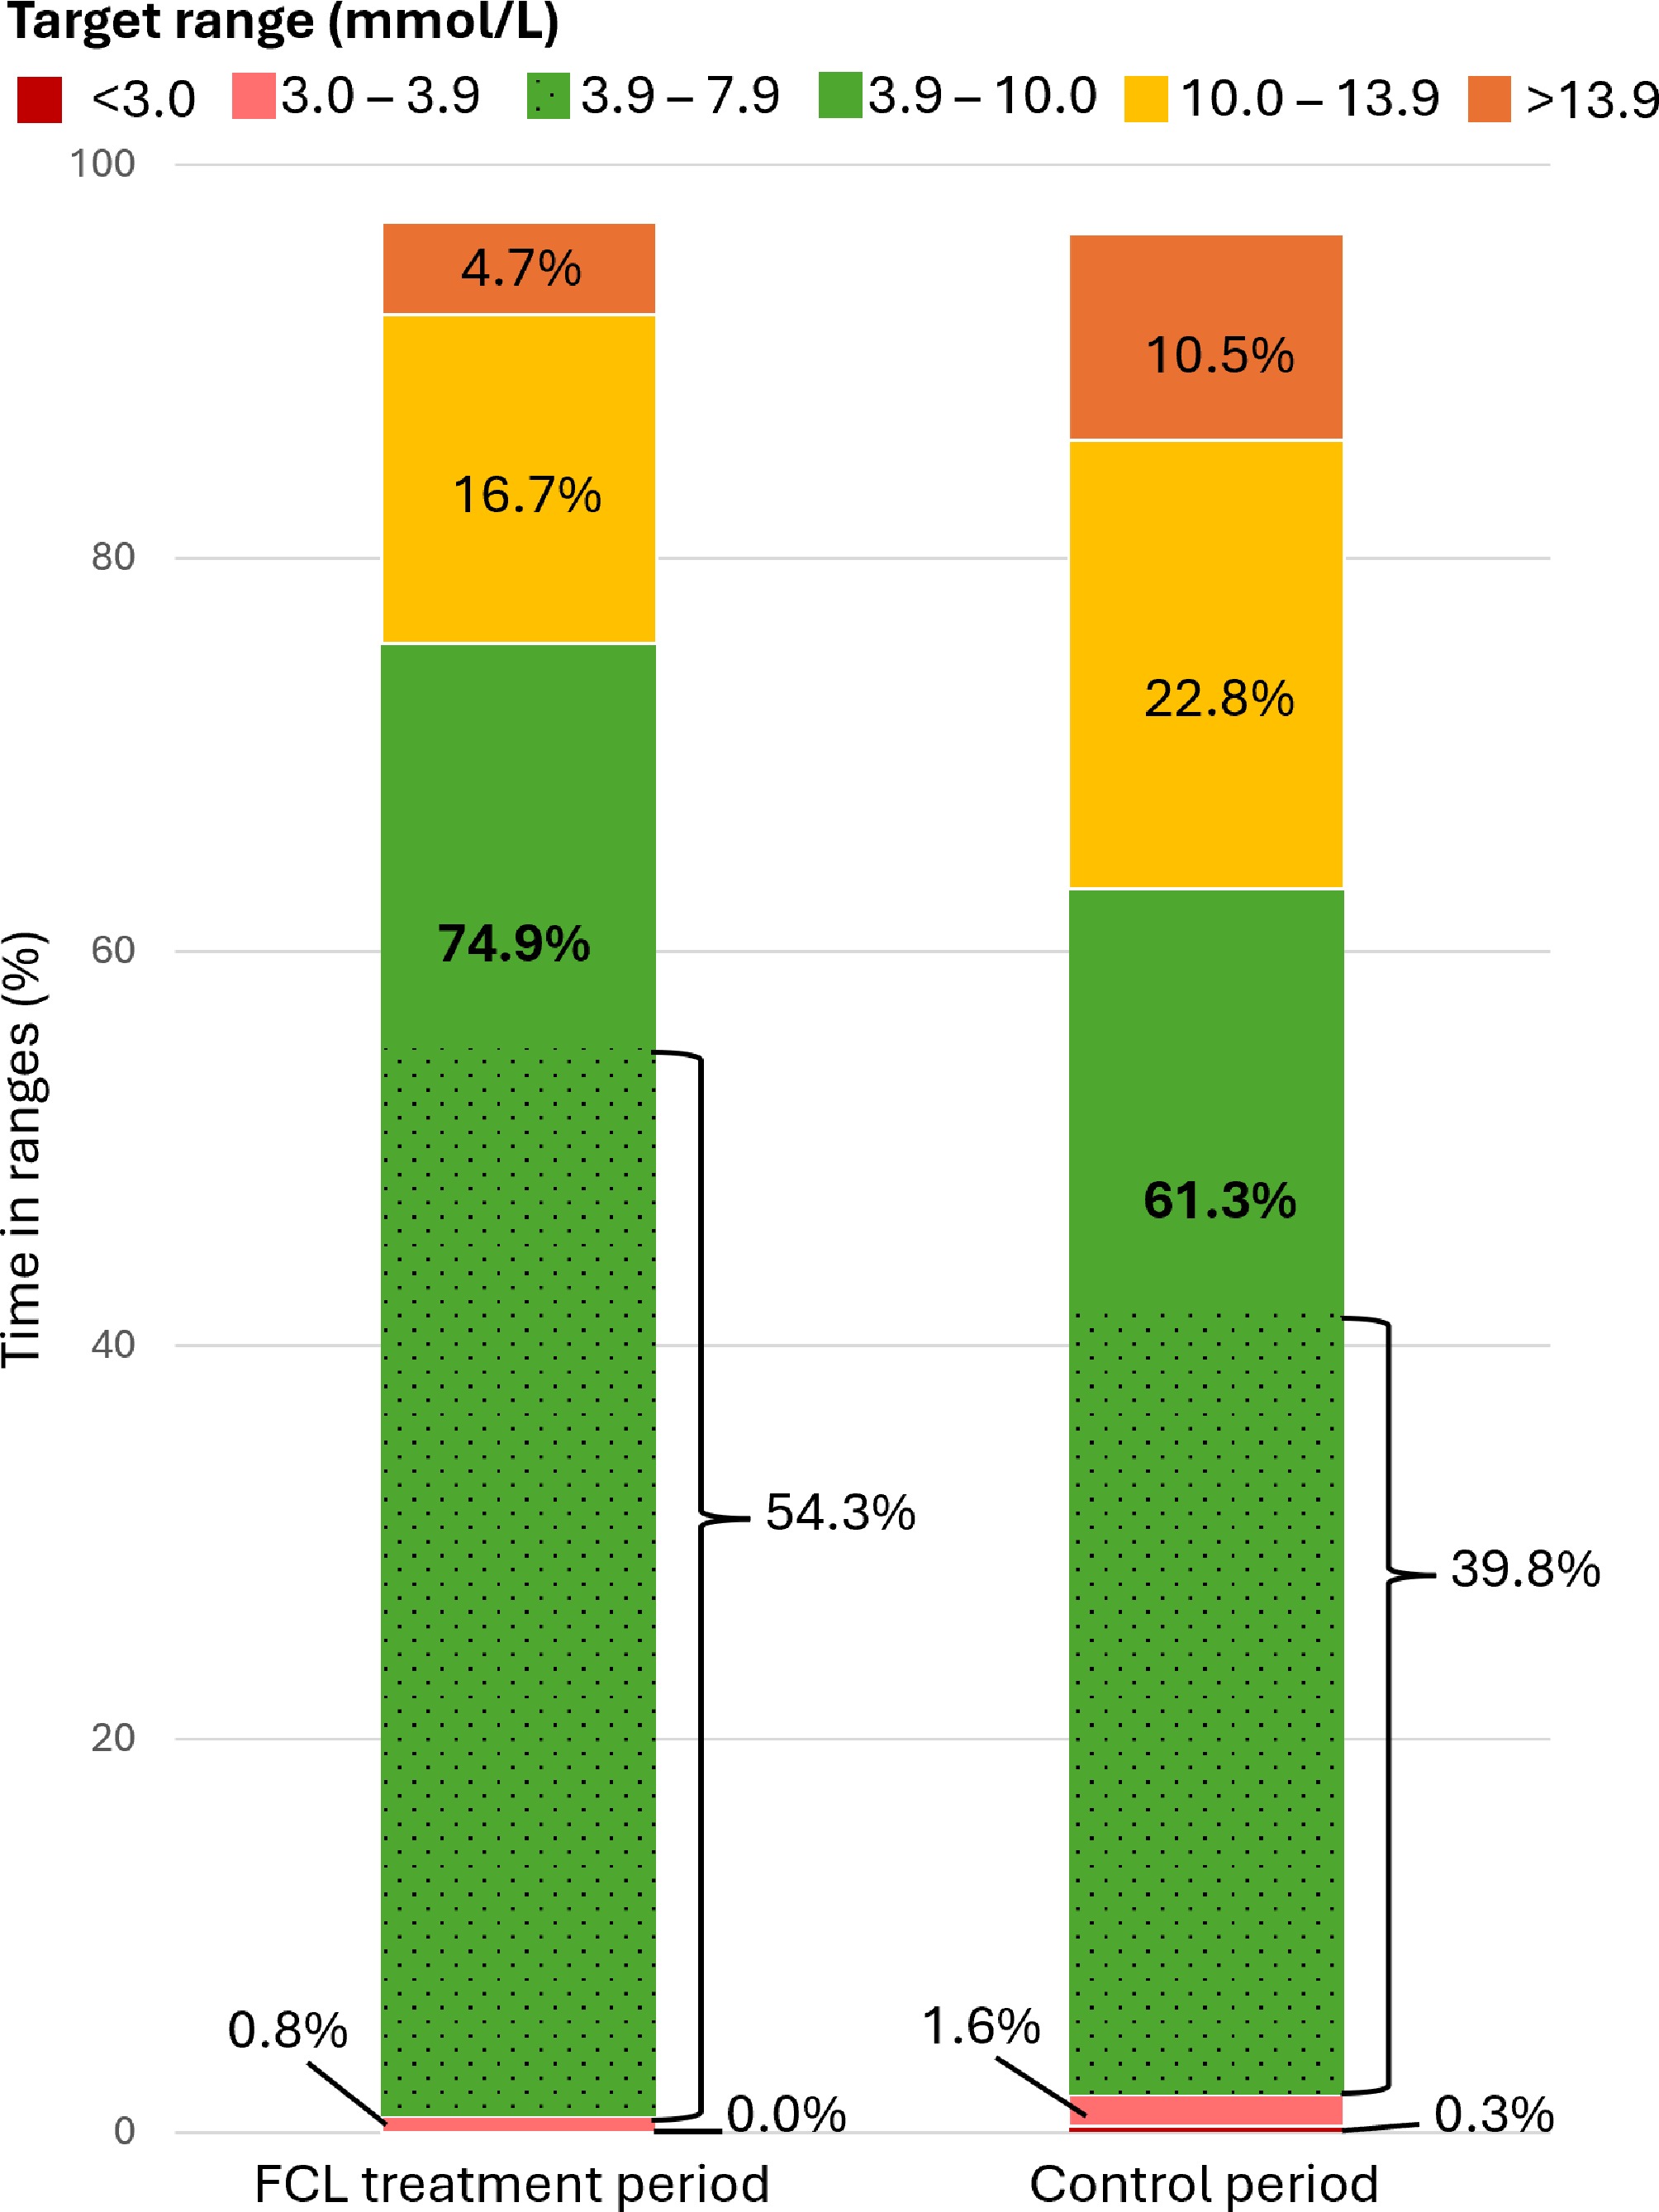
Figure 1.
Proportion of time spent in the different glycemic ranges during the FCL treatment period and the control period. The percentages displayed are the calculated median value per category. As a result, percentages may not total to 100% as a result of skewed distributions and rounding.
-
Characteristic Participants (n = 15) Age (years) 14.1 ± 1.5 Gender Male 10 (66.7%) Female 5 (33.3%) BMI (kg/m2) 20.1 ± 2.8 HbA1c (%; mmol/mol) 7.1 ± 1.5; 58.3 ± 7.1 Current treatment HCL 11 (73.3%) CSII 2 (13.3%) MDI 2 (13.3%) Current sensor Guardian 4 9 (60.0%) Dexcom G6 4 (26.7%) FreeStyle Libre 2 2 (13.4%) BMI, body mass index; HCL, hybrid closed-loop; CSII, continuous subcutaneous insulin infusion; MDI, multiple daily injections. Table 1.
Baseline characteristics
-
Outcome measure FCL treatment period Control period p-value Time in range (TIR; 3.9−10 mmol/L) 74.9% (73.1%−81.0%) 61.3% (53.7%−68.2%) < 0.001 Daytime* 68.1% (65.1%−75.0%) 57.7% (52.3%−64.9%) 0.002 Nighttime** 95.0% (93.0%−96.2%) 74.7% (61.4%−82.5%) < 0.001 Time in tight range (TITR; 3.9−7.8 mmol/L) 54.3% (50.7%−58.7%) 39.8% (33.4%−45.1%) 0.001 Daytime 44.9% (42.4%−49.8%) 36.7% (31.6%−42.2%) 0.012 Nighttime 79.0% (74.6%−81.5%) 52.8% (42.0%−56.2%) < 0.001 Time below range (TBR; < 3.9 mmol/L) 0.8% (0.4%−1.7%) 2.1% (0.9%−3.3%) 0.022 Daytime 0.9% (0.4%−2.0%) 2.2% (1.1%−4.0%) 0.015 Nighttime 0.5% (0.1%−0.9%) 1.2% (0.0%−1.8%) 0.208 Time below range (TBR; < 3.9 mmol/L) 0.8% (0.4%−1.7%) 2.1% (0.9%−3.3%) 0.022 Daytime 0.9% (0.4%−2.0%) 2.2% (1.1%−4.0%) 0.015 Nighttime 0.5% (0.1%−0.9%) 1.2% (0.0%−1.8%) 0.303 Time below range level 2 (TBR2; < 3.0 mmol/L) 0.0% (0.0%−0.2%) 0.3% (0.1%−1.0%) 0.048 Daytime 0.1% (0.0%−0.2%) 0.3% (0.1%−0.9%) 0.048 Nighttime 0.0% (0.0%−0.0%) 0.2% (0.0%−0.4%) 0.139 Time above range (TAR; > 10.0 mmol/L) 24.5% (17.5%−25.9%) 36.2% (26.8%−45.0%) 0.001 Daytime 31.3% (23.3%−33.3%) 41.4% (32.6%−45.1%) 0.004 Nighttime 4.3% (2.9%−5.5%) 24.0% (13.1%−37.2%) < 0.001 Time above range Level 1 (TAR1; 10.0−13.9 mmol/L) 16.7% (15.1%−19.7%) 22.8% (21.8%−27.2%) 0.001 Daytime 21.8% (19.7%−25.5%) 24.7% (22.8%−29.0%) 0.035 Nighttime 3.5% (2.5%−5.0%) 17.1% (11.5%−21.0%) < 0.001 Time above range Level 2 (TAR2; > 13.9 mmol/L) 4.7% (3.1%−7.8%) 10.5% (7.0%−15.9%) 0.001 Daytime 6.1% (4.2%−10.2%) 13.1% (9.1%−17.3%) 0.001 Nighttime 0.0% (0.0%−1.1%) 2.7% (1.6%−8.6%) 0.001 Median blood glucose concentration (mmol/L) 7.4 (7.2%−7.7%) 8.5 (8.0%−9.6%) 0.001 Daytime 8.1 (7.6%−8.3%) 9.2 (8.3%−9.4%) 0.004 Nighttime 6.5 (6.4%−6.7%) 7.7 (7.5%−8.4%) < 0.001 Glycemic variability Standard deviation (SD; mmol/L) 2.9 (2.7%−3.2%) 3.2 (3.1%−4.0%) 0.001 Coefficient of variation (CV) 35.7% (32.9%−39.0%) 38.8% (34.5%−41.6%) 0.121 Interquartile range (IQR; mmol/L) 3.7 (3.2%−3.9%) 4.8 (4.3%−5.5%) < 0.001 Daily insulin use (units) 57.3 (52.6%−68.7%) 46.6 (37.4%−55.3%) < 0.001 Daily glucagon use (mg) 0.55 (0.37%−0.65%) − * Daytime was defined as 06:00−24:00, ** Nighttime was defined as 24:00−06:00. Data are expressed as the median (IQR). TIR was the primary endpoint, tested at a significance threshold of α = 0.05. TITR, TBR, TAR, and median glucose were the key secondary endpoints, evaluated using a Bonferroni-adjusted significance threshold of α = 0.0125. All other metrics were considered exploratory and are reported with nominal p-values. Statistically significant results after correction for multiple comparisons are indicated in bold. n = 15. Table 2.
Outcome measures of the FCL treatment period and the control period.
-
Questionnaire FCL treatment period Control period p-value DTSQs: Parents 40.5 (38.0–45.0) 35.0 (28.5–39.0) 0.083 Perceived diabetes control 9.0 (6.3–10.0) 5.0 (3.5–6.0) 0.028 Perceived hypoglycemia 2.0 (1.3–2.8) 3.0 (2.0–4.0) 0.028 Perceived hyperglycemia 2.0 (1.3–4.8) 5.0 (4.0–5.0) 0.047 DTSQs: Adolescents 38.0 (35.0–44.0) 35.0 (27.0–39.0) 0.042 Perceived diabetes control 9.0 (6.0–10.0) 5.0 (4.0–8.0) 0.077 Perceived hypoglycemia 1.0 (1.0–2.0) 3.0 (2.0–3.0) 0.027 Perceived hyperglycemia 2.0 (1.0–4.0) 4.0 (3.0–5.0) 0.054 INSPIRE: Parents 81.0 (69.0–87.0) 72.0 (65.5–6.5) 0.157 INSPIRE: Adolescents 73.0 (69.0–75.0) 75.0 (66.0–82.0) 0.339 TAS: Parents 21.5 (20.0–23.0) 19.0 (17.0–21.0) 0.005 TAS: Adolescents 22.0 (19.0–23.0) 20.0 (19.0–21.0) 0.893 DTSQs, Diabetes Treatment Satisfaction Questionnaire status; INSPIRE, Insulin Delivery Systems: Perceptions, Ideas, Reflections and Expectations; TAS, Technology Acceptance Scale. Data are expressed as the median (IQR). Sample sizes: Parents (n = 11); adolescents (n = 13). Table 3.
Person-reported outcome measures assessing treatment expectations, trust, and satisfaction.
-
Adverse events, categorized FCL training period FCL treatment period Side effects of sensors Skin reactions, infections or damage 5 2 Side effects of insulin infusion set Skin reactions, infections or damage 4 − Side effects of glucagon Skin reactions, infections or damage at infusion site 7 − Nausea 4 − Vomiting 1 − Abdominal pain 2 − Headache 3 1 Side effects of FCL treatment (Sensation of) hypoglycemia 1 − General malaise 1 − Table 4.
Overview of all reported adverse events
Figures
(1)
Tables
(4)