-
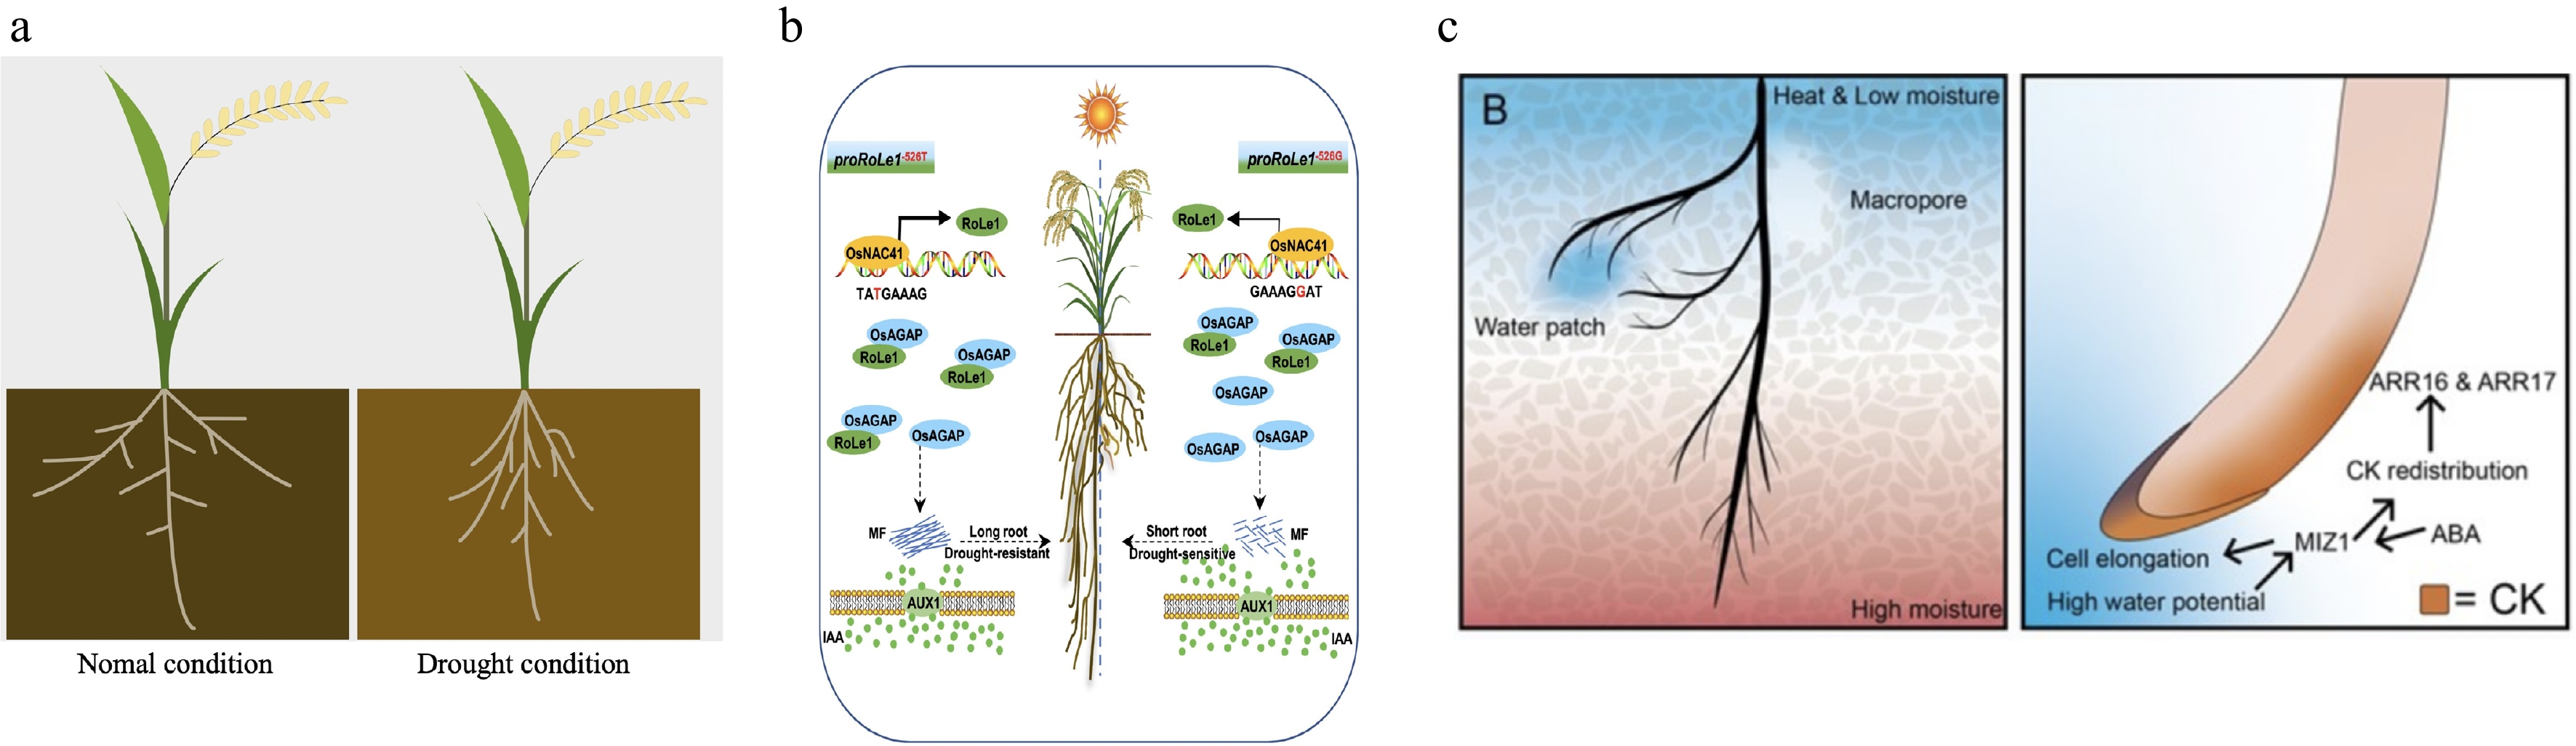
Figure 1.
The root system phenotype exhibits a strong correlation with drought stress response. (a) Comparison of RSA between normal and drought conditions, showing enhanced lateral root development under stress[7]. (b) Correlation between the root length under drought and the drought resistance index in rice; longer roots are associated with greater drought tolerance[8]. (c) Model of a drought-adaptation strategy: root hydrotropism, illustrating how roots sense wet soil patches and grow toward them by adjusting the internal hormones (ABA, CK) and genes (MIZ1)[9].
-
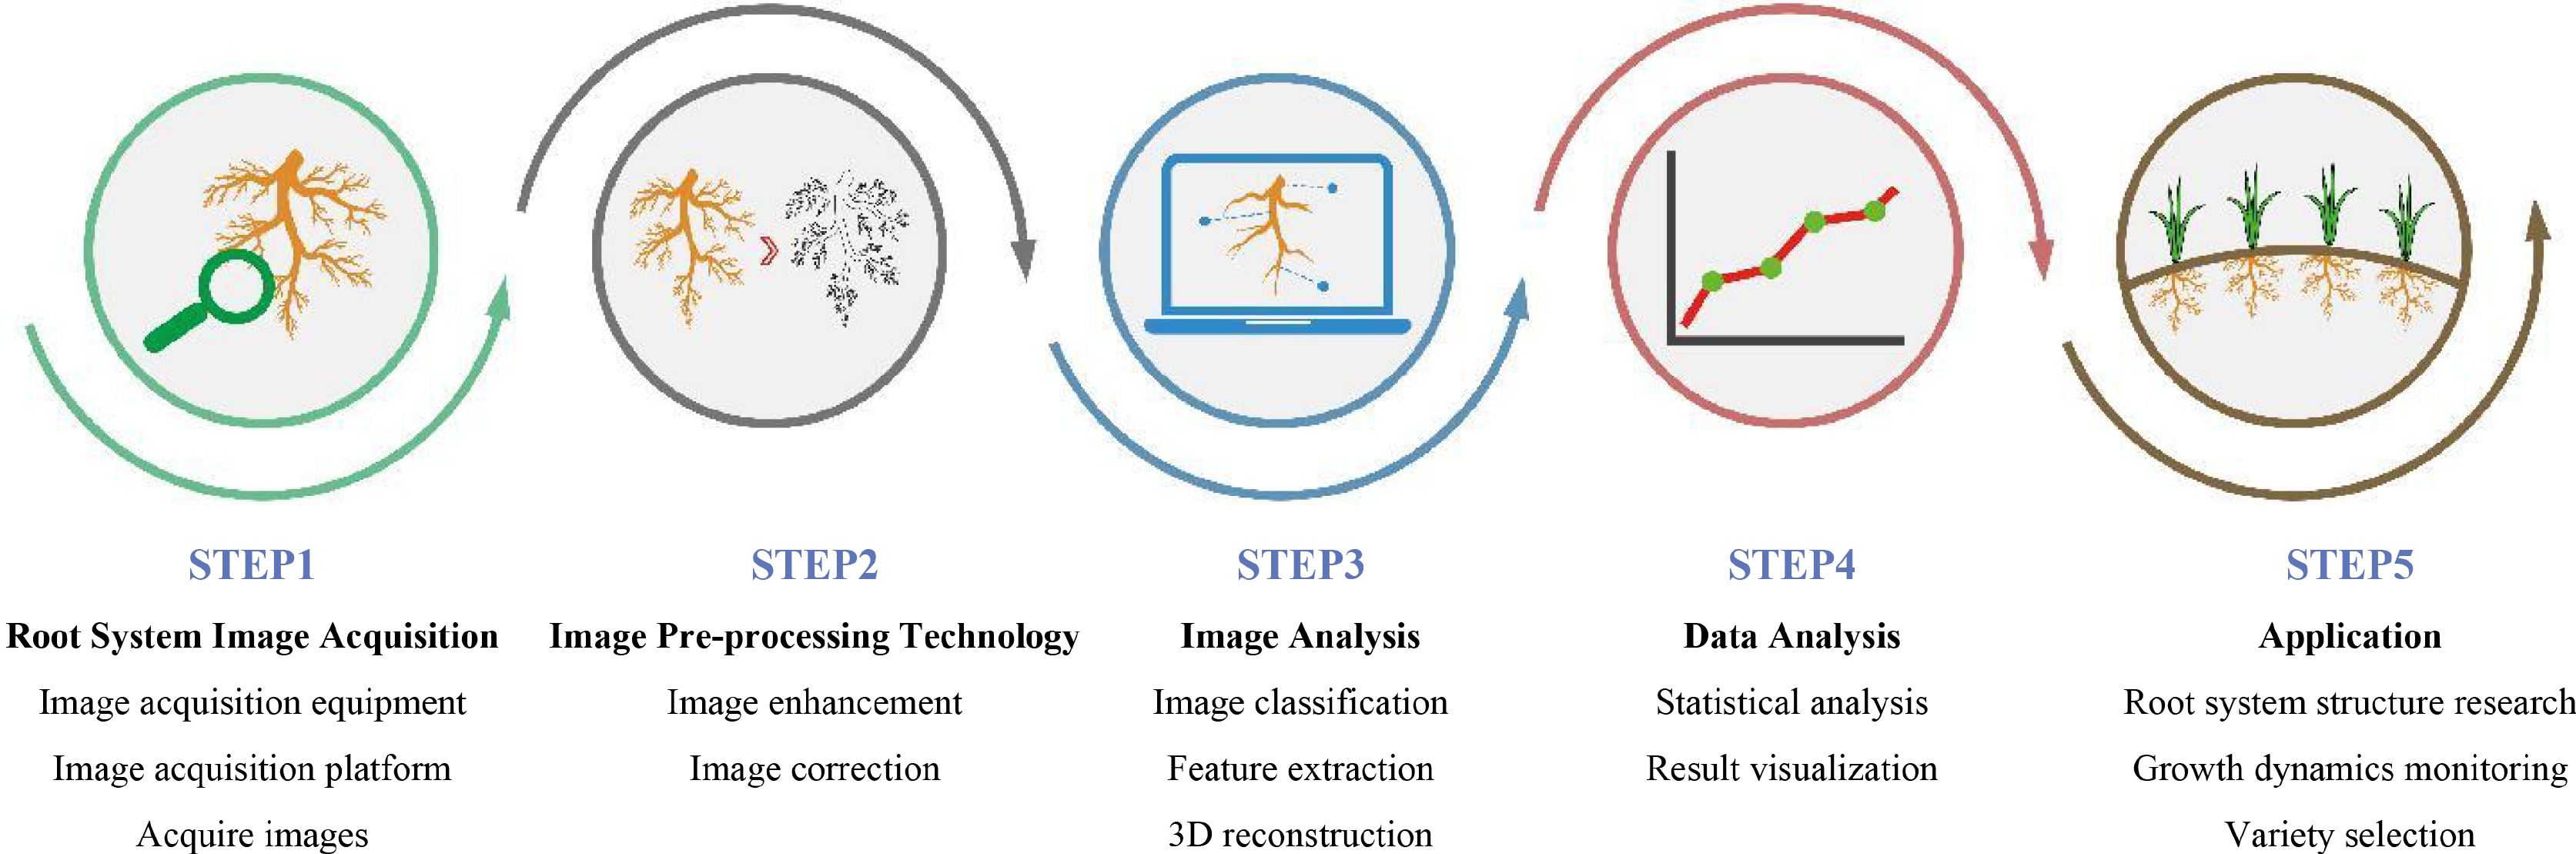
Figure 2.
Technical framework for in situ root research: acquisition, processing, analysis, interpretation, and application.
-
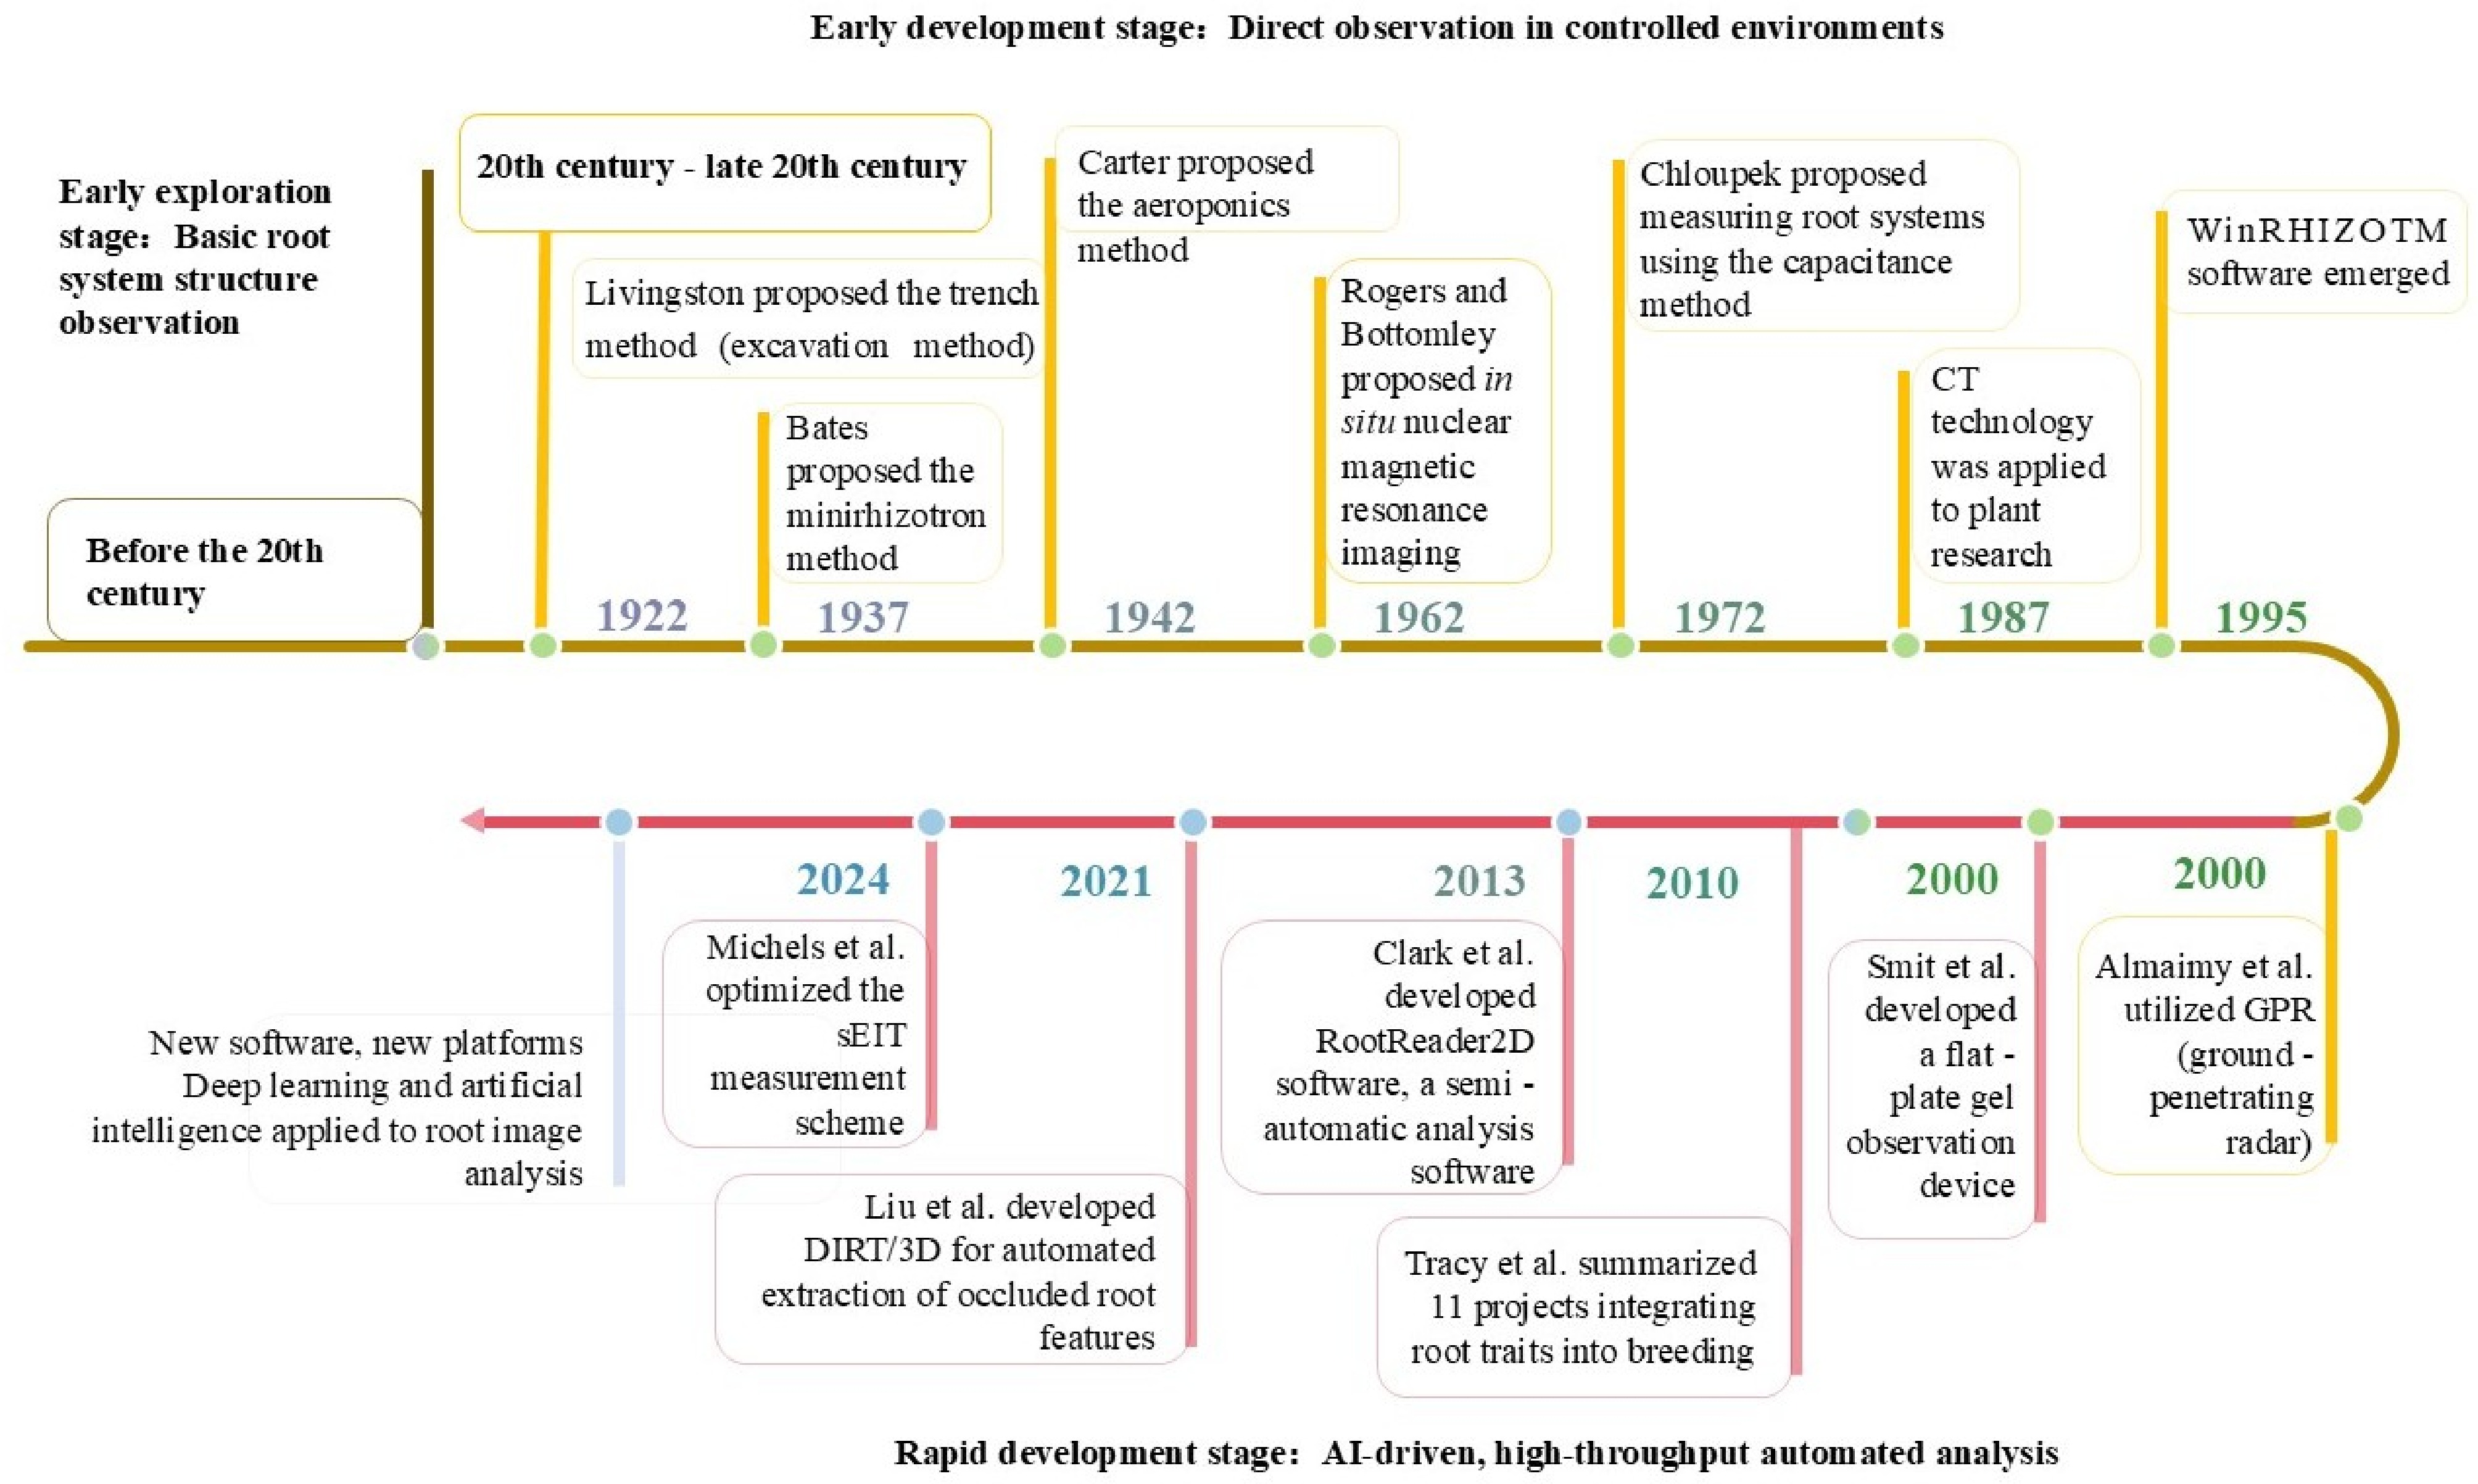
Figure 3.
Evolution of root phenotyping technologies from manual observation to AI-driven automation.
-
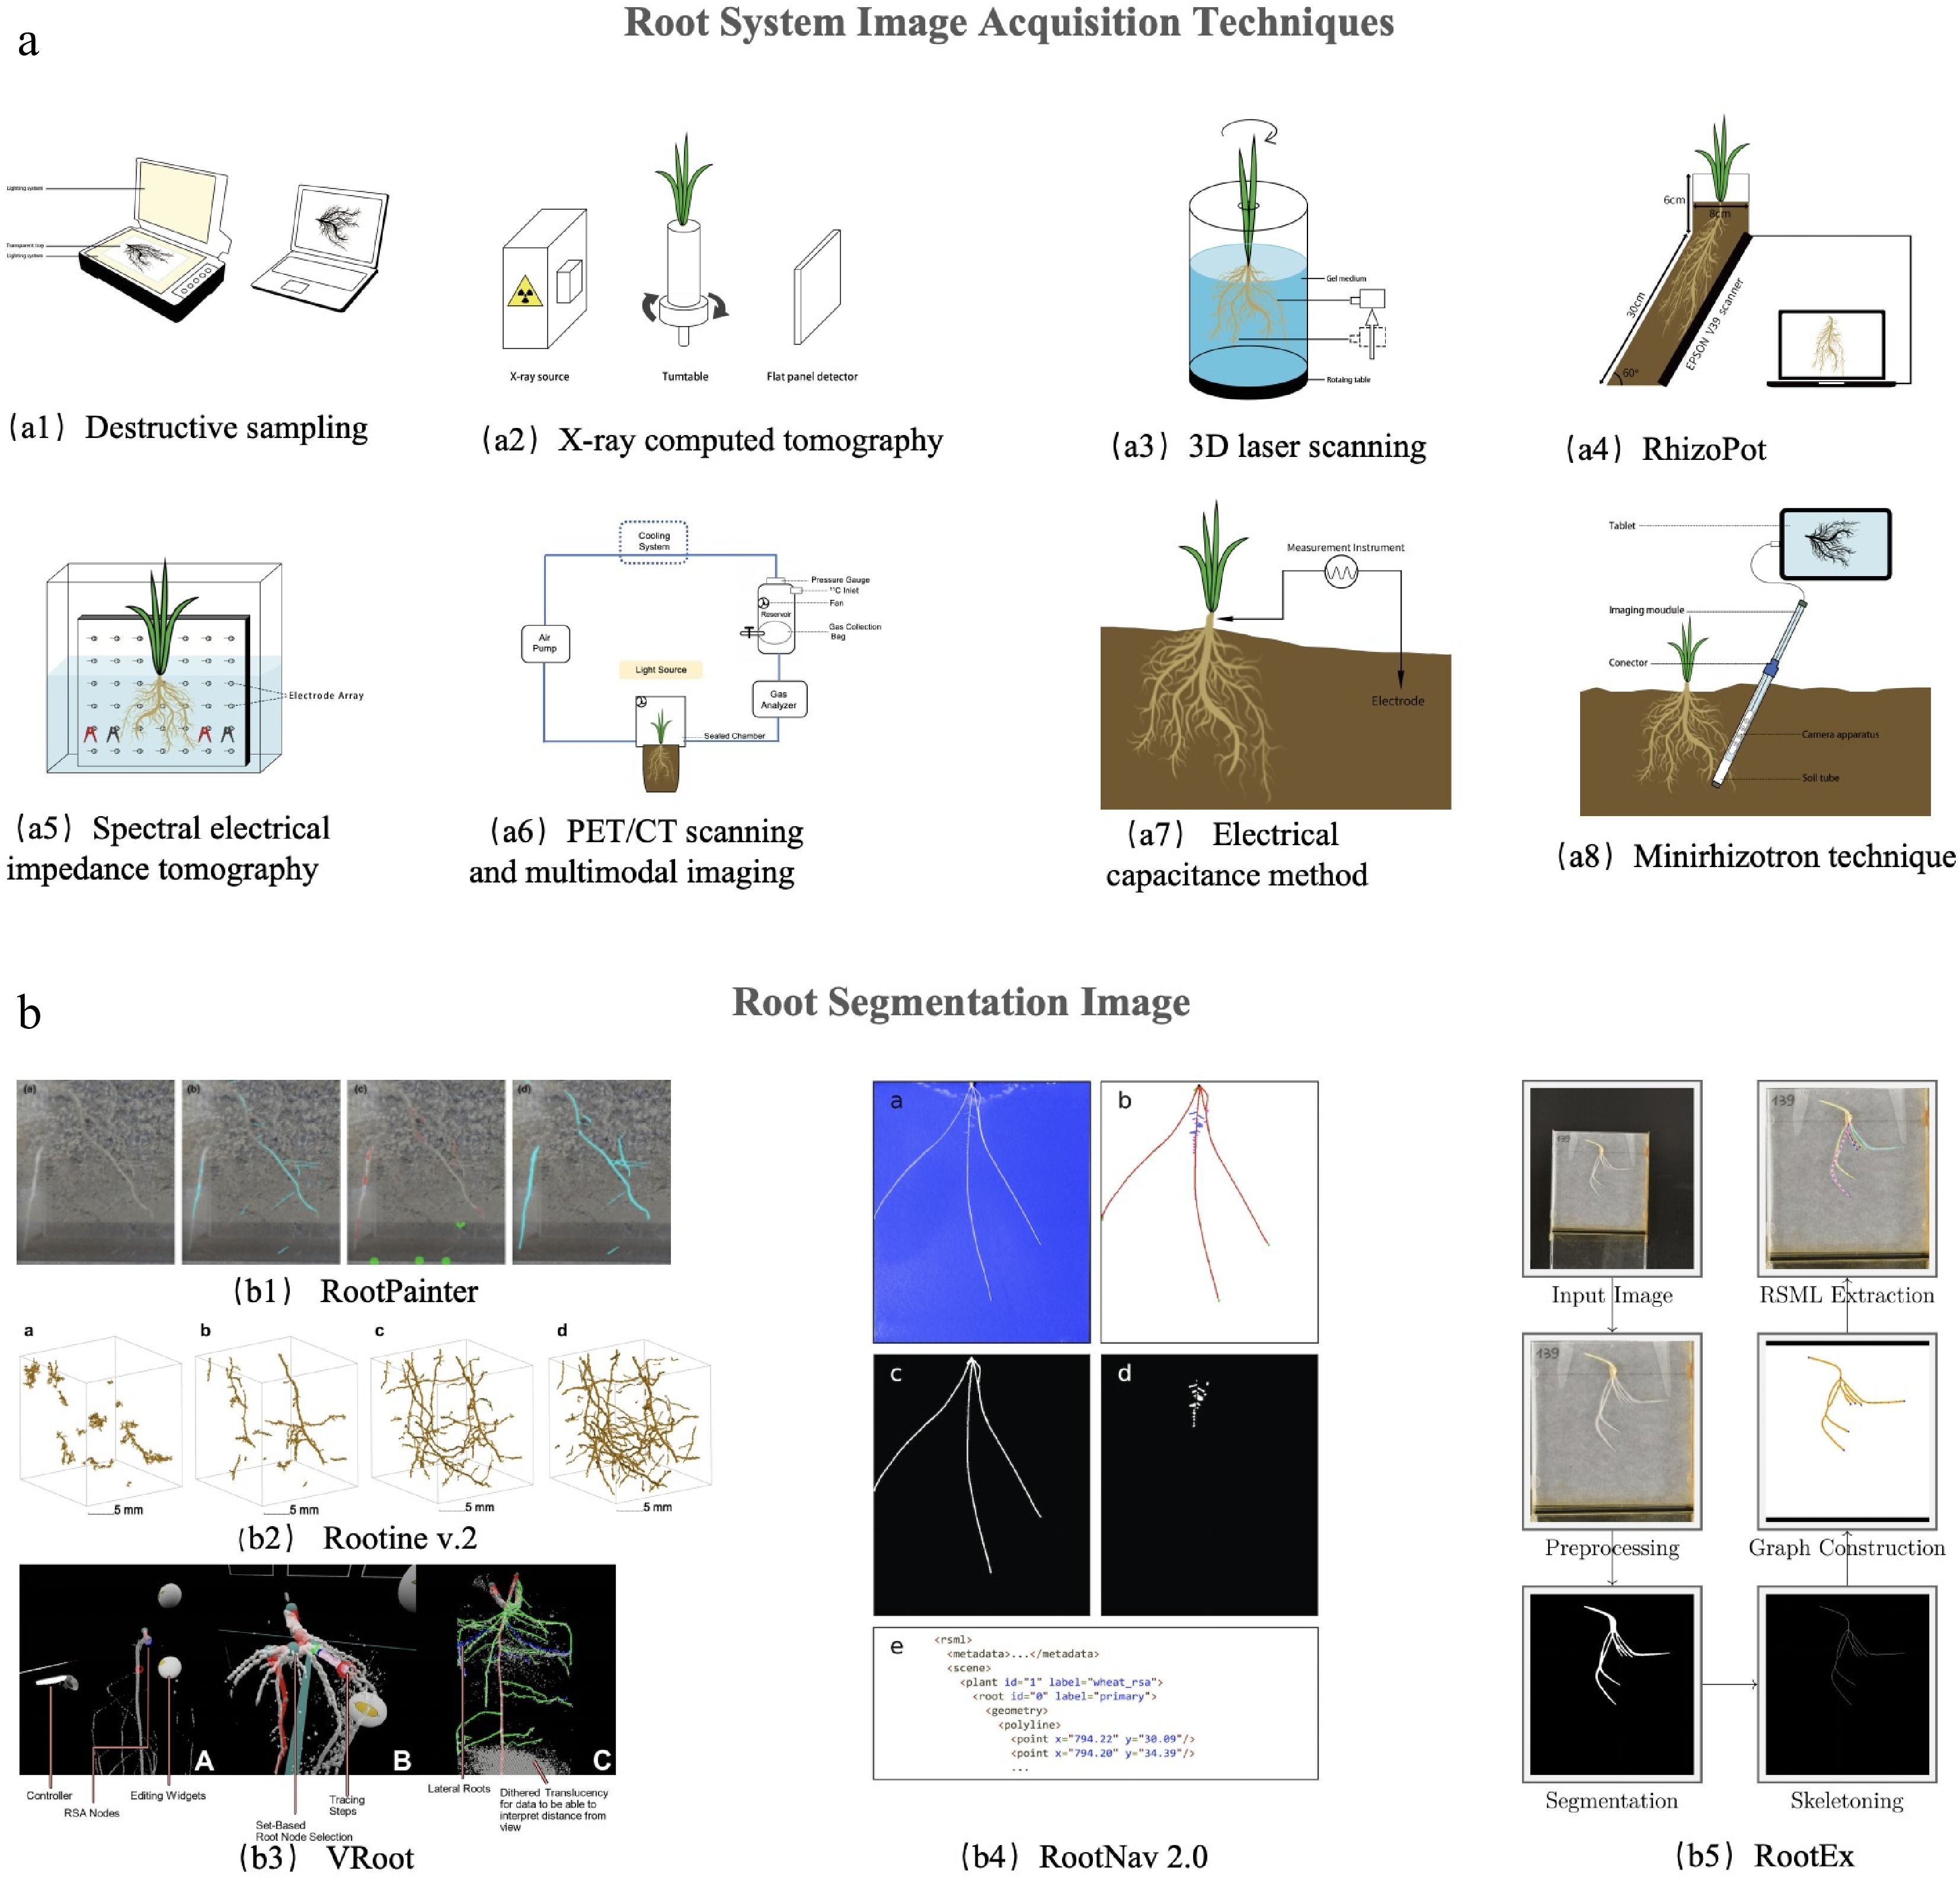
Figure 4.
Root system images. (a) Root system image acquisition techniques: (a1) destructive sampling; (a2) X-ray computed tomography;[18] (a3) 3D laser scanning[14]; (a4) RhizoPot[21]; (a5) spectral electrical impedance tomography[19]; (a6) PET/CT scanning and multimodal imaging[29]; (a7) electrical capacitance method[27]; and (a8) minirhizotron technique[24]. (b) Root segmentation images: (b1) RootPainter[51]; (b2) Rootine v.2[58]; (b3) VRoot[56]; (b4) RootNav 2.0[55]; and (b5) RootEx[57].
-
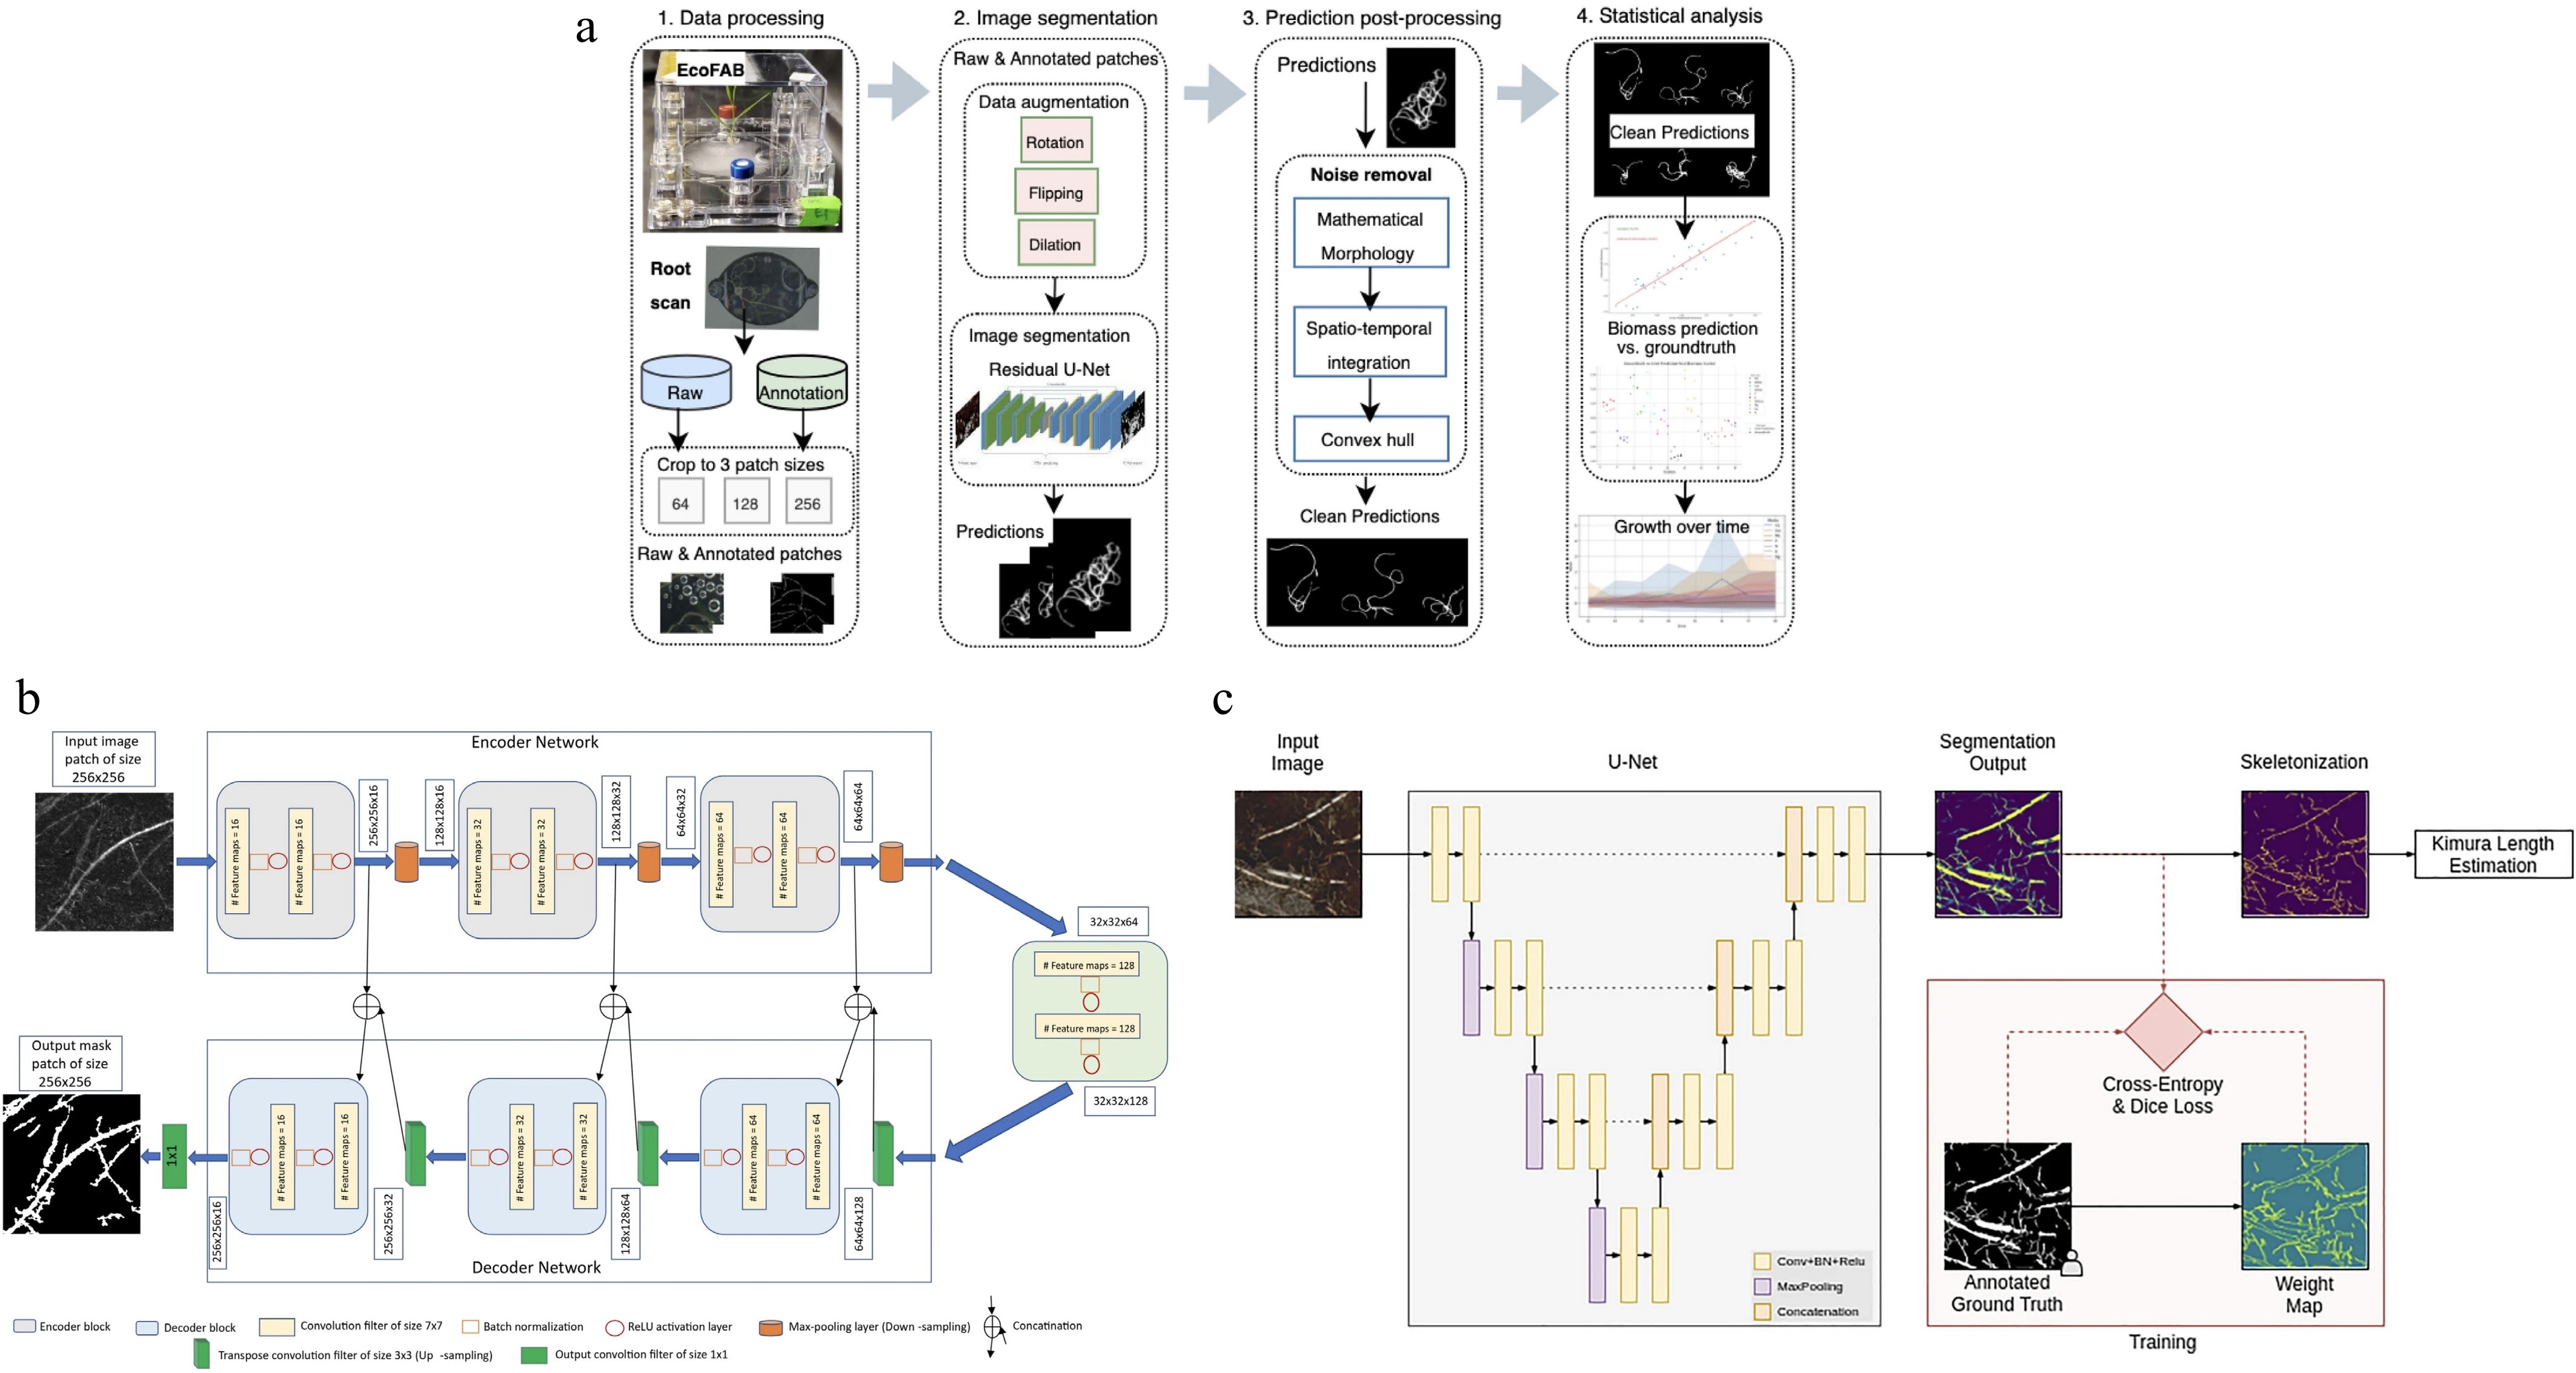
-
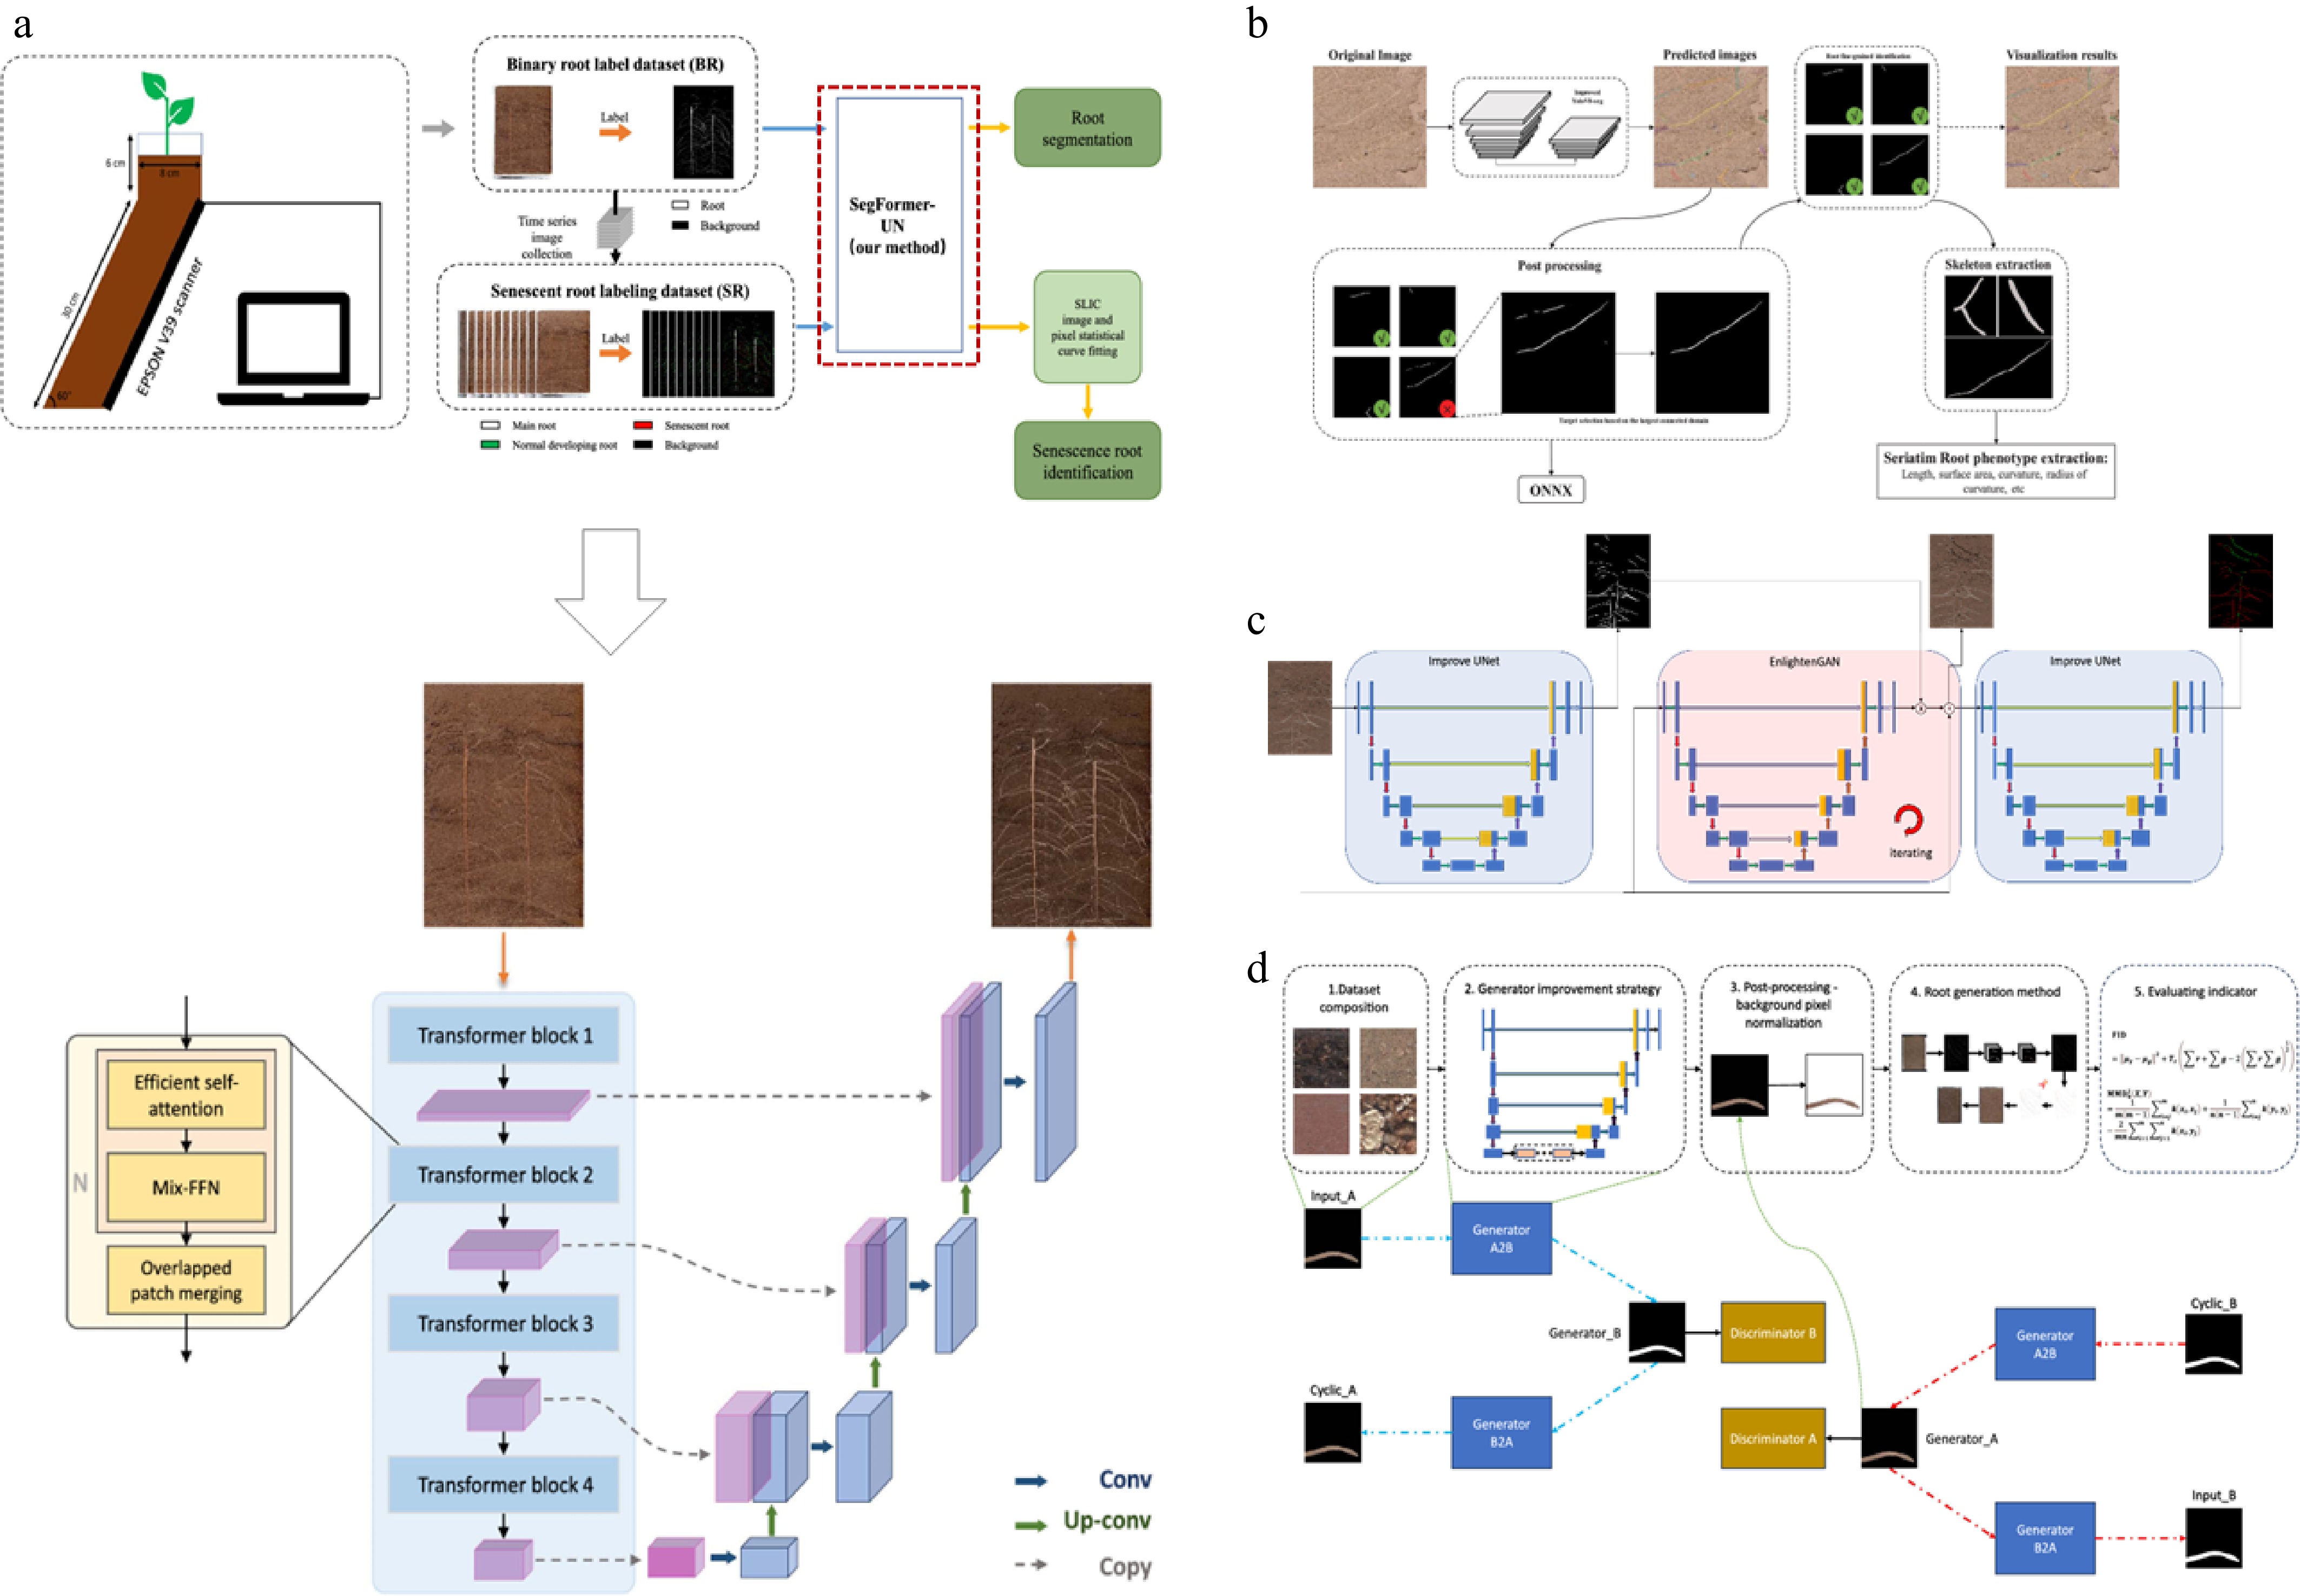
-
Model category / example Core advantages Typical root phenotyping tasks Main limitations Basic CNN / SVM Combined Models[69,80] Simple structure, stable training, moderate computational needs. Root/soil binary segmentation, preliminary feature extraction. Limited feature learning; struggles with complex structures (e.g., fine root overlap); moderate generalization. Encoder-Decoder Architectures (U-Net & Variants)[75,78] Excellent pixel-level prediction, multi-context fusion, proven in medical imaging. High-precision semantic segmentation, 2D/3D reconstruction. High dependency on annotation quality; complex; heavy for edge deployment. Attention-Enhanced Models (e.g., PSA U-Net)[72,82] Focus on key regions (root tips, branches); boosts accuracy for fine structures. Fine-grained segmentation, trait quantification (e.g., root hair density). Complex design; overfitting risk; requires task-specific tuning. Real-time Architectures (YOLO Series)[21,65] Extremely fast inference, suitable for video/large batches. In situ dynamic monitoring, high-throughput detection. Pixel-level accuracy lower than dedicated segmentation networks; may miss very fine roots. Generative Adversarial Networks (GAN/cGAN)[68,76] Generate synthetic data for augmentation; address class imbalance. Data augmentation, handling root-background imbalance, enhancing low-quality images. Hard to converge; mode collapse risk; potential bias in generated data. Multi-Model Fusion/Ensemble Strategies[79] Combine model strengths; improve robustness and accuracy for complex scenes. Comprehensive analysis in complex soil (integrated segmentation, classification, counting). Highest system complexity; difficult integration design; highest cost and deployment difficulty. Table 1.
Comparative analysis of mainstream deep learning models for root phenotyping tasks.
Figures
(6)
Tables
(1)