-
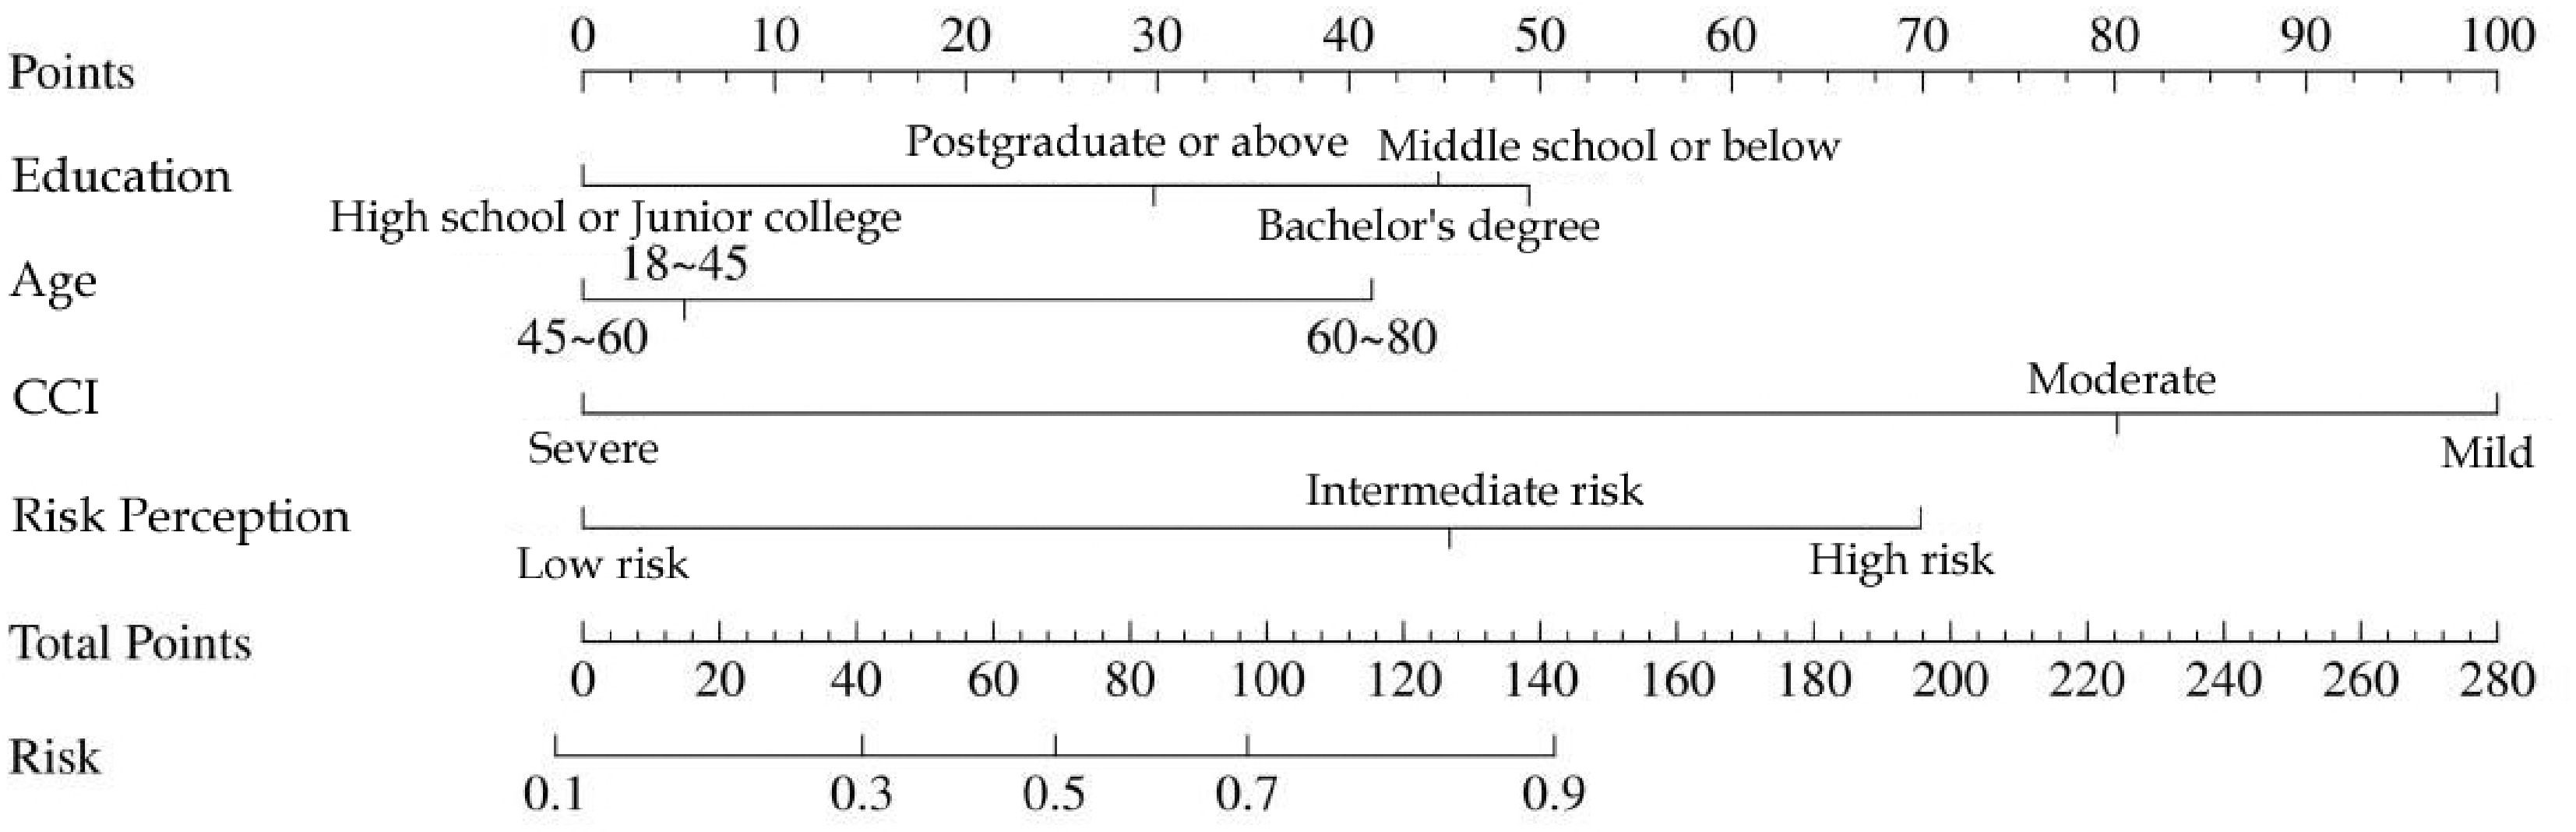
Figure 1.
Nomogram.
-
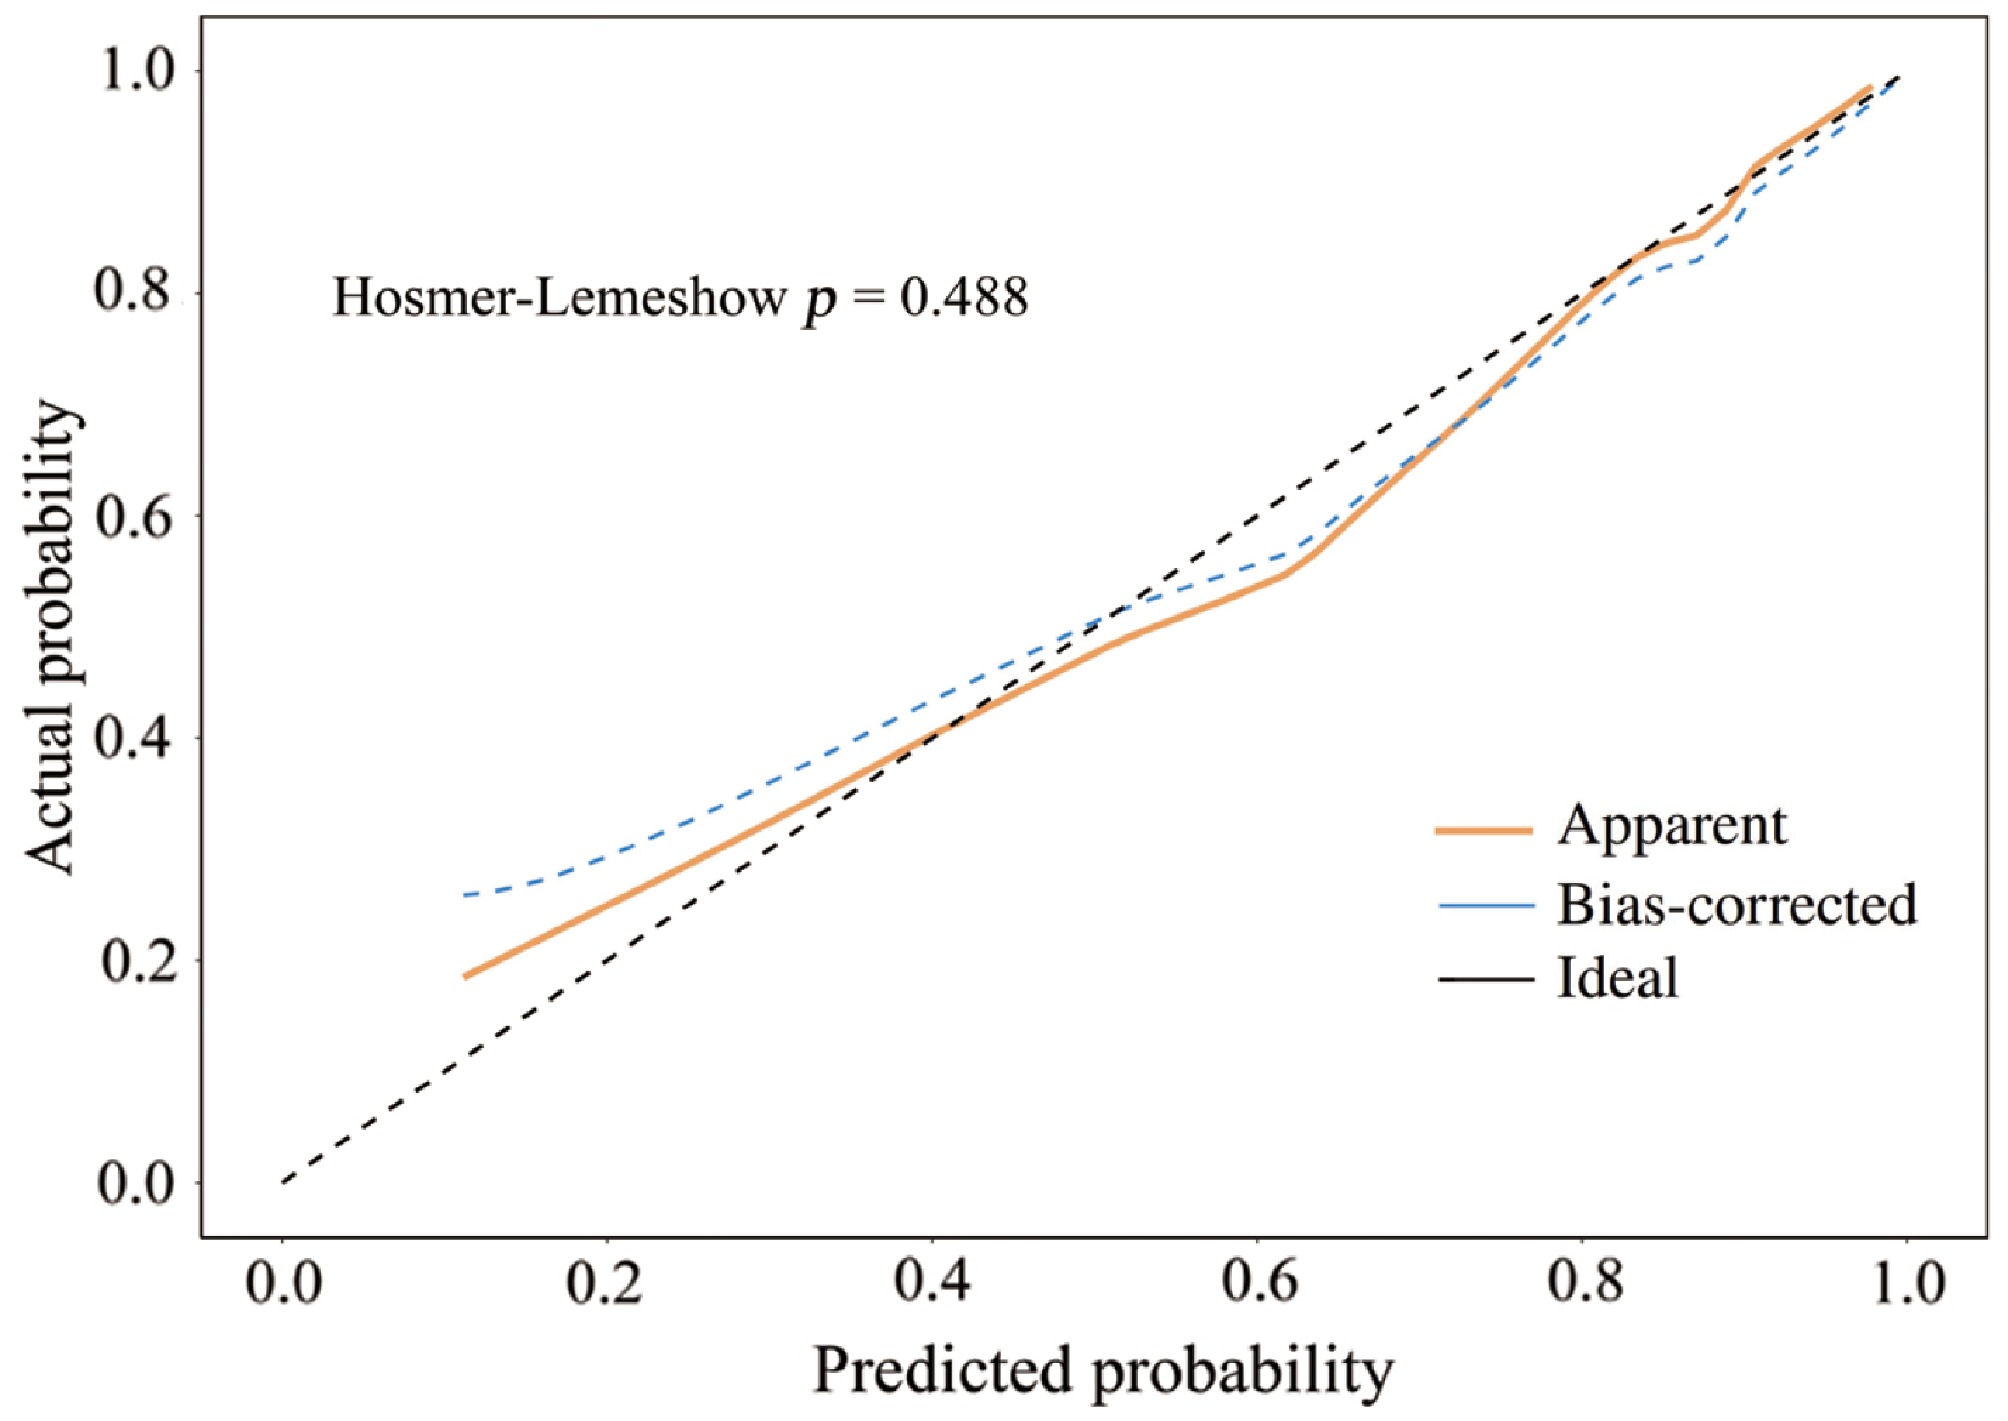
Figure 2.
Calibration plot for the training group. The predicted curve closely matches the actual values. χ2 = 6.597, p = 0.488.
-
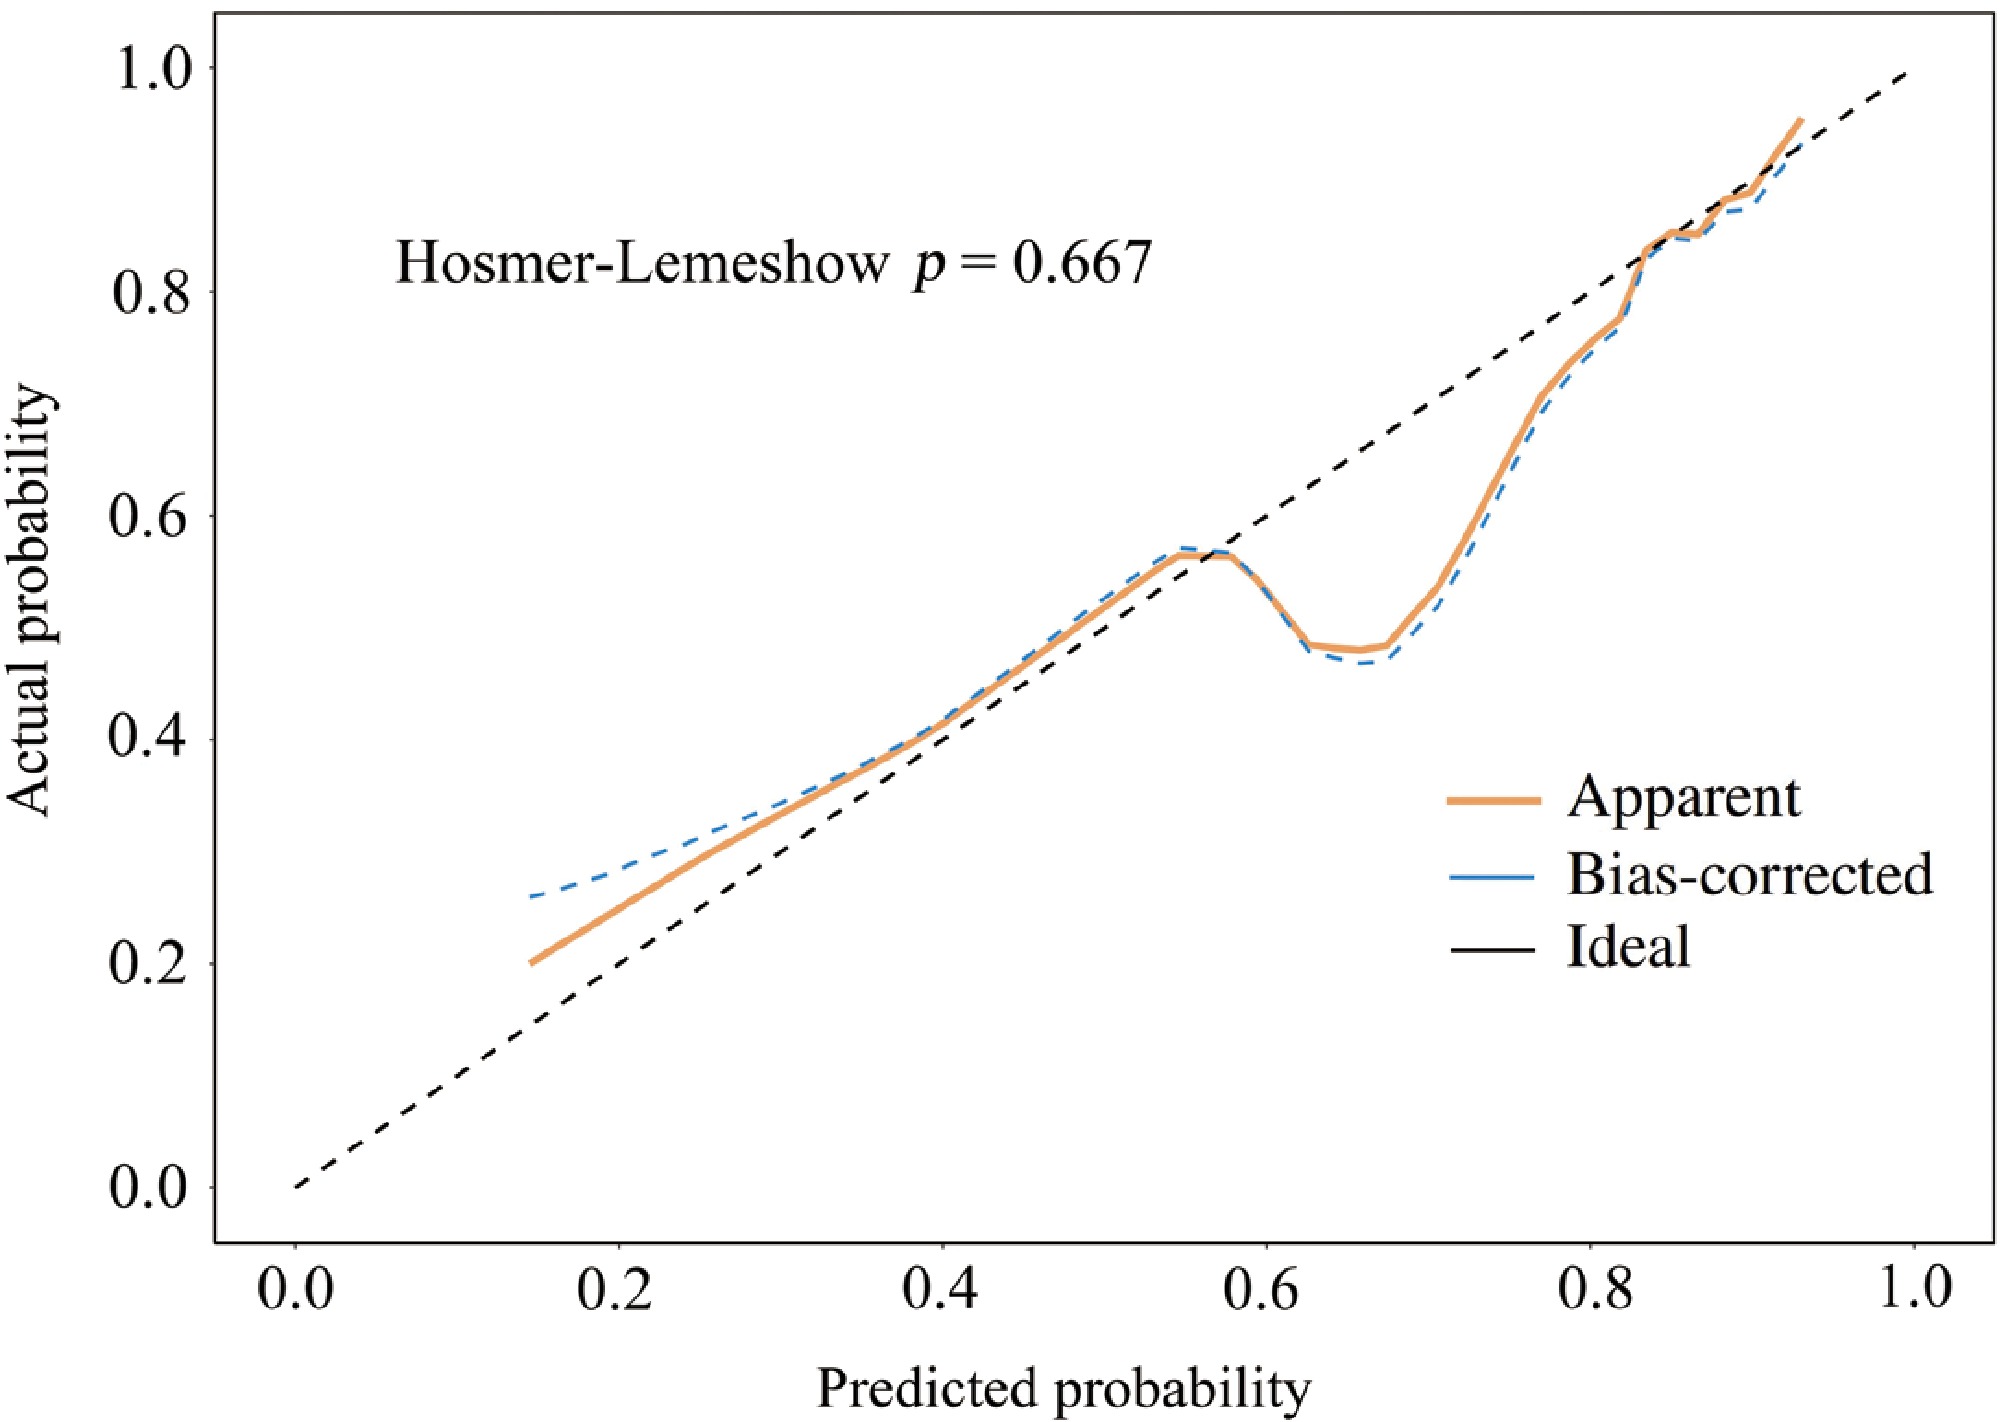
Figure 3.
Calibration plot for the validation cohorts. The predicted curve closely matches the actual values. χ2 = 4.913, p = 0.667.
-
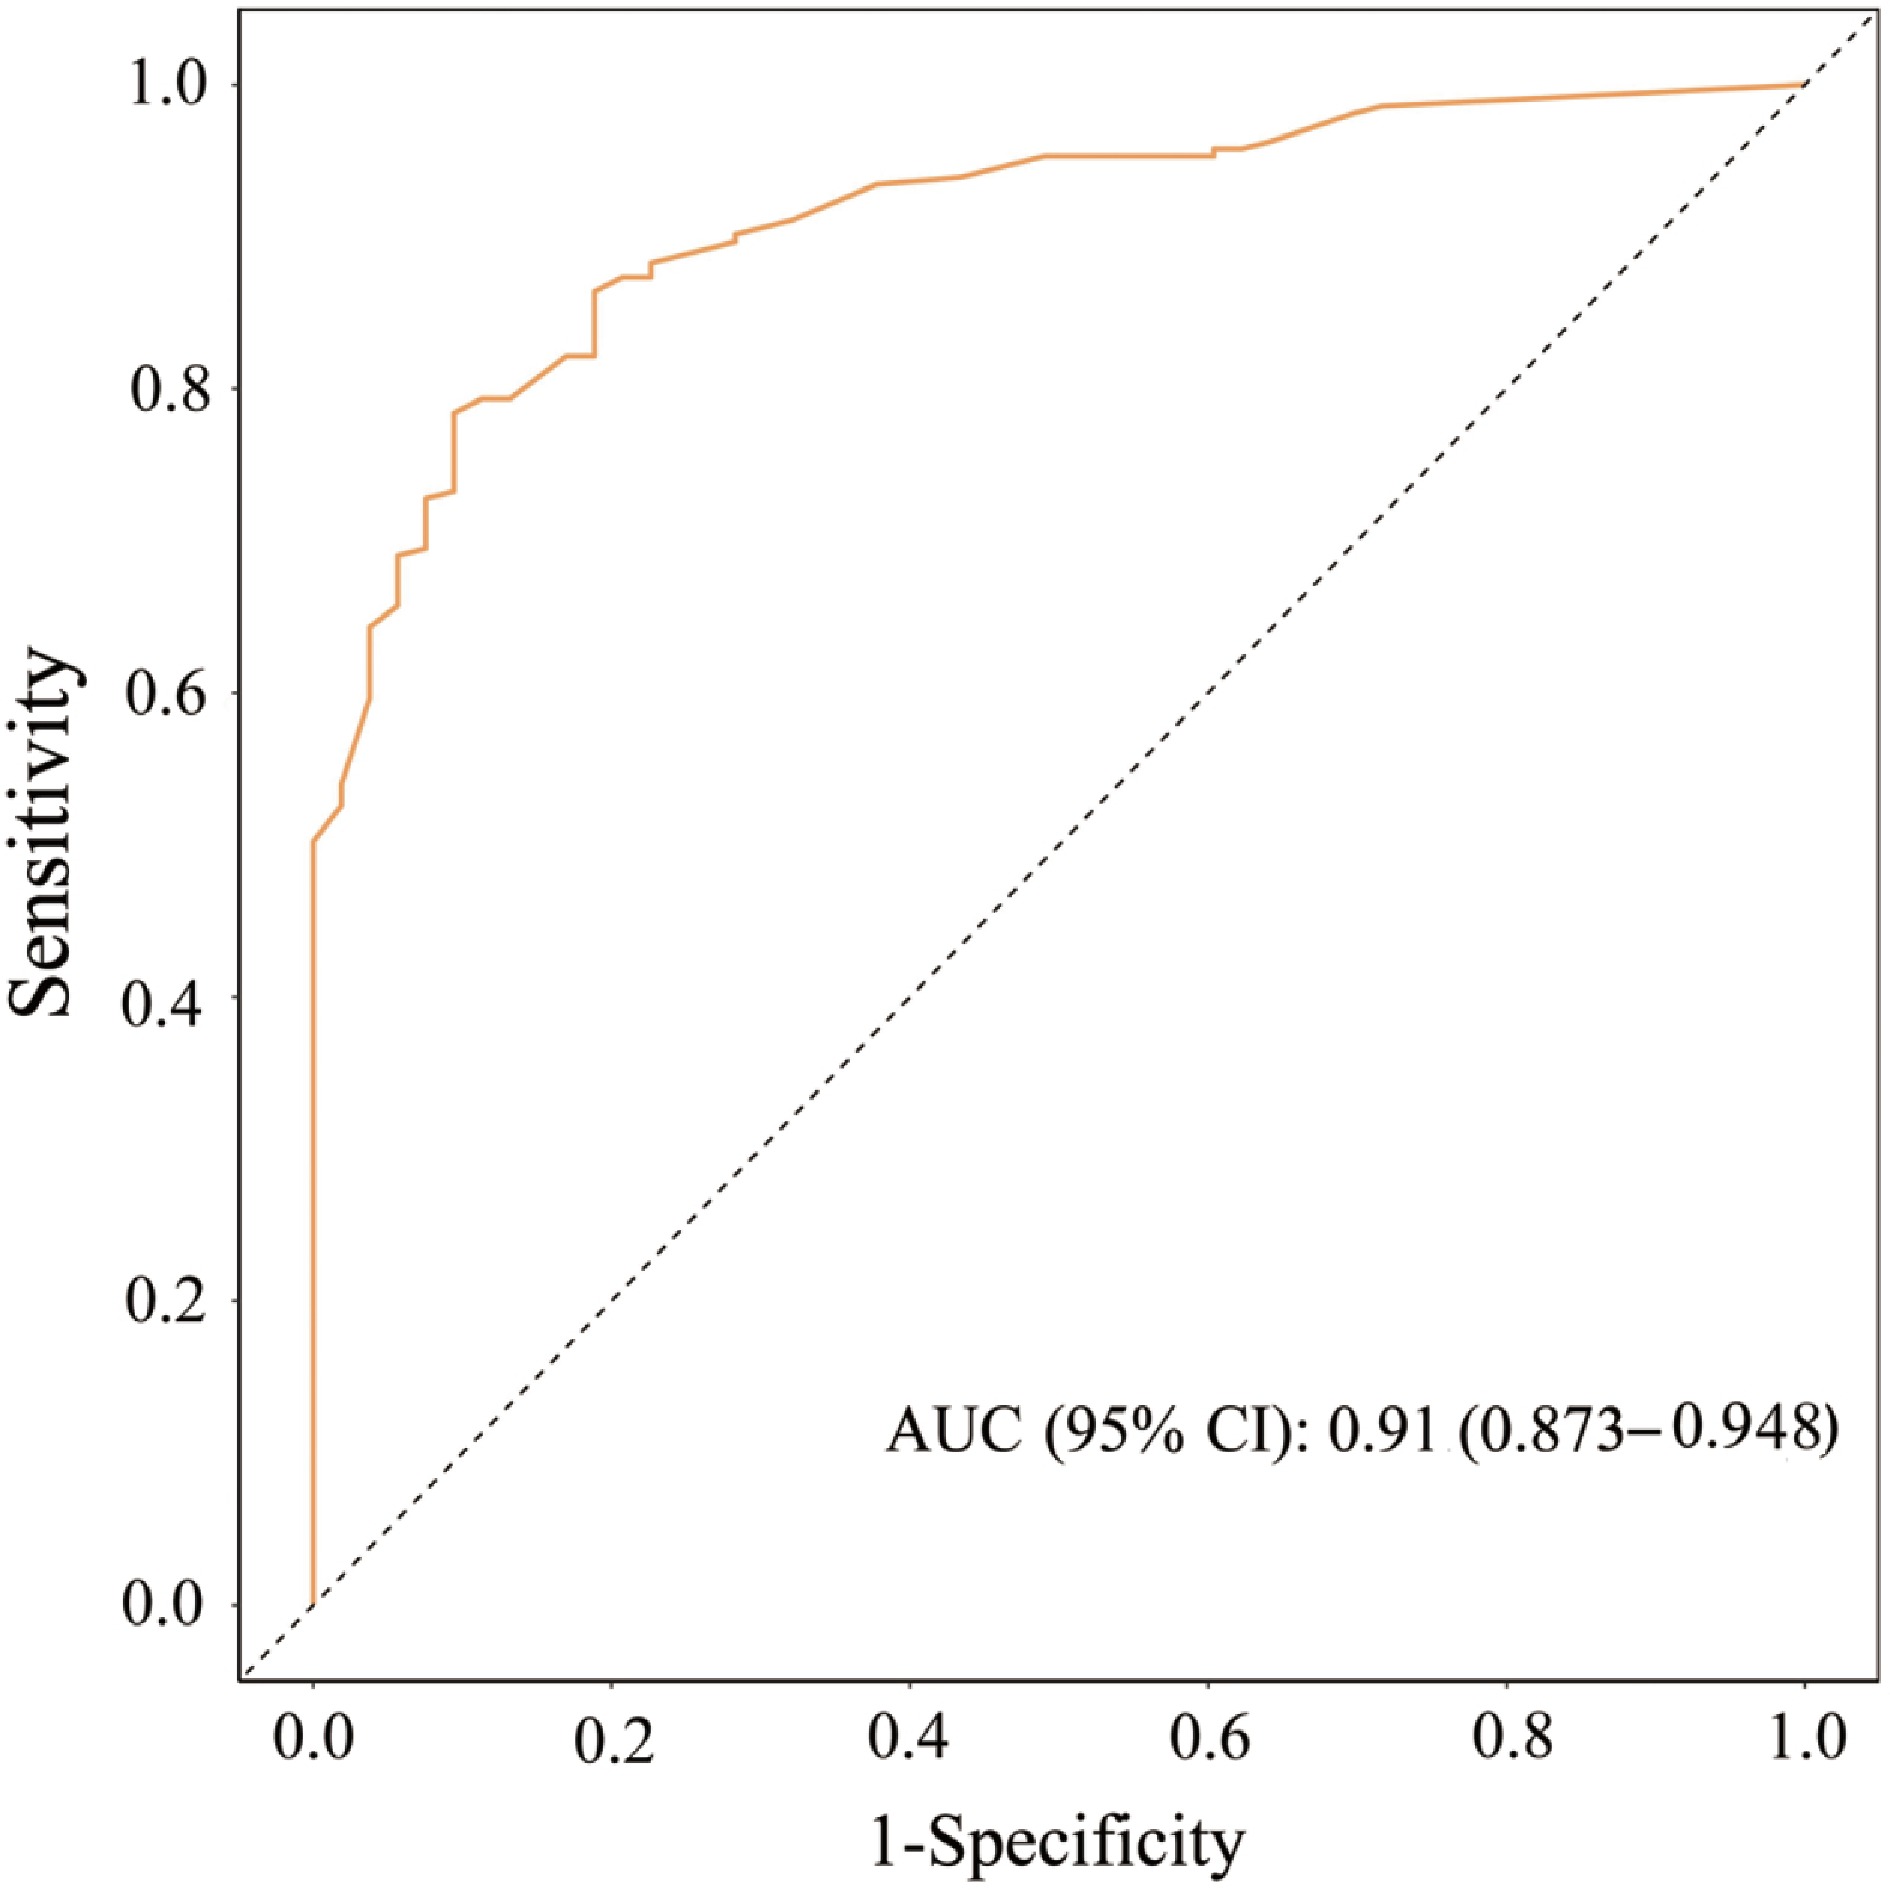
Figure 4.
ROC curve for the training group. AUC = 0.910 (95% CI: 0.873–0.948), indicating good discrimination.
-
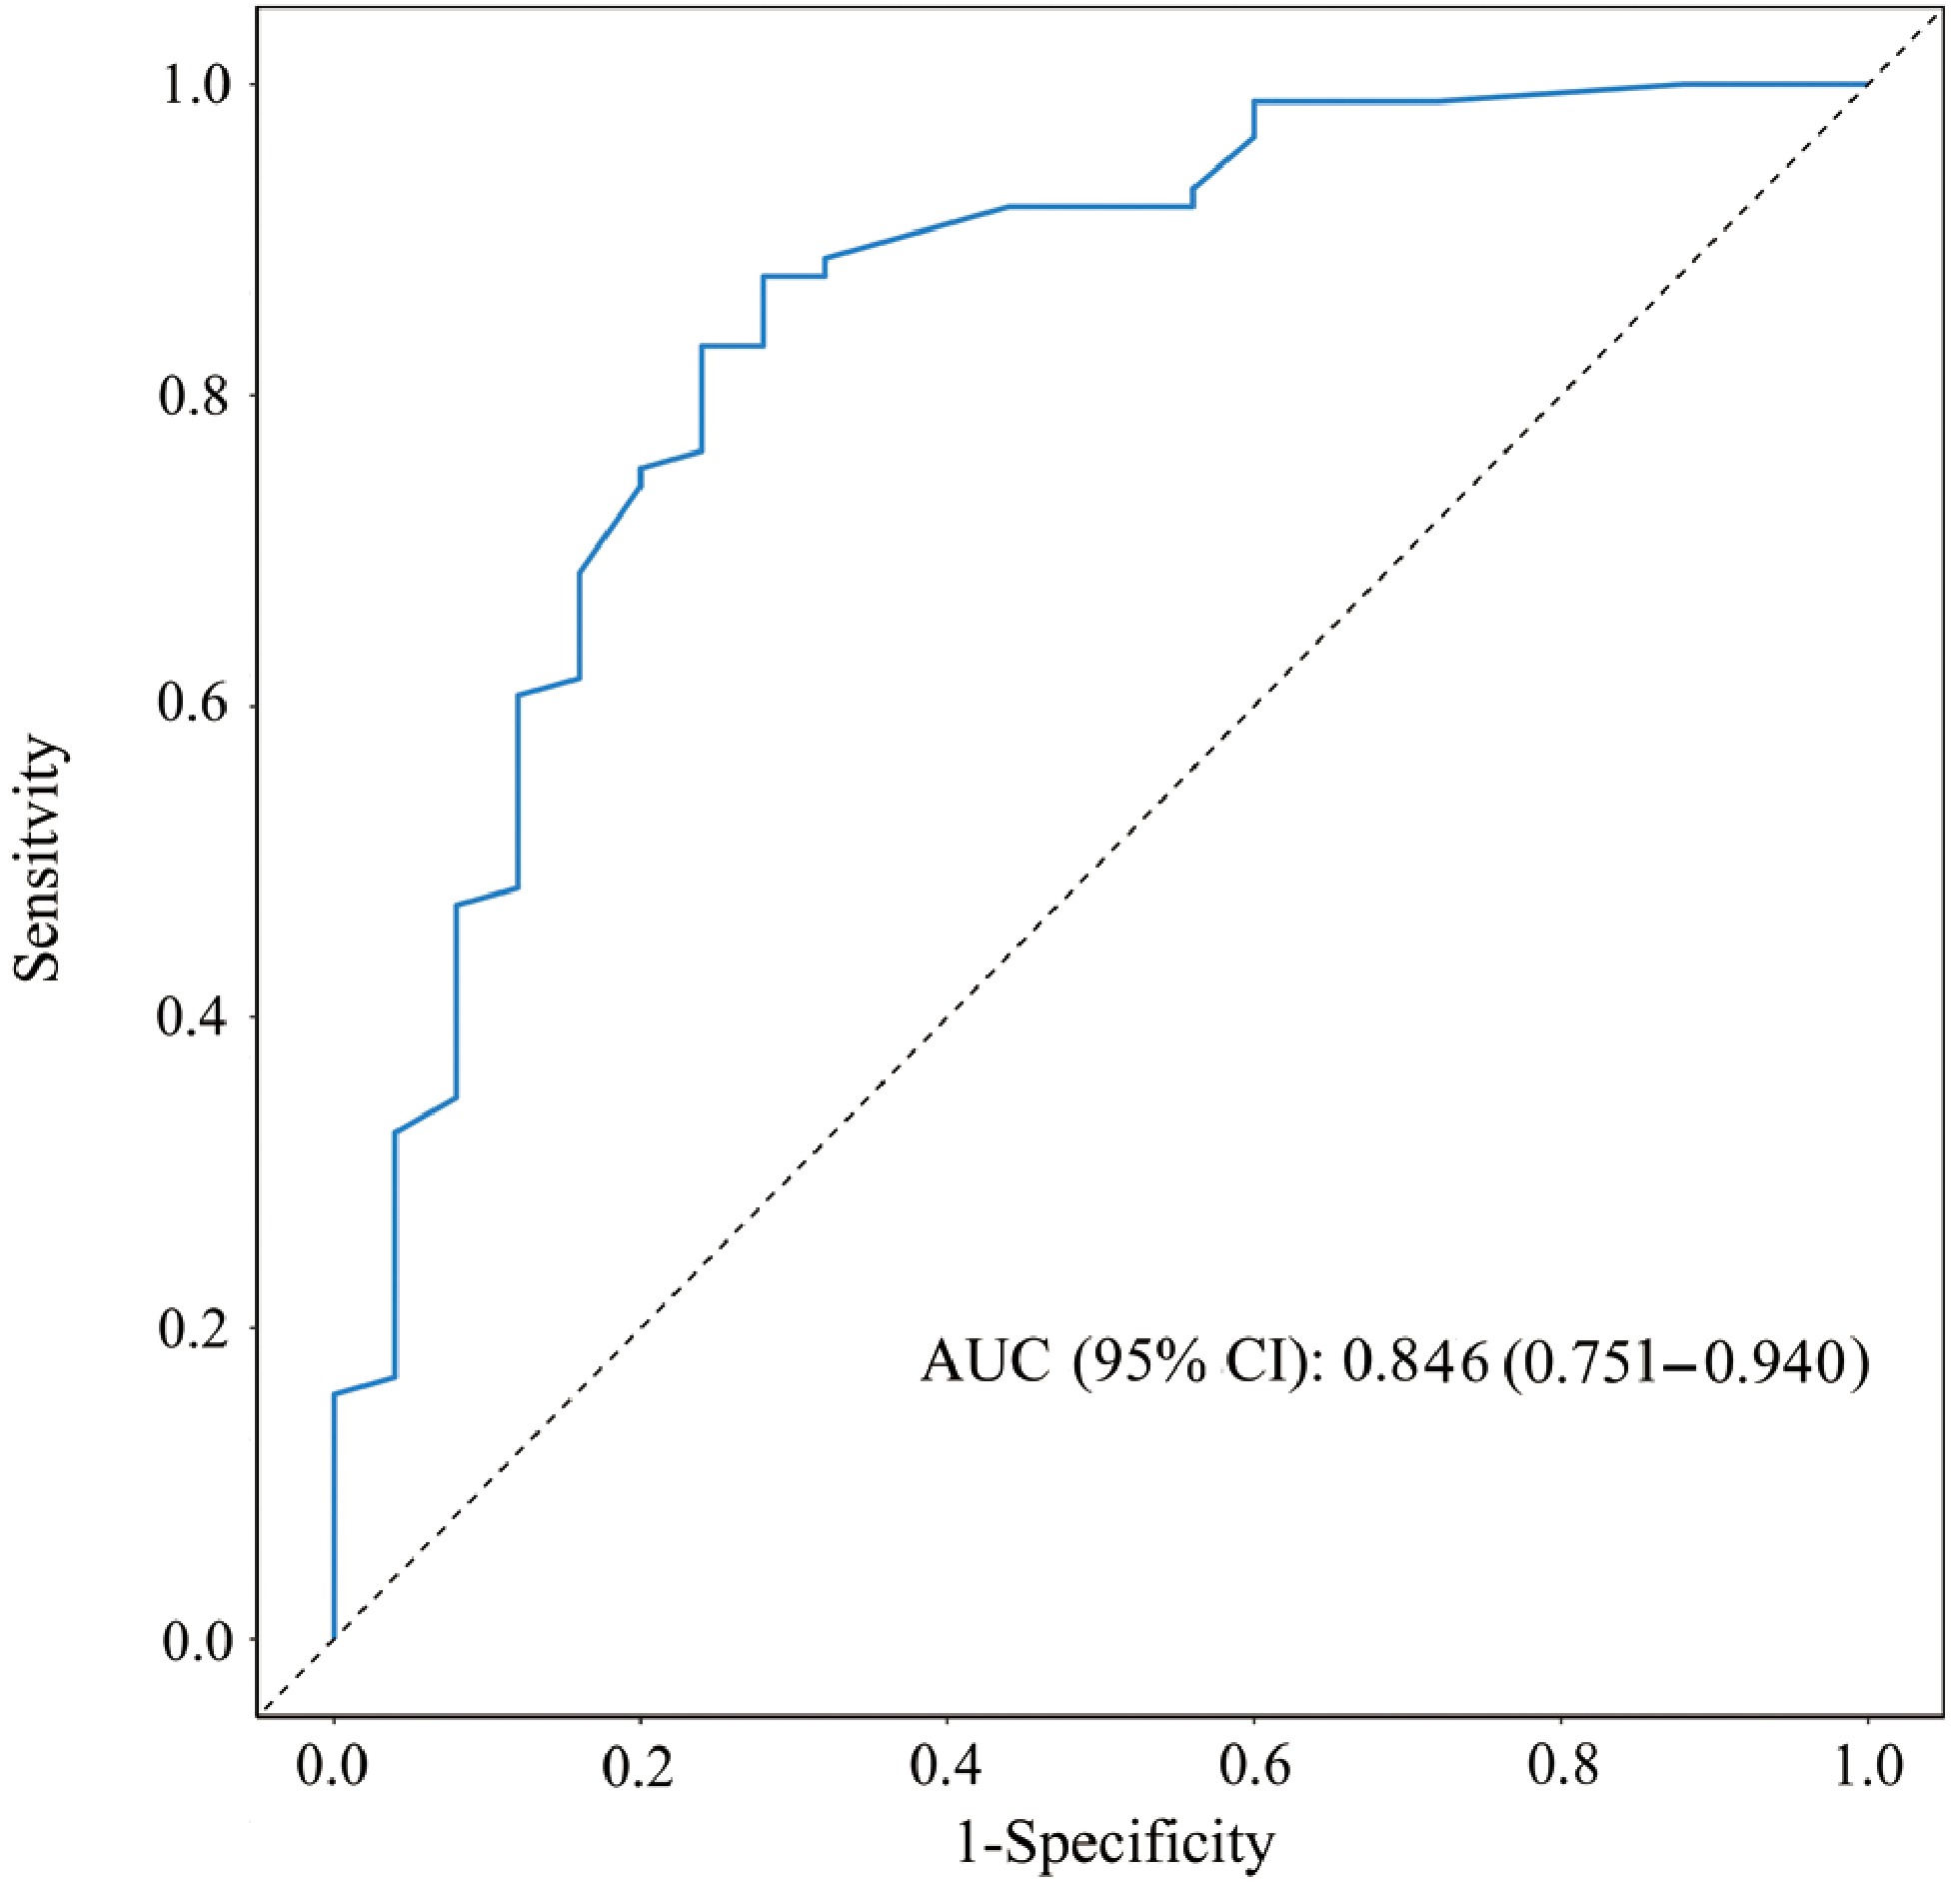
Figure 5.
ROC curve for the validation set. AUC = 0.846 (95% CI: 0.751–0.940), indicating good discrimination.
-
Variables Total (n = 380) Validation (n = 114) Model development (n = 266) Statistic p-Value Anxiety, n (%) χ2 = 0.197 0.657 No 78 (20.526) 25 (21.930) 53 (19.925) Yes 302 (79.474) 89 (78.070) 213 (80.075) Educational level, n (%) χ2 = 0.334 0.953 Junior high or below 106 (27.895) 31 (27.193) 75 (28.195) High school/junior college 120 (31.579) 36 (31.579) 84 (31.579) Undergraduate 122 (32.105) 36 (31.579) 86 (32.331) Postgraduate or above 32 (8.421) 11 (9.649) 21 (7.895) Payment method, n (%) − 1 Self-pay 6 (1.579) 2 (1.754) 4 (1.504) Rural social endowment insurance 38 (10.000) 11 (9.649) 27 (10.150) Public health insurance 8 (2.105) 2 (1.754) 6 (2.256) Medical insurance 326 (85.789) 99 (86.842) 227 (85.338) Commercial insurance 2 (0.526) 0 (0.00) 2 (0.752) Family history, n (%) χ2 = 0.504 0.478 No 113 (29.737) 31 (27.193) 82 (30.827) Yes 267 (70.263) 83 (72.807) 184 (69.173) Occupation, n (%) χ2 = 4.595 0.204 Unemployed/farmer 34 (8.947) 9 (7.895) 25 (9.398) Enterprise/institution 105 (27.632) 26 (22.807) 79 (29.699) Self-employed 175 (46.053) 62 (54.386) 113 (42.481) Retired 66 (17.368) 17 (14.912) 49 (18.421) Gender, n (%) χ2 = 0.018 0.893 Male 192 (50.526) 57 (50.000) 135 (50.752) Female 188 (49.474) 57 (50.000) 131 (49.248) Relative type, n (%) χ2 = 3.884 0.143 Parent 46 (12.105) 14 (12.281) 32 (12.030) Sibling 183 (48.158) 63 (55.263) 120 (45.113) Child 151 (39.737) 37 (32.456) 114 (42.857) Health belief group, n (%) χ2 = 0.555 0.758 Low (36–84 points) 38 (10.000) 13 (11.404) 25 (9.398) Medium (85–132 points) 290 (76.316) 87 (76.316) 203 (76.316) High (133–180 points) 52 (13.684) 14 (12.281) 38 (14.286) Age group, n (%) χ2 = 2.529 0.282 18–45 207 (54.474) 56 (49.123) 151 (56.767) 45–60 131 (34.474) 46 (40.351) 85 (31.955) 60–80 42 (11.053) 12 (10.526) 30 (11.278) Sleep quality group, n (%) χ2=2.978 0.395 Very good (0–5 points) 9 (2.368) 5 (4.386) 4 (1.504) Fairly good (6–10 points) 44 (11.579) 12 (10.526) 32 (12.030) Average (11–15 points) 208 (54.737) 62 (54.386) 146 (54.887) Very poor (16–21 points) 119 (31.316) 35 (30.702) 84 (31.579) Income per capita, n (%) − 0.643 ≤ 3,000 37 (9.737) 11 (9.649) 26 (9.774) 3,000–6,000 283 (74.474) 89 (78.070) 194 (72.932) 6,000–9,000 53 (13.947) 12 (10.526) 41 (15.414) > 9,000 7 (1.842) 2 (1.754) 5 (1.880) CCI group, n (%) χ2 = 0.049 0.976 Mild (1–2 points) 114 (30.000) 34 (29.825) 80 (30.075) Moderate (3–4 points) 52 (13.684) 15 (13.158) 37 (13.910) Severe (≥ 5 points) 214 (56.316) 65 (57.018) 149 (56.015) Risk perception group, n (%) χ2 = 0.340 0.844 Low (1–2 points) 175 (46.053) 54 (47.368) 121 (45.489) Moderate (3 points) 104 (27.368) 32 (28.070) 72 (27.068) High (4–5 points) 101 (26.579) 28 (24.561) 73 (27.444) Household size, n (%) χ2 = 7.560 0.182 One person 52 (13.684) 13 (11.404) 39 (14.662) Two persons 48 (12.632) 20 (17.544) 28 (10.526) Three persons 183 (48.158) 59 (51.754) 124 (46.617) Four persons 56 (14.737) 13 (11.404) 43 (16.165) Five persons 31 (8.158) 8 (7.018) 23 (8.647) ≥ Six persons 10 (2.632) 1 (0.877) 9 (3.383) χ2: Chi-square test, −: Fisher exact. Table 1.
Comparison of baseline characteristics between model development and validation cohorts.
-
Variables Total (n = 266) Non-anxious (n = 53) Anxious (n = 213) Statistic p-Value Educational level, n (%) χ2 = 40.601 < 0.001 Junior high or below 75 (28.195) 33 (62.264) 42 (19.718) High school/junior college 84 (31.579) 7 (13.208) 77 (36.150) Undergraduate 86 (32.331) 8 (15.094) 78 (36.620) Postgraduate or above 21 (7.895) 5 (9.434) 16 (7.512) Payment method, n (%) − 0.804 Self-pay 4 (1.504) 0 (0.00) 4 (1.878) Rural social endowment insurance 27 (10.150) 5 (9.434) 22 (10.329) Public health insurance 6 (2.256) 0 (0.00) 6 (2.817) Medical insurance 227 (85.338) 48 (90.566) 179 (84.038) Commercial insurance 2 (0.752) 0 (0.00) 2 (0.939) Family history, n (%) χ2 = 1.231 0.267 No 82 (30.827) 13 (24.528) 69 (32.394) Yes 184 (69.173) 40 (75.472) 144 (67.606) Occupation, n (%) χ2 = 1.518 0.678 Unemployed/farmer 25 (9.398) 4 (7.547) 21 (9.859) Enterprise/institution 79 (29.699) 13 (24.528) 66 (30.986) Self-employed 113 (42.481) 26 (49.057) 87 (40.845) Retired 49 (18.421) 10 (18.868) 39 (18.310) Gender, n (%) χ2 = 0.076 0.783 Male 135 (50.752) 26 (49.057) 109 (51.174) Female 131 (49.248) 27 (50.943) 104 (48.826) Relative type, n (%) χ2 = 6.895 0.032 Parent 32 (12.030) 11 (20.755) 21 (9.859) Sibling 120 (45.113) 26 (49.057) 94 (44.131) Child 114 (42.857) 16 (30.189) 98 (46.009) Health belief group, n (%) χ2 = 12.594 0.002 Low (36–84 points) 25 (9.398) 11 (20.755) 14 (6.573) Medium (85–132 points) 203 (76.316) 39 (73.585) 164 (76.995) High (133–180 points) 38 (14.286) 3 (5.660) 35 (16.432) Age group, n (%) χ2 = 20.123 < 0.001 18–45 151 (56.767) 17 (32.075) 134 (62.911) 45–60 85 (31.955) 23 (43.396) 62 (29.108) 60–80 30 (11.278) 13 (24.528) 17 (7.981) Sleep quality group, n (%) − 0.274 Very good (0–5 points) 4 (1.504) 0 (0.00) 4 (1.878) Fairly good (6–10 points) 32 (12.030) 8 (15.094) 24 (11.268) Average (11–15 points) 146 (54.887) 24 (45.283) 122 (57.277) Very poor (16–21 points) 84 (31.579) 21 (39.623) 63 (29.577) Income Per Capita, n (%) − 0.48 ≤ 3,000 26 (9.774) 8 (15.094) 18 (8.451) 3,000–6,000 194 (72.932) 37 (69.811) 157 (73.709) 6,000–9,000 41 (15.414) 7 (13.208) 34 (15.962) > 9,000 5 (1.880) 1 (1.887) 4 (1.878) CCI Group, n (%) χ2 = 59.712 < 0.001 Mild (1–2 points) 80 (30.075) 39 (73.585) 41 (19.249) Moderate (3–4 points) 37 (13.910) 2 (3.774) 35 (16.432) Severe (≥ 5 points) 149 (56.015) 12 (22.642) 137 (64.319) Risk perception group, n (%) χ2 = 37.635 < 0.001 Low (1–2 points) 121 (45.489) 44 (83.019) 77 (36.150) Moderate (3 points) 72 (27.068) 4 (7.547) 68 (31.925) High (4–5 points) 73 (27.444) 5 (9.434) 68 (31.925) Household size, n (%) χ2 = 2.948 0.708 One person 39 (14.662) 6 (11.321) 33 (15.493) Two persons 28 (10.526) 4 (7.547) 24 (11.268) Three persons 124 (46.617) 24 (45.283) 100 (46.948) Four persons 43 (16.165) 10 (18.868) 33 (15.493) Five persons 23 (8.647) 6 (11.321) 17 (7.981) Six persons or more 9 (3.383) 3 (5.660) 6 (2.817) χ2: Chi-square test, −: Fisher exact. p-Values in boldface indicate the statistical significance Table 2.
Comparative analysis of characteristics in the training group.
-
Variables β S.E Z p-Value OR (95% CI) Educational level, n (%) Junior high or below 1.000 (Ref.) High school/junior college 2.157 0.458 4.707 < 0.001 8.643 (3.521–21.217) Undergraduate 2.036 0.438 4.648 < 0.001 7.661 (3.246–18.079) Postgraduate or above 0.922 0.563 1.639 0.101 2.514 (0.835–7.575) Payment method, n (%) Self-pay 1.000 (Ref.) Rural social endowment insurance −16.084 1978.090 −0.008 0.994 0.000 (0.000–Inf) Public health insurance 0.000 2553.703 0.000 1.000 1.000 (0.000–Inf) Medical insurance −16.250 1978.090 −0.008 0.993 0.000 (0.000–Inf) Commercial insurance 0.000 3426.153 0.000 1.000 1.000 (0.000–Inf) Family history, n (%) No 1.000 (Ref.) Yes −0.388 0.351 −1.105 0.269 0.678 (0.341–1.350) Occupation, n (%) Unemployed/farmer 1.000 (Ref.) Enterprise/institution −0.034 0.624 −0.054 0.957 0.967 (0.284–3.287) Self-employed −0.450 0.590 −0.764 0.445 0.637 (0.201–2.024) Retired −0.297 0.651 −0.457 0.648 0.743 (0.208–2.659) Gender, n (%) Male 1.000 (Ref.) Female −0.085 0.307 −0.276 0.783 0.919 (0.503–1.677) Relative type, n (%) Parent 1.000 (Ref.) Sibling 0.639 0.433 1.474 0.140 1.894 (0.810–4.426) Child 1.166 0.460 2.536 0.011 3.208 (1.303–7.898) Health belief group, n (%) Low (36–84 points) 1.000 (Ref.) Medium (85–132 points) 1.195 0.441 2.713 0.007 3.304 (1.393–7.835) High (133–180 points) 2.216 0.724 3.060 0.002 9.167 (2.218–37.890) Age group, n (%) 18–45 1.000 (Ref.) 45–60 −1.073 0.355 −3.024 0.002 0.342 (0.171–0.686) 60–80 −1.796 0.449 −3.997 < 0.001 0.166 (0.069–0.400) Sleep quality group, n (%) Very good (0–5 points) 1.000 (Ref.) Fairly good (6–10 points) −14.467 727.699 −0.020 0.984 0.000 (0.000–Inf) Average (11–15 points) −13.940 727.699 −0.019 0.985 0.000 (0.000–Inf) Very poor (16–21 points) −14.467 727.699 −0.020 0.984 0.000 (0.000–Inf) Income per capita, n (%) ≤ 3,000 1.000 (Ref.) 3,000–6,000 0.634 0.463 1.372 0.170 1.886 (0.762–4.669) 6,000–9,000 0.770 0.594 1.296 0.195 2.159 (0.674–6.915) > 9,000 0.575 1.196 0.481 0.630 1.778 (0.171–18.534) CCI group, n (%) Mild (1–2 points) 1.000 (Ref.) Moderate (3–4 points) 2.812 0.761 3.697 < 0.001 16.646 (3.749–73.923) Severe (≥ 5 points) 2.385 0.375 6.359 < 0.001 10.860 (5.207–22.650) Risk perception group, n (%) Low (1–2 points) 1.000 (Ref.) Moderate (3 points) 2.274 0.548 4.148 < 0.001 9.714 (3.318–28.441) High (4–5 points) 2.050 0.500 4.097 < 0.001 7.771 (2.914–20.723) Household size −0.203 0.126 −1.620 0.105 0.816 (0.638–1.044) OR: Odds Ratio, CI: Confidence Interval. p-Values in boldface indicate the statistical significance. Table 3.
Univariate logistic regression analysis of factors influencing anxiety.
-
Variables β S.E Z p OR (95% CI) Intercept −0.837 0.463 −1.808 0.071 0.433 (0.175–1.073) Education level, n (%) Junior high or below 1.000 (Ref.) High school/junior college 1.486 0.551 2.695 0.007 4.418 (1.500–13.015) Undergraduate 1.344 0.547 2.457 0.014 3.833 (1.313–1.196) Postgraduate or above 0.897 0.694 1.292 0.196 2.452 (0.629–9.563) Age group, n (%) 18–45 1.000 (Ref.) 45–60 −1.080 0.480 −2.251 0.024 0.340 (0.133–0.870) 60–80 −1.239 0.597 −2.077 0.038 0.290 (0.090–0.933) CCI group, n (%) Mild (1–2 points) 1.000 (Ref.) Moderate (3–4 points) 3.007 0.852 3.529 < 0.001 20.232 (3.807–107.522) Severe (≥ 5 points) 2.410 0.452 5.335 < 0.001 11.132 (4.593–26.980) Risk perception group, n (%) Low (1–2 points) 1.000 (Ref.) Moderate (3 points) 2.101 0.640 3.283 0.001 8.177 (2.332–28.667) High (4–5 points) 1.361 0.615 2.213 0.027 3.902 (1.168–13.031) OR: Odds Ratio, CI: Confidence Interval. p-Values in boldface indicate the statistical significance. Table 4.
Multivariate logistic regression analysis of factors influencing anxiety.
-
Data AUC (95% CI) Accuracy (95% CI) Sensitivity (95% CI) Specificity (95% CI) PPV (95% CI) NPV (95% CI) Training 0.910 (0.873–0.948) 0.808 (0.756–0.854) 0.906 (0.827–0.984) 0.784 (0.729–0.839) 0.511 (0.410–0.612) 0.971 (0.946–0.996) Validation 0.846 (0.751–0.940) 0.763 (0.674–0.838) 0.760 (0.593–0.927) 0.764 (0.676–0.852) 0.475 (0.320–0.630) 0.919 (0.857–0.981) Table 5.
Predictive performance of the model in training and validation cohorts.
Figures
(5)
Tables
(5)