-
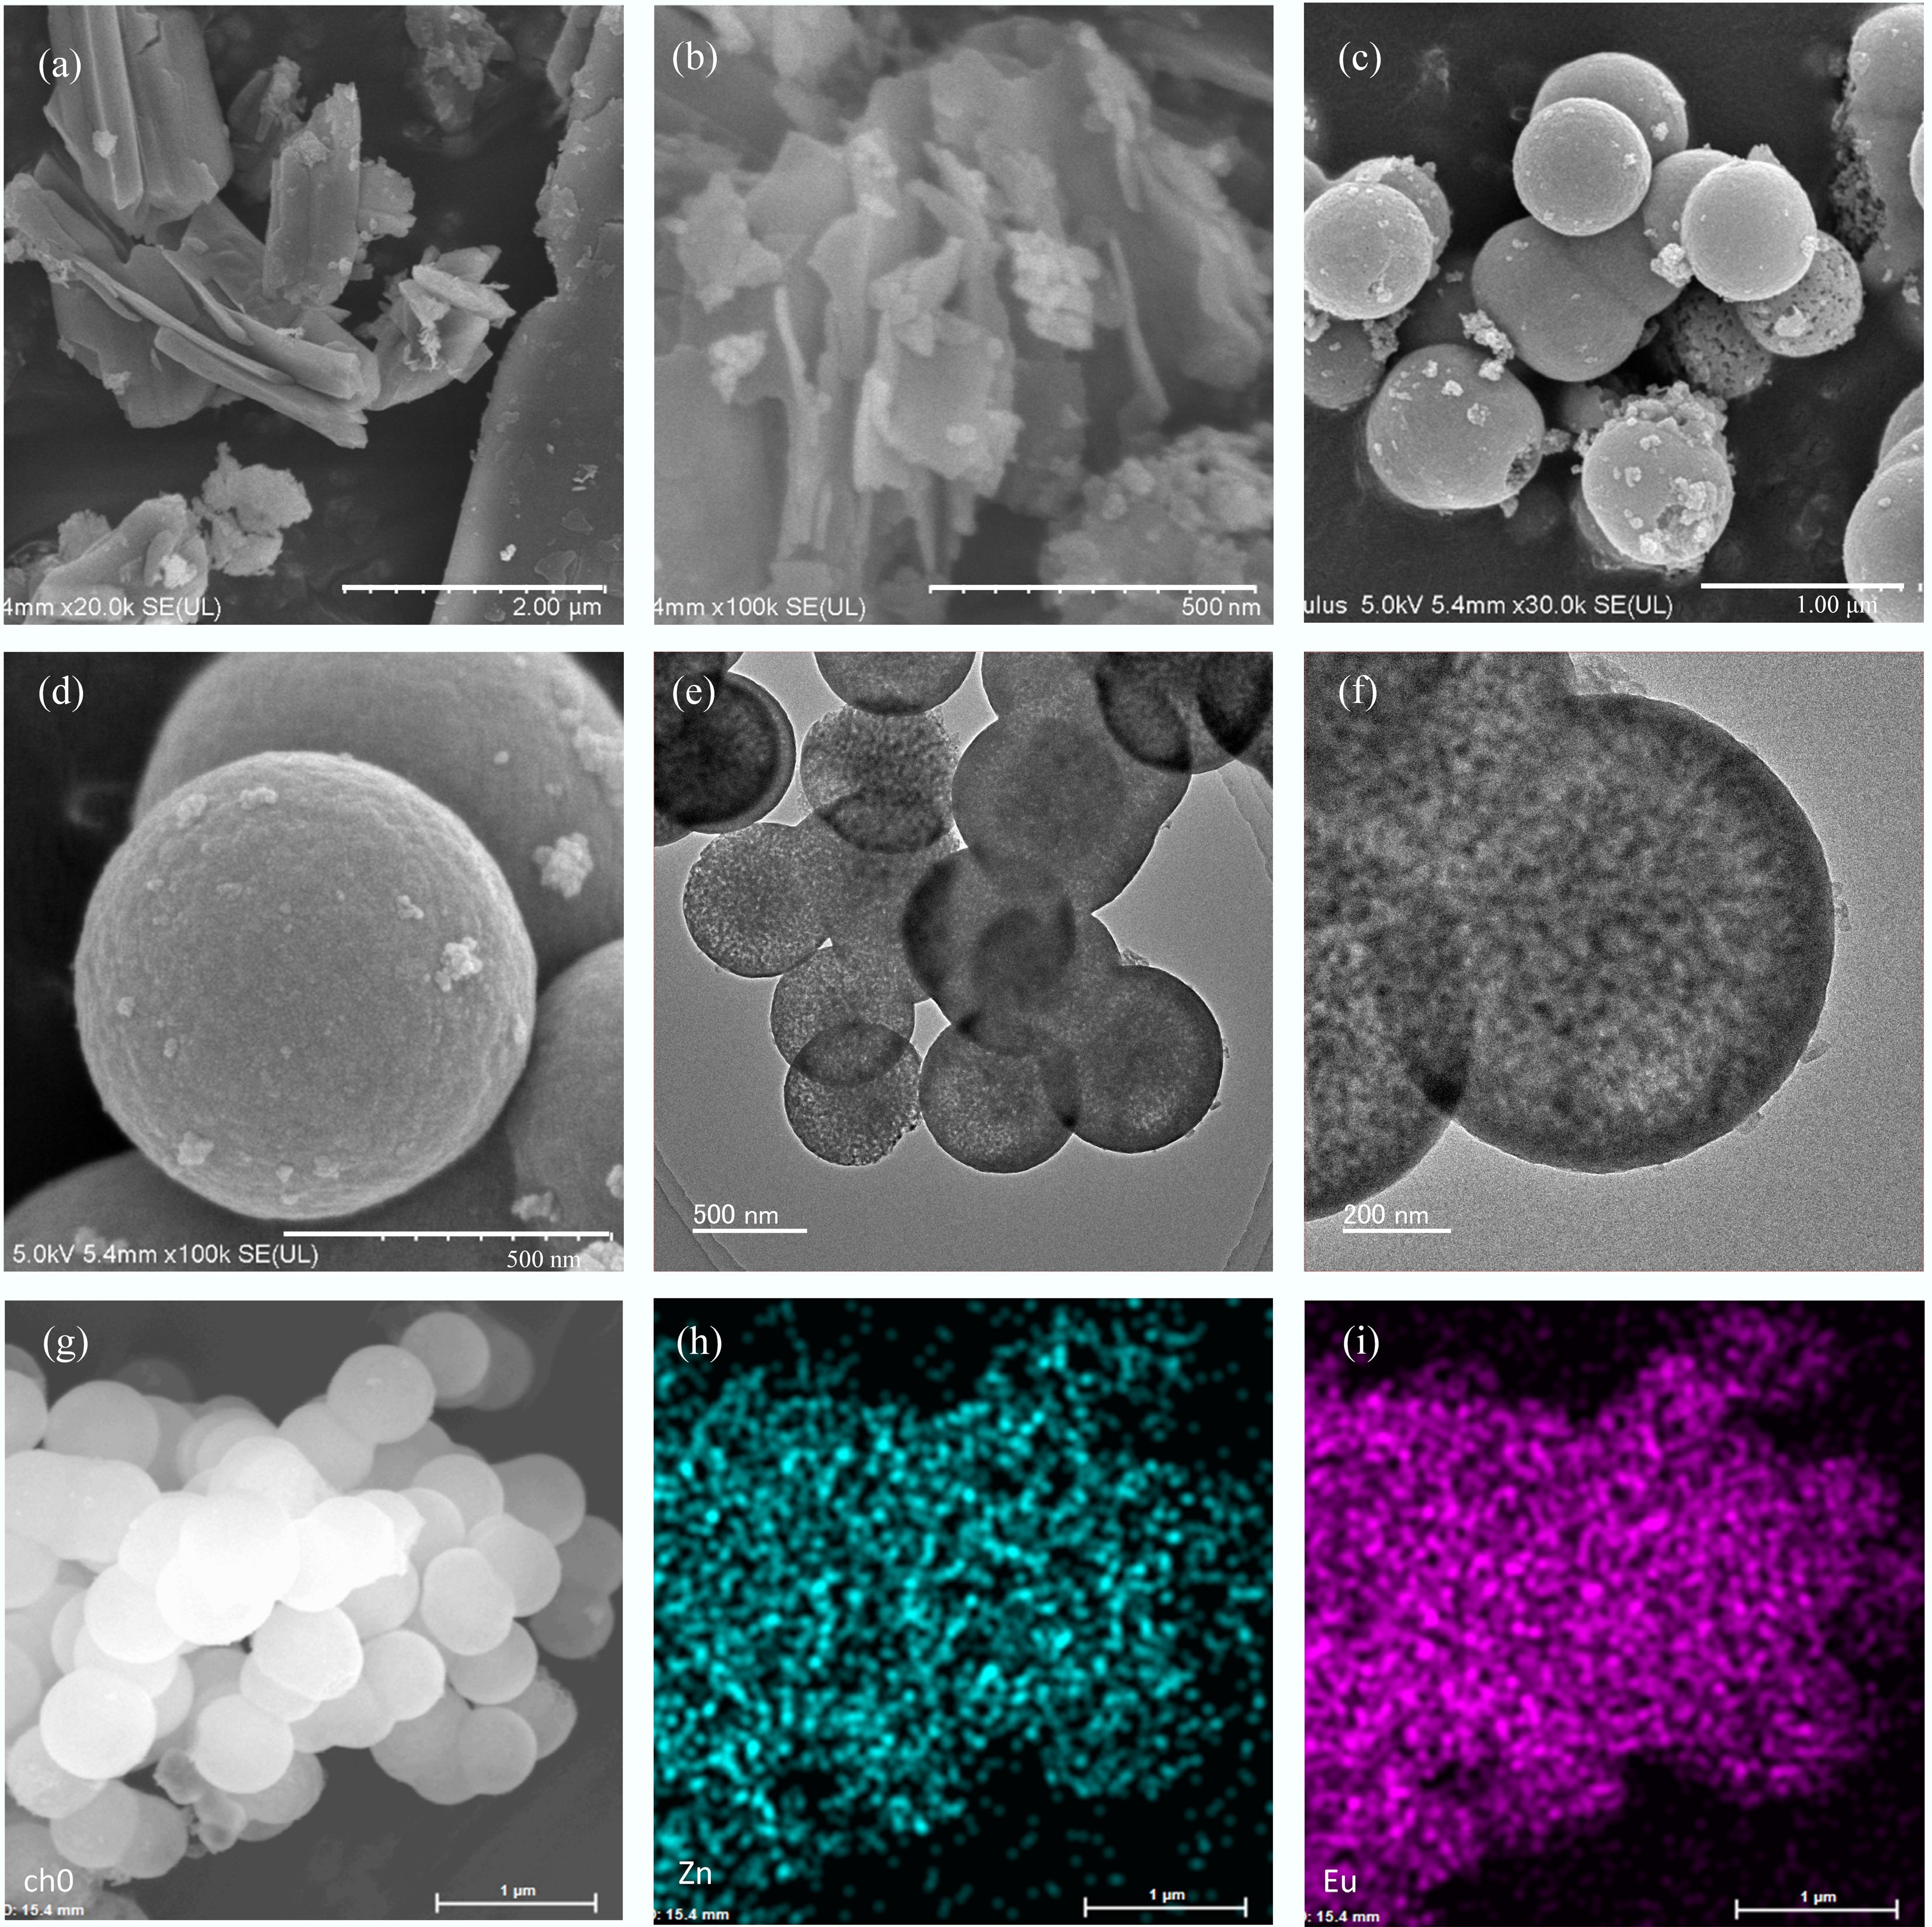
Figure 1.
(a) SEM images of Zn-PMA. (b) SEM images of Eu-PMA. (c), (d) SEM images of EuZn-PMA at different magnifications. (e), (f) Transmission electron microscopy (TEM) images of EuZn-PMA. (g) scanning transmission electron microscopy (STEM) image of EuZn-PMA and the corresponding elemental mapping of (h) Zn and (i) Eu.
-
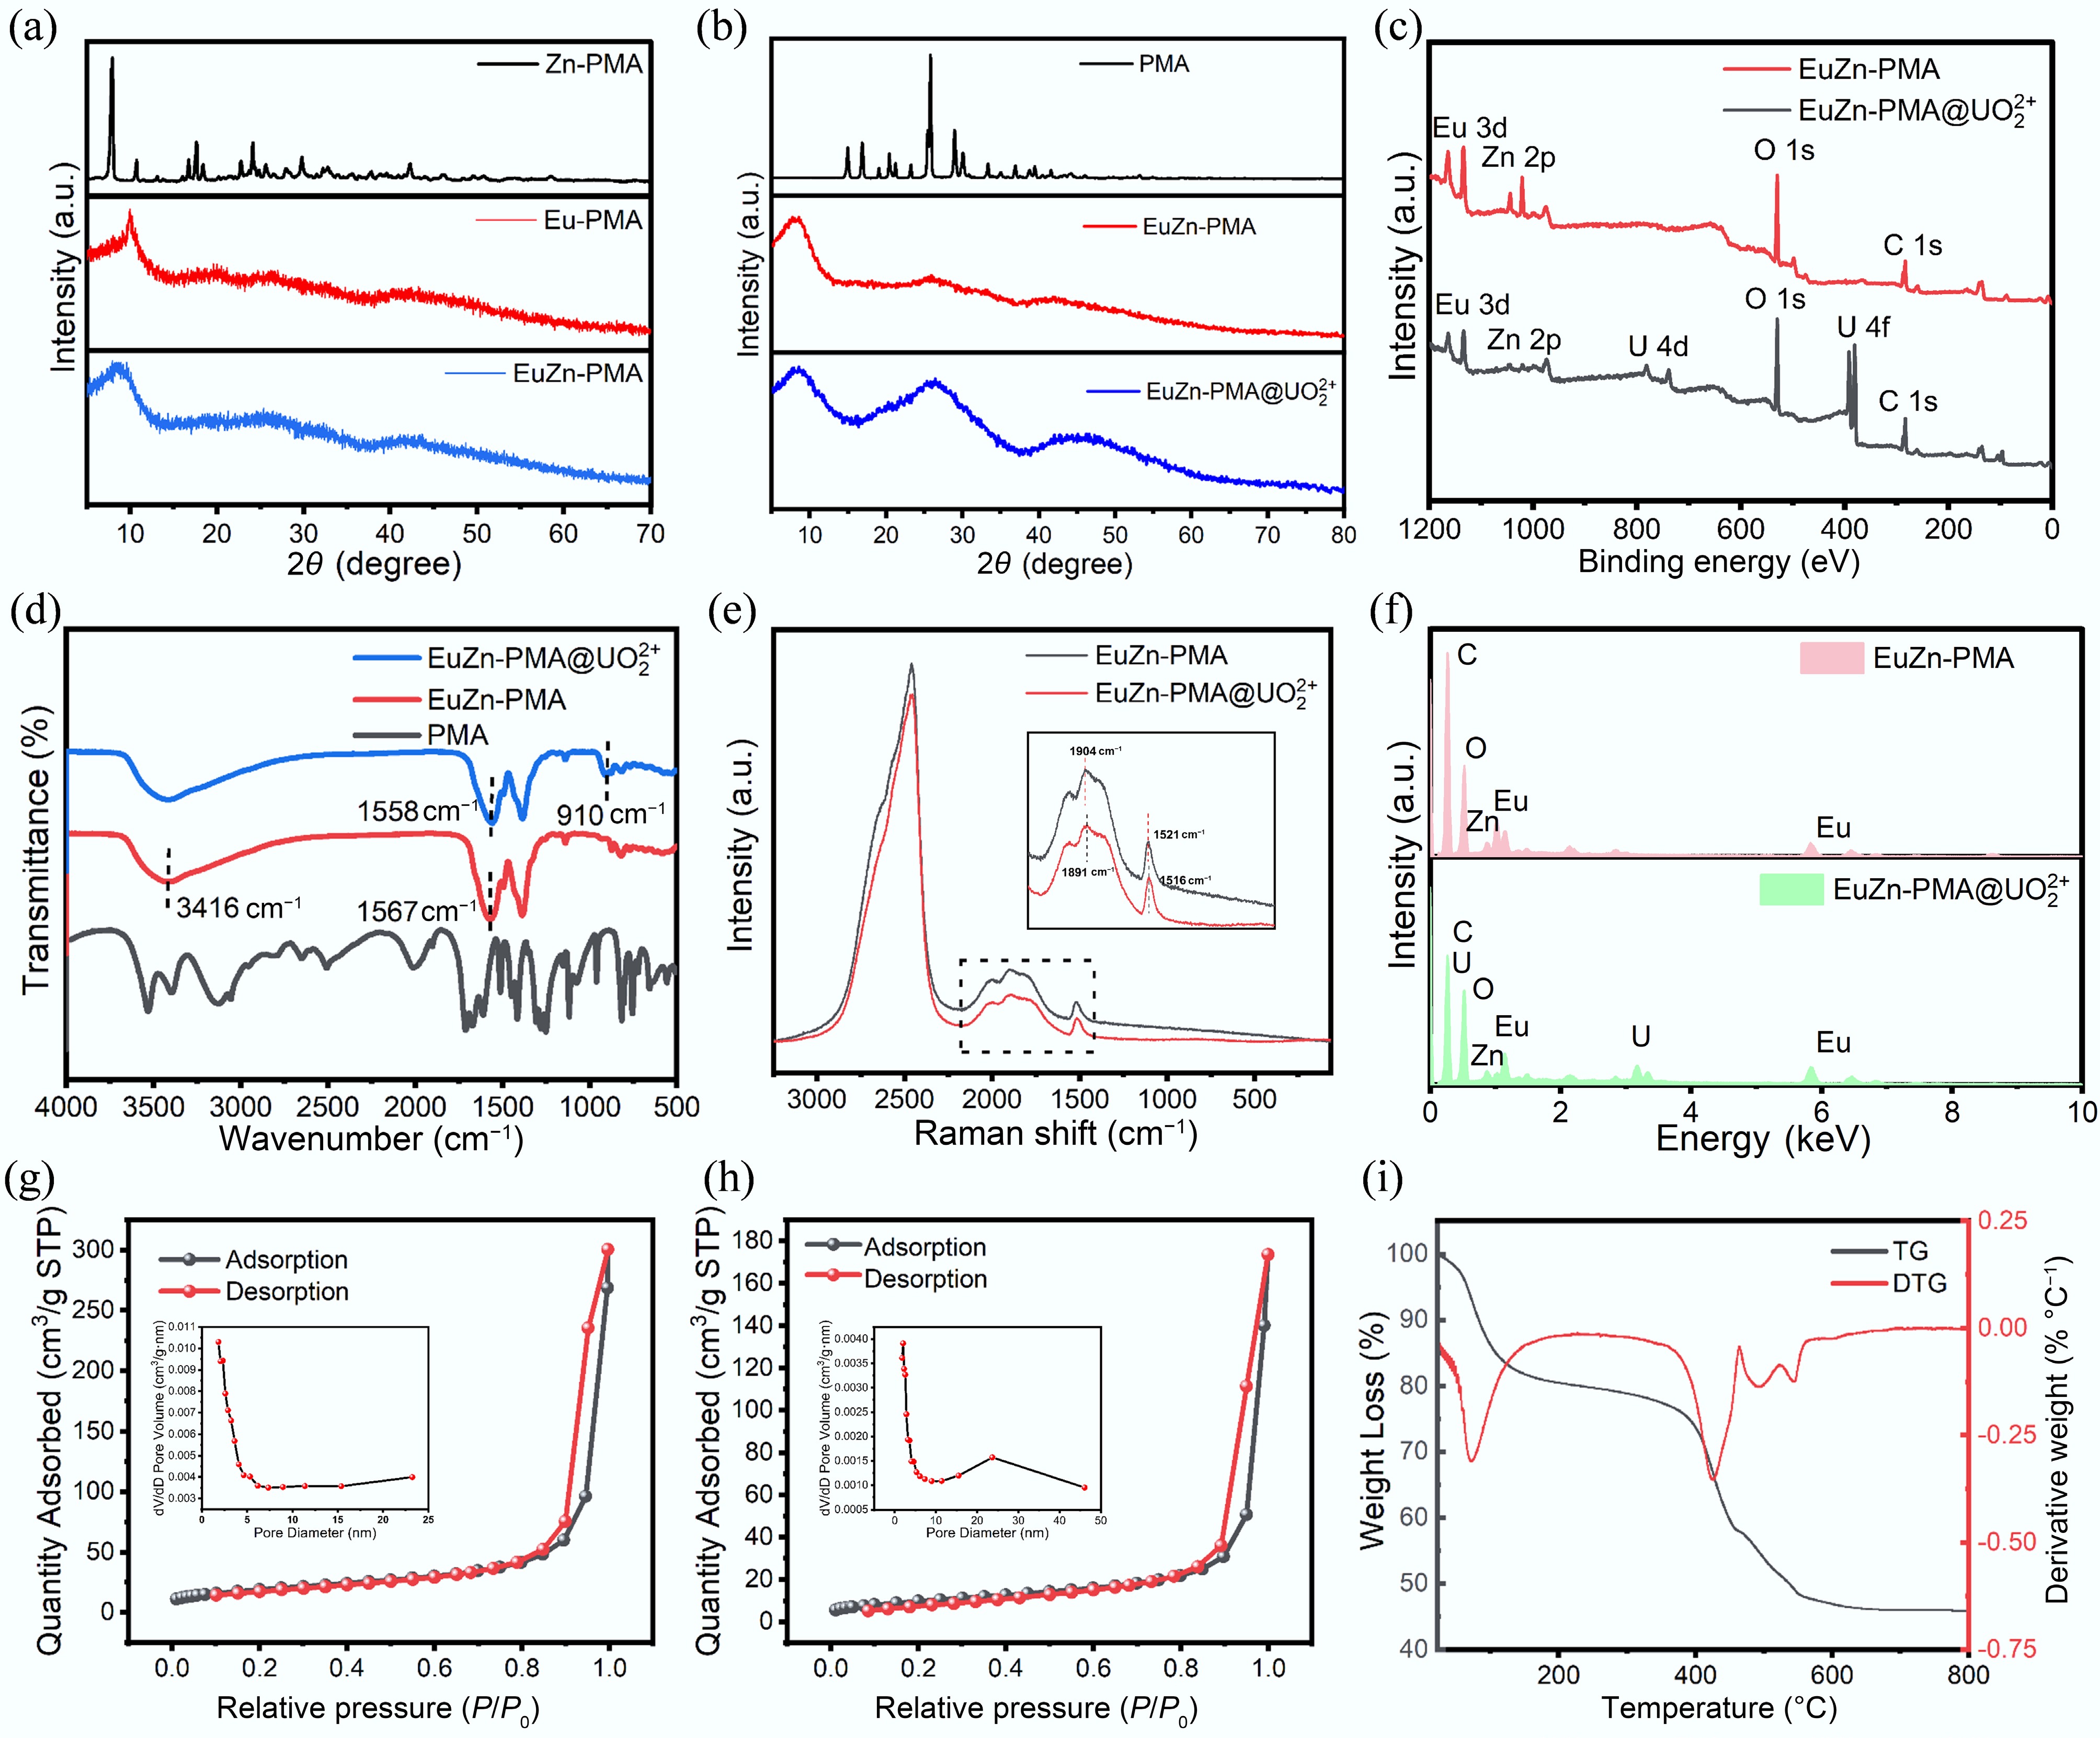
Figure 2.
(a), (b) XRD patterns of Zn-PMA, Eu-PMA, EuZn-PMA, PMA, and EuZn-PMA@UO22+. (c) Full XPS survey spectrum of EuZn-PMA. (d) FTIR spectra of PMA, EuZn-PMA, and EuZn-PMA@UO22+. (e) Raman spectra of EuZn-PMA and EuZn-PMA@UO22+. (f) Energy-dispersive X-ray spectroscopy (EDS) spectrum of EuZn-PMA and EuZn-PMA@UO22+. (g), (h) The 77.3 K nitrogen adsorption-desorption isotherms and pore size distribution of EuZn-PMA and EuZn-PMA@UO22+. (i) Thermogravimetric (TG) and derivative thermogravimetric (DTG) curves of EuZn-PMA.
-
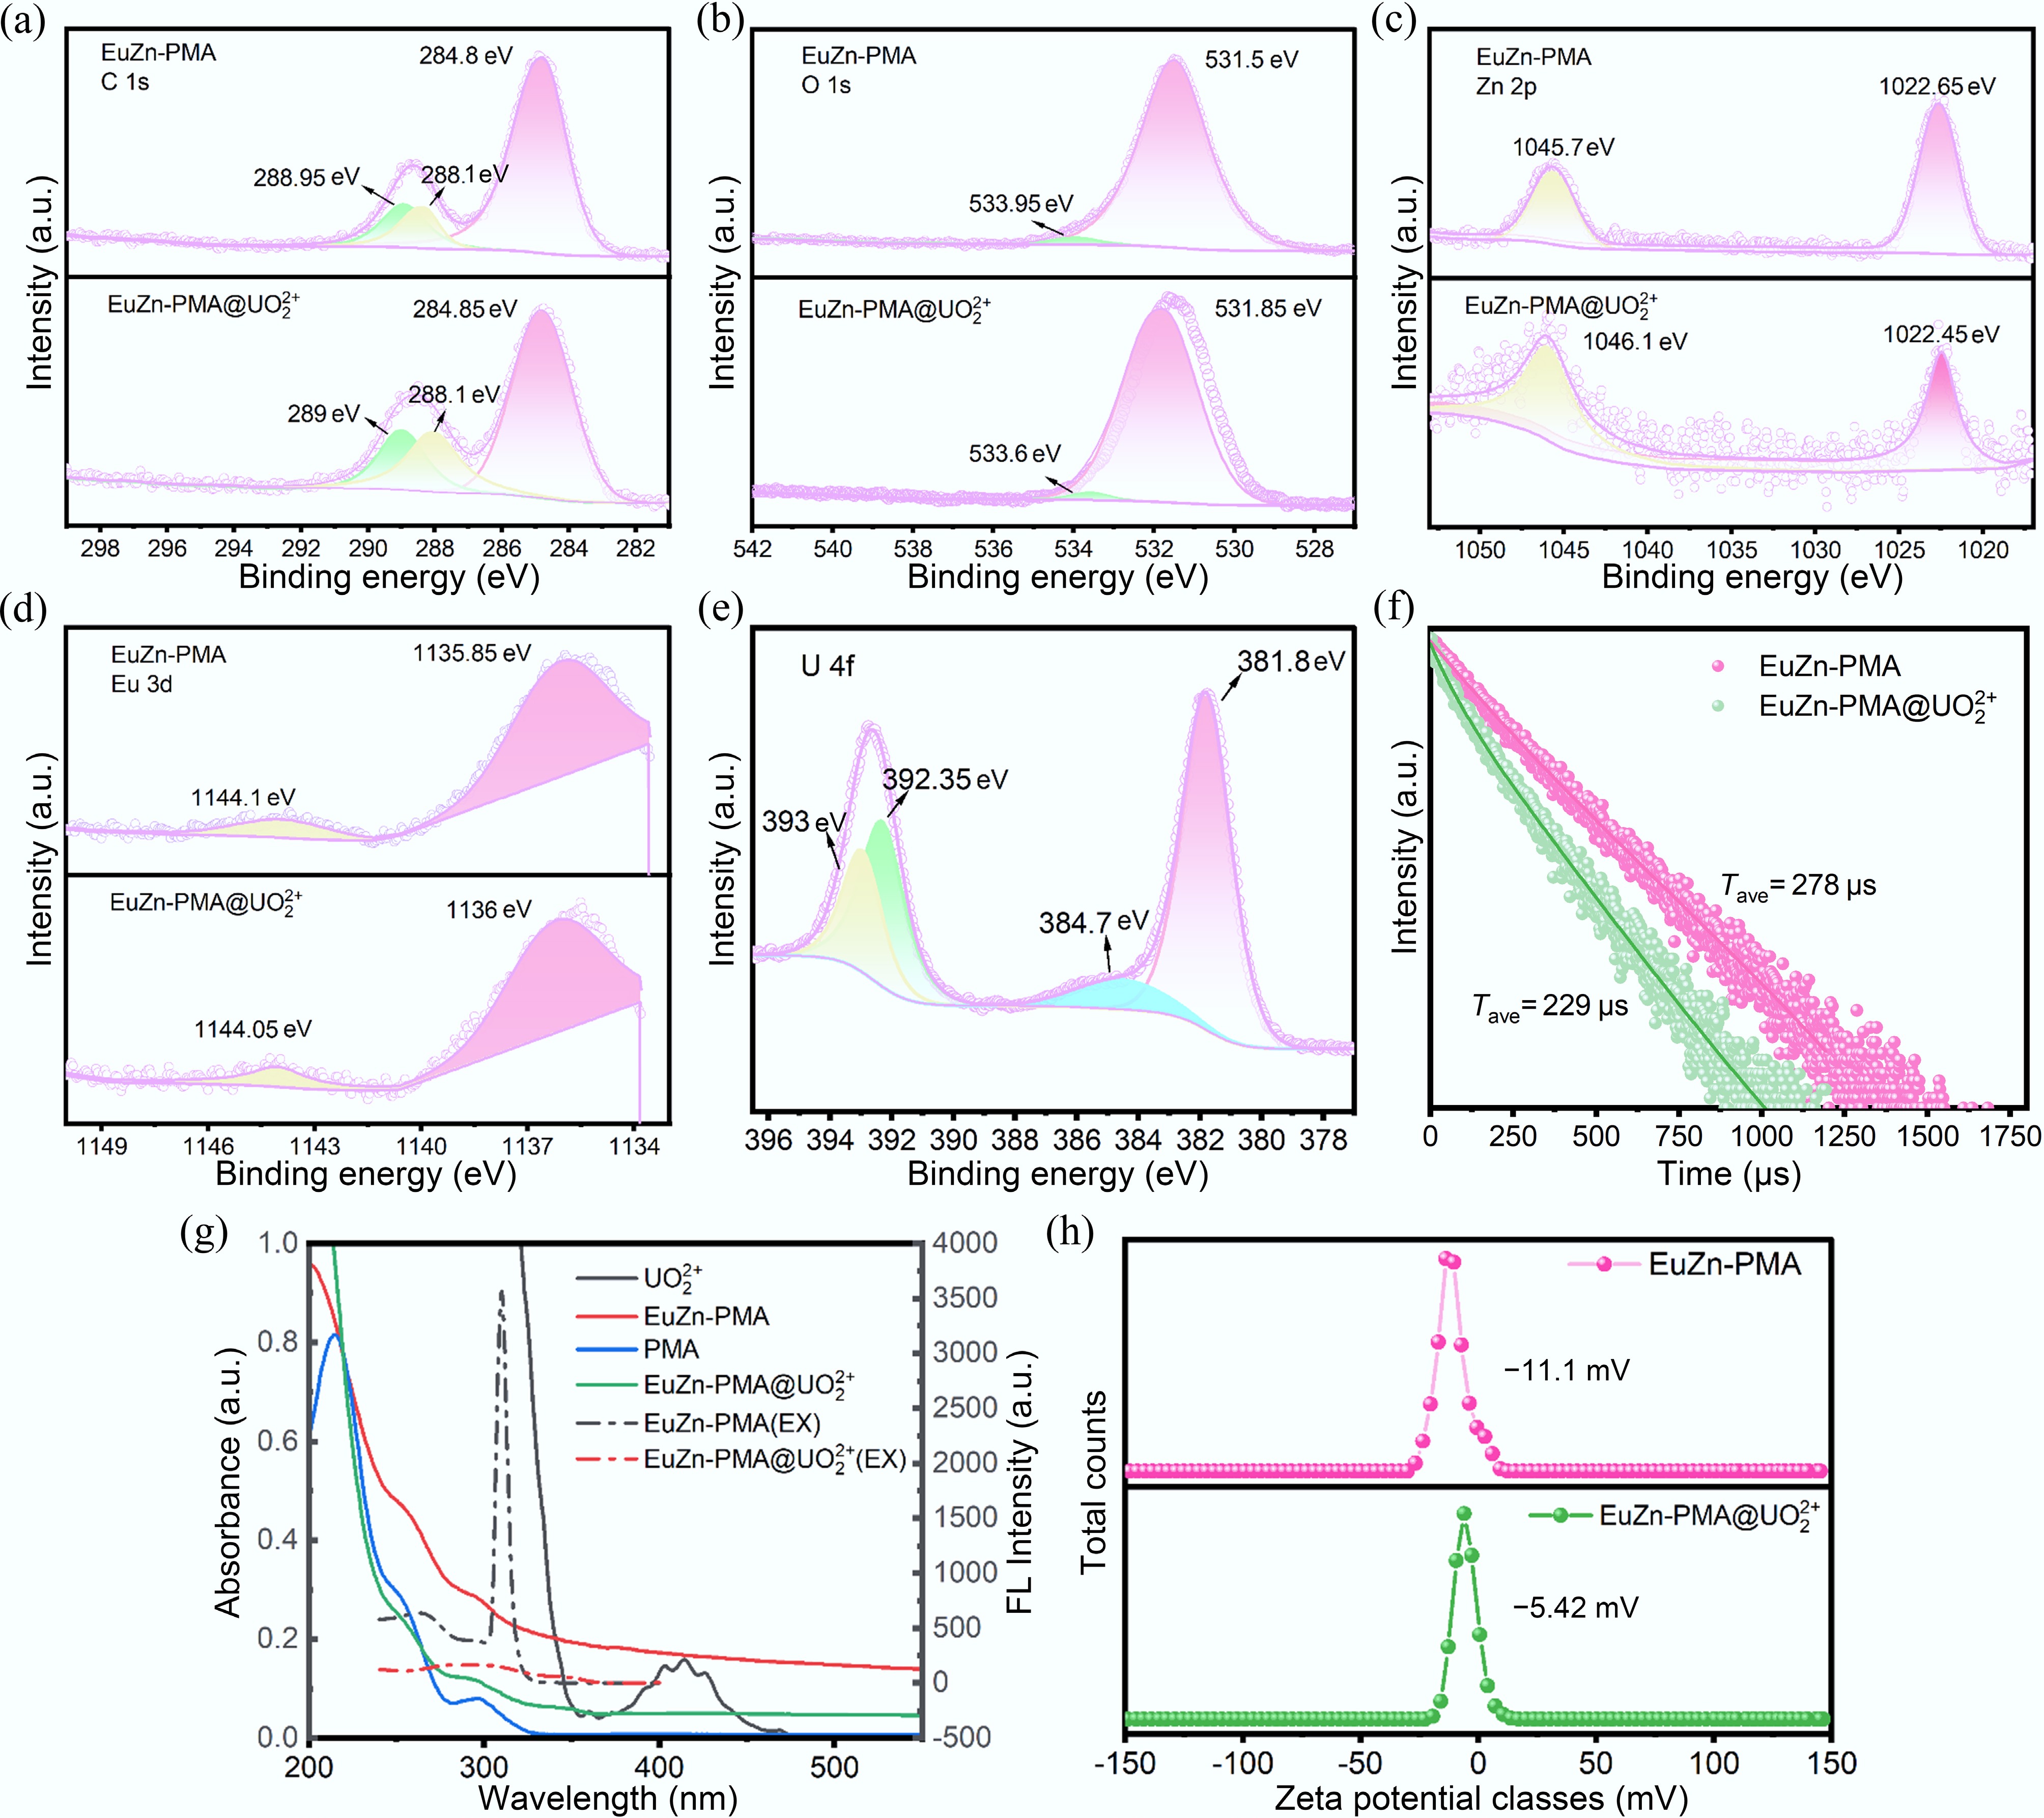
Figure 3.
Spectroscopic and interfacial characterization of EuZn-PMA before and after interaction with UO22+. (a)−(e) High-resolution XPS spectra of C 1s, O 1s, Zn 2p, Eu 3d, and U 4f. (f) Lifetime fluorescence decay curves of EuZn-PMA before and after adding UO22+. (g) UV–vis absorption spectra. (h) Zeta potential distribution.
-
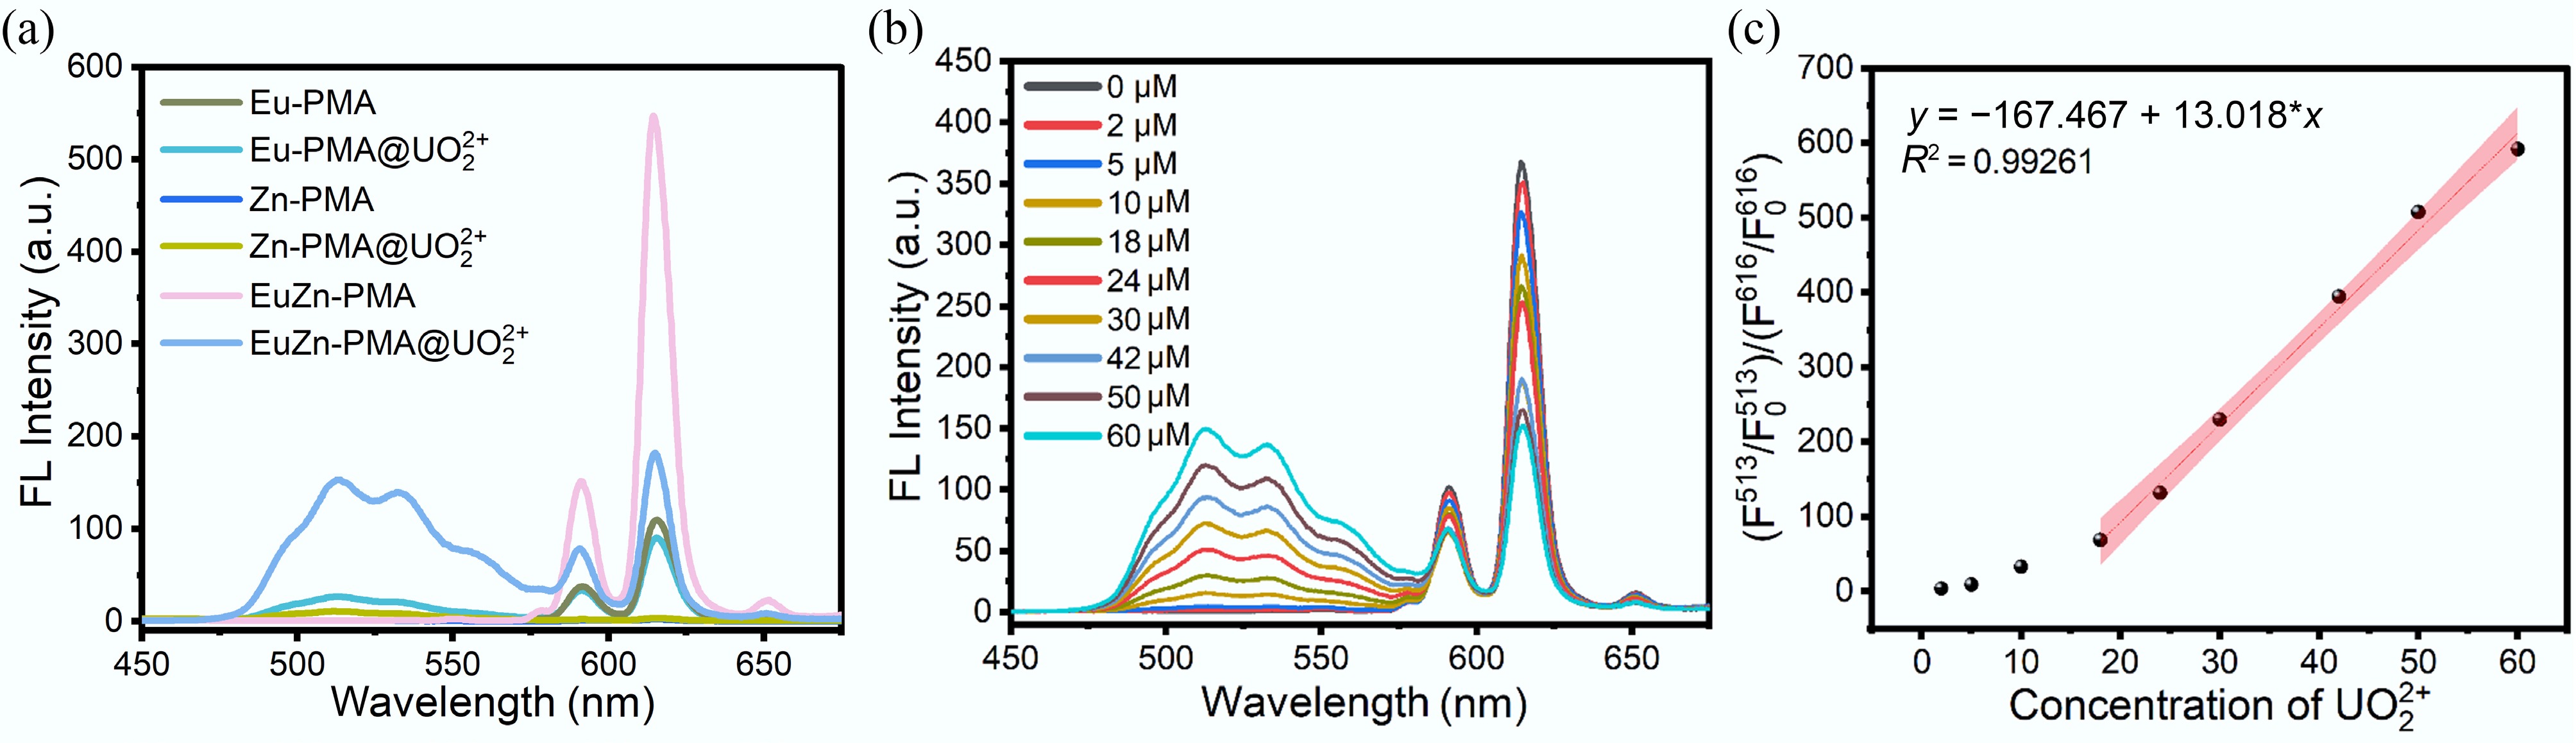
Figure 4.
(a) Fluorescence spectra of Eu-PMA, Zn-PMA, and EuZn-PMA before and after the addition of UO22+. (b) Fluorescence spectra of EuZn-PMA (0.1 mg/mL) in the presence of different concentrations of UO22+ (0−60 μM). (c) At UO22+ concentrations ranging from 0 to 60 μM, the linear relationship between ([F513/F0]/[F616/F0]) and different concentrations of UO22+.
-
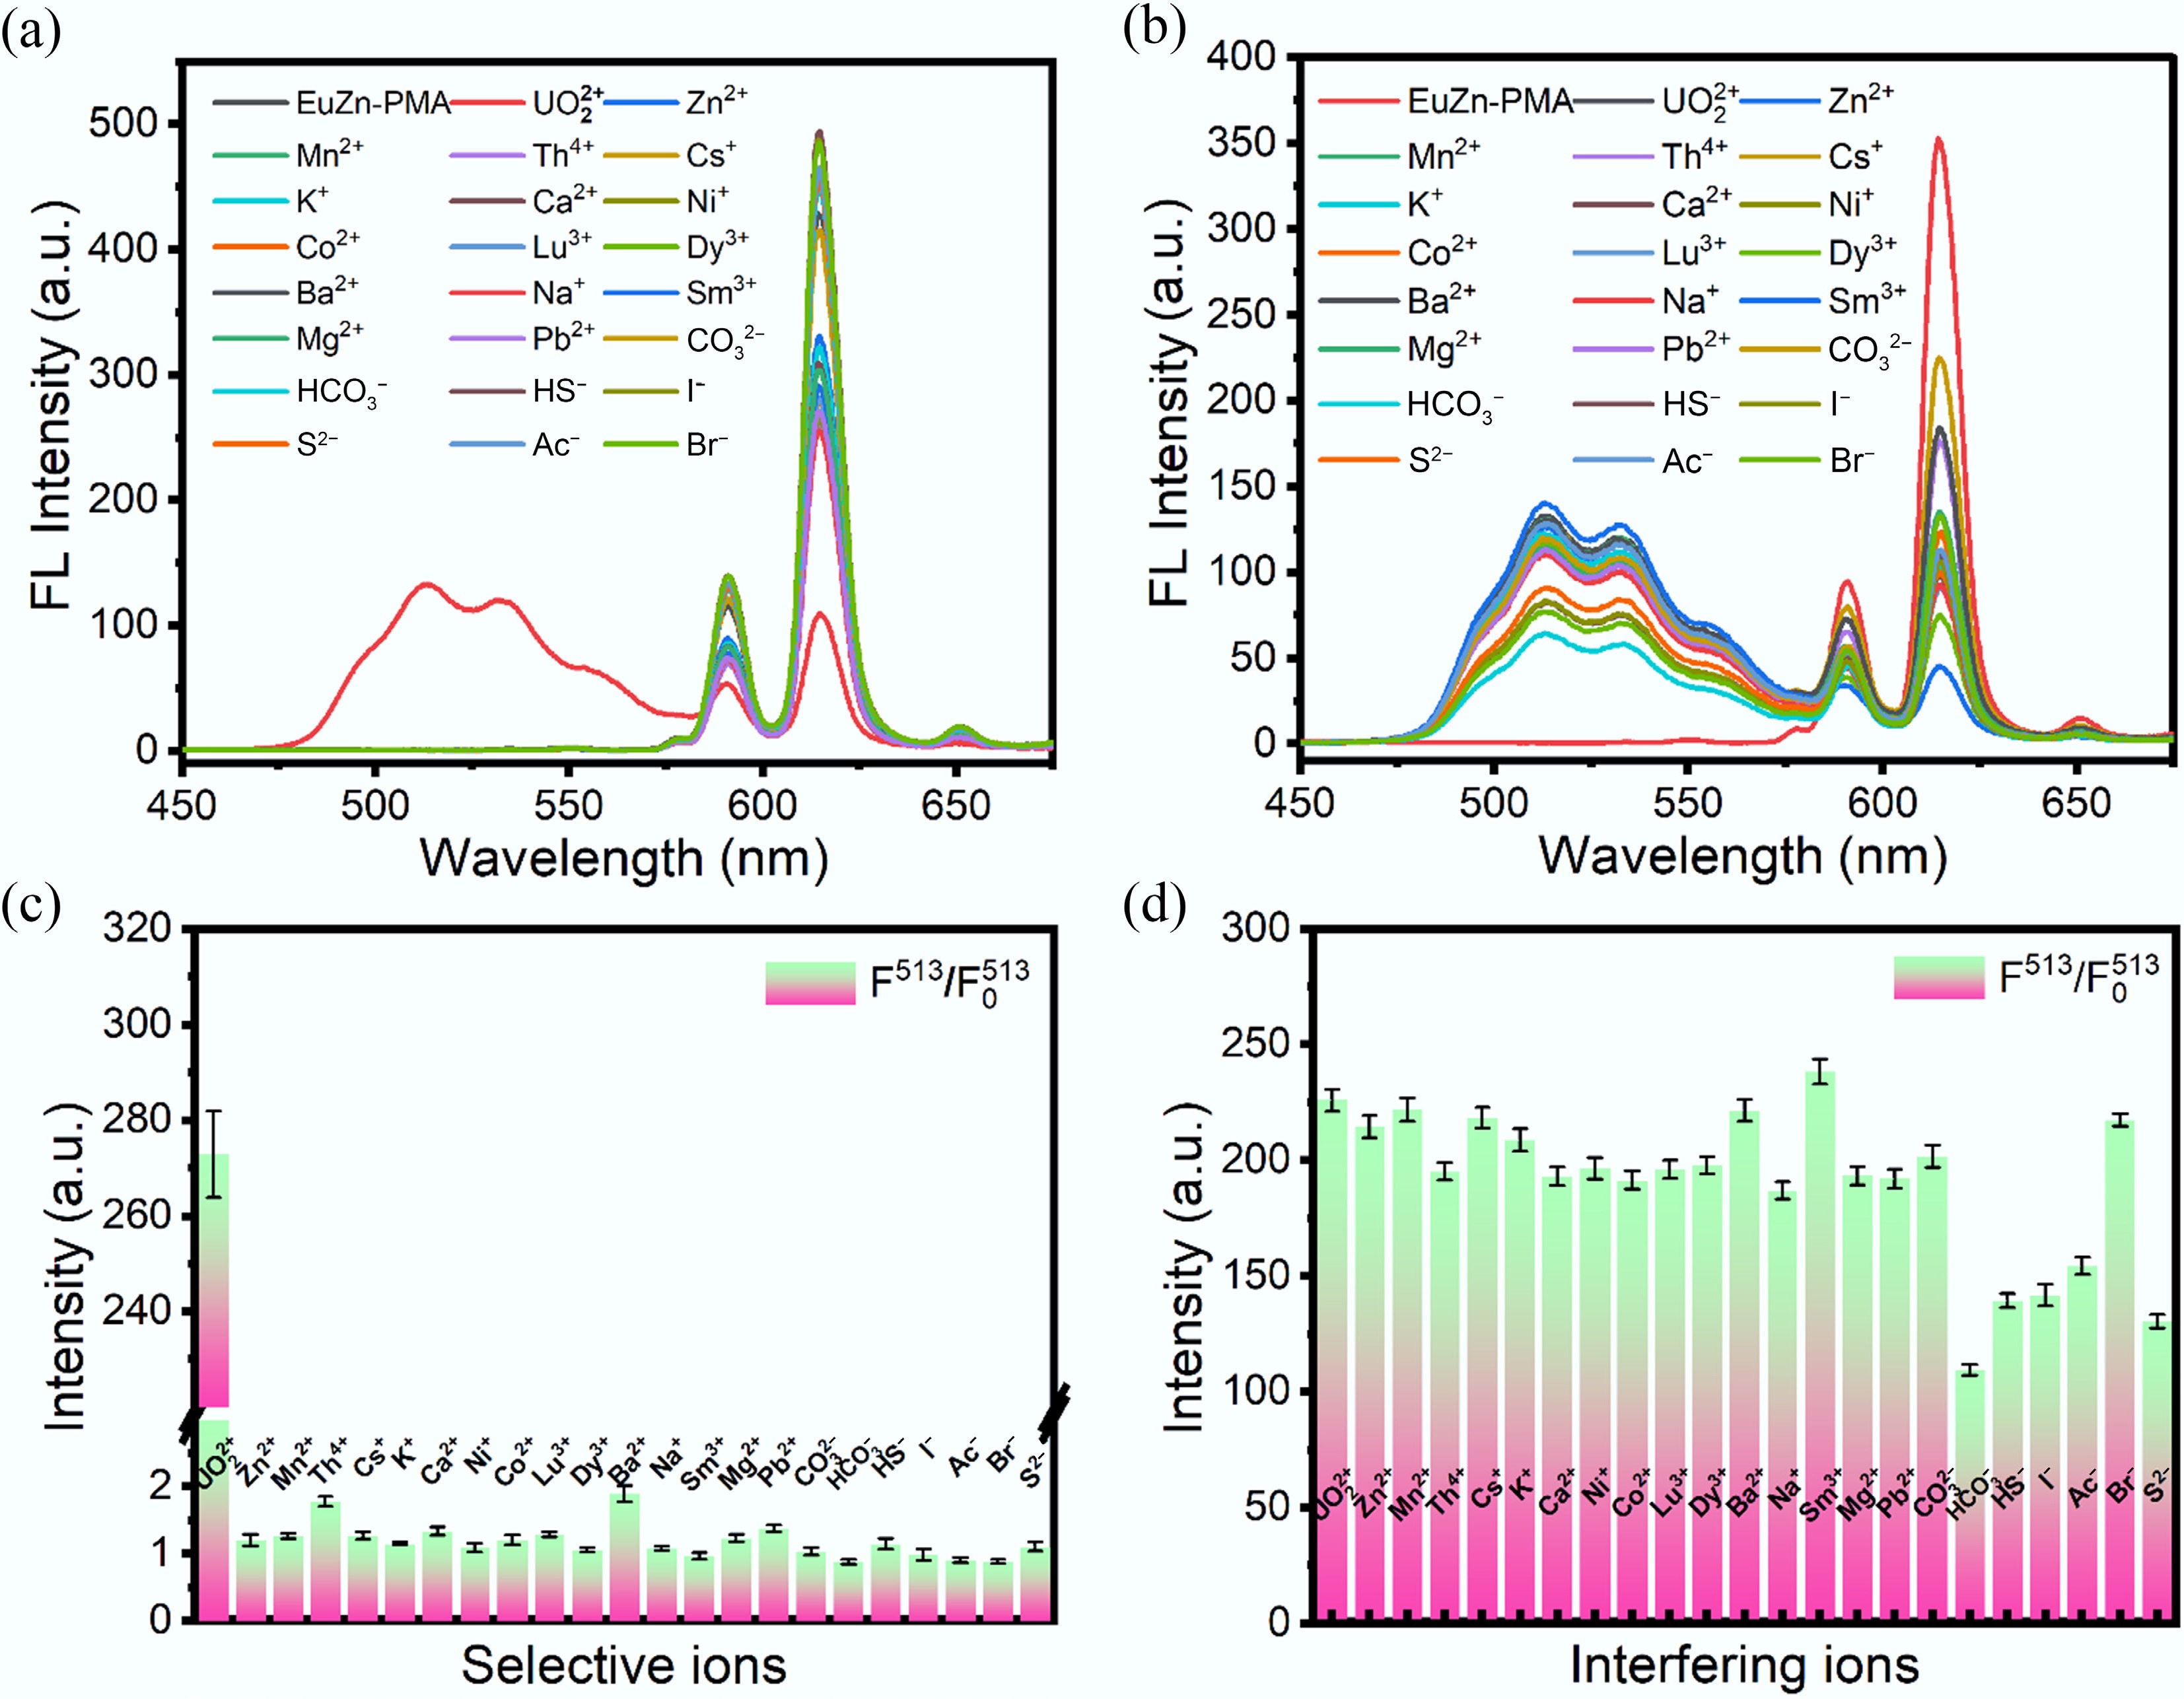
Figure 5.
Selectivity and anti-interference performance of EuZn-PMA. (a), (c) Fluorescence spectra and the corresponding fluorescence ratio F513/F5130 of EuZn-PMA in the presence of UO22+ and various common interfering ions. (b), (d) Fluorescence spectra and the corresponding fluorescence ratio F513/F5130 of EuZn-PMA in mixed solutions containing UO22+ and threefold excess concentrations of interfering ions.
-
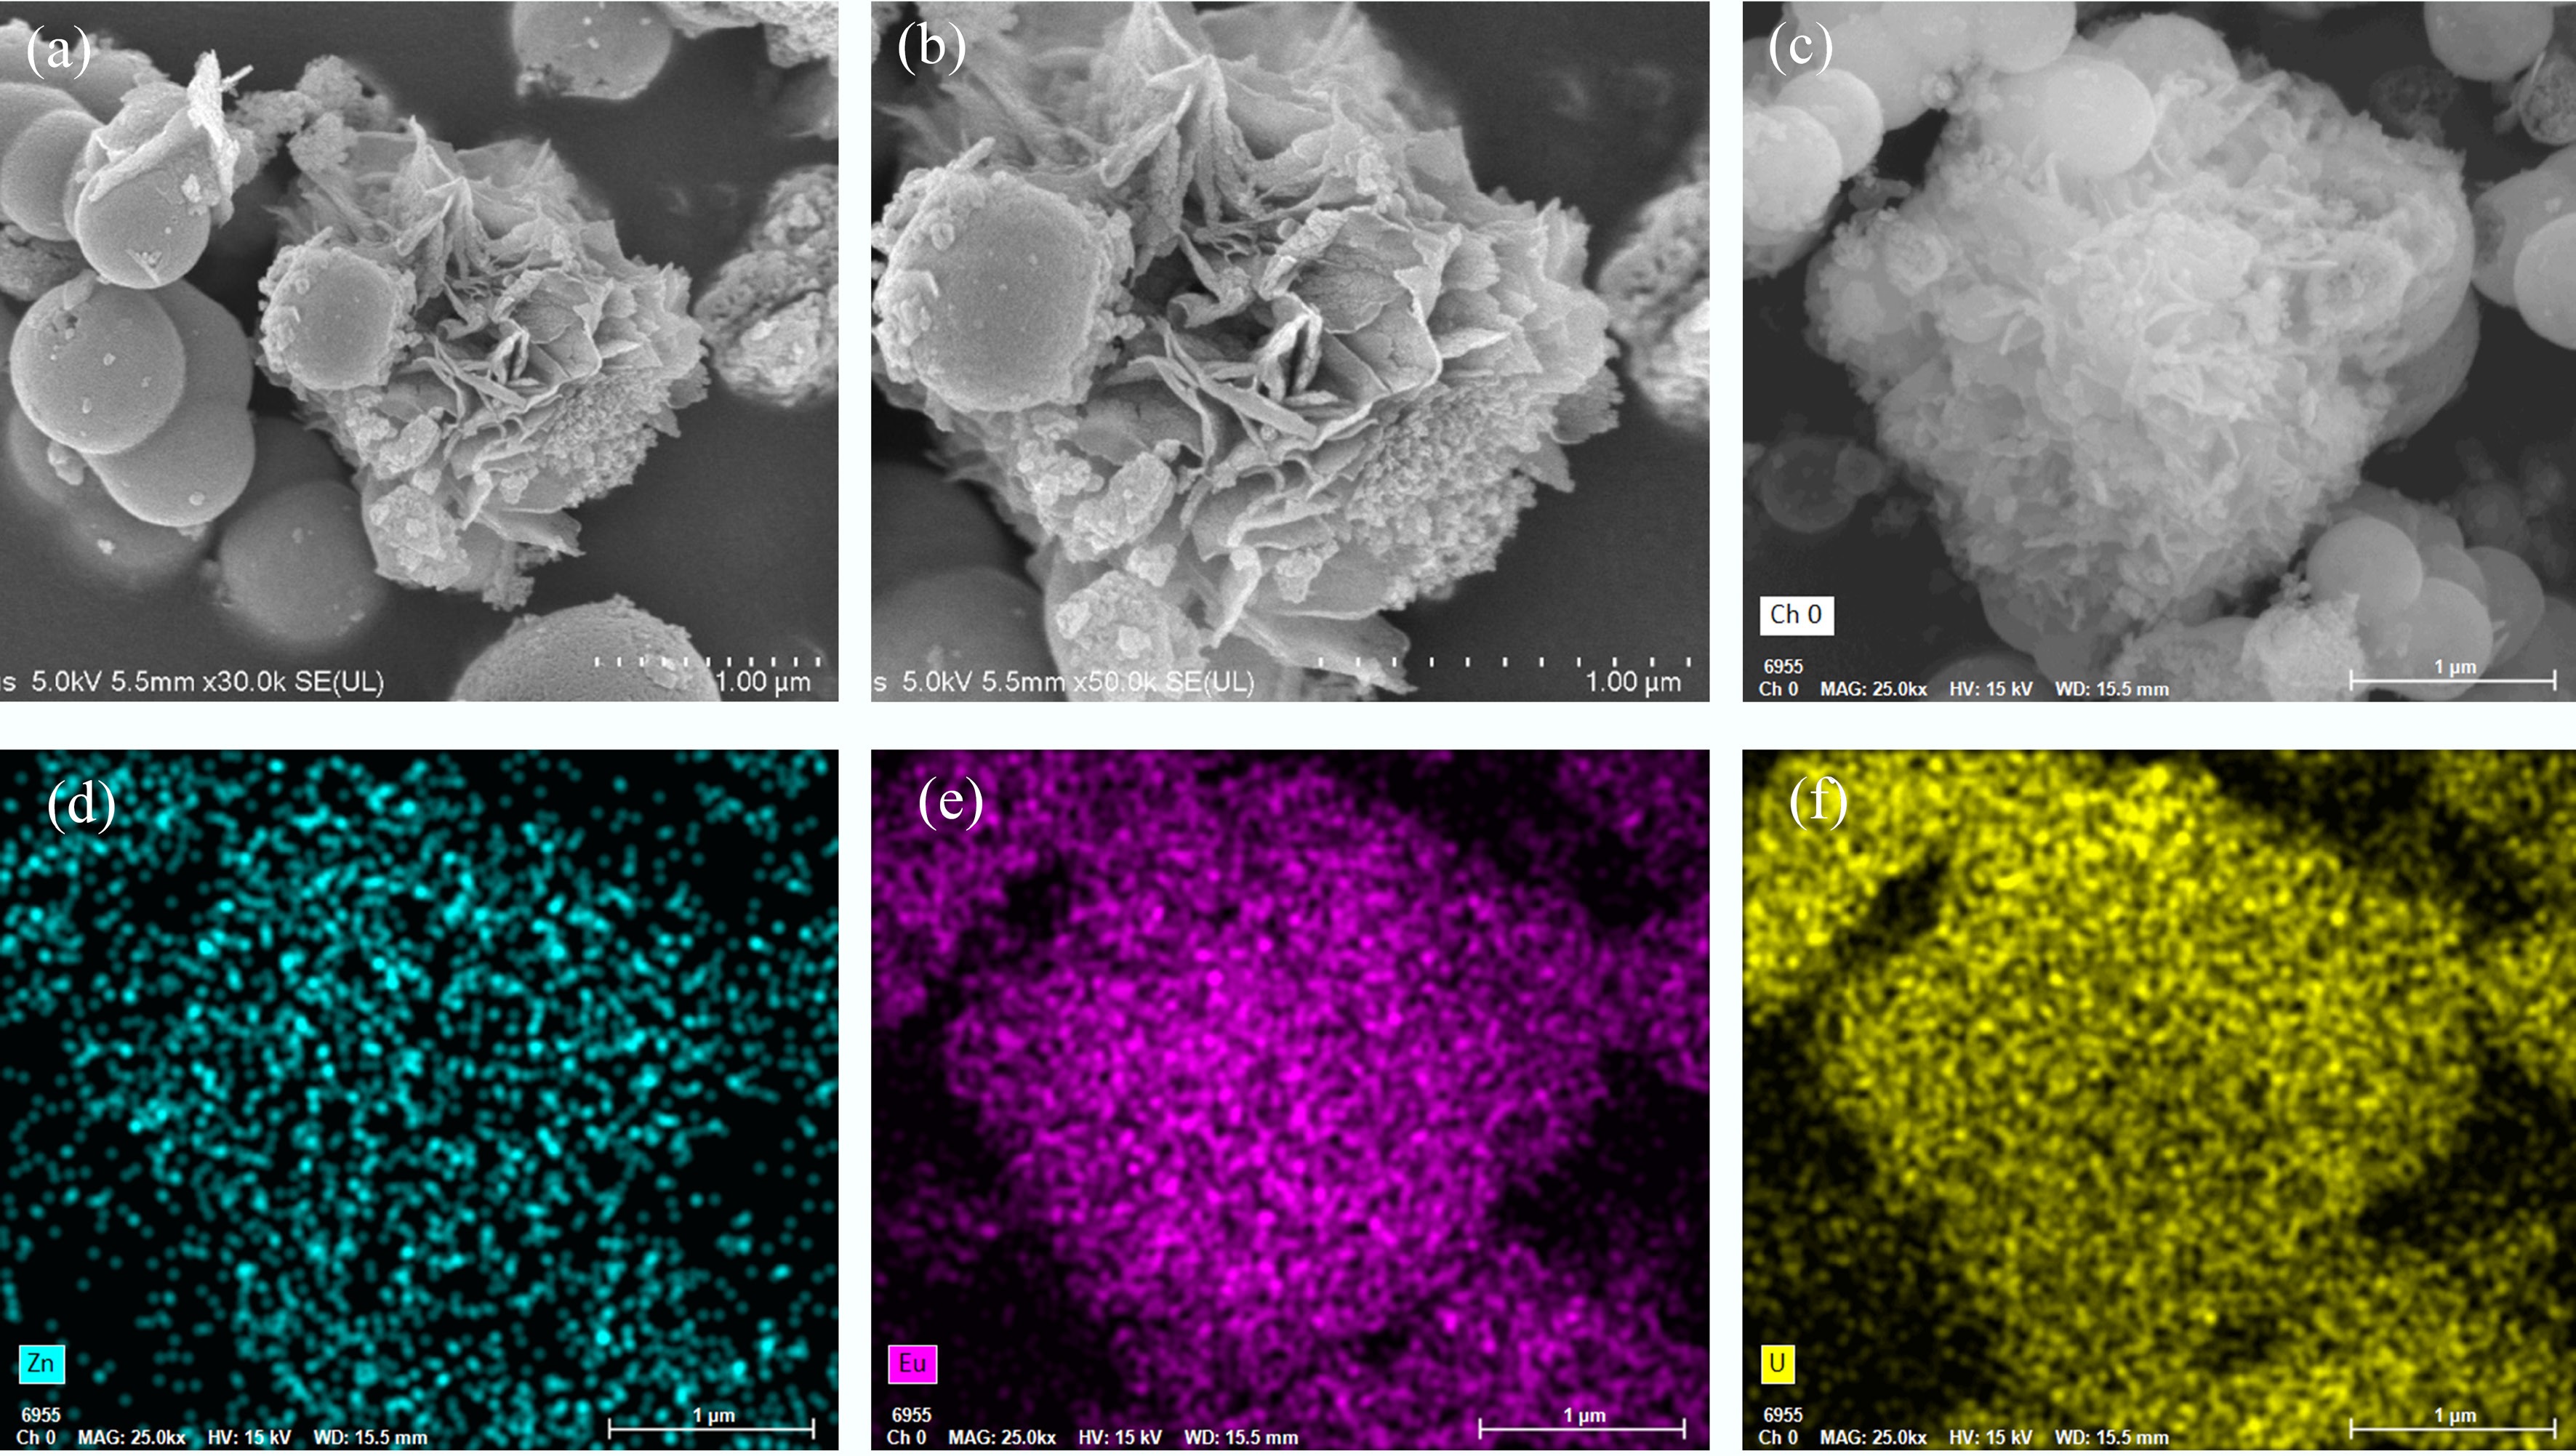
Figure 6.
SEM images and corresponding EDS elemental mapping of EuZn-PMA after reacting with UO22+. (a), (b) SEM morphology of the EuZn-PMA–UO22+ composite. (c) STEM image of EuZn-PMA@ UO22+ and the corresponding elemental mapping of (d) Zn, (e) Eu and (f) U.
-
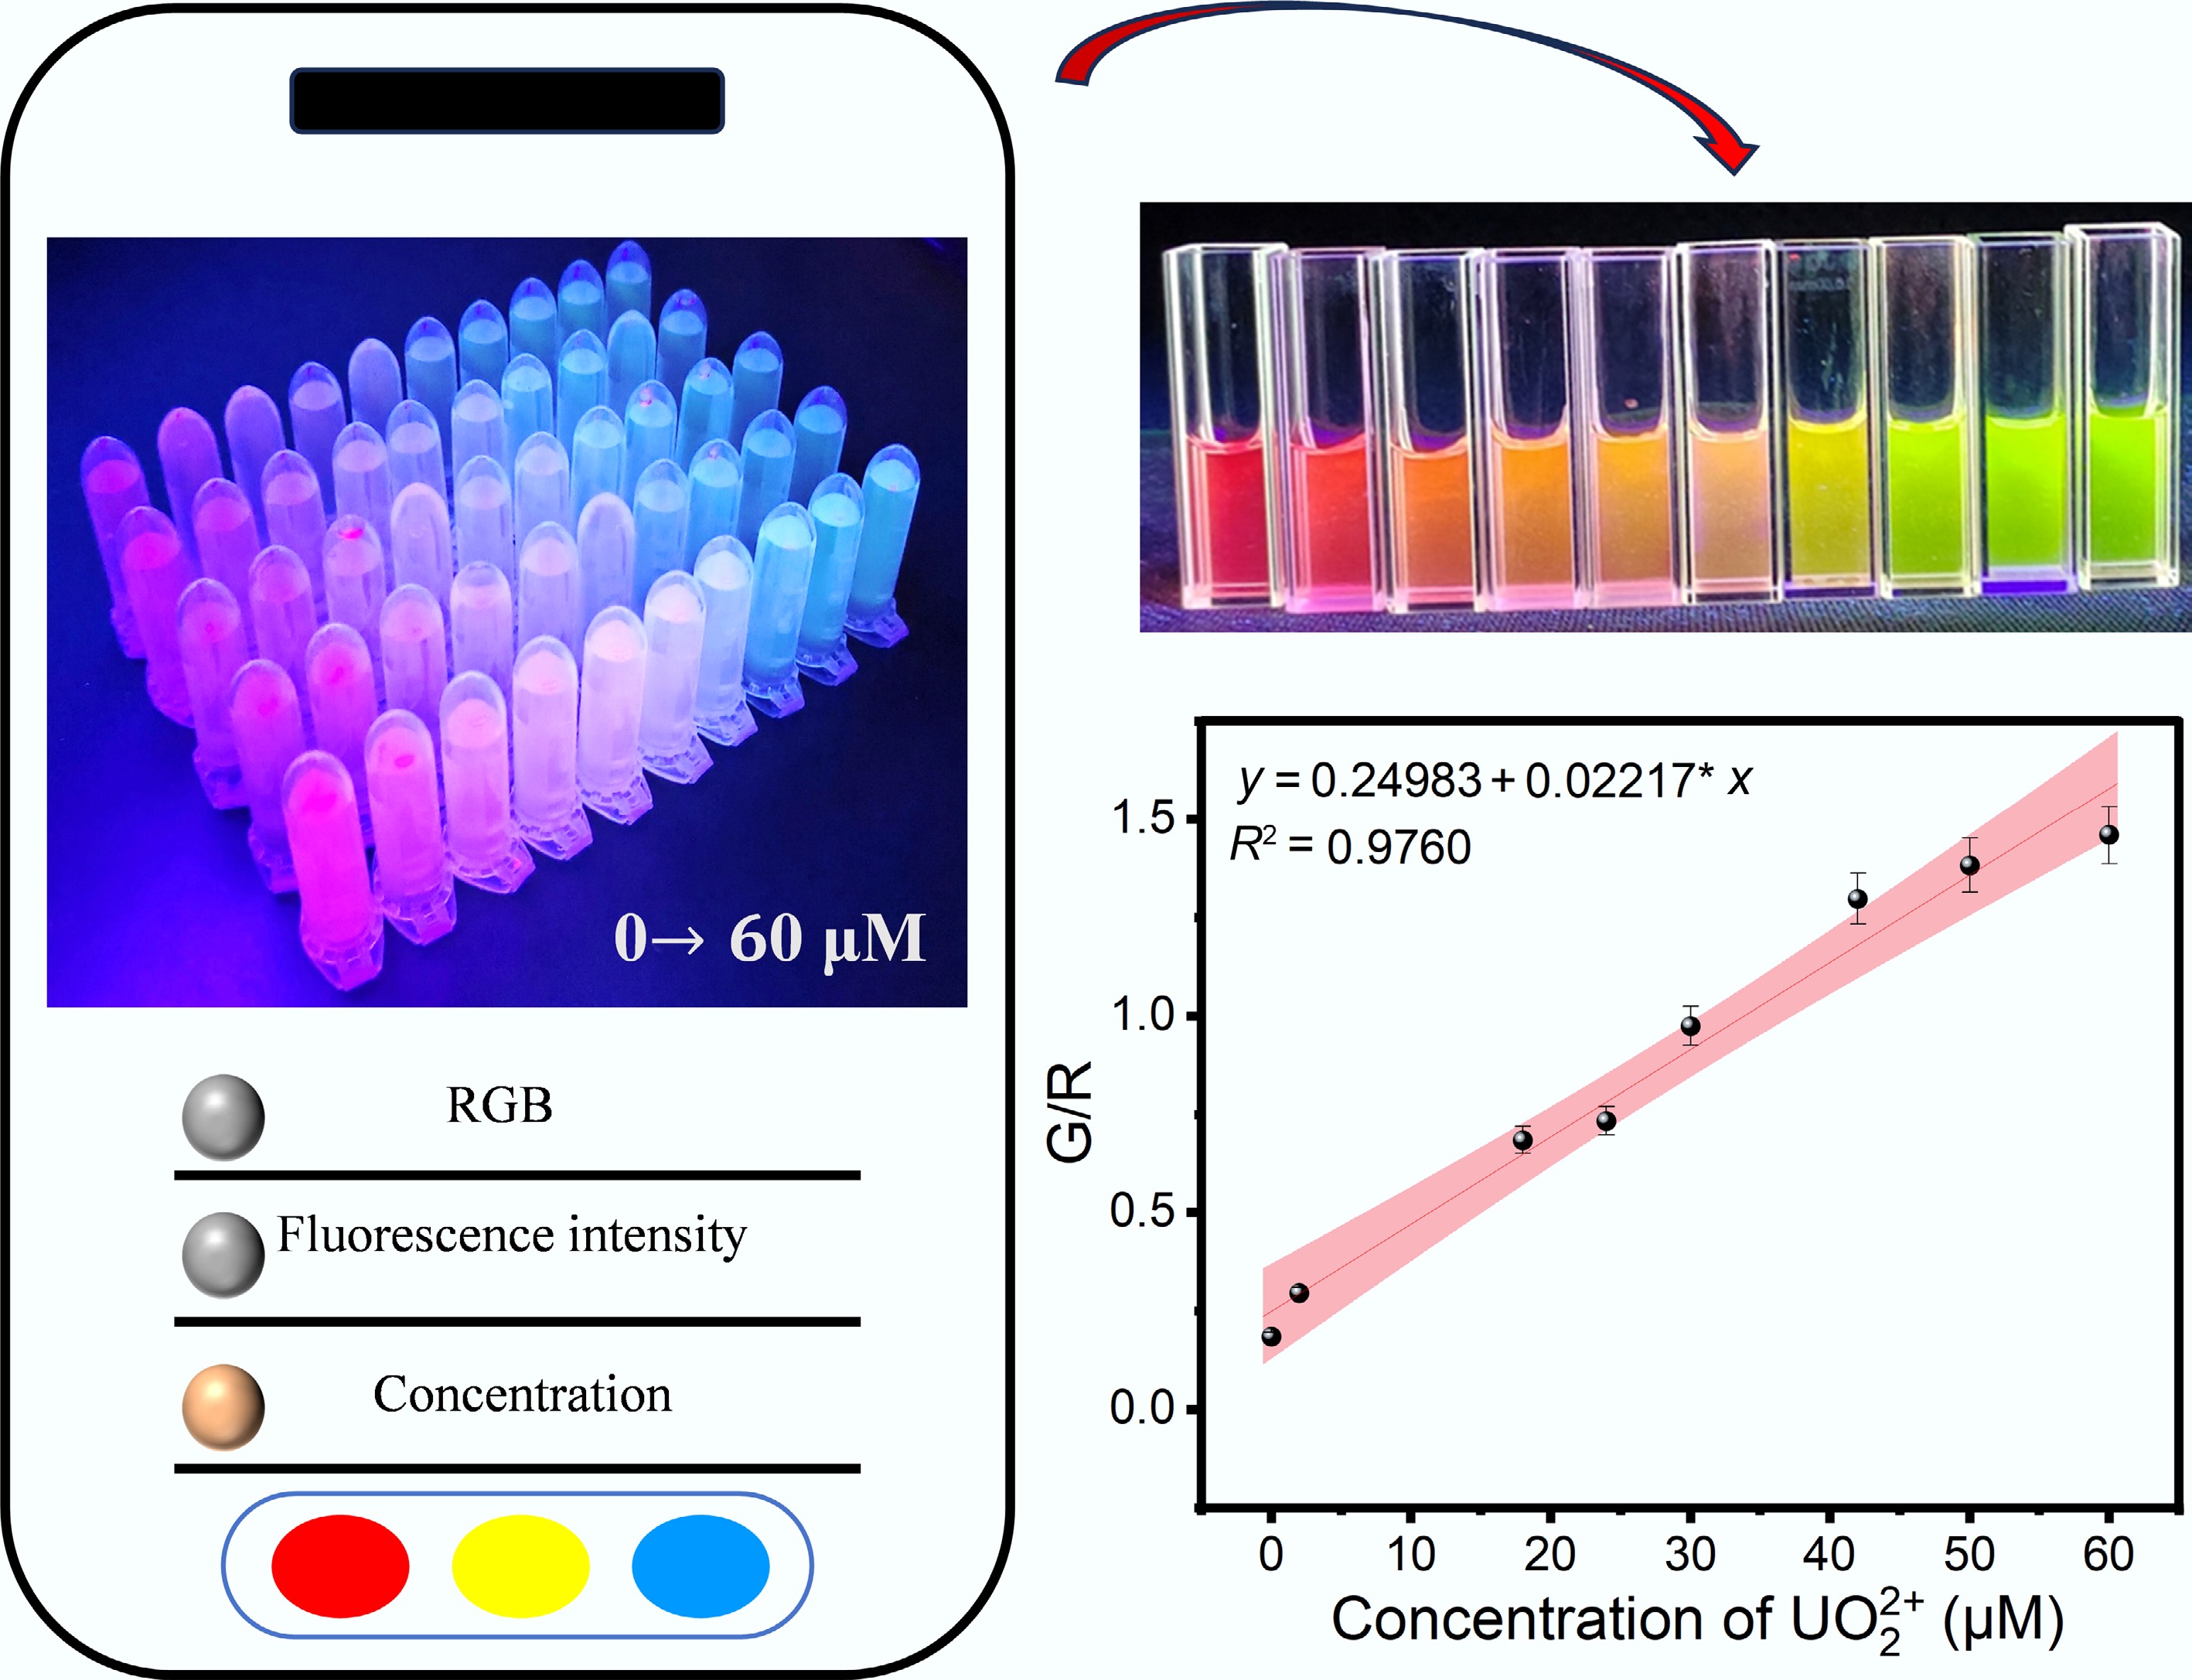
Figure 7.
Quantitative detection of UO22+ by a smartphone-assisted readout platform.
Figures
(7)
Tables
(0)