-
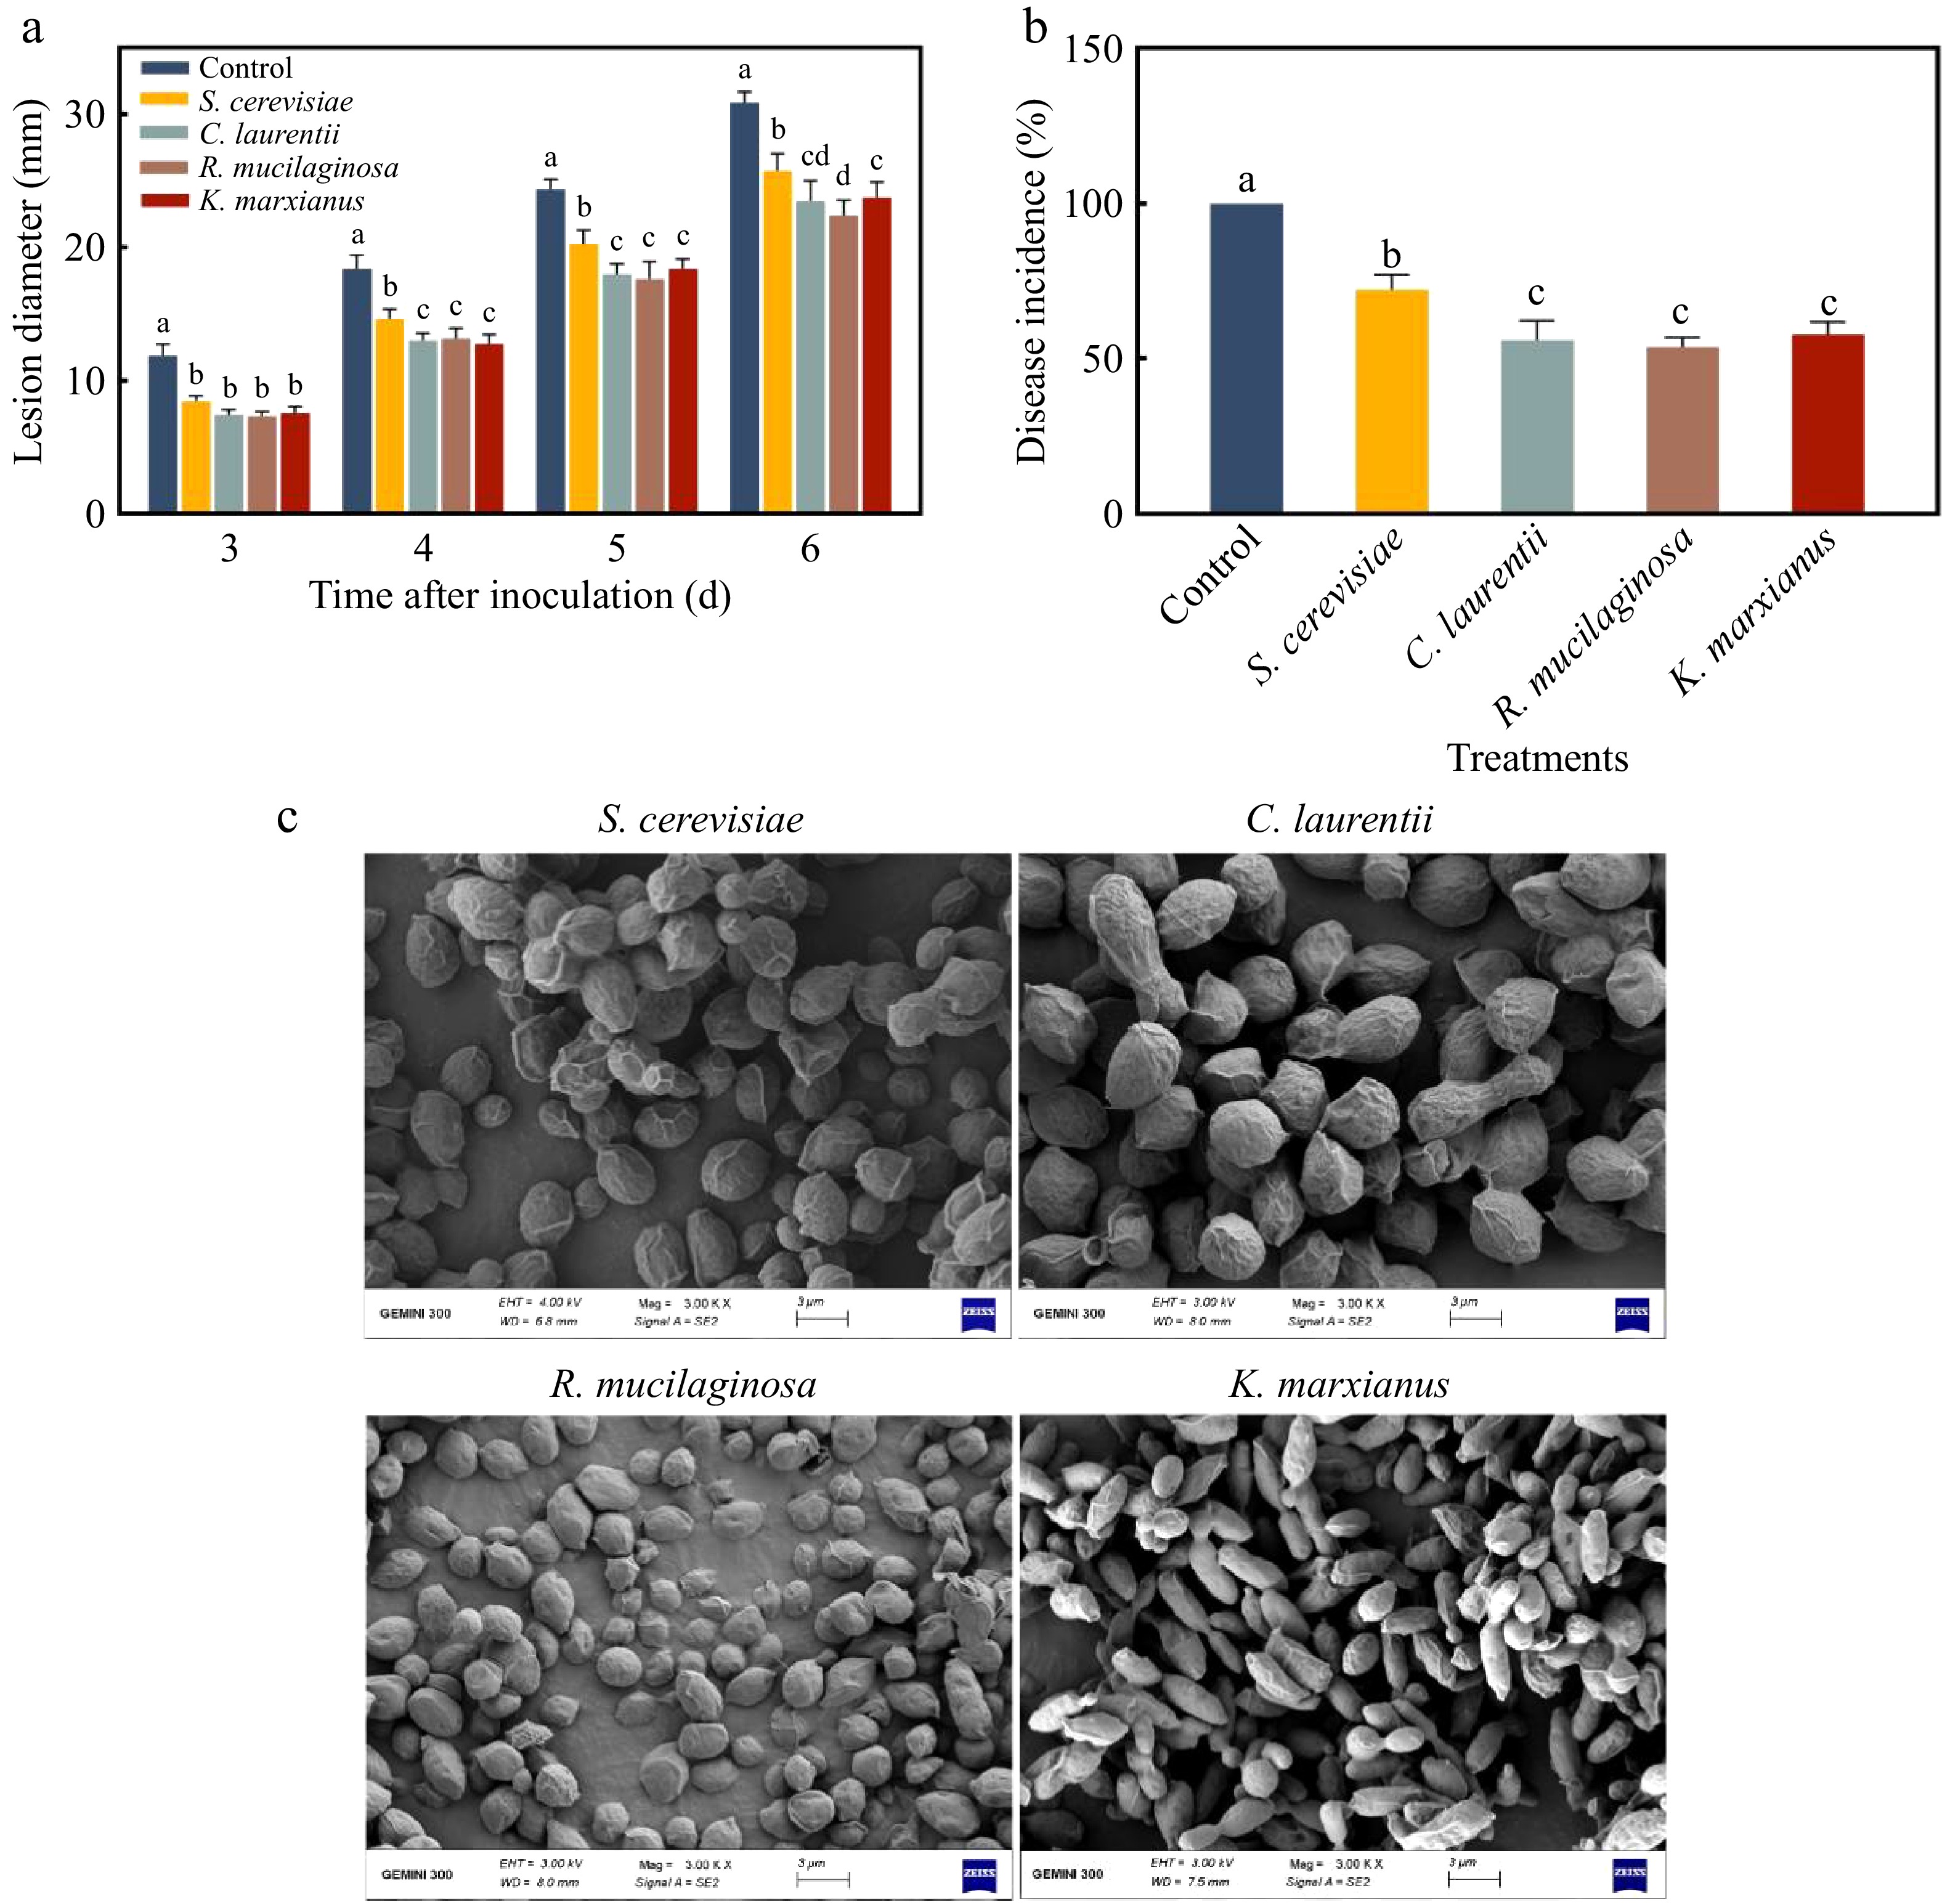
Figure 1.
(a) Lesion diameter and (b) disease incidence of different inactivated yeasts induced resistance to pear blue mold. (c) SEM image of inactivated yeast. Letters indicate significant differences (p < 0.05). Error bars represent mean ± SEM of three replicates.
-
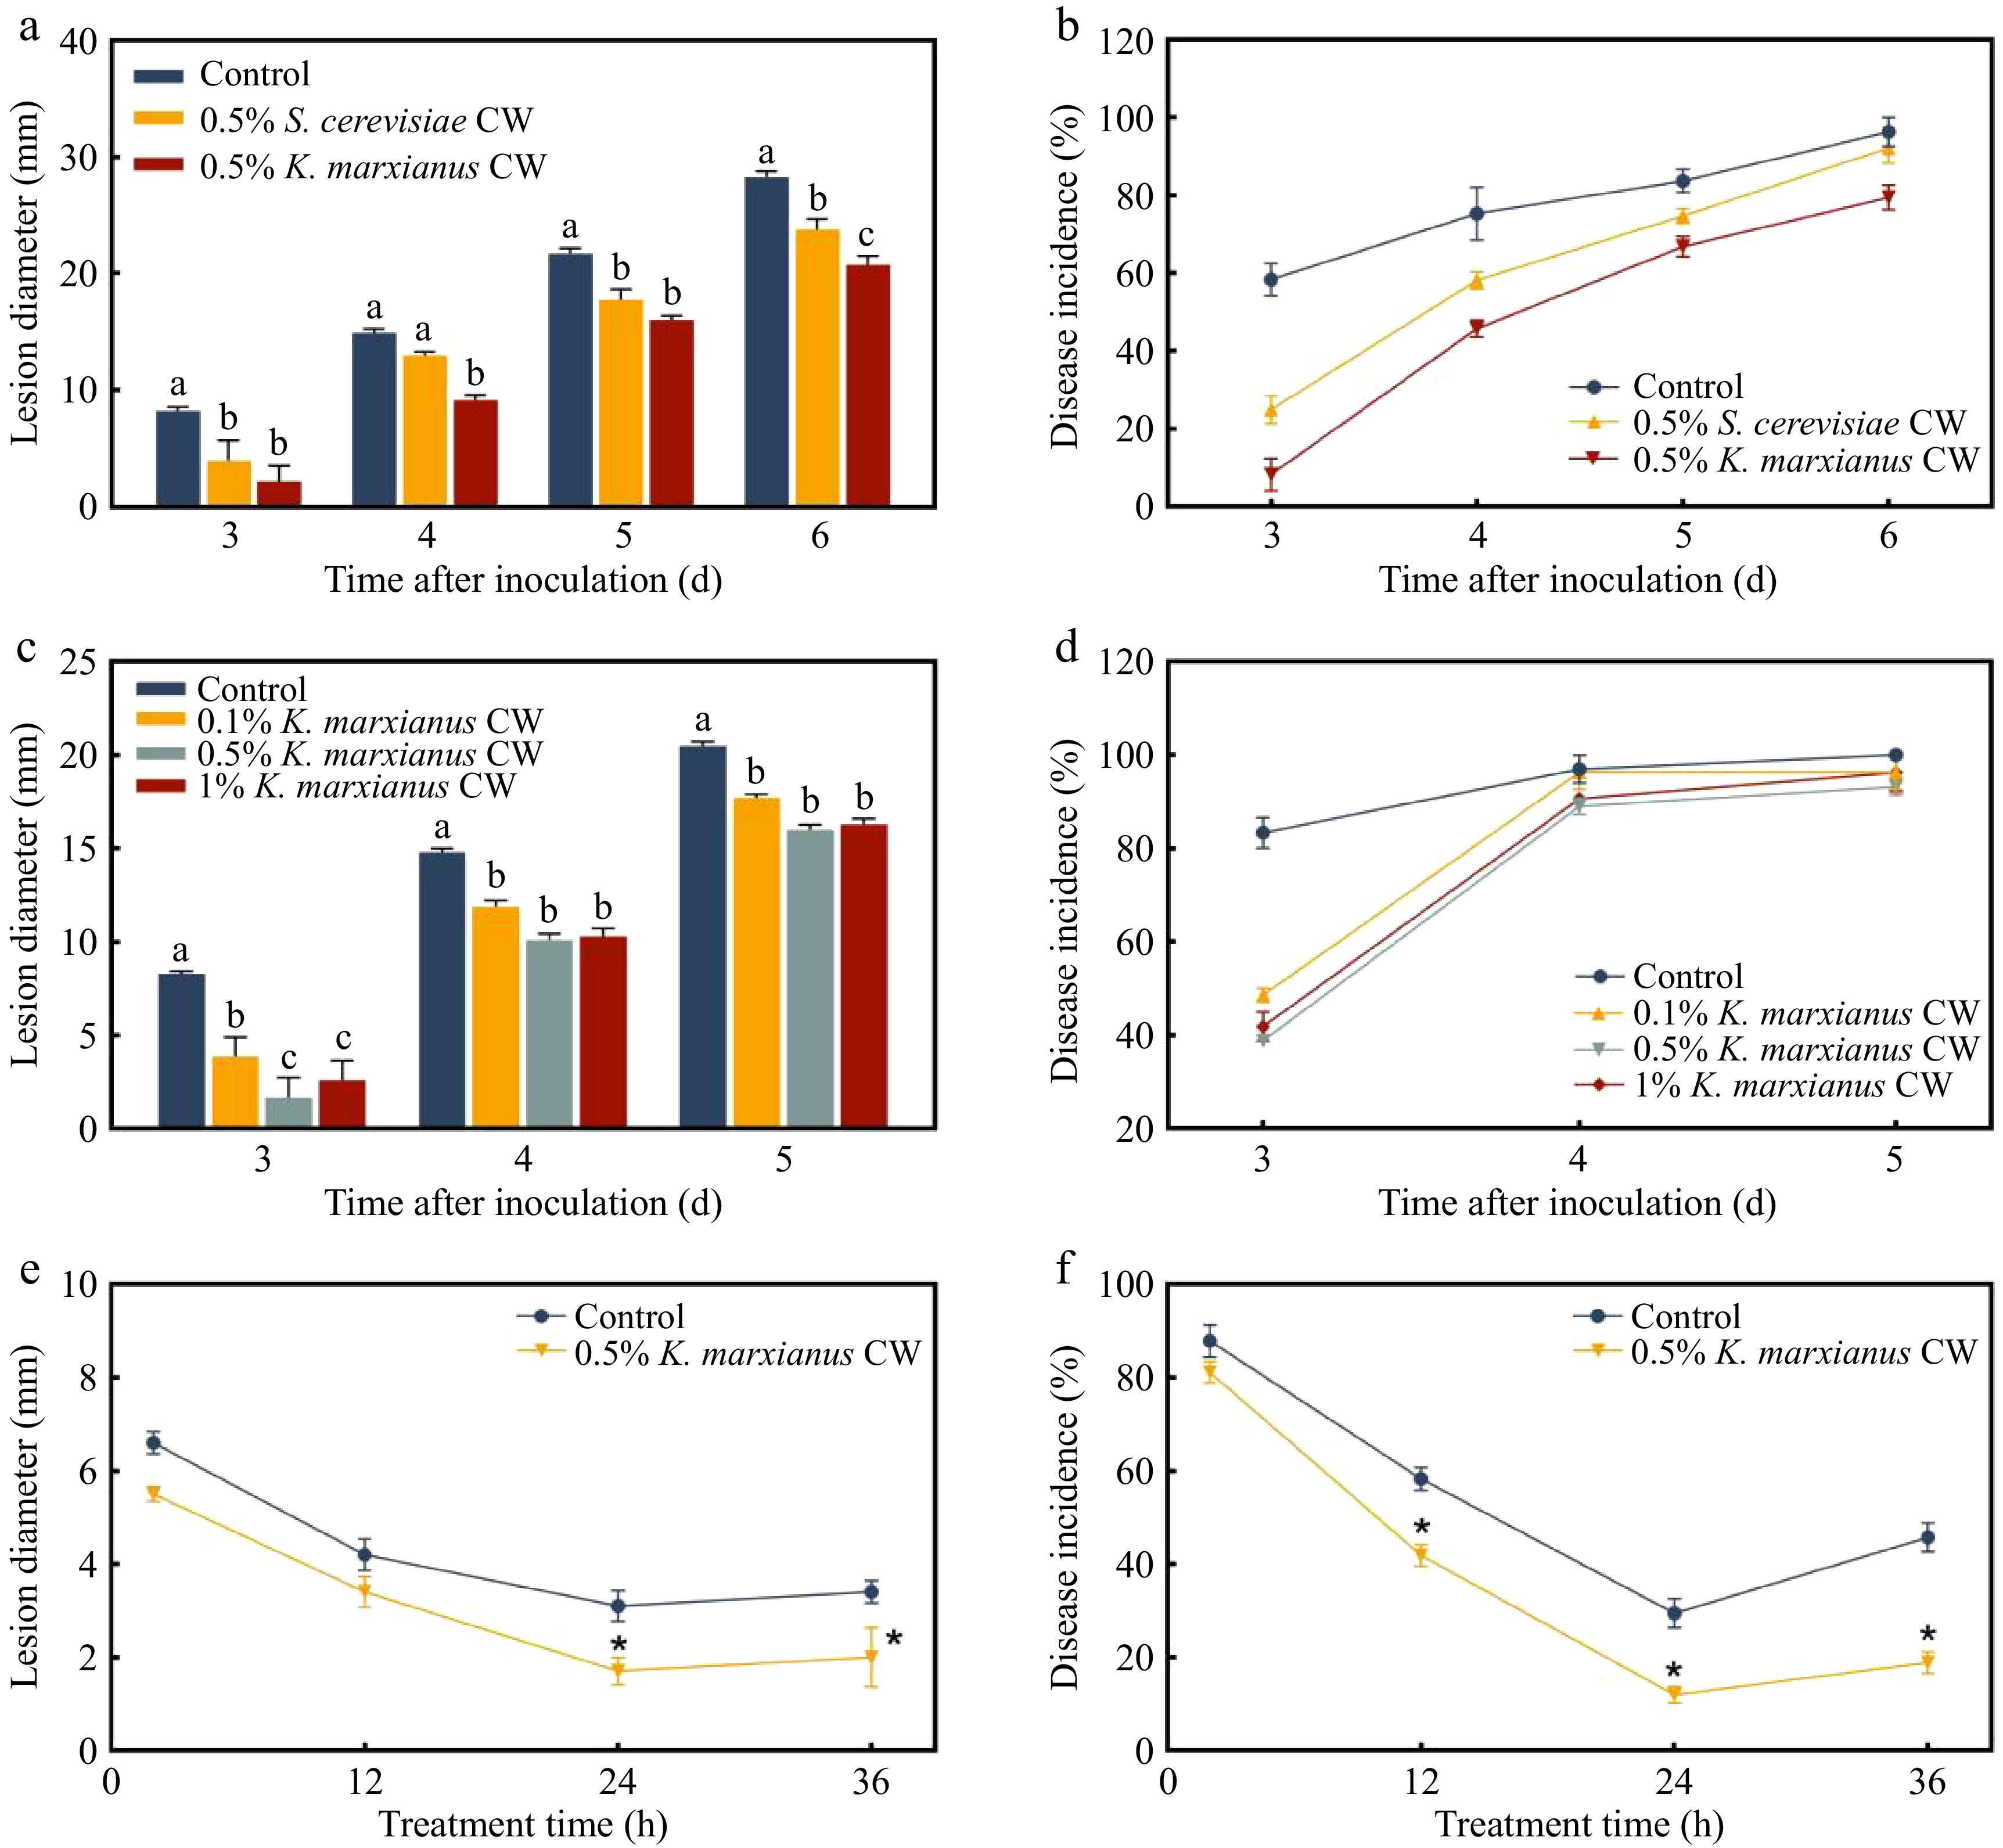
Figure 2.
(a) Lesion diameter and (b) disease incidence of different yeast cell walls induced pear resistance to P. expansum. (c) Lesion diameter and (d) disease incidence of varying concentration gradients of K. marxianus yeast cell wall generated resistance in pear fruit. On day 3, the (e) lesion diameter and (f) disease incidence of pear fruit were subjected to 0.5% (w/v) K. marxianus cell wall at various treatment durations. Control: sterile water; CW: cell wall. Different letters indicate significant differences (p < 0.05). Bars represent mean ± SEM.
-
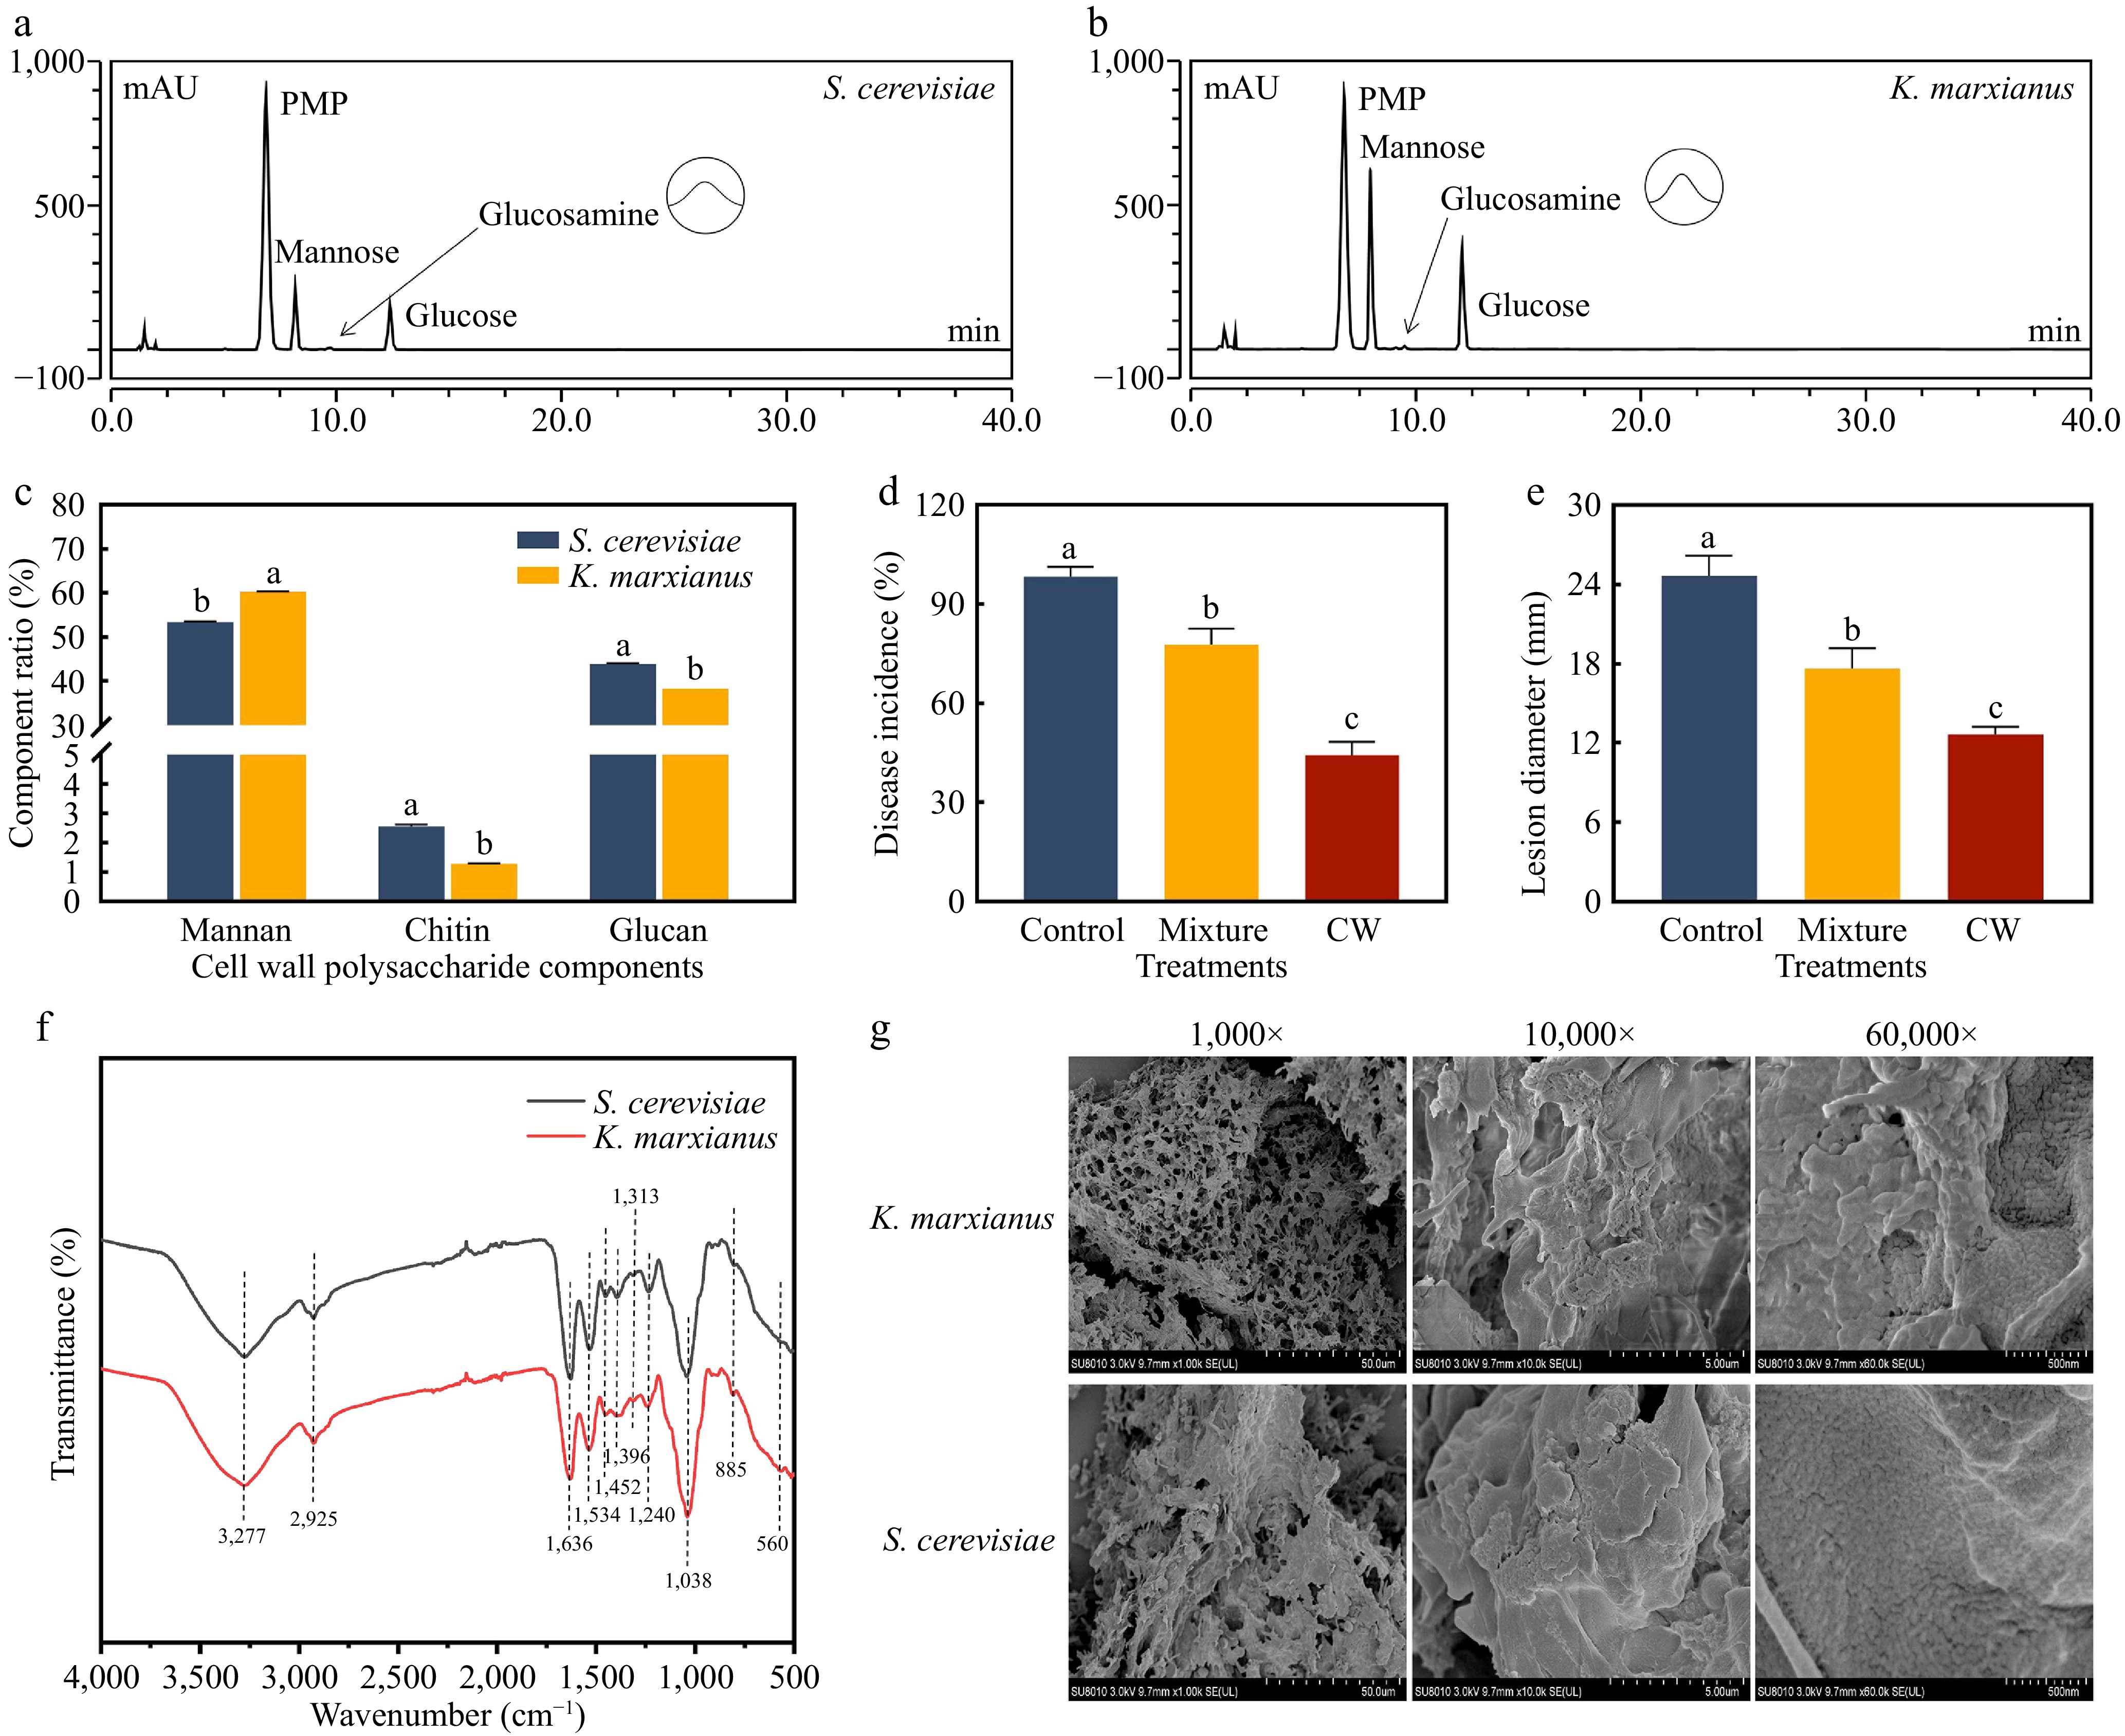
Figure 3.
HPLC chromatograms of cell wall monosaccharides from (a) S. cerevisiae and (b) K. marxianus. (c) Proportion of polysaccharides in the cell walls. On day 5, (d) disease incidence and (e) lesion diameter of 0.5% (w/v) K. marxianus cell wall and its equally proportional polysaccharide mixture induced resistance to pear blue mold. (f) FTIR spectra of the cell walls. (g) SEM images of the K. marxianus and S. cerevisiae cell walls. The letters indicate a significant difference (p < 0.05) by Duncan's multiple-range test. Bars represent the mean ± SEM of three replicates.
-
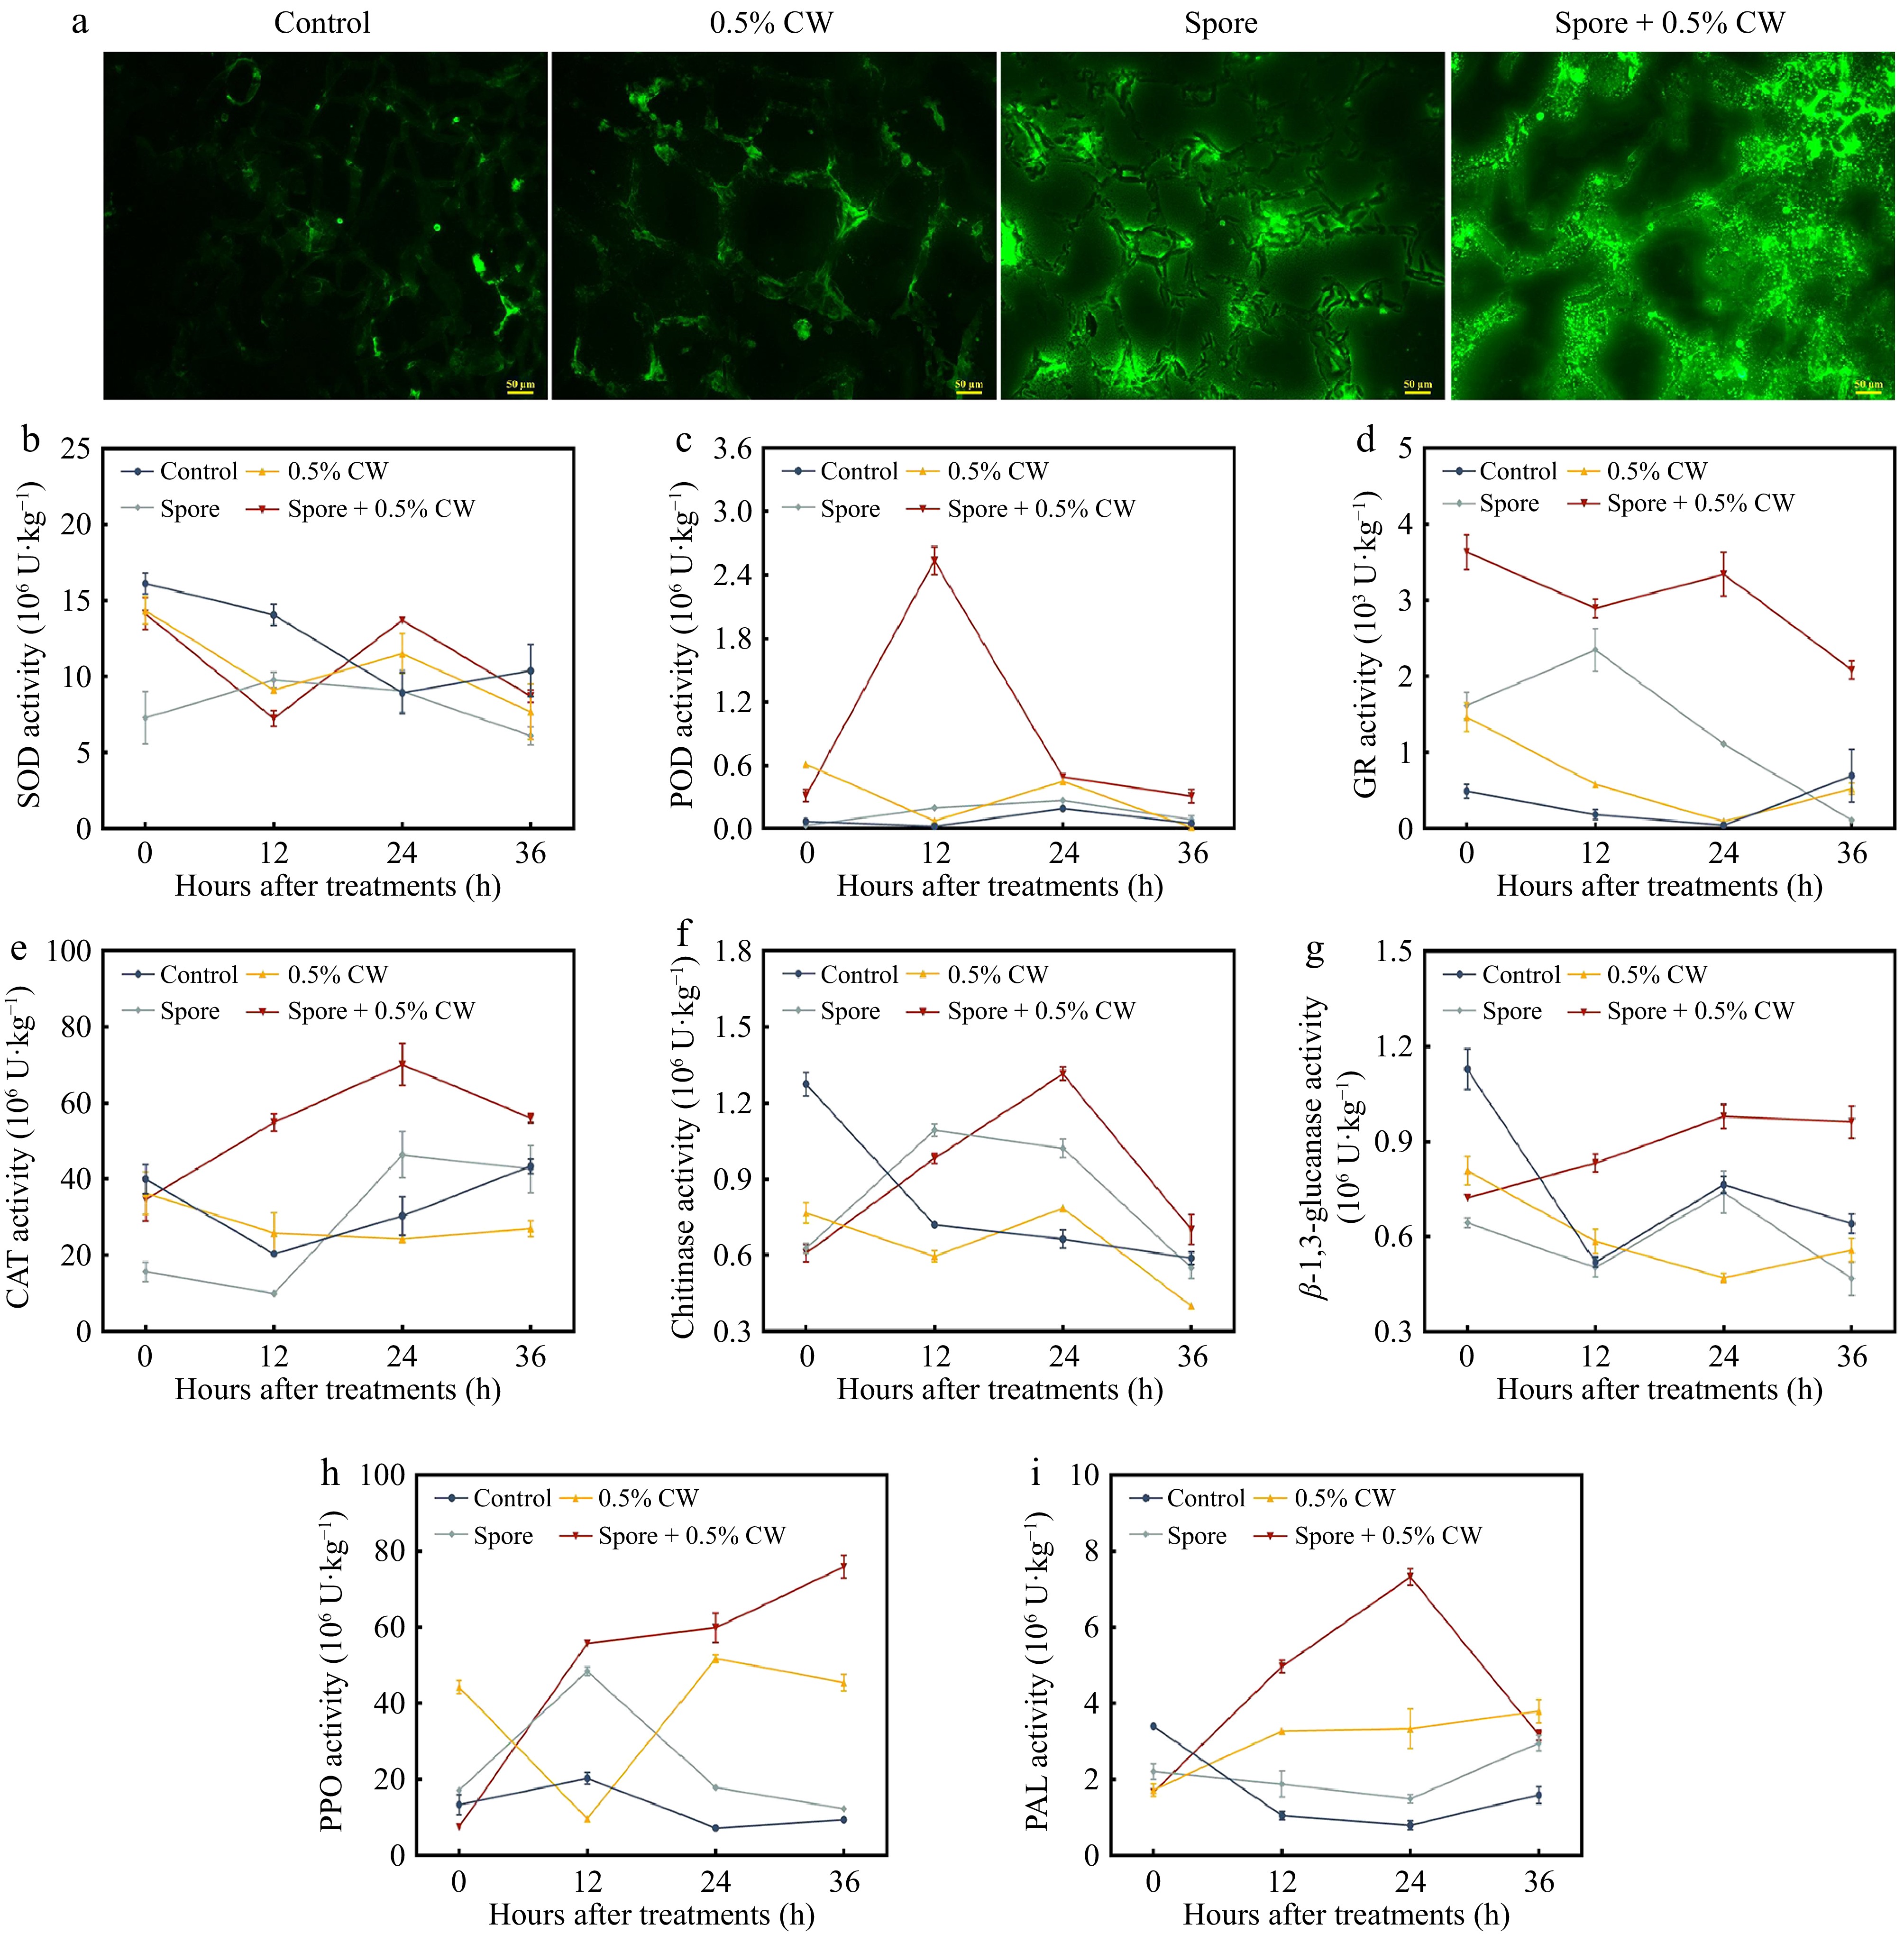
Figure 4.
(a) Reactive oxygen species accumulation in pear fruit after different treatments. Impact of the K. marxianus cell wall on the activities of (b) superoxide dismutase (SOD), (c) peroxidase (POD), (d) glutathione reductase (GR), (e) catalase (CAT), (f) chitinase (CHI), (g) β-1,3-glucanase (GLU), (h) polyphenol oxidase (PPO) and (i) phenylalanine ammonia lyase (PAL) in pear fruit. 0.5% CW: only adding 0.5% (w:v) K. marxianus cell wall-treated pear fruit for 24 h. Different letters indicate significant differences among samples (p < 0.05). Bars represent the mean ± SEM of three independent replicates.
-
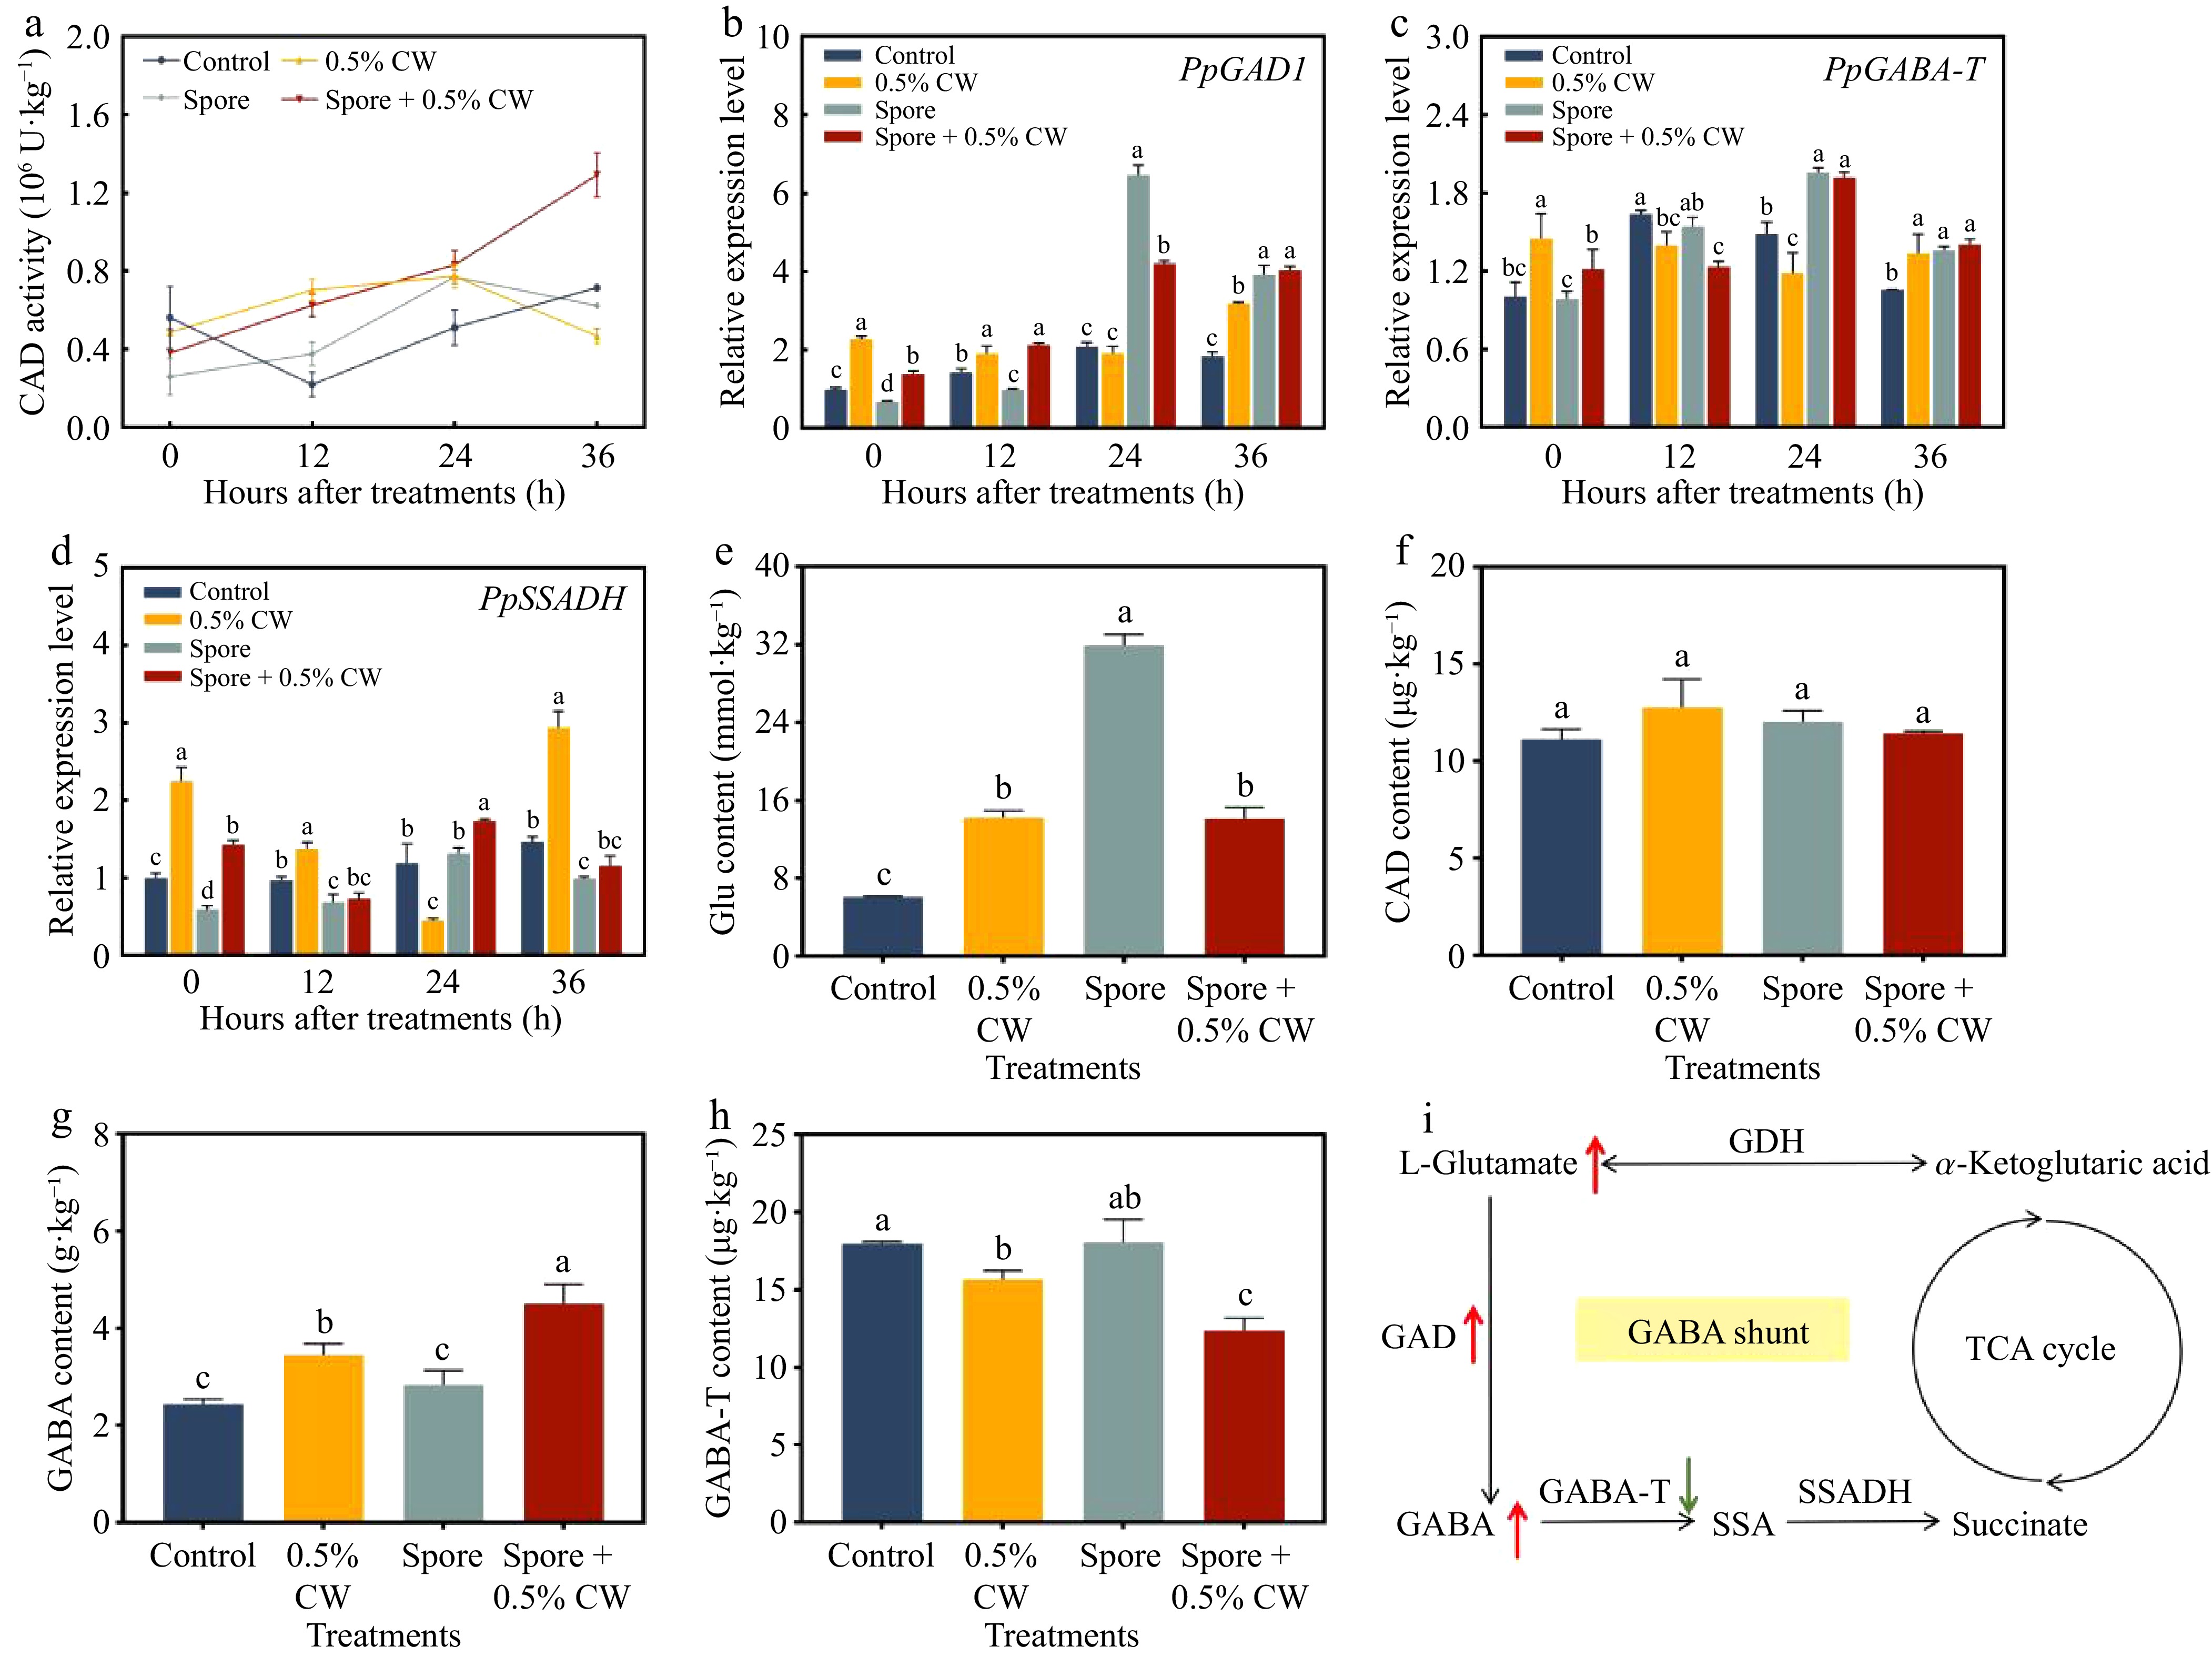
Figure 5.
(a) Activity of glutamate decarboxylase (GAD), (b) gene expression of GAD1, (c) GABA transaminase (GABA-T), and (d) succinic semialdehyde dehydrogenase (SSADH) in pears. (e) Content of L-glutamate (Glu), (f) GAD, (g) GABA, and (h) GABA-T in pear fruit after spore treatment for 36 h. (i) GABA shunt metabolic pathway in pear. GDH: glutamate dehydrogenase; SSA: succinic semialdehyde. Different letters represent significant differences (p < 0.05). Error bars represent mean ± SEM of three independent replicates.
-
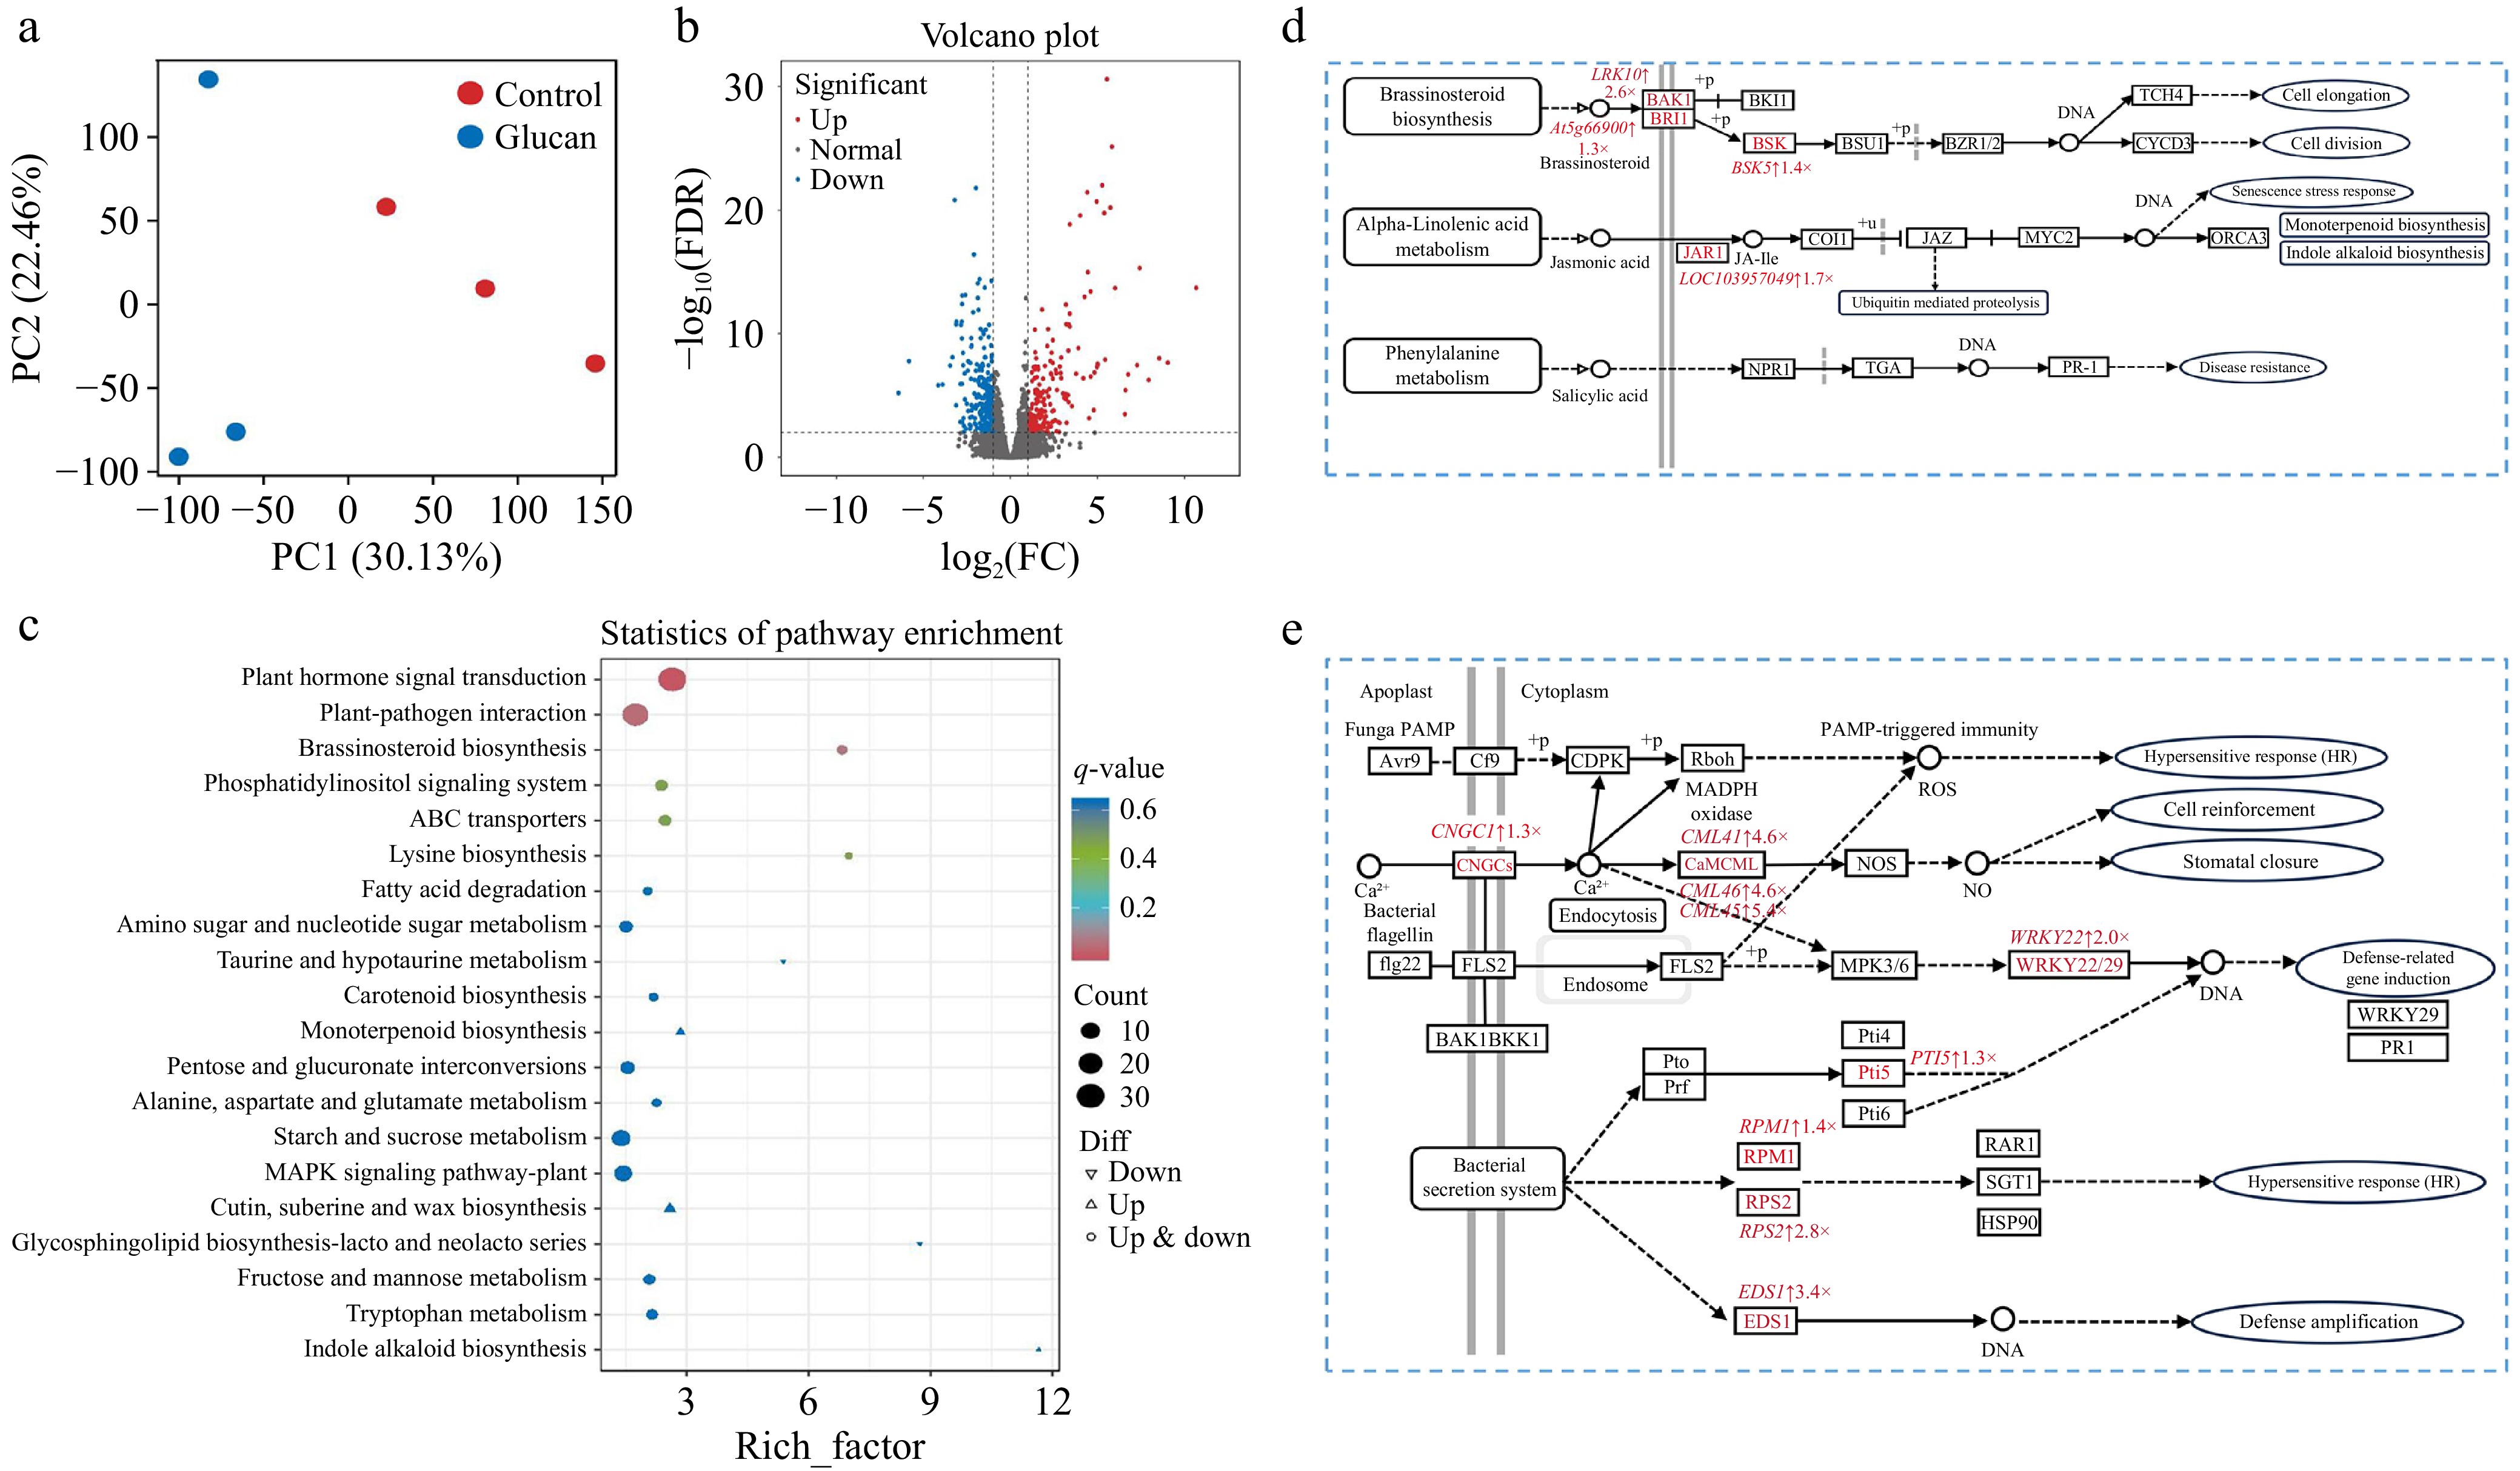
Figure 6.
Transcriptomic analysis of β-glucan-induced resistance in pear fruit. (a) PCA plot of all samples. (b) Volcano plot of differentially expressed genes. (c) KEGG pathway enrichment analysis of control vs. β-glucan. (d) Plant hormone signal transduction pathways. (e) Plant–pathogen interaction pathways. Red indicates upregulated genes. Light red represents genes with 1 ≤ log2FC < 2, while dark red represents genes with log2FC ≥ 2. Pathway maps were generated based on the KEGG database and reproduced with permission.
-
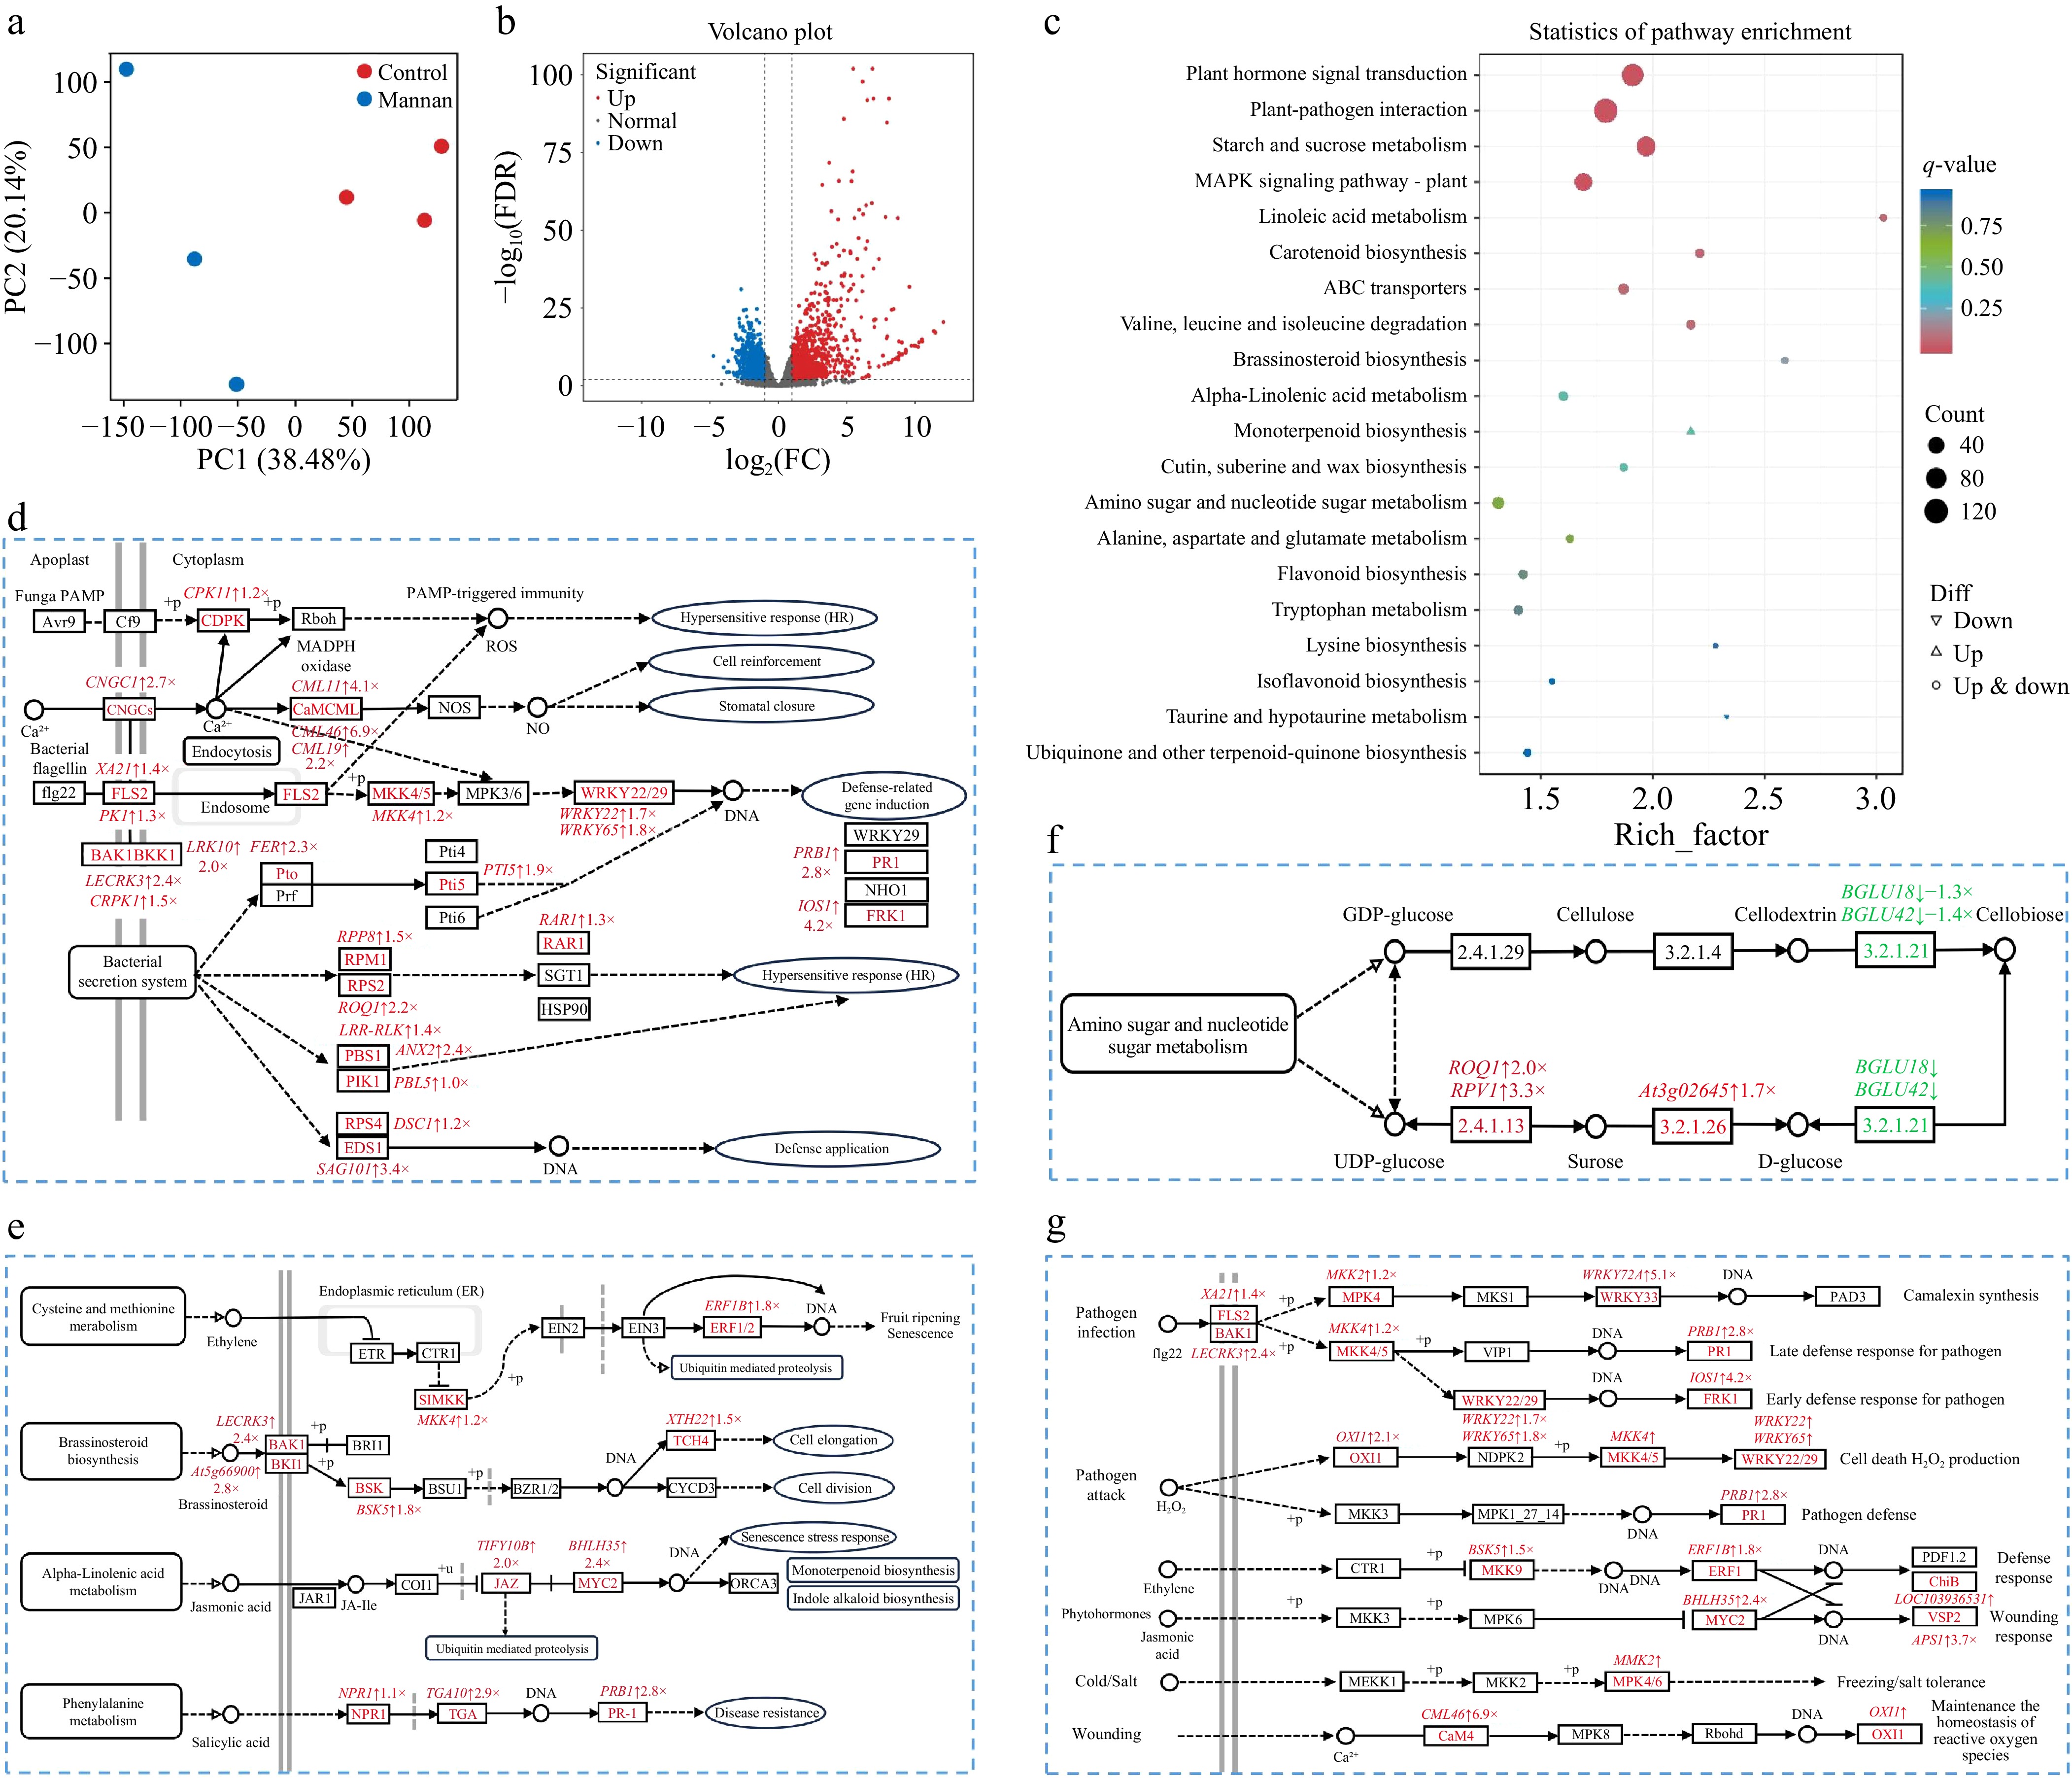
Figure 7.
Transcriptomic analysis of mannan-induced resistance in pear fruit. (a) PCA plot and (b) volcano plot of differentially expressed genes. (c) KEGG pathway enrichment analysis of control vs mannan. (d) Plant–pathogen interaction pathways. (e) Plant hormone signal transduction pathways. (f) Starch and sucrose metabolic pathways. (g) MAPK signalling pathways. Red indicates upregulated genes and green indicates downregulated genes. Pathway maps were generated using the KEGG database and modified with permission.
Figures
(7)
Tables
(0)