-
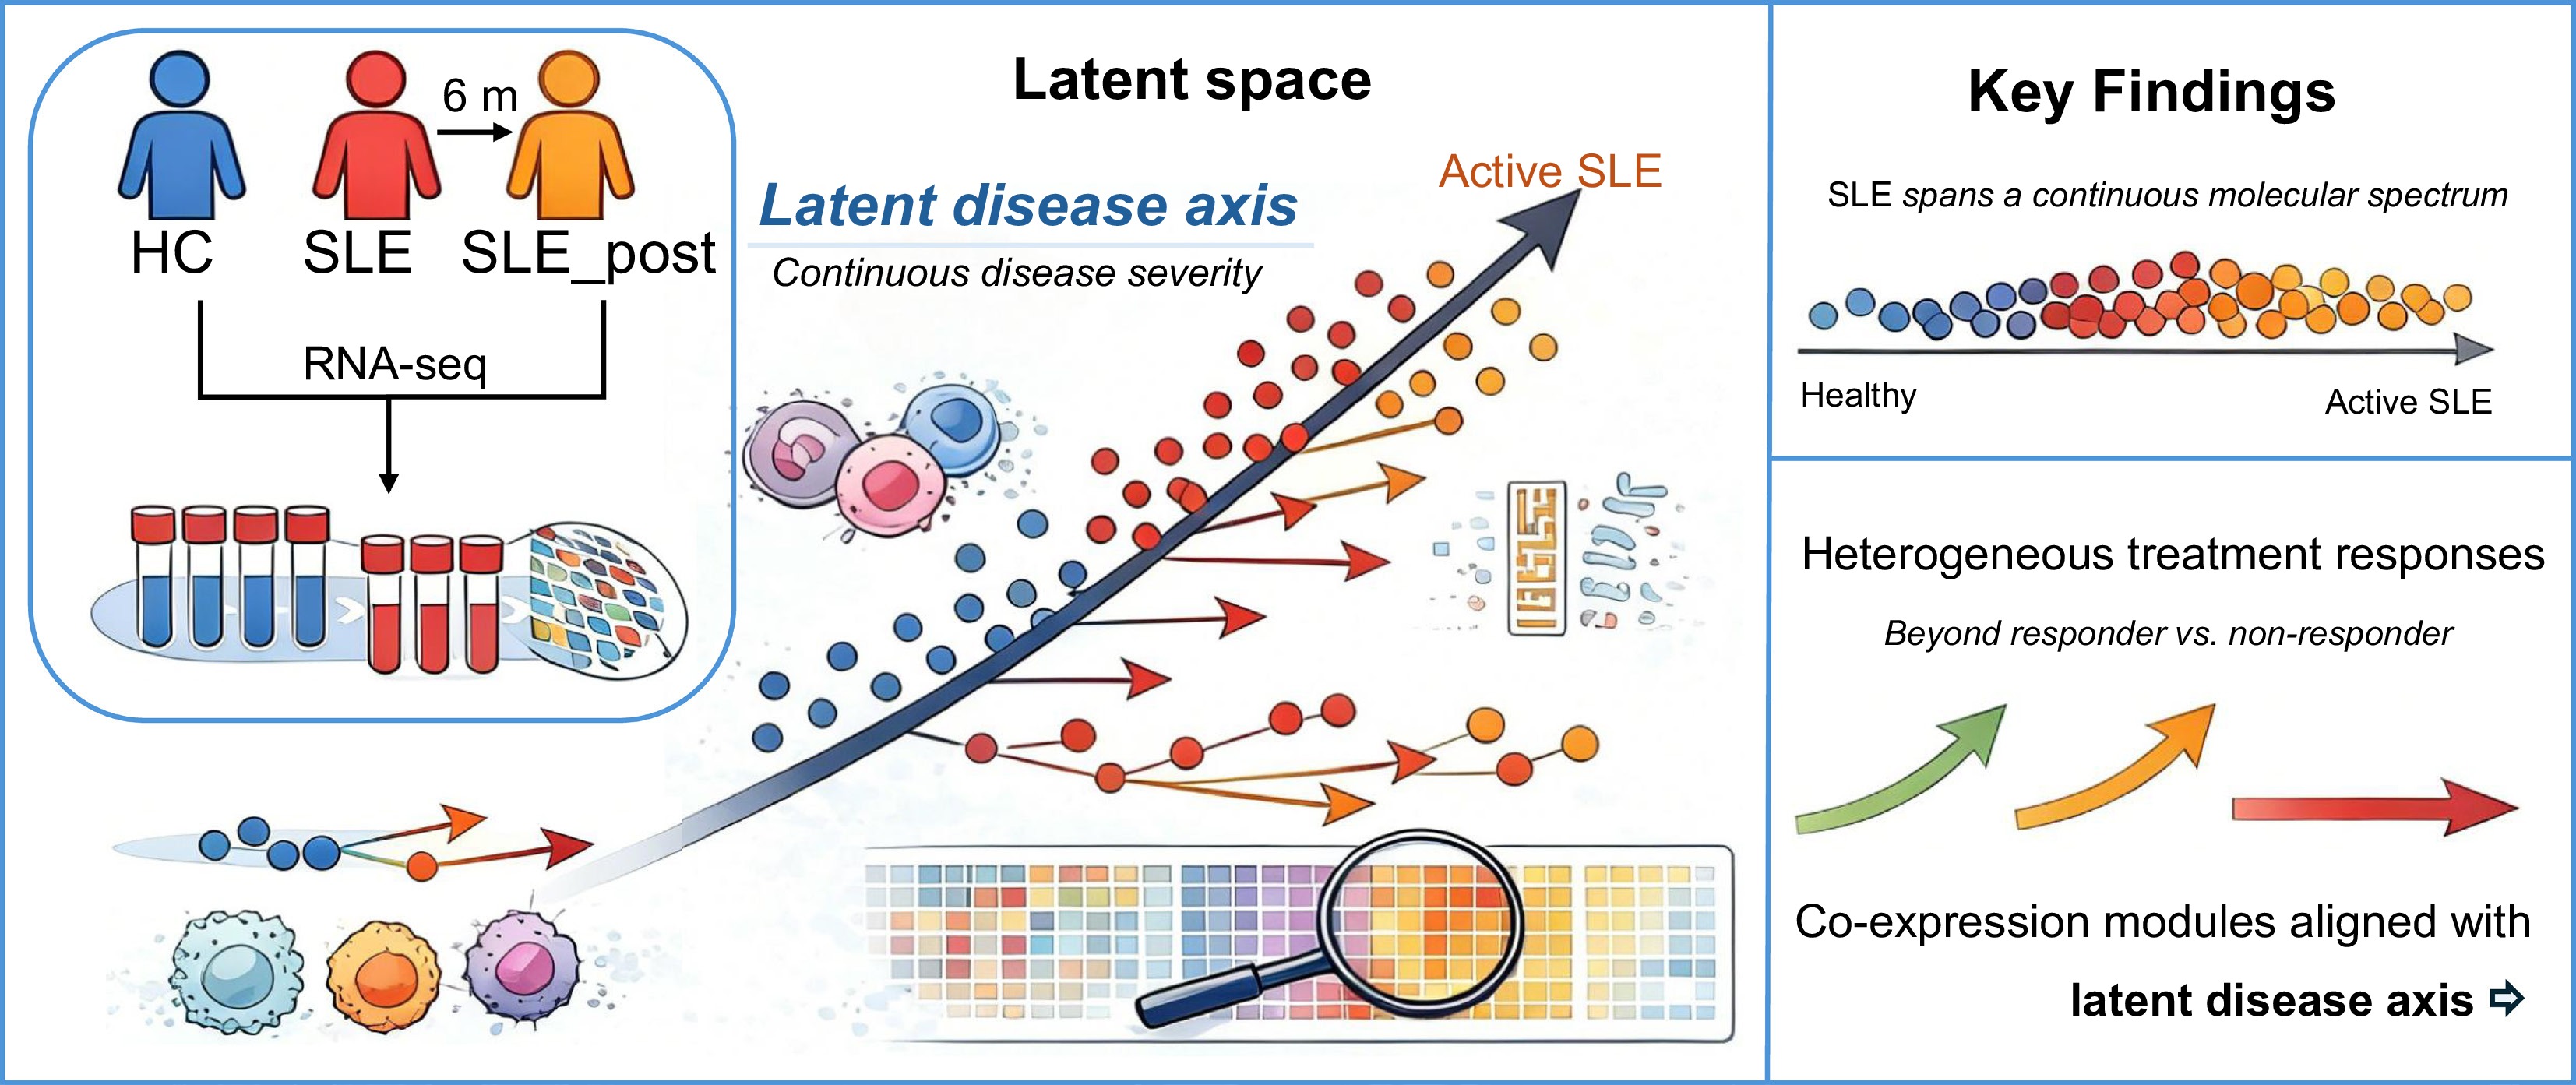
Figure 1.
Conceptual framework of a latent disease axis for SLE.
-
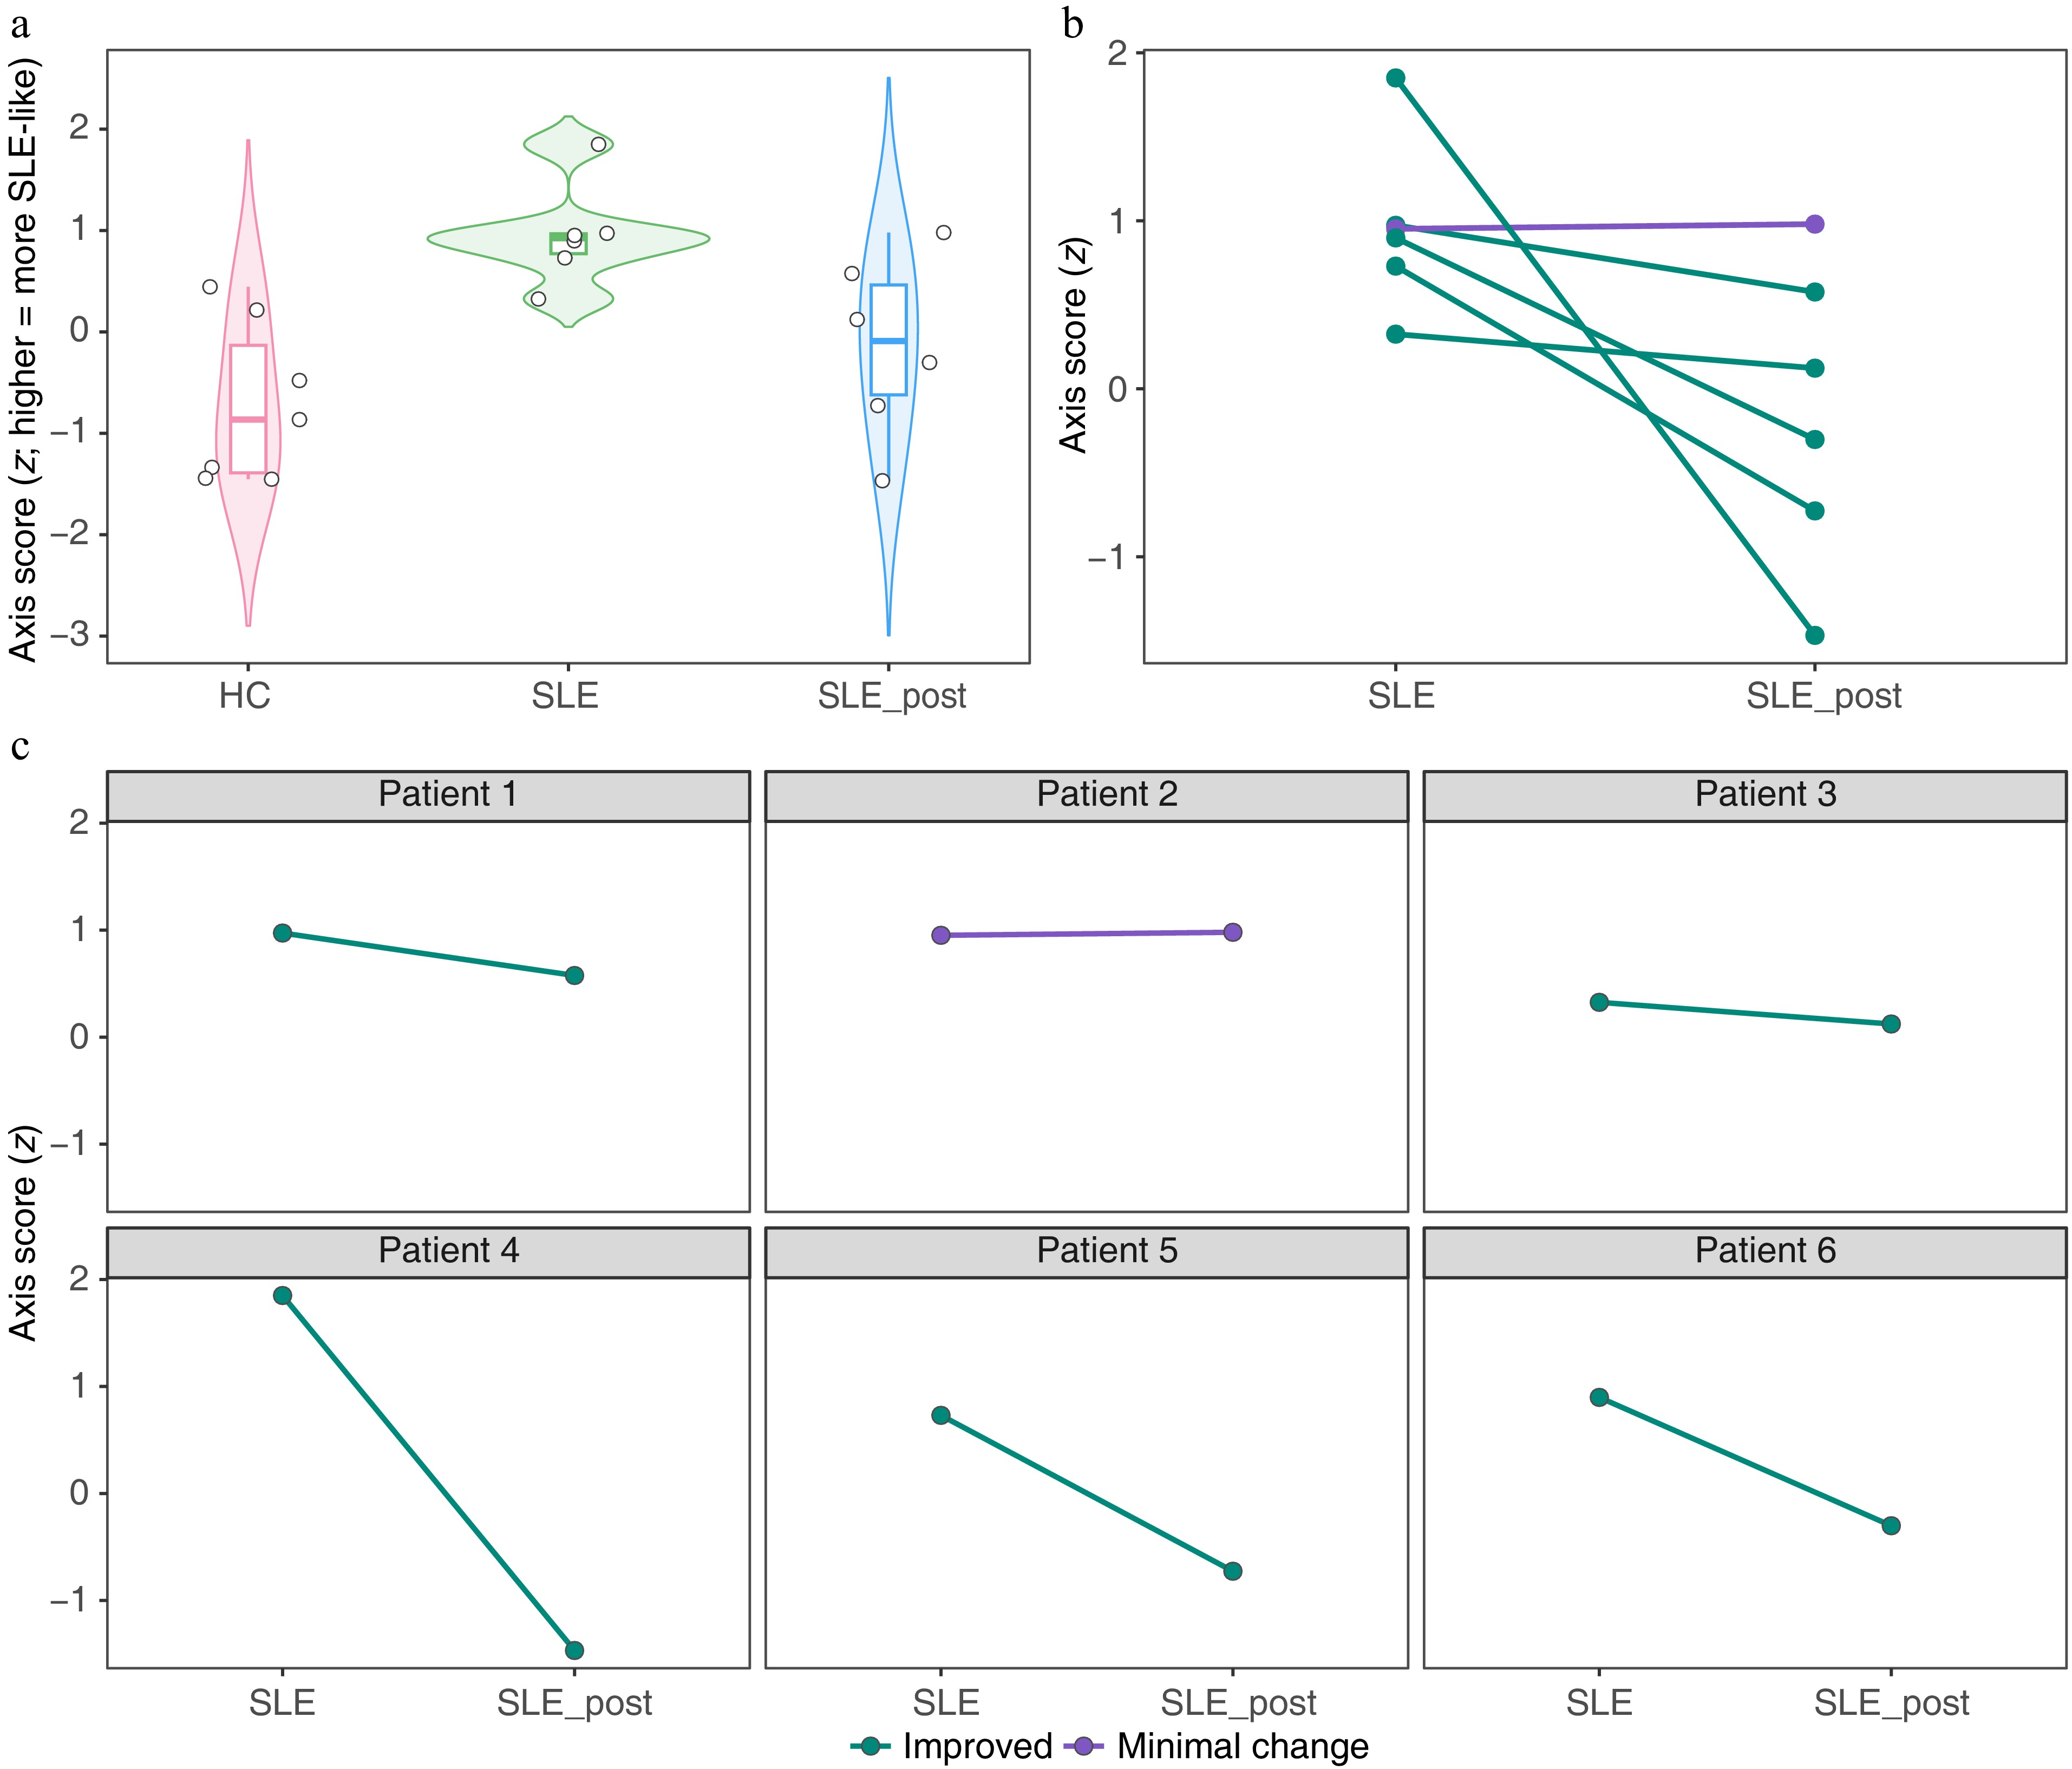
Figure 2.
Disease-axis projection and paired treatment shifts. (a) Distribution of disease-axis projection scores for healthy controls (HC), untreated SLE patients (SLE), and post-treatment SLE samples (SLE_post). Higher scores indicate a more SLE-like transcriptional state. (b) Paired shifts along the disease axis for individual patients, comparing pre-treatment (SLE) and post-treatment (SLE_post) samples. Each line represents one patient. (c) Individual-level treatment trajectories, highlighting heterogeneous responses ranging from marked improvement to minimal change.
-
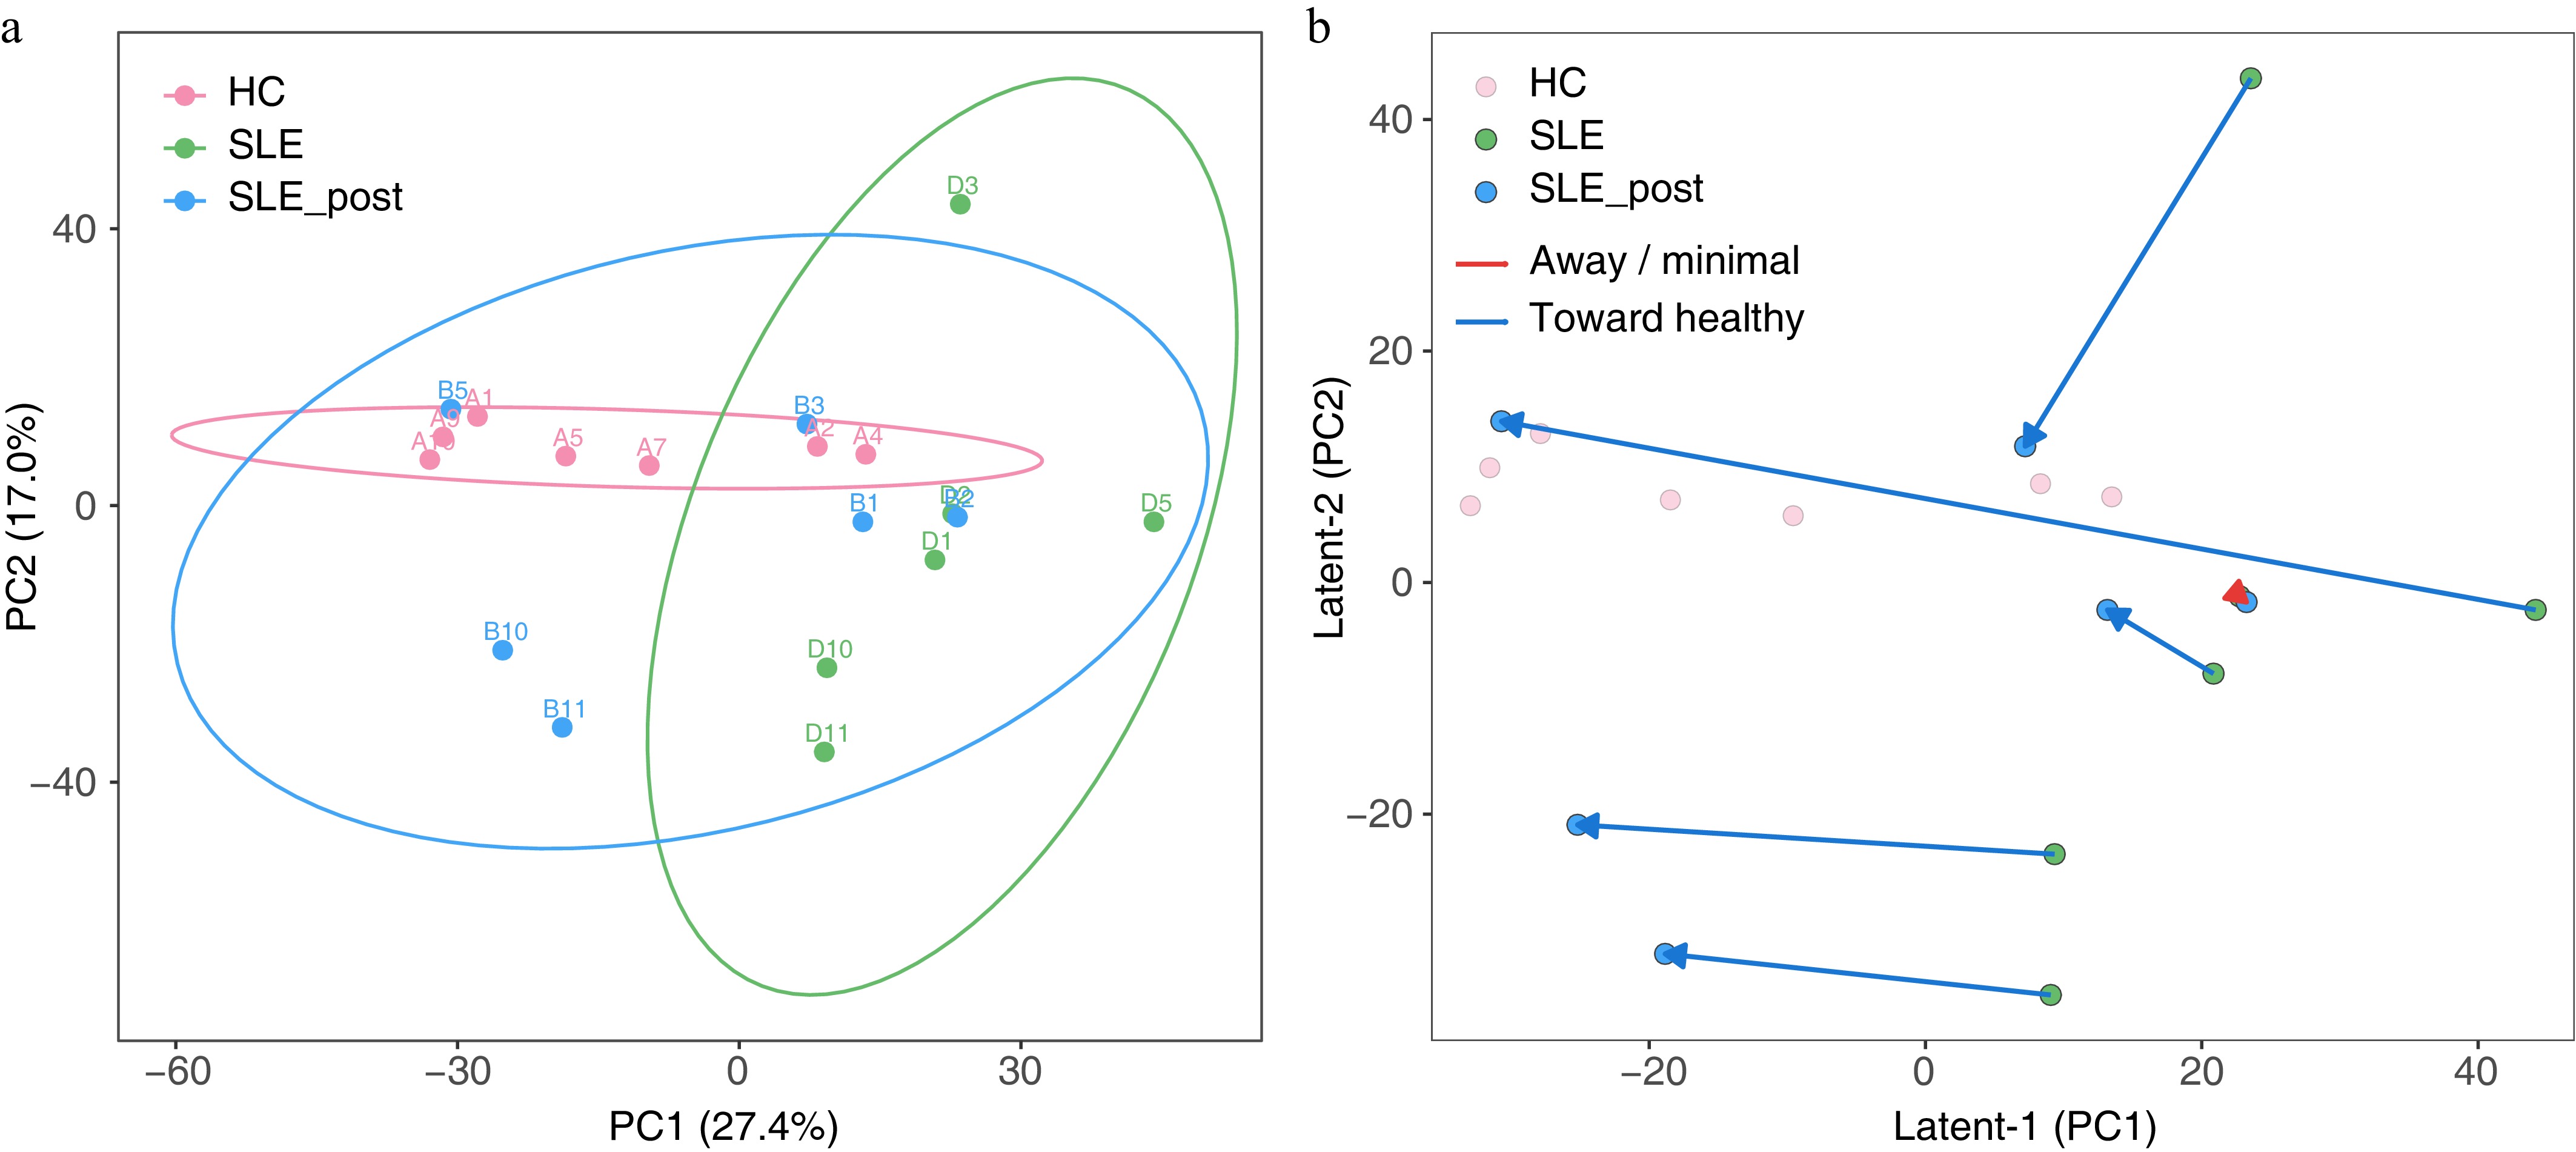
Figure 3.
Representation analysis revealing treatment-associated trajectories in the latent space. (a) PCA of normalized gene expression across HC, SLE (pre-treatment), and SLE_post (post-treatment). Ellipses denote 95% confidence regions. (b) Latent manifold embedding showing individual treatment vectors
$ {\delta }_{i}={z}_{i,\text{SLET}}-{z}_{i,\text{SLE}} $ $ \text{Δ}{s}_{i}> 0 $ $ \text{Δ}{s}_{i}\leq 0 $ -
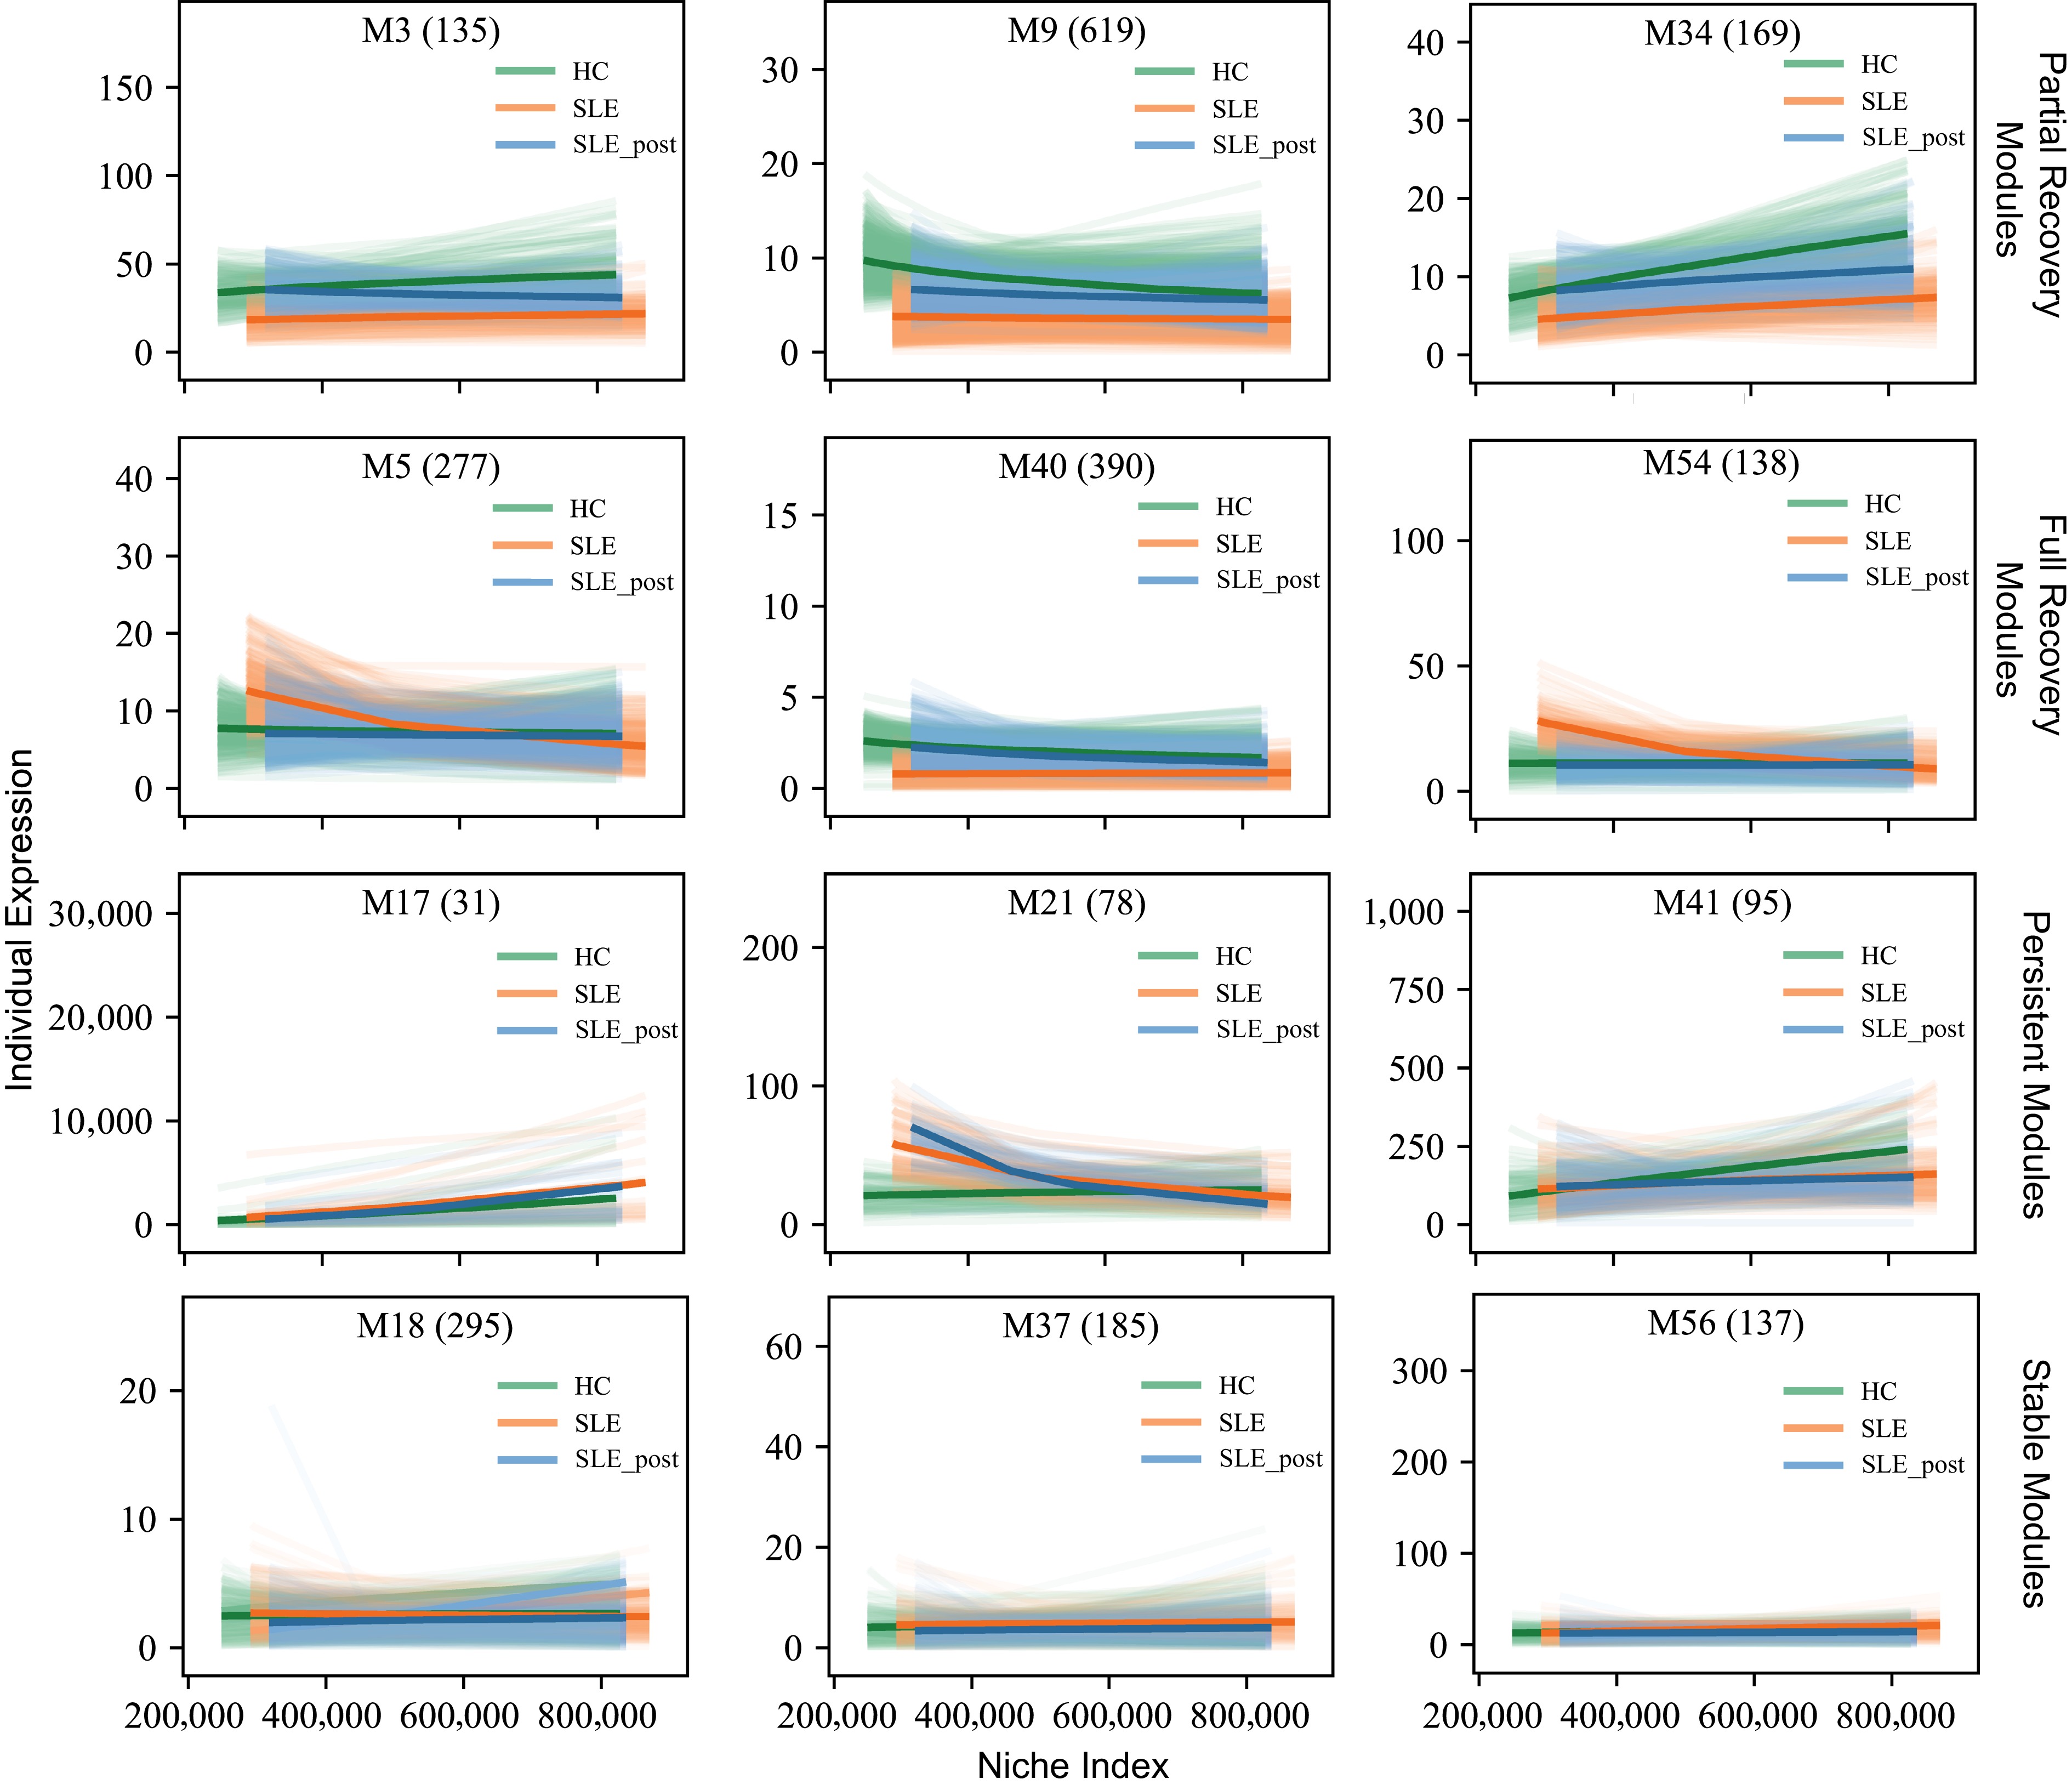
Figure 4.
Representative trajectory-defined modules identified by trivariate functional clustering across healthy controls (HC), untreated SLE, and SLE_post (post-treatment SLE).
-
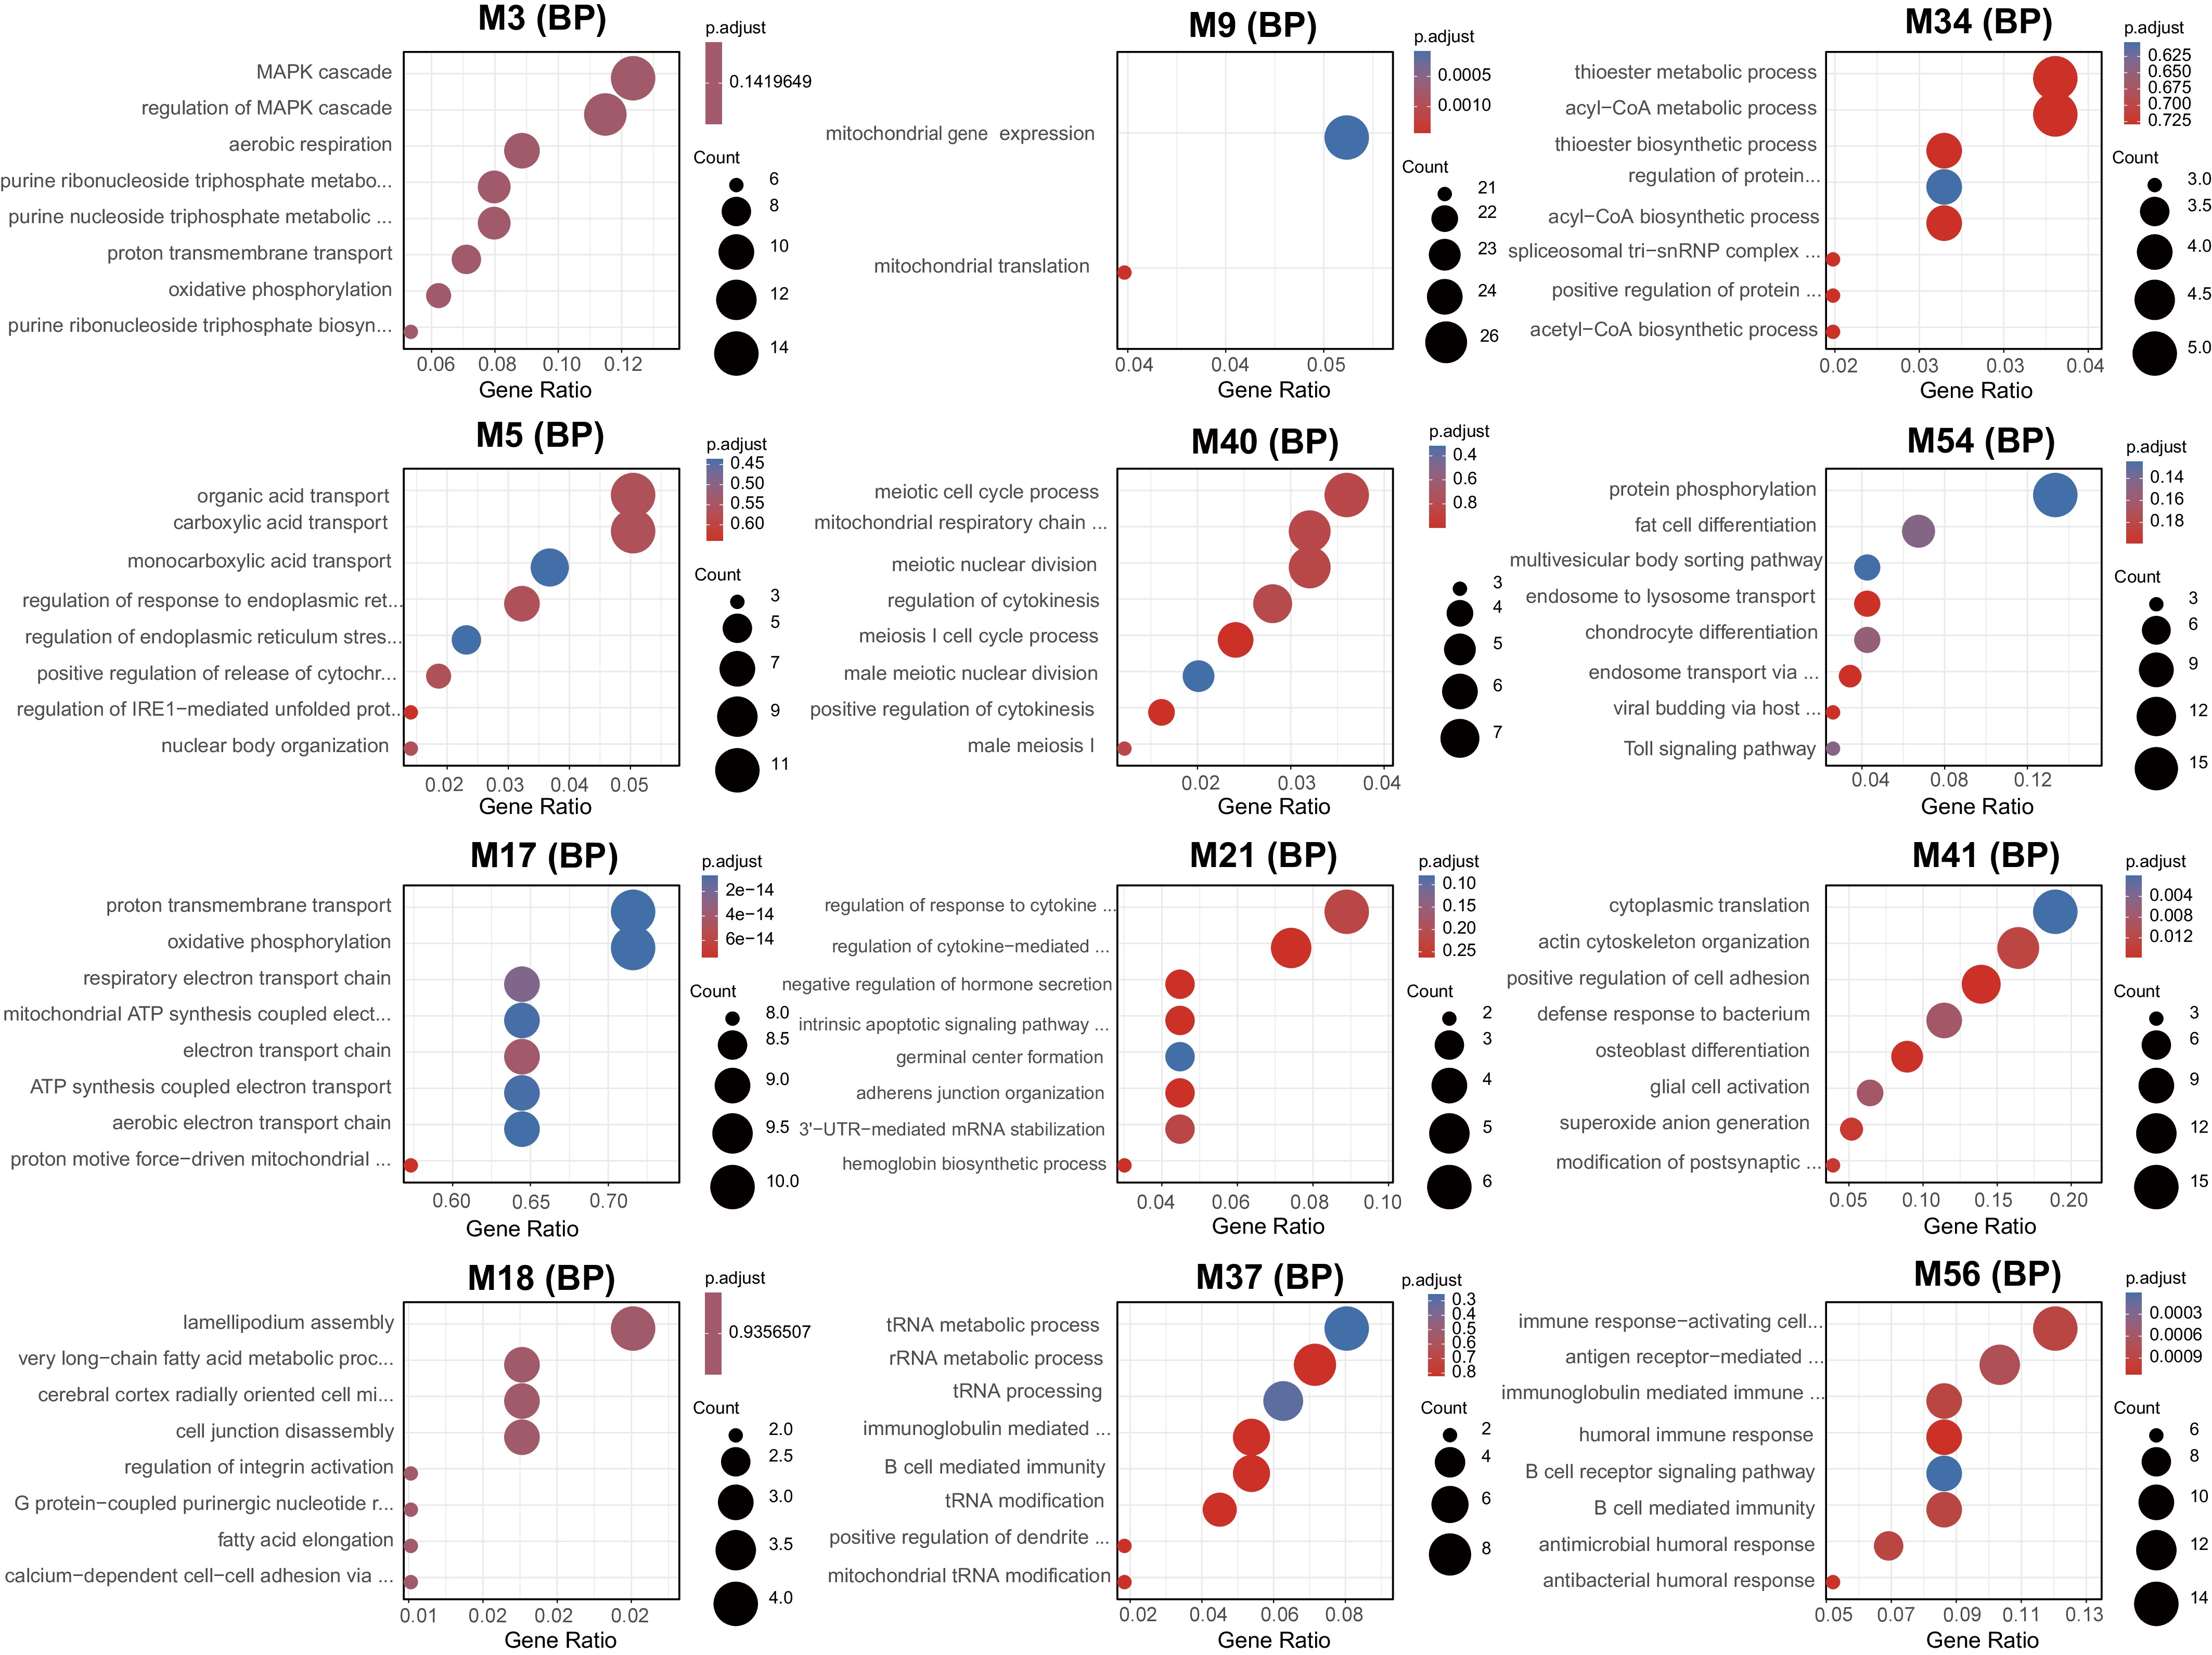
Figure 5.
GO biological process enrichment of PRM, FRM, PM, and SM reveals functional layers of the disease continuum.
Figures
(5)
Tables
(0)