-
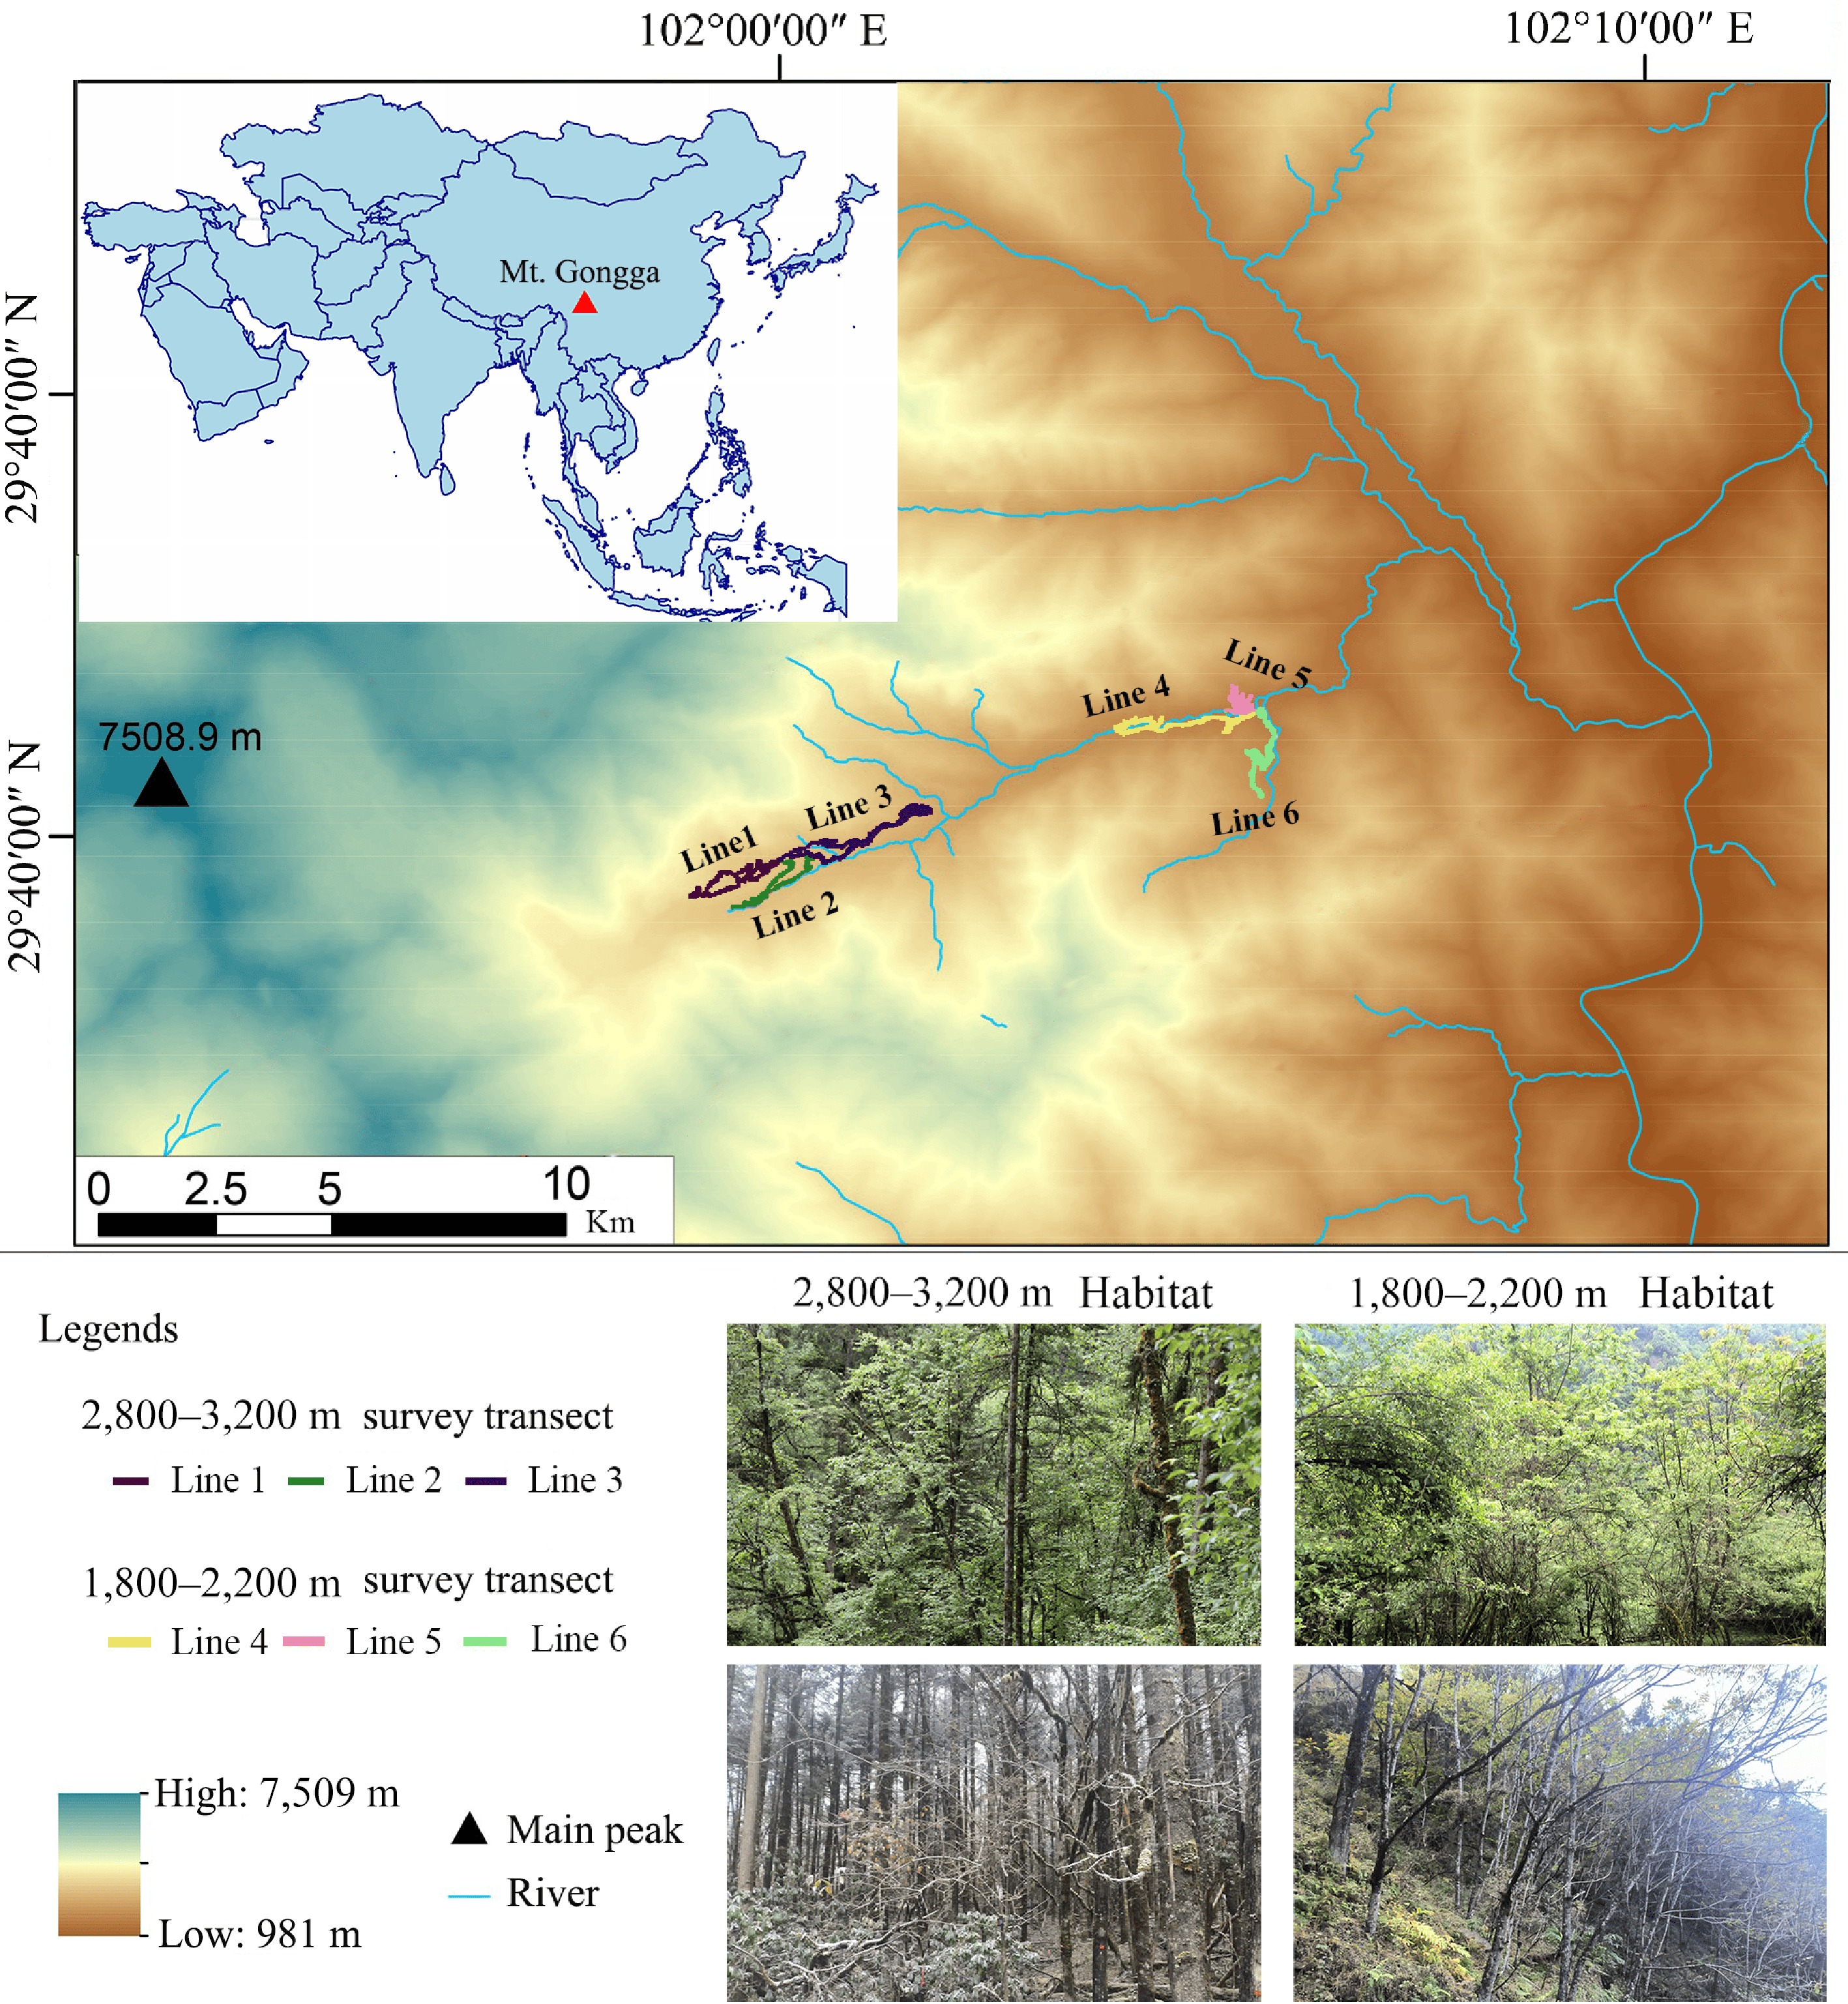
Figure 1.
Study area and survey transect. The base map of China was obtained from Natural Earth (
www.naturalearthdata.com/ ), and visualized in R. -
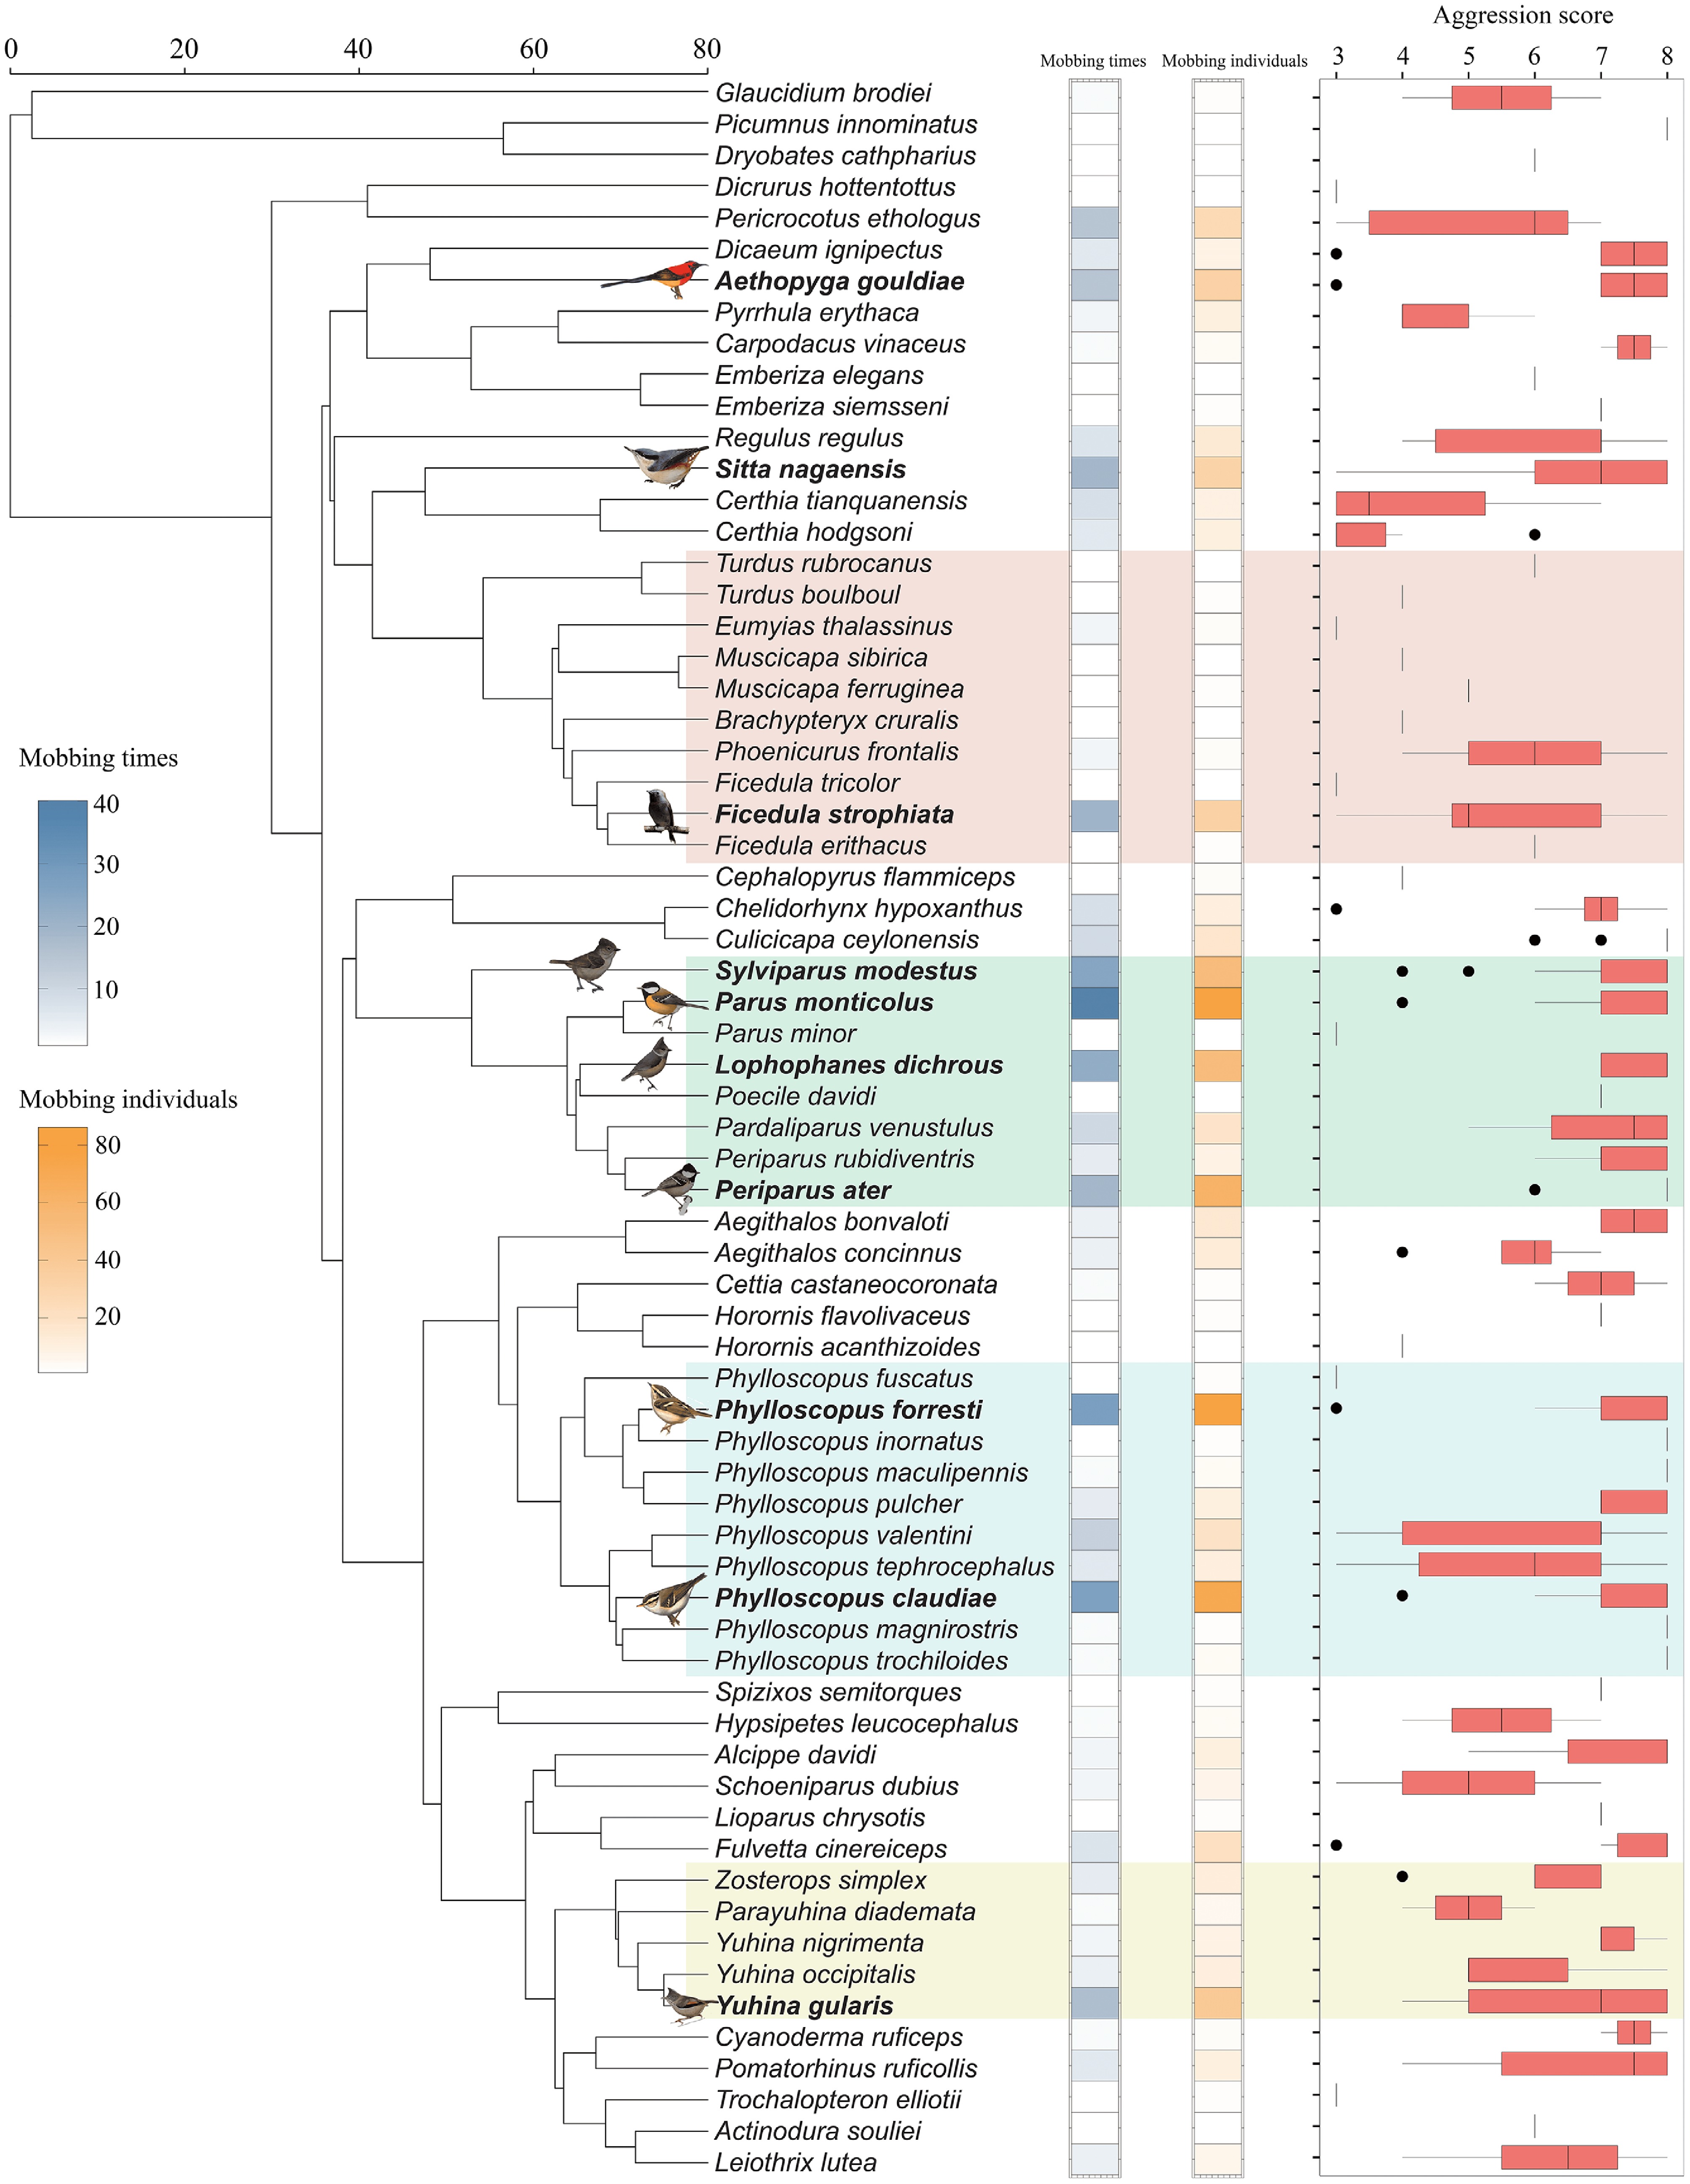
Figure 2.
Phylogenetic relationships and summary of the mobbing status of birds recorded. Boldfaced species are those with mobbing times among the top 10 mobbing birds. The bird images used in this figure were taken from 'The CNG Field Guide to the Birds of China', edited by Yang Liu and Shuihua Chen[36].
-
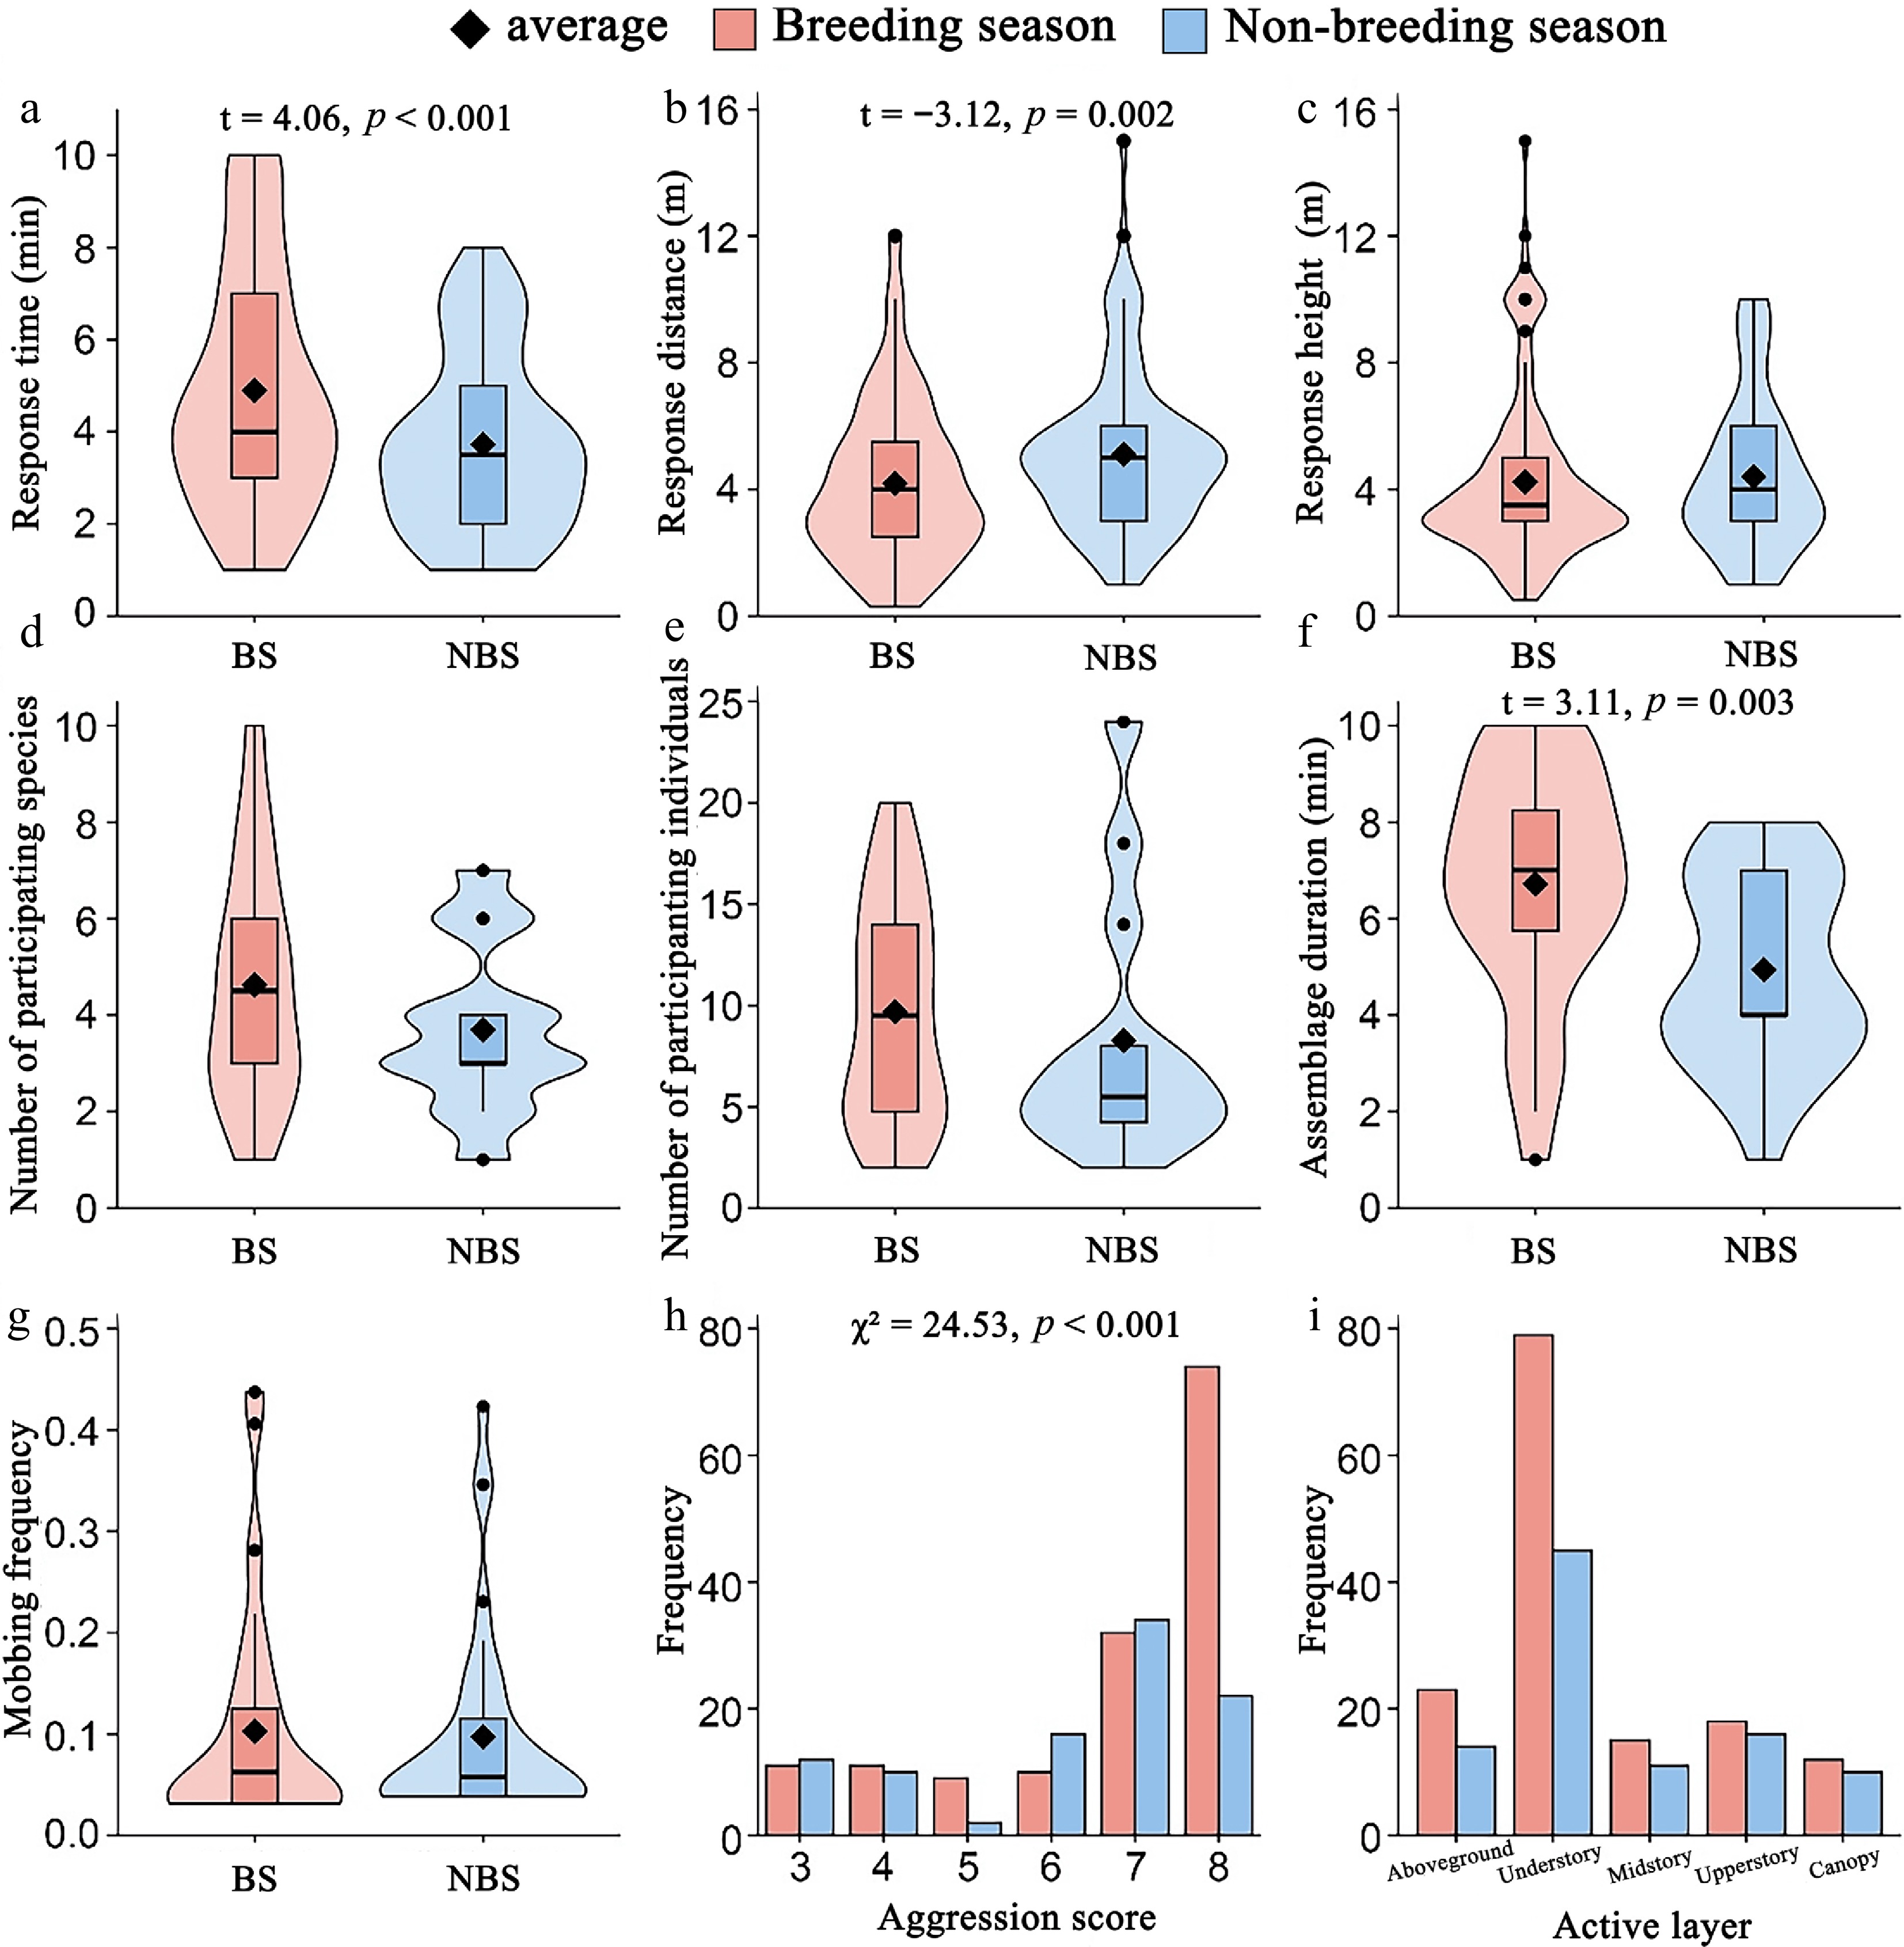
Figure 3.
The mobbing indices to the vocalization of the Collared Owlet in different breeding seasons. BS represents the breeding season, and NBS represents the non-breeding season. (a−g) Comparisons of response time, response distance, response height, number of participating species, number of participating individuals, assemblage duration, and mobbing frequency between breeding season and non-breeding season. (h−i) Distribution of aggression scores and activevegetation layers under different seasons.
-
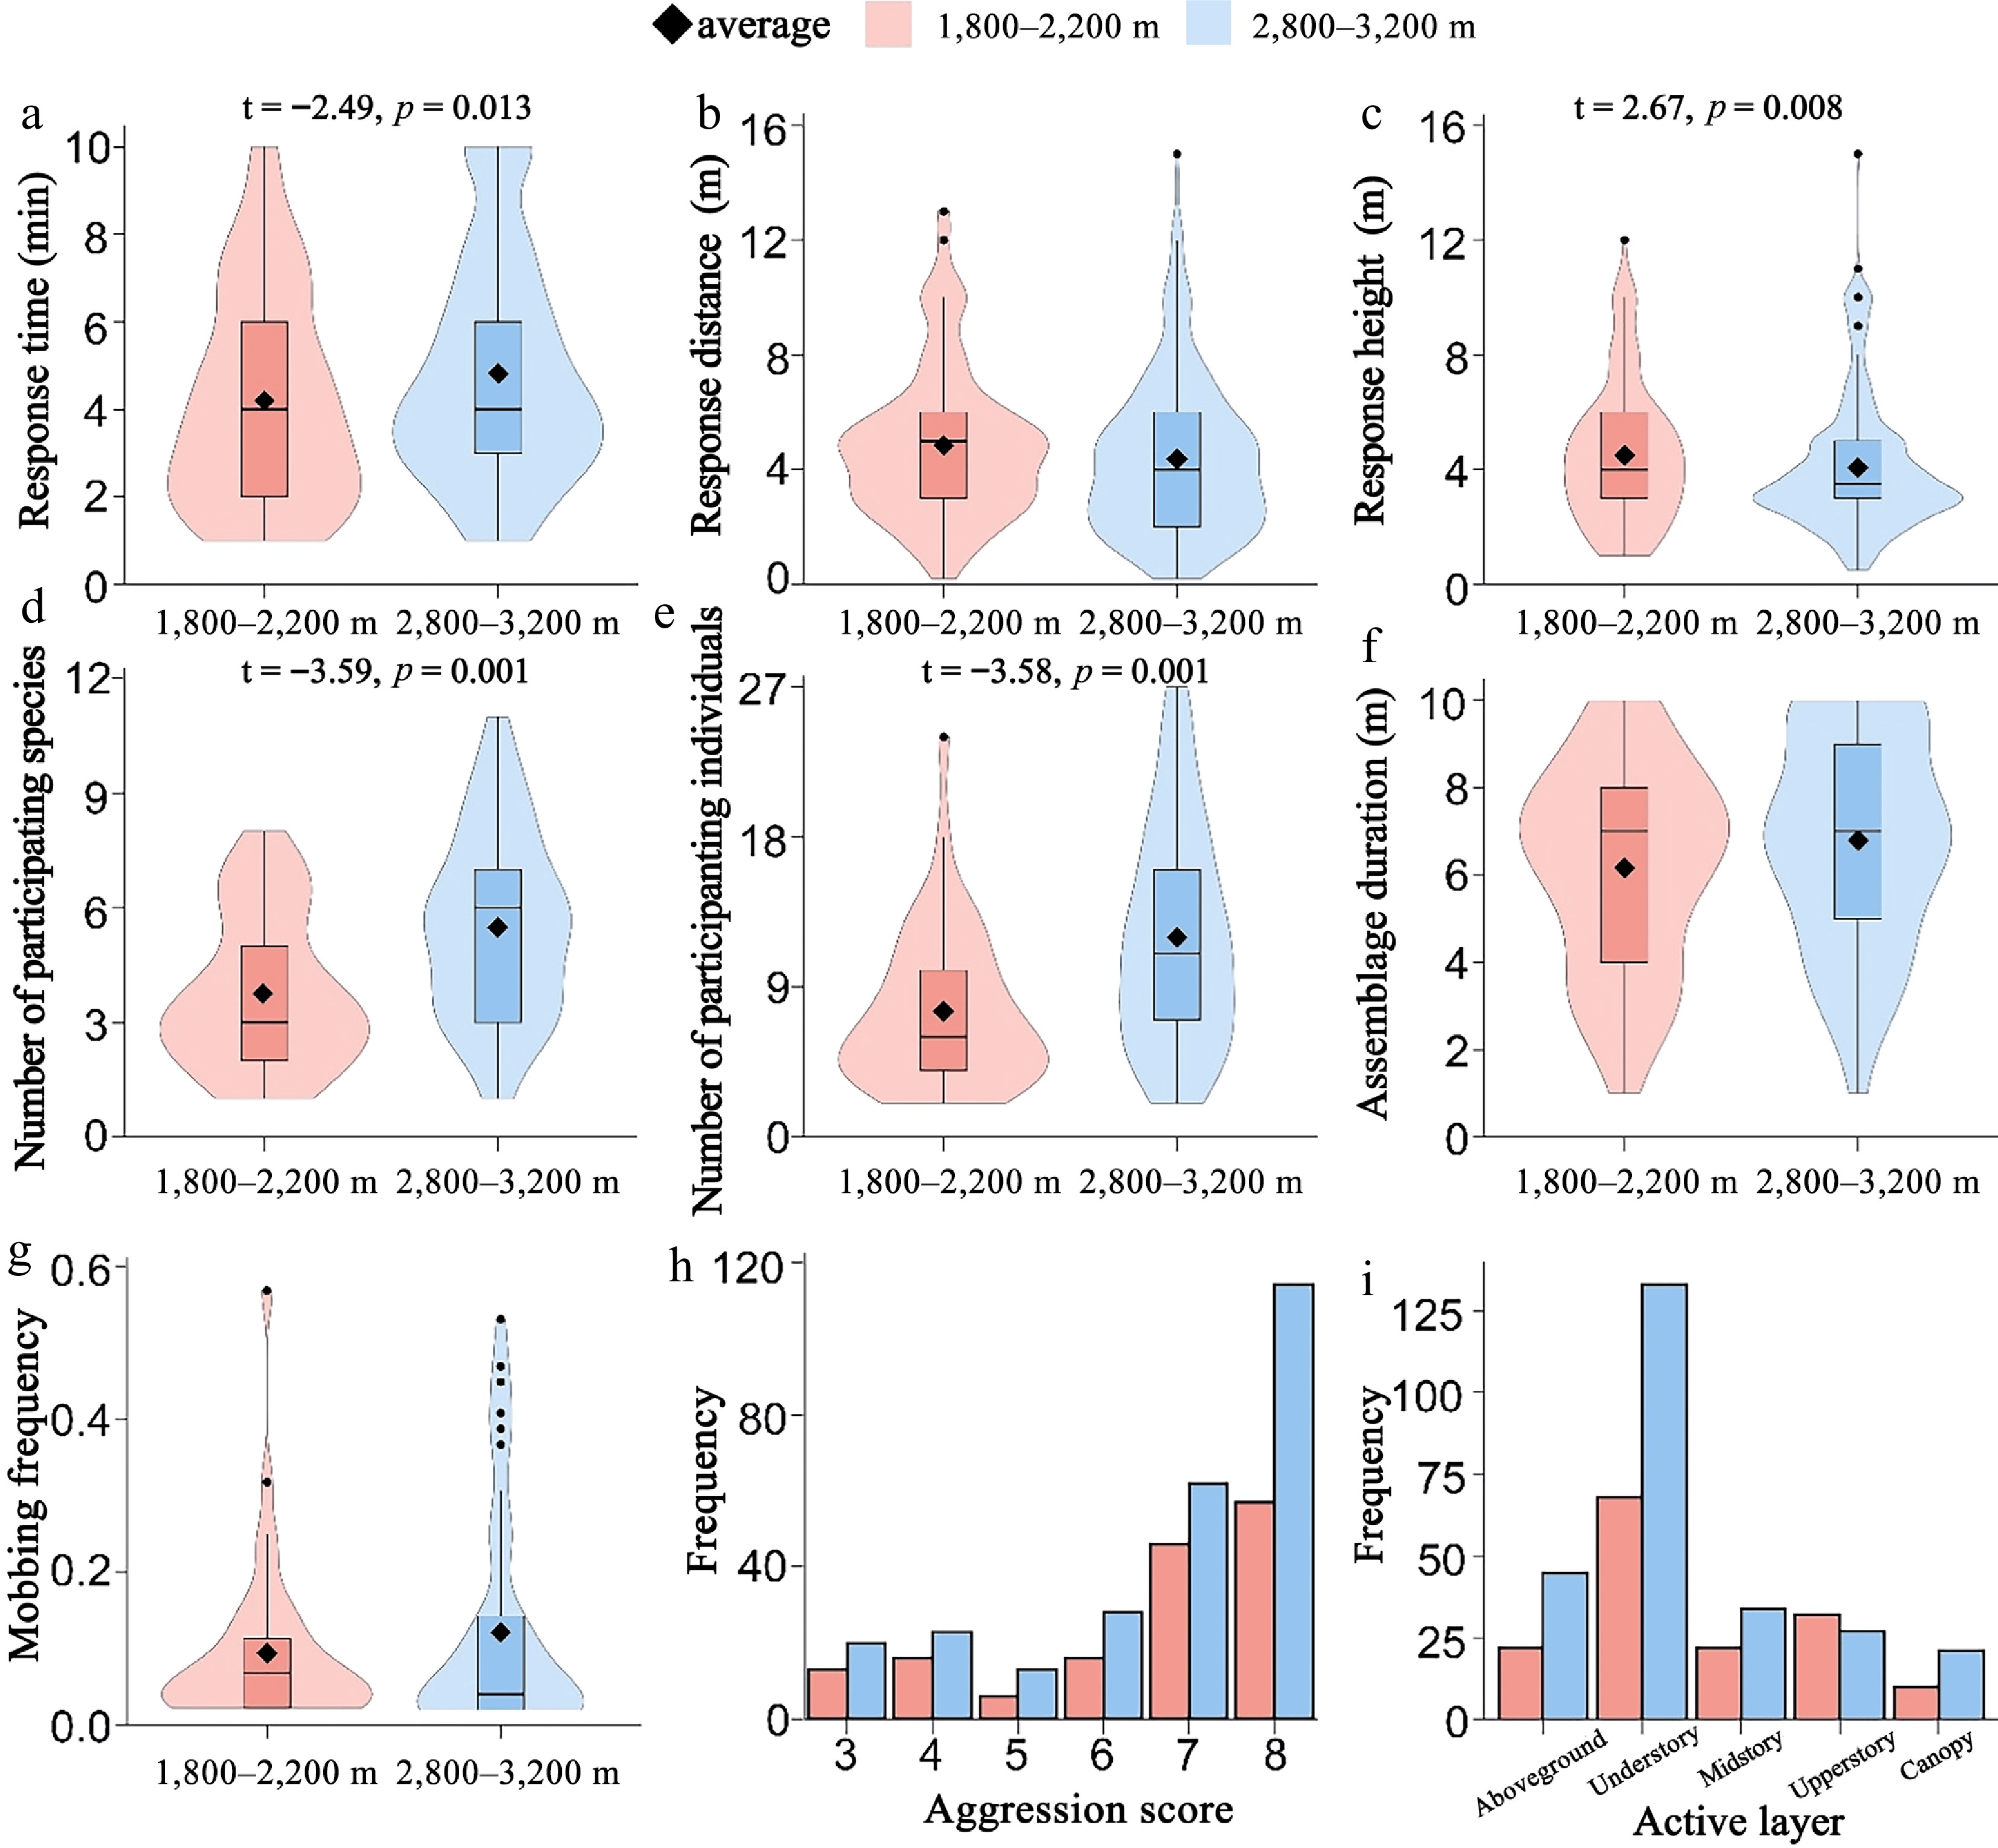
Figure 4.
The mobbing indices to the vocalization of Collared Owlets at different elevations. (a−g) Comparisons of response time, response distance, response height, number of participating species, number of participating individuals, assemblage duration, and mobbing frequency between 1,800-2,200 m and 2,800-3,200 m. (h−i) Distribution of aggression scores and active vegetation layers under different elevations.
-
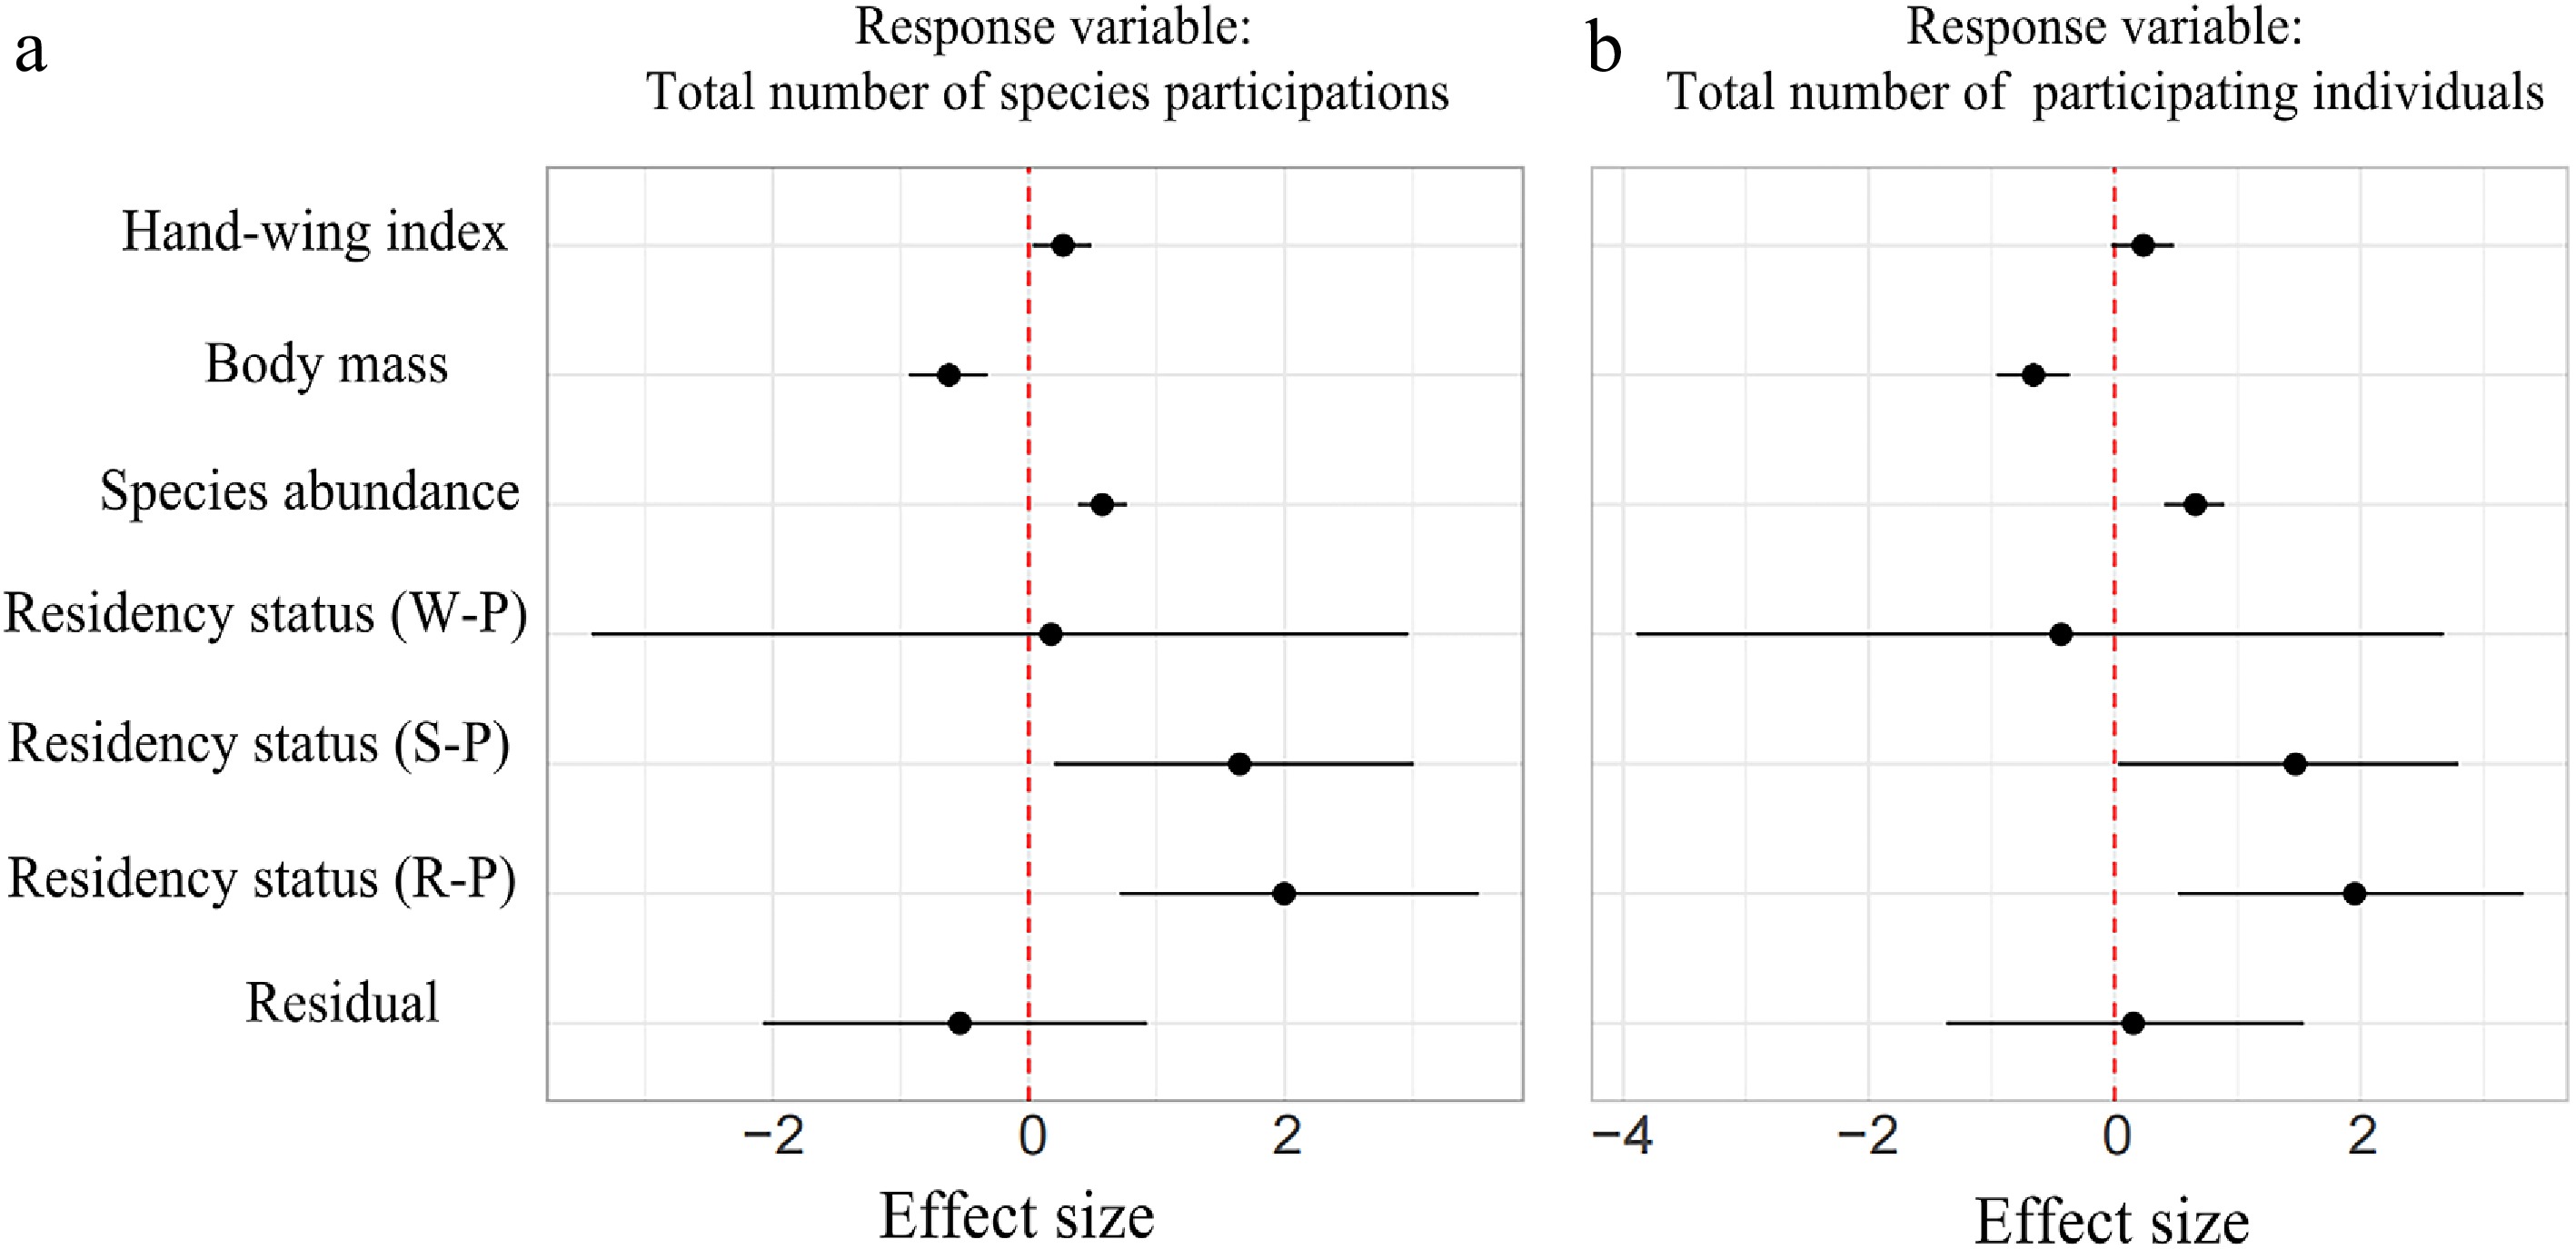
Figure 5.
Fixed effects of the simplified model of mobbing times and individuals of birds with their 95% highest posterior density credible intervals. R represents the resident bird, S represents the summer resident bird, W represents the winter resident bird, and P represents the passing bird; the same below.
-
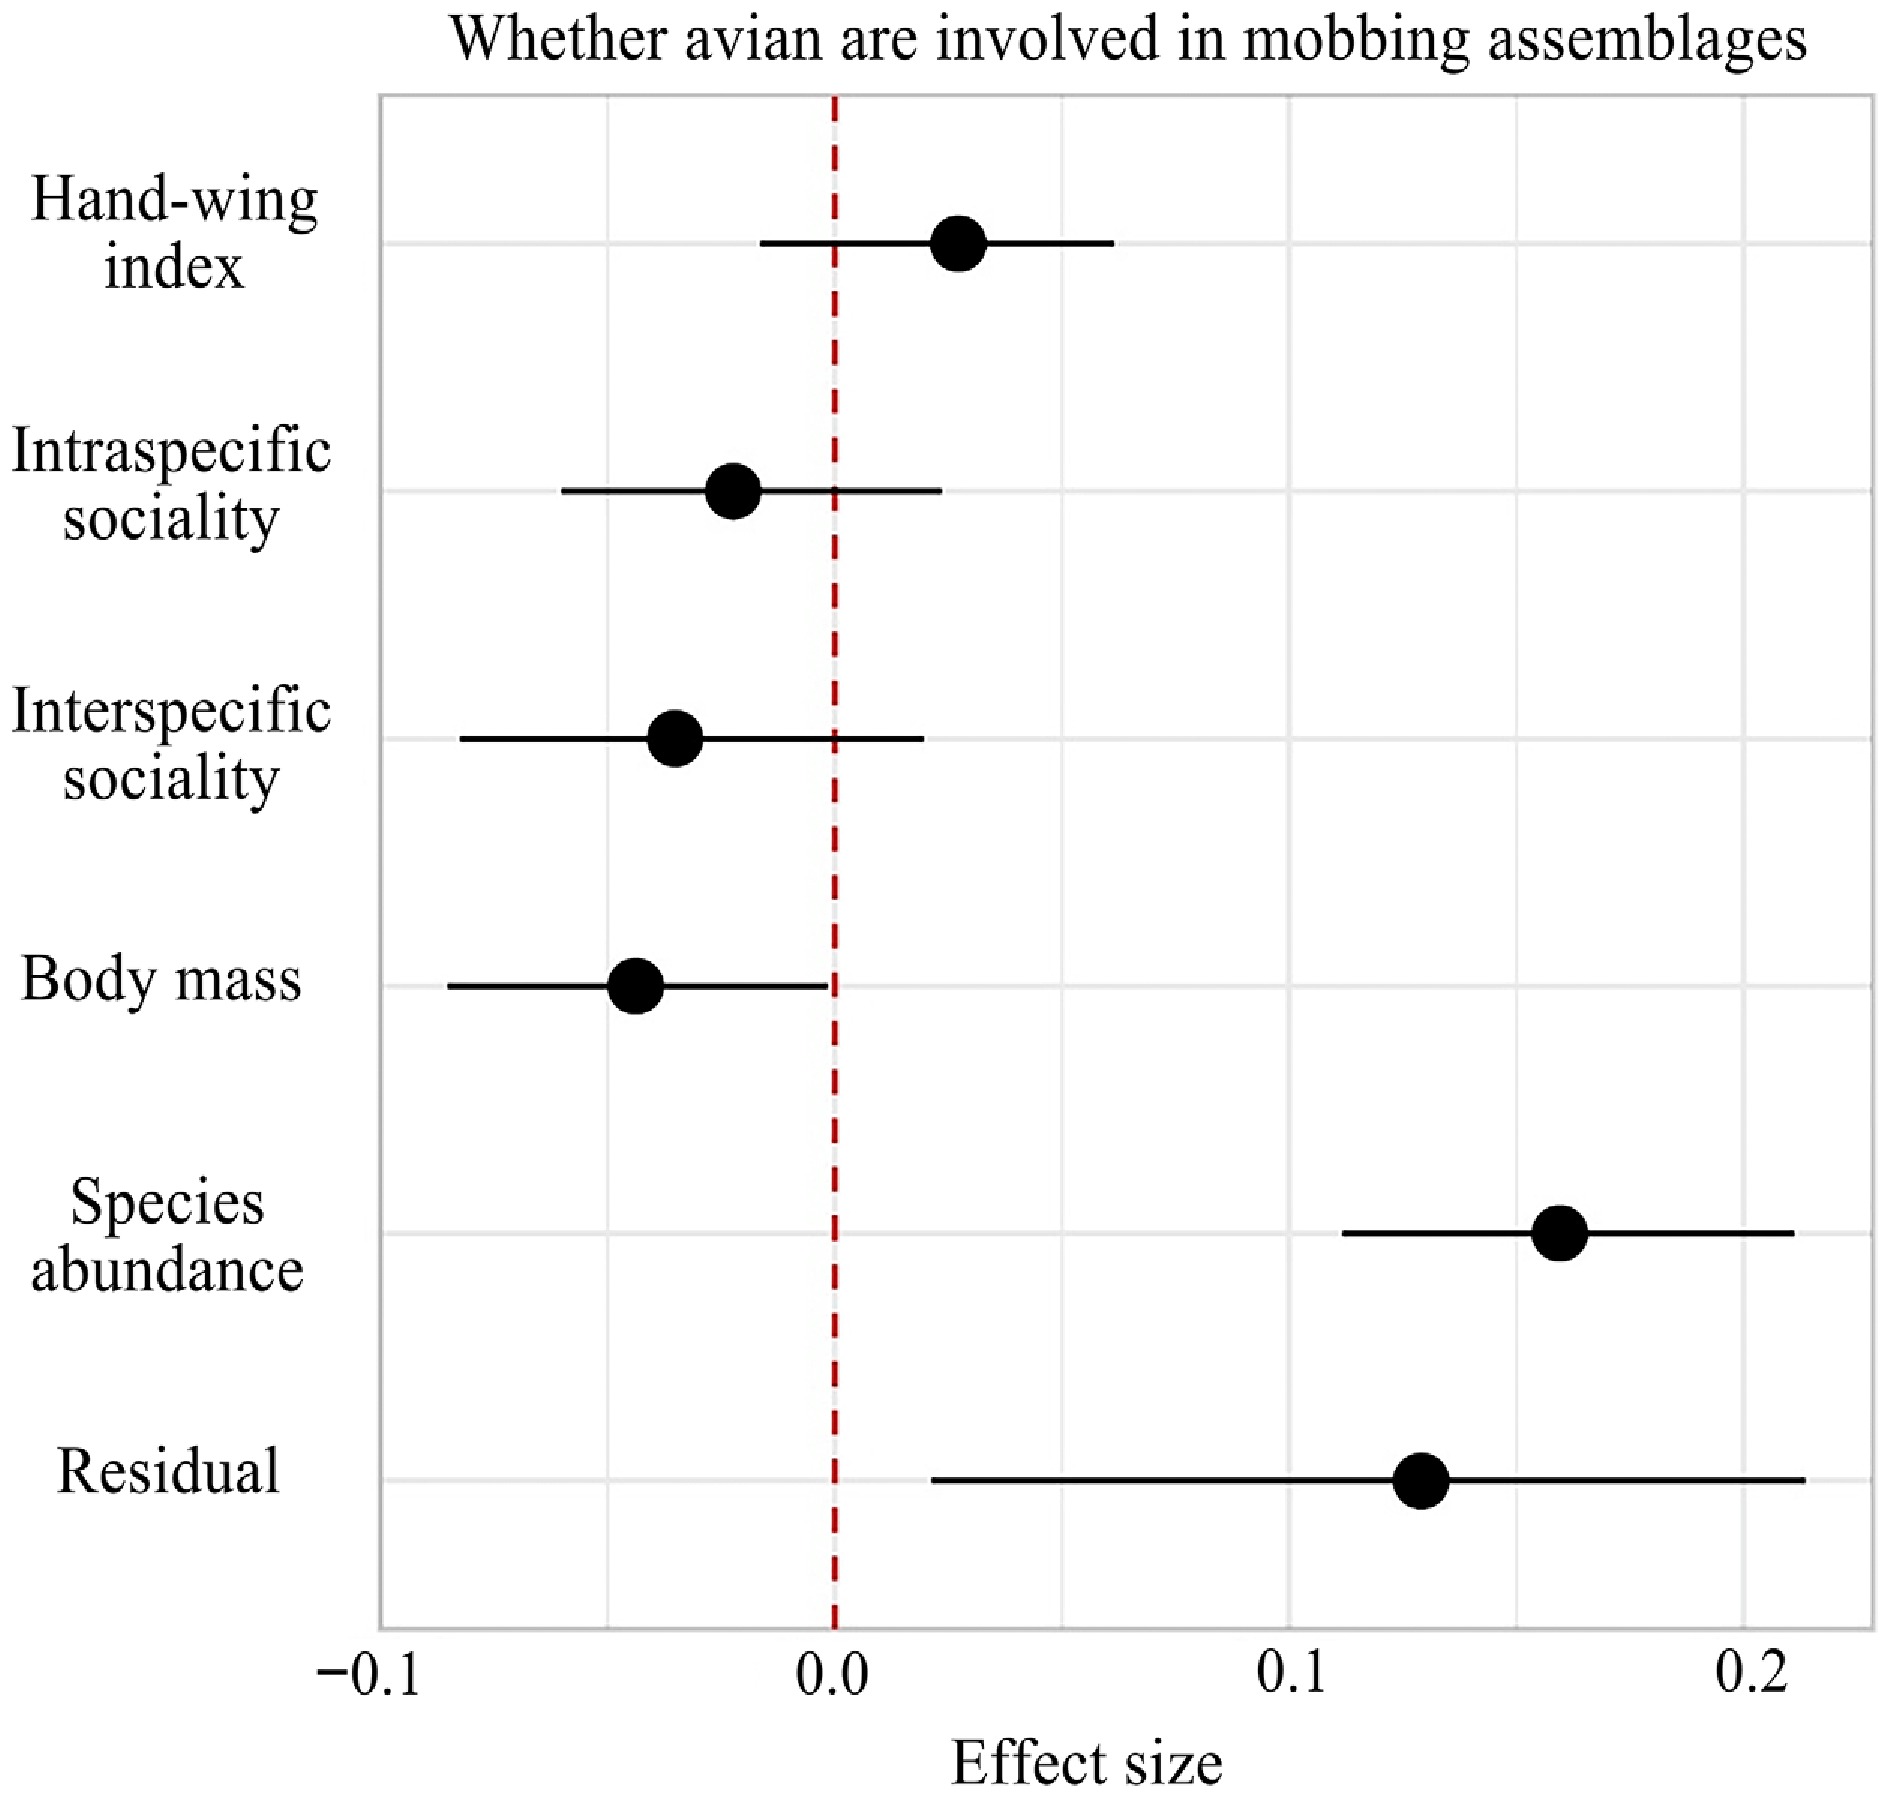
Figure 6.
Fixed effects of the simplified model of mobbing status of birds with their 95% highest posterior density credible interval.
-
Species Family Residency
statusMobbing number Mobbing frequency
MFall (%)Mobbing number
of individualsRatio (%) Parus monticolus Paridae R 40 44.44 82 9.15 Phylloscopus forresti Phylloscopidae S 28 31.11 86 9.60 Phylloscopus claudiae Phylloscopidae S 27 30.00 71 7.92 Sylviparus modestus Paridae R 25 27.78 52 5.80 Lophophanes dichrous Paridae R 23 25.56 52 5.80 Ficedula strophiata Muscicapidae S 20 22.22 33 3.68 Sitta nagaensis Sittidae R 19 21.11 31 3.46 Periparus ater Paridae R 19 21.11 62 6.92 Yuhina gularis Zosteropidae R 17 18.89 40 4.46 Aethopyga gouldiae Nectariniidae S 15 16.67 32 3.57 R represents the resident bird, and S represents the summer resident bird. Table 1.
The mobbing times and individual numbers of the top 10 mobbing bird species.
-
Mobbing indices
(unit, sample size)Peak point
indicator observationsPeak point density (%) The 85% density range of evaluation index Average Lower limit Upper limit Response indices of birds Response time (min, n = 414) 3.26 17.16 4.48 1.31 9.04 Response distance (m, n = 414) 4.88 16.66 4.23 1.20 9.28 Response height (m, n = 414) 3.00 26.23 4.01 1.51 8.53 Aggression score (n = 414) 8.00 41.30 6.92 4.00 8.00 Active layer (n = 414) Understory 48.55 / Ground layer Canopy layer Indices of mobbing assembly The number of participating species (n = 90) 3.00 23.33 4.57 2.00 8.00 The number of participating individuals (n = 90) 5.00 11.11 9.19 3.00 20.00 Assemblage duration (min, n = 89) 6.99 16.65 6.78 2.62 10.06 Table 2.
The probability density of the mobbing indices to the vocalization of the Collared Owlet.
-
Number of responding individuals Response time Response distance Response height β 95% confidence interval p β 95% confidence interval p β 95% confidence interval p β 95% confidence interval p Fixed effects Intercept −0.193 [−0.860, 0.419] 0.534 0.080 [−0.623, 0.789] 0.818 0.134 [−0.690, 0.961] 0.735 0.153 [−0.596, 0.910] 0.665 Body mass −0.081 [−0.196, 0.034] 0.167 −0.119 [−0.229, −0.008] 0.035 0.052 [−0.064, 0.168] 0.375 −0.004 [−0.108, 0.100] 0.940 Foraging behavior
PCA1−0.026 [−0.121, 0.071] 0.591 / / / −0.031 [−0.133, 0.069] 0.548 −0.098 [−0.188, –0.011] 0.029 Hand-wing index 0.066 [−0.086, 0.226] 0.400 / / / 0.102 [−0.067, 0.270] 0.227 0.349 [0.200, 0.500] < 0.001 Foraging height −0.131 [−0.291, 0.018] 0.086 / / / 0.107 [−0.061, 0.273] 0.204 0.157 [0.005, 0.305] 0.044 Intraspecific sociality 0.128 [−0.022, 0.282] 0.094 / / / / / / / / / Temperature −0.106 [−0.213, 0.002] 0.055 −0.085 [−0.211, 0.042] 0.186 / / / −0.091 [−0.231, 0.051] 0.208 Humidity / / / / / / 0.039 [−0.098, 0.173] 0.566 / / / Breeding season
(non-breeding season–breeding season)/ / / −0.479 [−0.771, −0.180] 0.002 0.389 [0.082, 0.702] 0.014 / / / Random effects Phylogenetic relationship 0.475 [0.248, 0.750] / 0.552 [0.345, 0.812] / 0.662 [0.419, 0.968] / 0.600 [0.314, 0.932] / Experiment number 0.191 [0.014, 0.370] / 0.434 [0.296, 0.583] / 0.450 [0.322, 0.589] / 0.578 [0.461, 0.713] / Residual 0.927 [0.855, 1.004] / 0.801 [0.736, 0.873] / 0.773 [0.710, 0.843] / 0.660 [0.604, 0.721] / Table 3.
Simplified Bayesian hierarchical model of the relationship between factors and response indices.
-
Response behavior score β 95% confidence interval p Fixed effects Residual 1 −1.953 [−3.236, −0.733] 0.003 Residual 2 −1.330 [−2.592, −0.119] 0.033 Residual 3 −1.088 [−2.352, 0.119] 0.077 Residual 4 −0.633 [−1.874, 0.580] 0.300 Residual 5 0.243 [−0.995, 1.465] 0.679 Body mass −0.156 [−0.321, 0.001] 0.052 Species abundance 0.358 [0.086, 0.654] 0.011 Humidity −0.079 [−0.214, 0.056] 0.253 Breeding season (non-breeding season–breeding season) −0.576 [−0.894, −0.263] < 0.001 Random effects Phylogenetic relationship 1.048 [0.702, 1.500] Experiment number 0.174 [0.008, 0.397] Bold text represents factors that are significantly/marginally significantly correlated to bird response behavior scores. Table 4.
Simplified Bayesian hierarchical model of the relationship between factors and aggressive score.
Figures
(6)
Tables
(4)