-
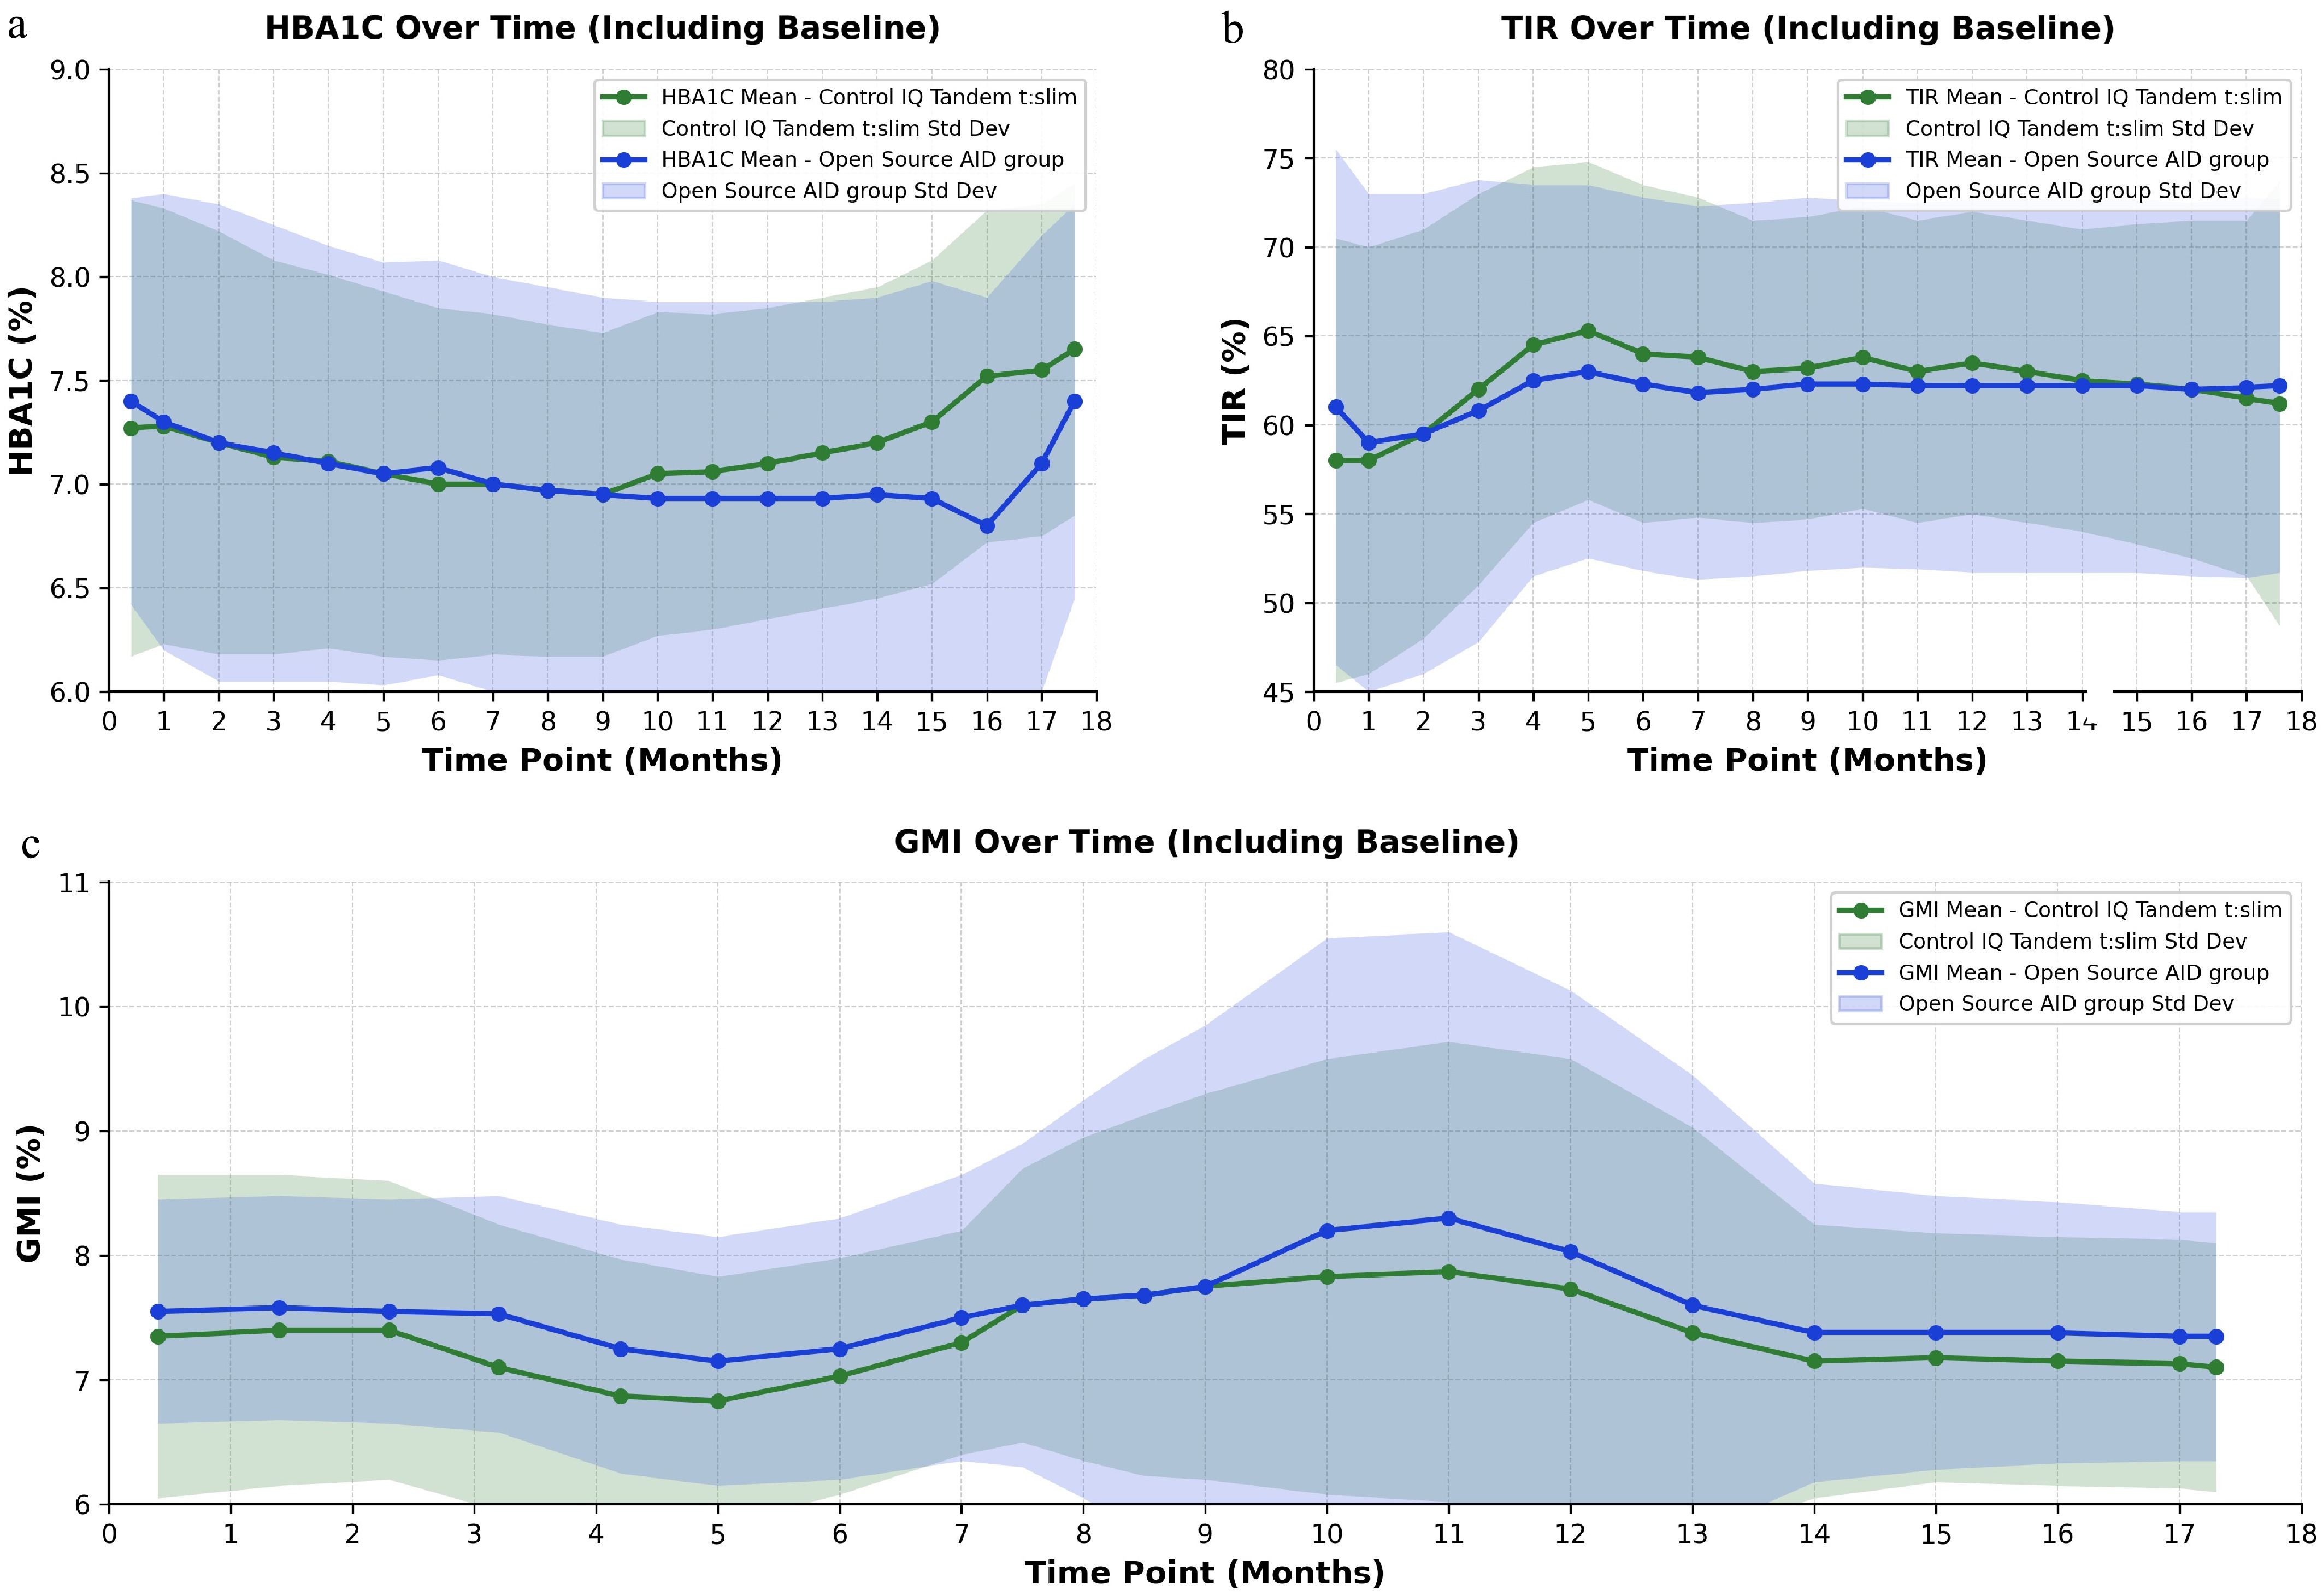
Figure 1.
A1C, TIR, and GMI levels over time after initiation of insulin pump therapy. (a) Shown are the mean A1C values for participants using either the HCL system (green line) or the OSAID system (blue line), from baseline through 18 months after initiation of pump therapy. Values were derived from laboratory testing at scheduled follow-up visits. Shaded areas represent the standard deviation at each time point. (b) Shows the percentage of time that participants in the two study groups were within the target glucose range (time in range [TIR], defined as 3.9 to 10.0 mmol/L [70–180 mg/dL]). (c) Displays the glucose management indicator (GMI, expressed as a percentage), tracked from baseline through 18 months after the initiation of insulin pump therapy. Data are derived from continuous glucose monitoring. Lines represent group means, and shaded areas indicate standard deviations. The green line represents the hybrid closed-loop (HCL) group, and the blue line represents the open-source automated insulin delivery (OSAID) group.
-
Baseline characteristic Total (n = 198) OSAID Group‡ (n = 143) HCL Group† (n = 55) p-value Age, yr, mean (SD) 13.8 (3.9) 13.5 (3.9) 14.4 (3.6) 0.120 Sex, no. (%) 1.000 Male 113 (57) 82 (57) 31 (56) Female 85 (43) 61 (43) 24 (44) BMI z score*, mean (SD) 0.0 (1.0) −0.2 (0.8) 0.4 (1.3) 0.004 British Columbia Index of Multiple Deprivation (BCIMD)¶, no. (%) Residential instability quintile < 0.001 1 (least deprived) 35 (18) 18 (19) 17 (31) 2 43 (22) 21 (22) 22 (40) 3 37 (19) 34 (35) 3 (5) 4 25 (13) 17 (18) 8 (15) 5 (most deprived) 11 (6) 6 (6) 5 (9) Missing 47 (24) 47 (33) 0 (0) Economic dependency quintile 0.002 1 (least deprived) 10 (5) 8 (8) 2 (4) 2 38 (19) 28 (29) 10 (18) 3 41 (21) 31 (32) 10 (18) 4 35 (18) 20 (21) 15 (27) 5 (most deprived) 27 (14) 9 (9) 18 (33) Missing 47 (24) 47 (33) 0 (0) Ethno-cultural composition quintile 0.040 1 (least deprived) 55 (28) 30 (31) 25 (45) 2 31 (16) 20 (21) 11 (20) 3 27 (14) 21 (22) 6 (11) 4 22 (11) 11 (11) 11 (20) 5 (most deprived) 16 (8) 14 (15) 2 (4) Missing 47 (24) 47 (33) 0 (0) Situational vulnerability quintile 0.040 1 (least deprived) 60 (30) 34 (35) 26 (47) 2 51 (26) 38 (40) 13 (24) 3 22 (11) 12 (13) 10 (18) 4 10 (5) 7 (7) 3 (5) 5 (most deprived) 8 (4) 5 (5) 3 (5) Missing 47 (24) 47 (33) 0 (0) Duration of diabetes, yr, mean (SD) 5.9 (3.7) 5.6 (3.5) 6.5 (4.1) 0.175 Duration of pump therapy, yr, mean (SD) 1.1 (1.1) 0.9 (0.9) 1.7 (1.4) < 0.001 Baseline A1C, %, mean (SD) 7.4 (1.1) 7.4 (1.2) 7.4 (1.0) 0.818 Baseline A1C, mmol/mol, mean (SD) 57.2 (12.4) 57.3 (12.9) 56.9 (11.0) 0.818 GMI#, %, mean (SD) 7.4 (0.9) 7.5 (1.0) 7.4 (0.6) 0.794 TIR***, %, mean (SD) 60.6 (14.5) 61.4 (14.0) 58.6 (15.6) 0.273 † HCL (hybrid closed-loop) group refers to participants using the Tandem t:slim X2 insulin pump platform during the study period. ‡ OSAID group refers to participants using open-source automated insulin delivery systems. * Body mass index (BMI) is expressed as a standard deviation (z) score relative to age- and sex-specific population norms. ¶ British Columbia Index of Multiple Deprivation (BCIMD) includes four components: residential instability, economic dependency, ethno-cultural composition, and situational vulnerability. Higher scores indicate greater deprivation. # The glucose management indicator (GMI) is an estimated A1C derived from continuous glucose monitoring (CGM) data. ** p-values compare OSAID versus HCL using Welch's t-test for continuous variables and χ2/Fisher's exact tests for categorical variables. Selected baseline measures use available-case denominators shown in Supplementary Tables S2 and S3. *** Time in range (TIR) refers to the percentage of time that glucose levels are within the target range of 3.9 to 10.0 mmol/L Table 1.
Baseline characteristics of the study participants.
-
Metric Time point (months) N (OSAID) OSAID mean (SD) N (HCL) HCL mean (SD) Mean difference (OSAID – HCL, 95% CI) p-value A1C (%) Baseline 120 7.4 (1.2) 46 7.4 (1.0) – – 3 64 7.0 (0.8) 39 7.2 (0.9) −0.25 (−0.59, 0.09) 0.148 6 63 7.1 (0.8) 35 7.3 (0.9) −0.23 (−0.58, 0.12) 0.200 9 48 7.1 (0.9) 33 7.2 (0.7) −0.04 (−0.38, 0.30) 0.803 12 29 6.8 (0.7) 28 7.3 (0.9) −0.50 (−0.92, -0.08) 0.021 18 14 7.0 (0.9) 23 7.3 (0.9) −0.33 (−0.95, 0.30) 0.292 GMI (%) Baseline 134 7.5 (1.0) 49 7.4 (0.6) – – 3 131 7.2 (0.6) 49 7.2 (0.5) 0.04 (−0.15, 0.22) 0.704 6 110 7.3 (0.9) 48 7.2 (0.5) 0.10 (−0.12, 0.32) 0.364 9 78 7.3 (0.9) 45 7.2 (0.5) 0.10 (−0.15, 0.35) 0.422 12 40 7.4 (0.8) 43 7.3 (0.6) 0.12 (−0.20, 0.43) 0.465 18 30 7.4 (0.8) 33 7.4 (0.5) 0.08 (−0.26, 0.41) 0.651 TIR (%) Baseline 134 61.4 (14.0) 50 58.6 (15.6) – – 3 131 63.7 (12.1) 49 65.7 (13.7) −1.98 (−6.42, 2.46) 0.377 6 110 64.3 (12.2) 48 64.7 (11.5) −0.39 (−4.42, 3.65) 0.849 9 78 63.9 (11.8) 45 63.8 (11.8) 0.11 (−4.26, 4.49) 0.959 12 40 63.1 (12.1) 43 62.0 (12.7) 1.10 (−4.30, 6.51) 0.686 18 30 62.1 (11.6) 33 61.9 (11.9) 0.19 (−5.73, 6.11) 0.949 OSAID = Open-Source Automated Insulin Delivery; HCL = Hybrid Closed-Loop; A1C = Hemoglobin A1C; GMI = Glucose Management Indicator; TIR = Time in Range; CI = Confidence Interval. Data represent observed mean (± SD) values for A1C (%), GMI (%), and TIR (%; glucose 3.9–10.0 mmol/L or 70–180 mg/dL) at each follow-up time point. The mean difference shown at each follow-up time point is OSAID minus HCL with its 95% CI based on Welch's t-test. Negative differences favor OSAID for A1C and GMI, whereas positive differences favor OSAID for TIR. All longitudinal outcome tables use the same observed outcome dataset. N reflects participants with available observed data for the corresponding outcome and time point. N varies due to availability of laboratory or CGM data at each time point. Table 2.
Glycemic outcomes over 18 months in the open-source AID and HCL groups.
Figures
(1)
Tables
(2)