-
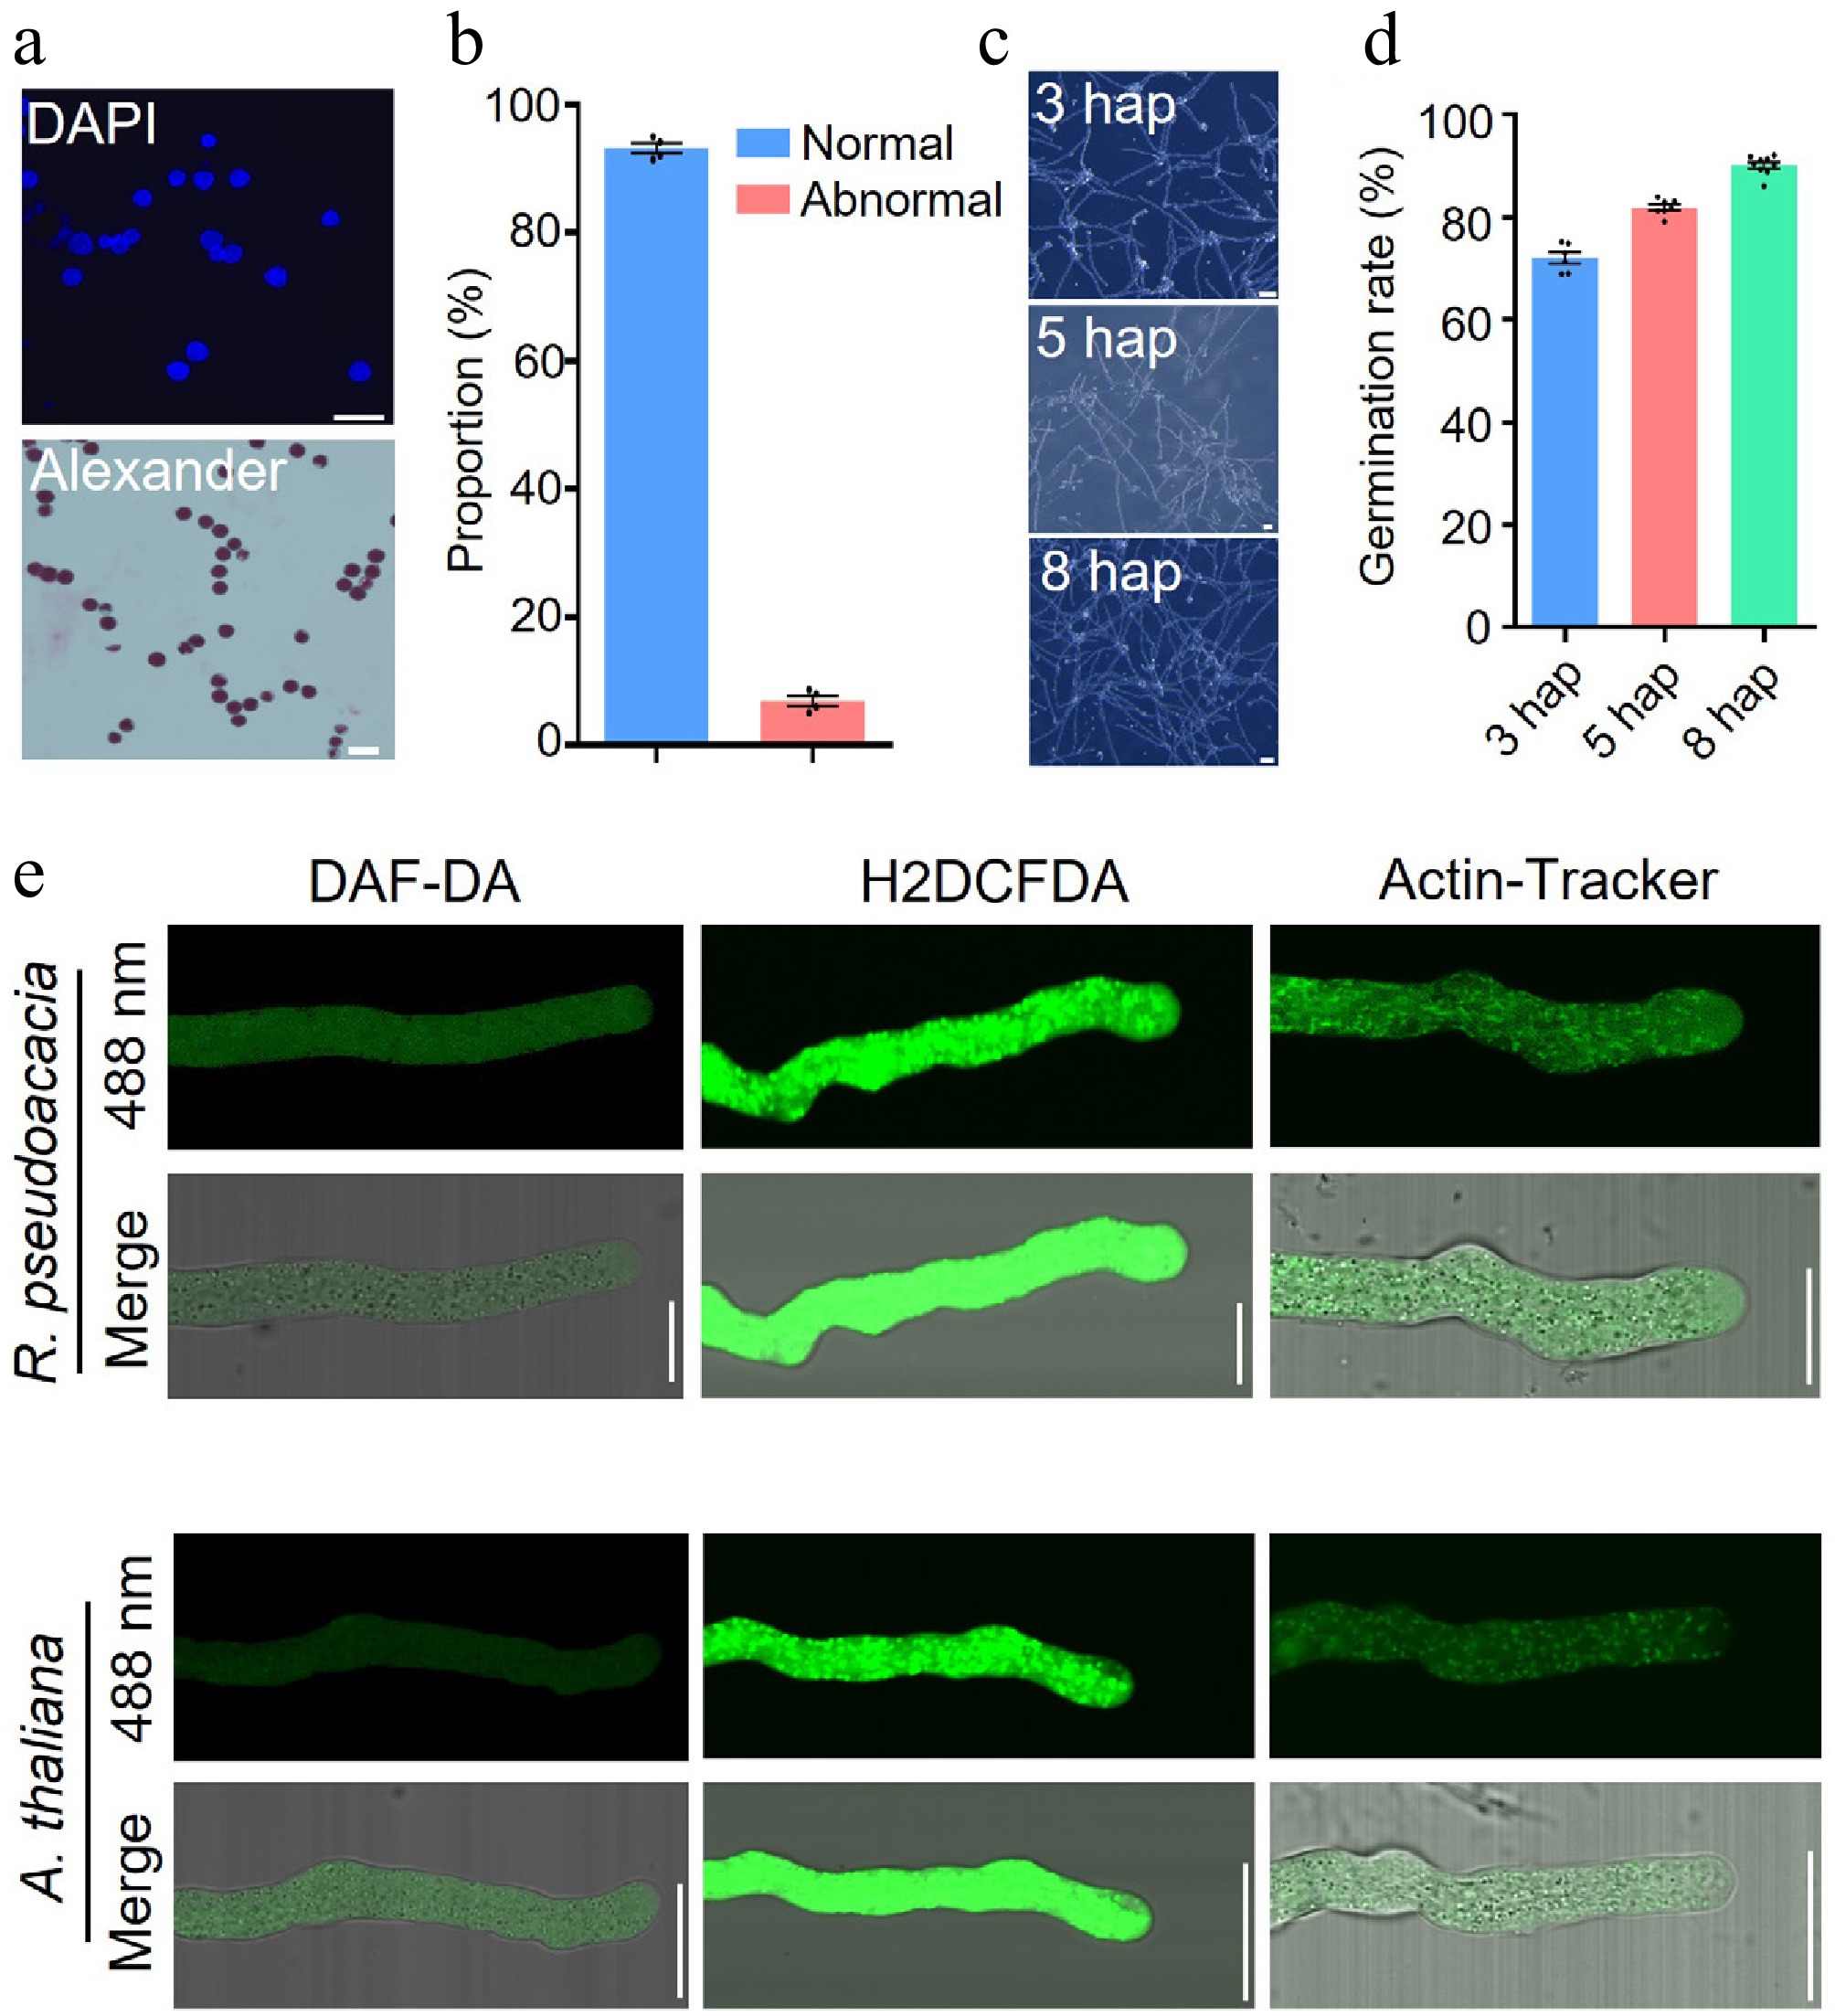
Figure 1.
Establishment of cytological methods for studying R. pseudoacacia pollen tubes. (a) 4',6-Diamidino-2-phenylindole (DAPI) staining (upper panel) and Alexander staining (lower panel) of R. pseudoacacia pollen grains. DAPI labels nuclei (blue); Alexander staining distinguishes viable (darkly stained) from non-viable (pale) pollen grains. Scale bars, 20 μm. (b) Proportions of viable (Normal) and non-viable (Abnormal) pollen grains based on Alexander staining as shown in (a). Data are mean ± SEM (n = 4 biological replicates, ~200 grains per replicate); each dot represents one biological replicate. (c) In vitro germination of R. pseudoacacia pollen at 28 °C, imaged at 3, 5, and 8 hap. Scale bars, 20 μm. (d) Pollen germination rates at the time points shown in (c). Data are mean ± SEM (n = 6, 7, and 9 biological replicates for 3, 5, and 8 hap, respectively, ≥ 400 grains per replicate); each dot represents one biological replicate. (e) Confocal images of nitric oxide (NO), reactive oxygen species (ROS), and filamentous actin (F-actin) in pollen tubes of R. pseudoacacia and A. thaliana, visualized with 4,5-diaminofluorescein diacetate (DAF-DA), 2',7'-dichlorodihydrofluorescein diacetate (H2DCFDA), and Actin-Tracker, respectively. For each species, the upper row shows the fluorescence channel and the lower row shows the merged fluorescence-bright-field image. Scale bars, 10 μm.
-
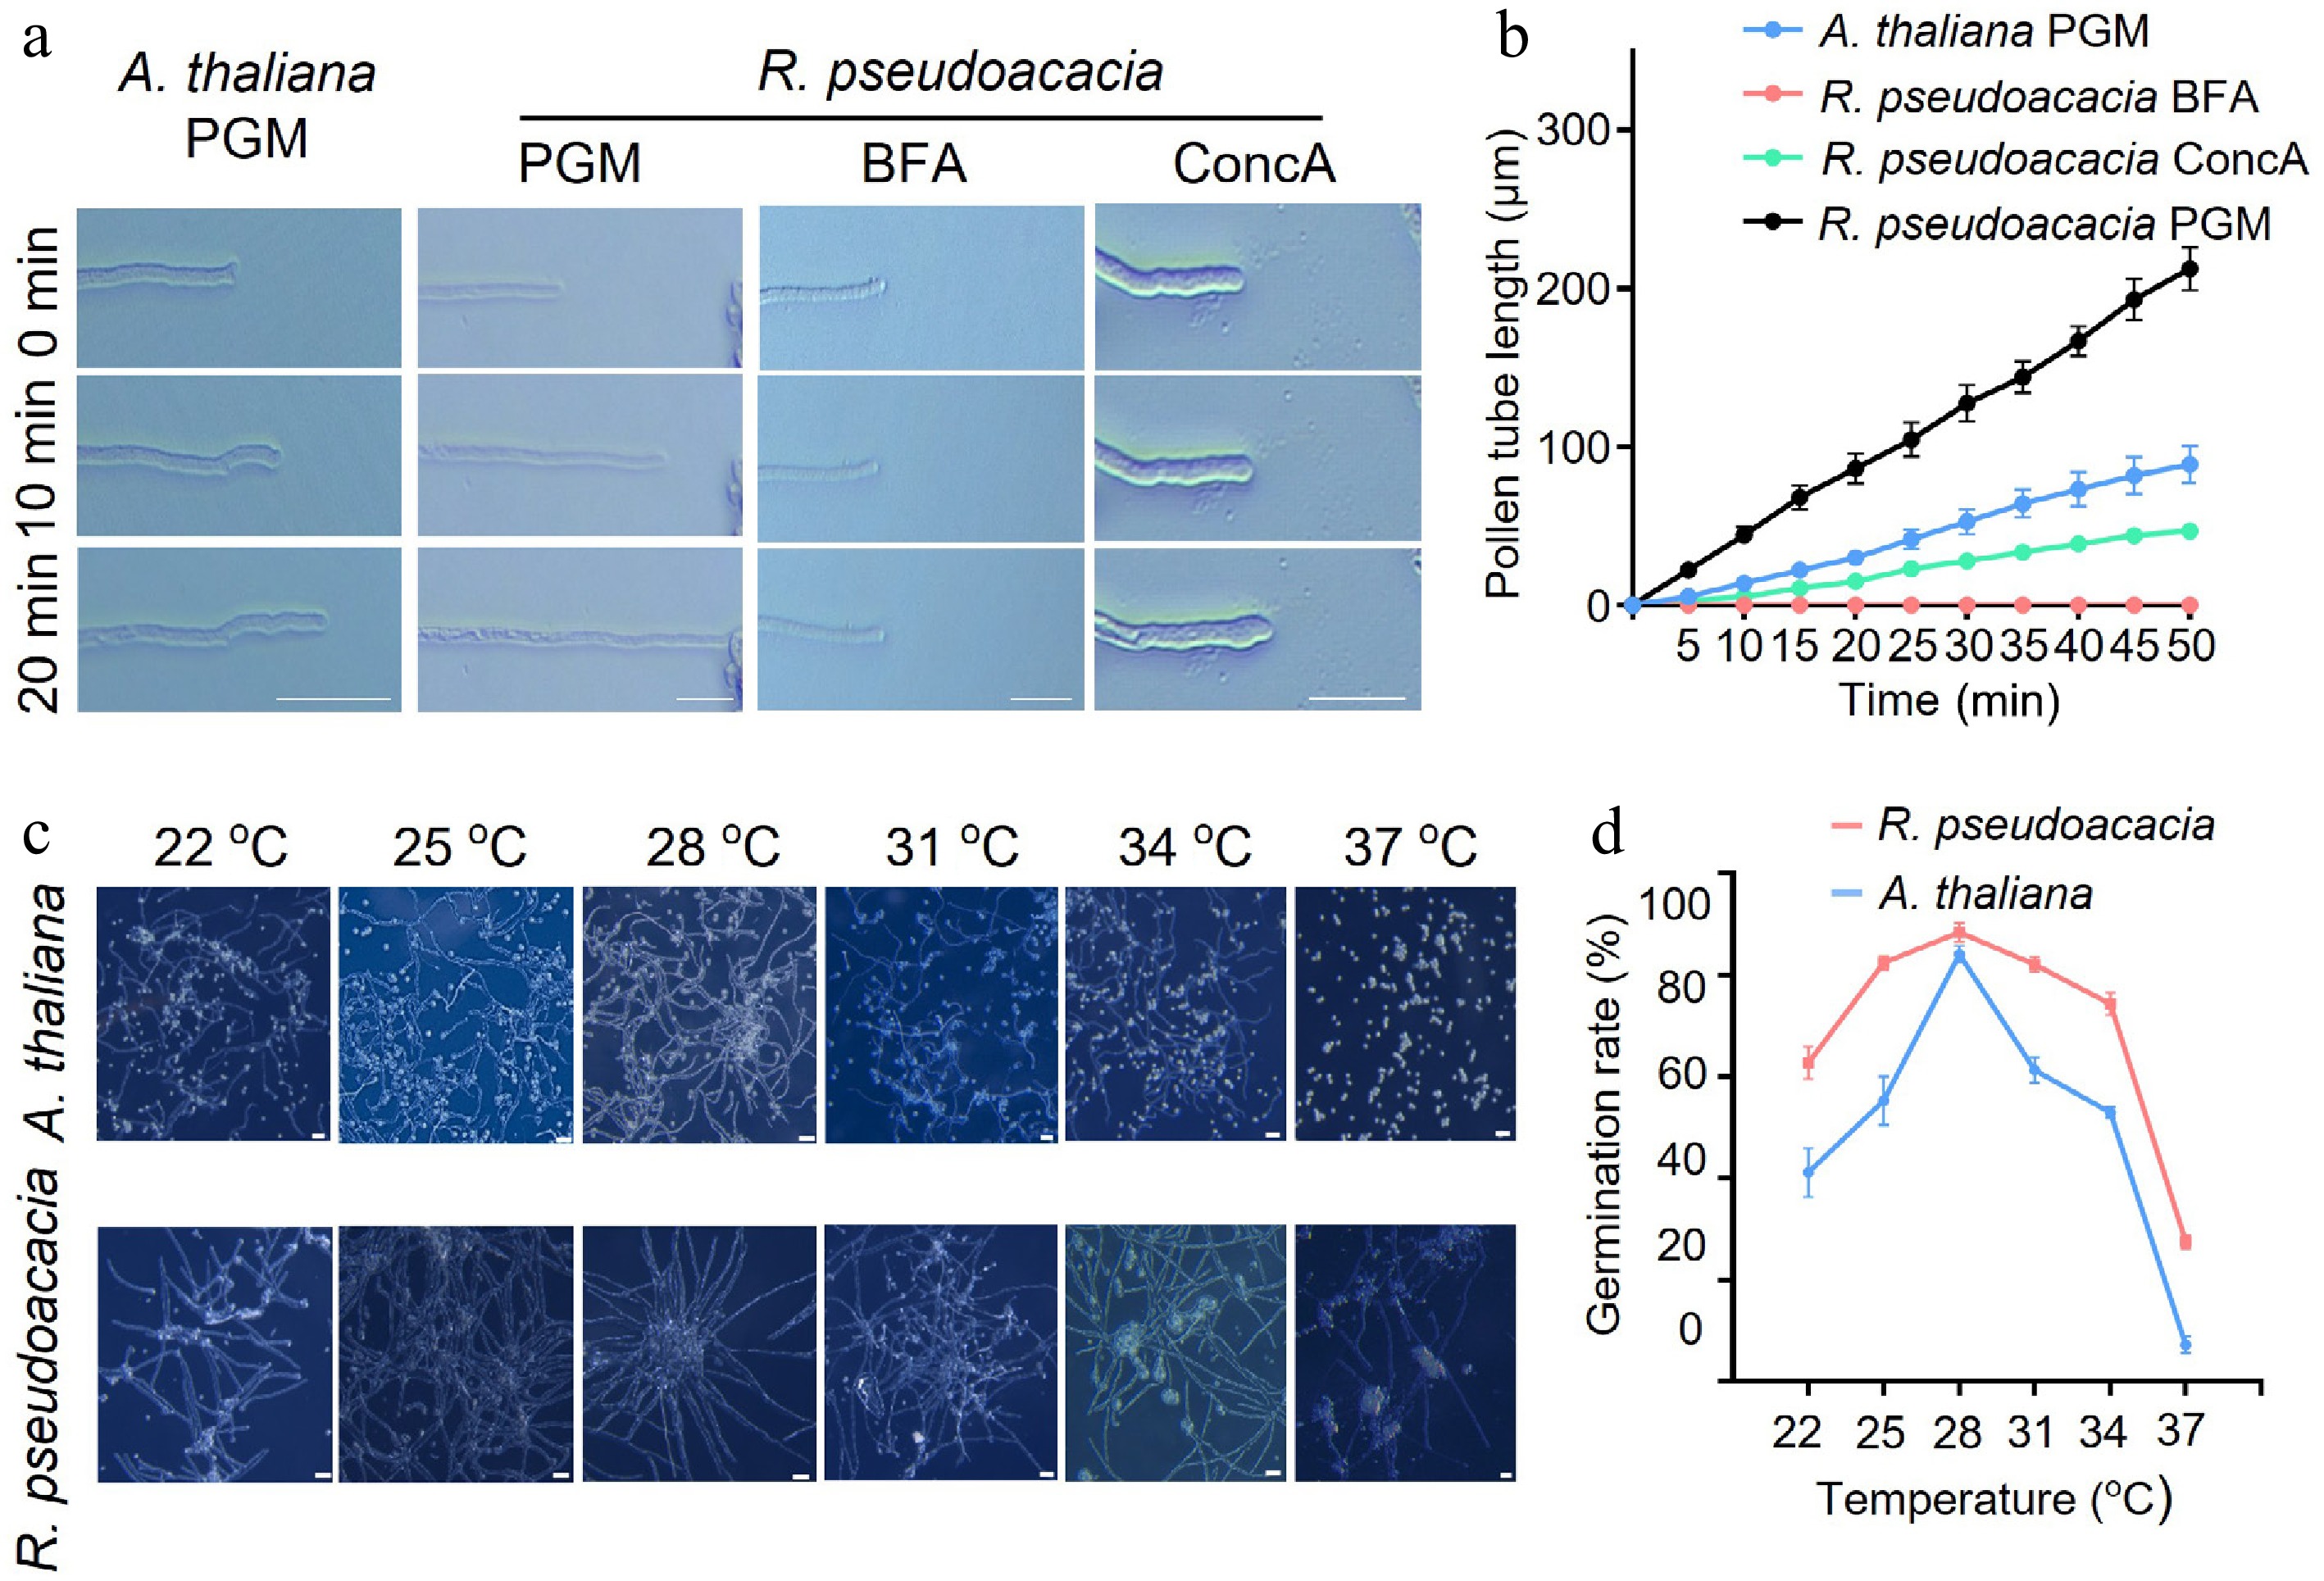
Figure 2.
Growth dynamics and thermotolerance of R. pseudoacacia pollen. (a) Time-lapse images of A. thaliana and R. pseudoacacia pollen tubes growing in pollen germination medium (PGM) or in PGM supplemented with Brefeldin A (BFA) or Concanavalin A (ConcA), recorded at 0, 10, and 20 min. Scale bars, 20 μm. (b) Pollen tube length over a 50-min time course for the conditions shown in (a). Data are mean ± SEM. (c) Representative images of A. thaliana and R. pseudoacacia pollen germinated in vitro at temperatures ranging from 22 to 37 °C. Scale bars, 20 μm. (d) Pollen germination rates at each temperature are shown in (c). Data are mean ± SEM.
-
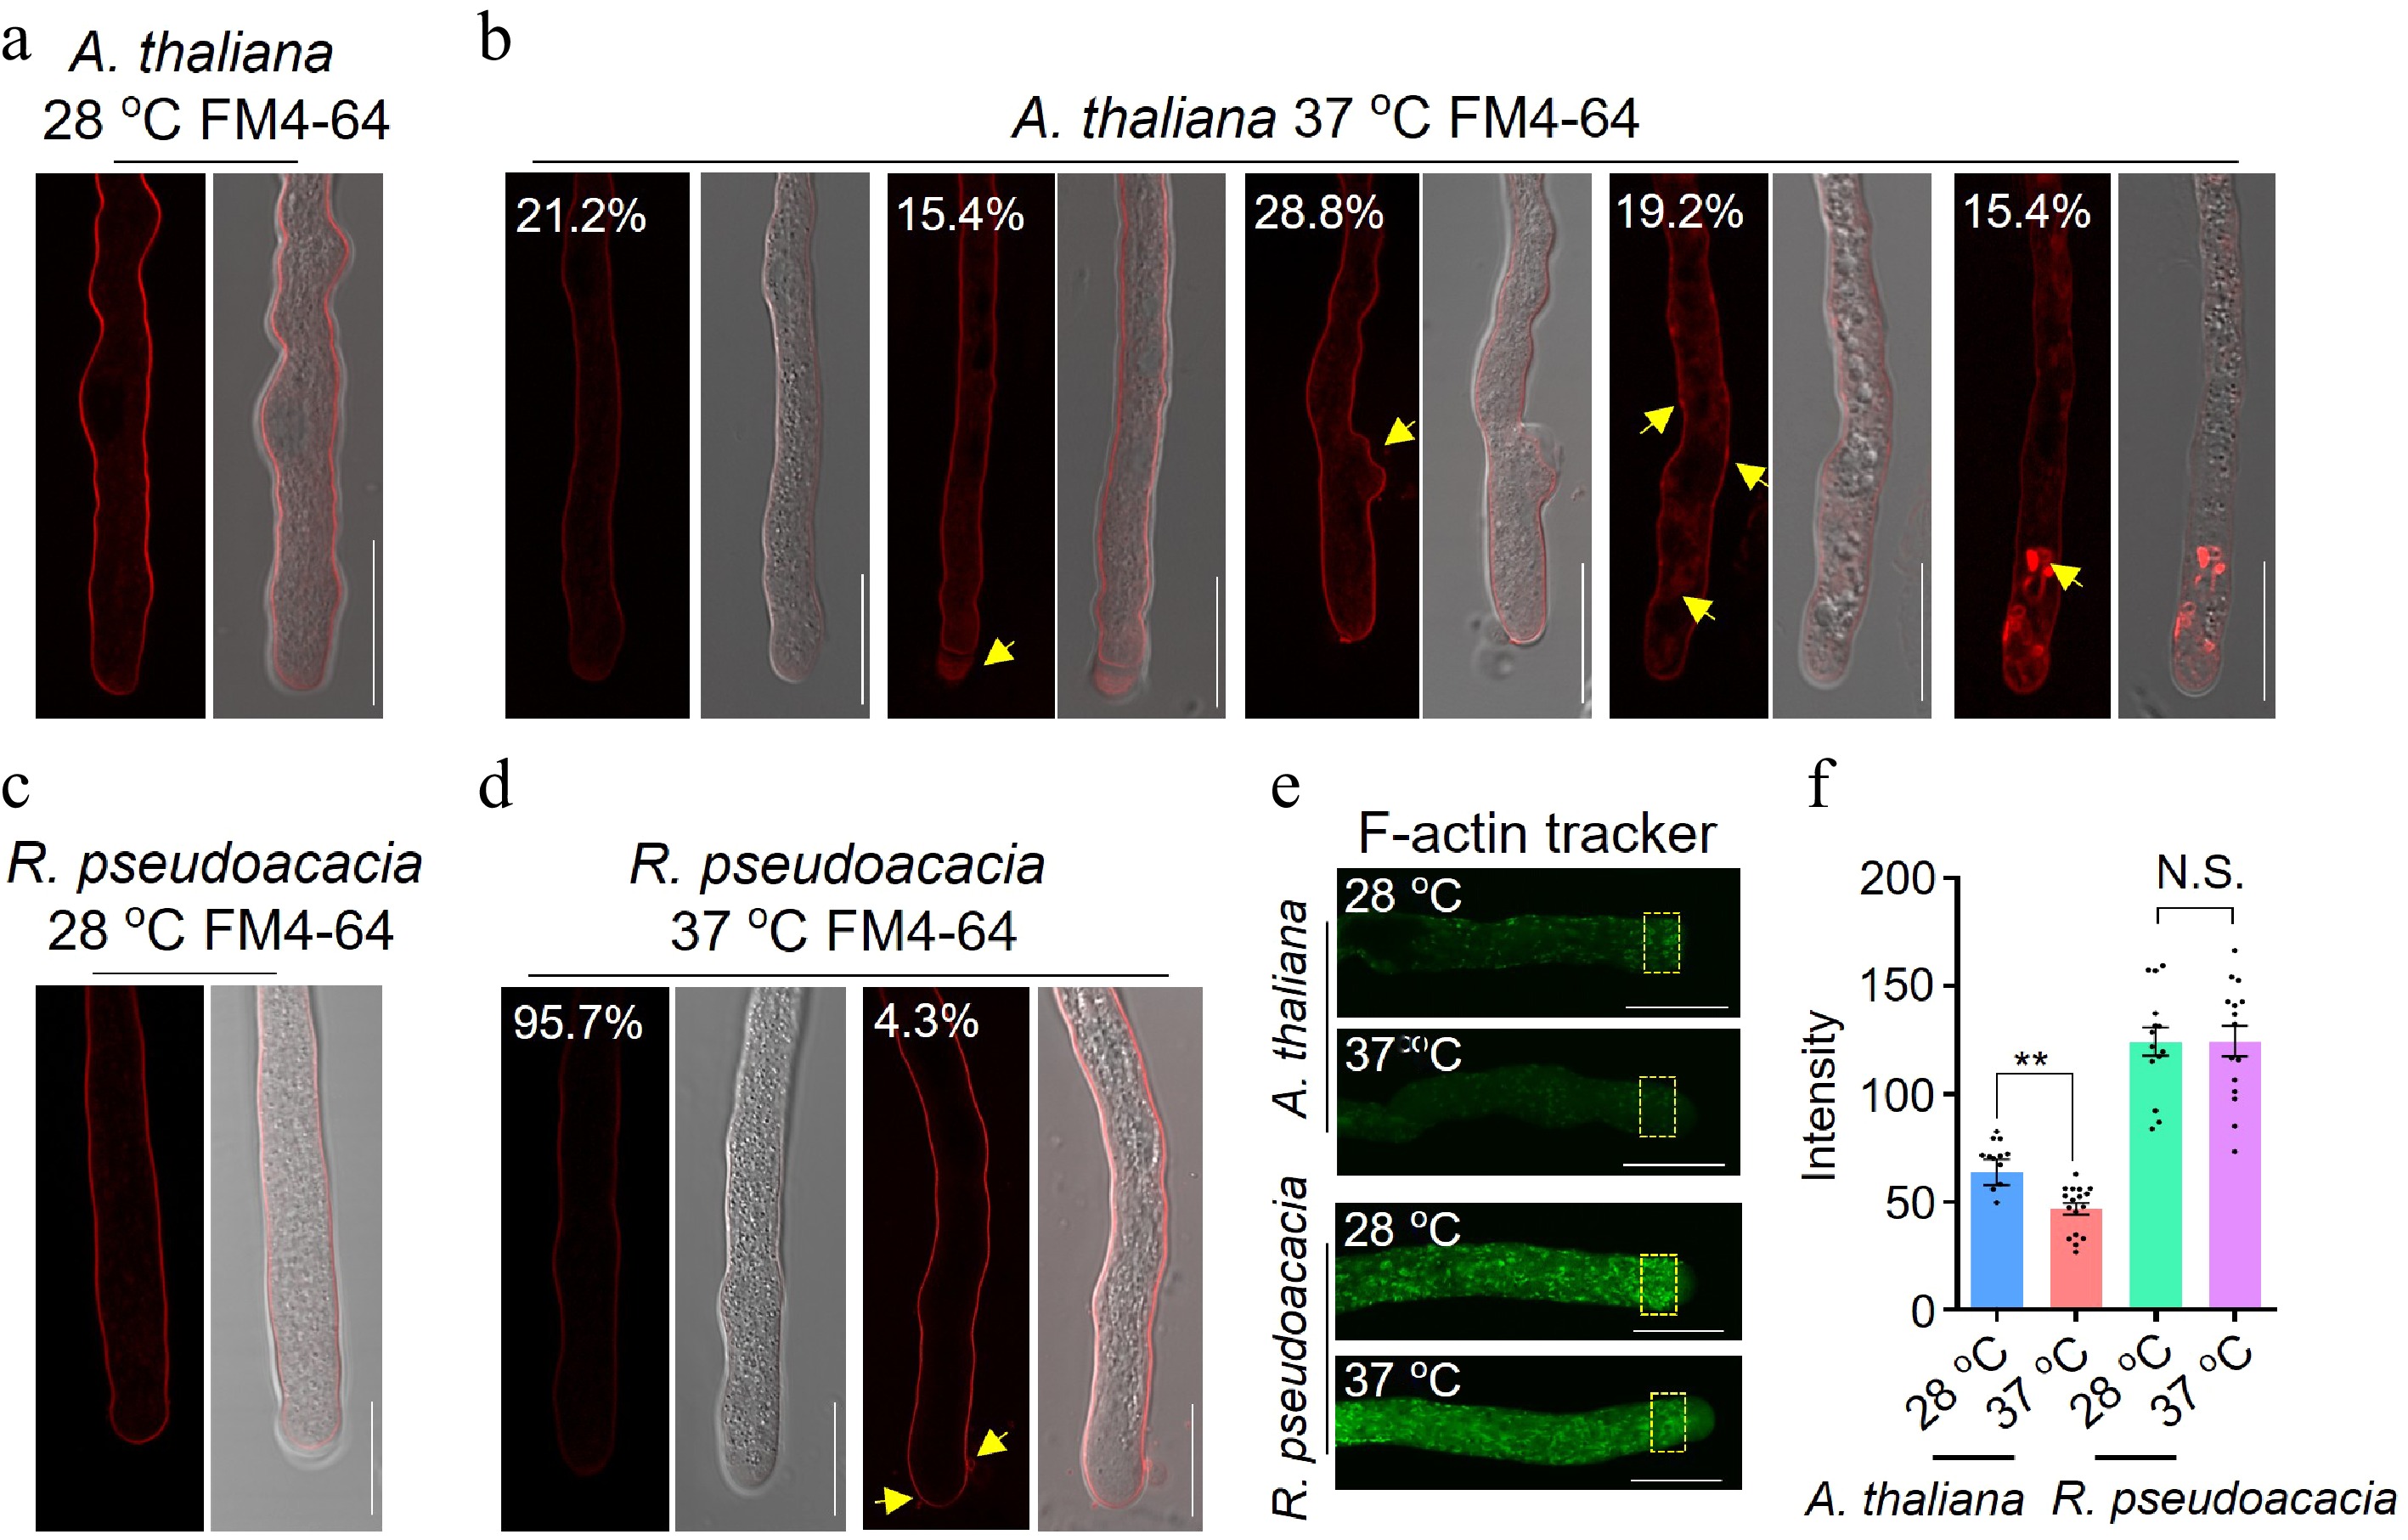
Figure 3.
Stable plasma membrane integrity and F-actin cytoskeleton stability underlie high-temperature tolerance of R. pseudoacacia pollen tubes. (a) An A. thaliana pollen tube stained with the membrane-selective fluorescent dye FM4-64 after growth at 28 °C, showing intact plasma membranes. Left, fluorescence image; right, merged fluorescence-bright-field image. (b) Damage phenotypes in A. thaliana pollen tubes after heat shock (28 °C for 3 h in the dark, then 37 °C for 30 min), arranged from left to right in order of increasing severity: an intact plasma membrane (21.2% of tubes); vacuolation at the tube tip (15.4%); abnormal branching (28.8%, yellow arrowhead); intensified intracellular FM4-64 fluorescence accompanied by numerous large vesicles, indicating compromised plasma membrane integrity (19.2%, yellow arrowheads); and massive intracellular FM4-64 accumulation with bright-field evidence of cell death (15.4%, yellow arrowhead). Percentages indicate the proportion of each phenotypic class (n = 52 pollen tubes). For each class, the fluorescence image (left) and merged fluorescence-bright-field image (right) are shown. (c) An R. pseudoacacia pollen tube stained with FM4-64 after growth at 28 °C, showing intact plasma membranes. Left, fluorescence image; right, merged fluorescence-bright-field image. (d) R. pseudoacacia pollen tubes after the same heat-shock treatment as in (b): 95.7% retained an intact plasma membrane (left), whereas 4.3% showed small vesicles budding from the plasma membrane (right, yellow arrows) (n = 62 pollen tubes). Scale bars, 10 μm (a)−(d). (e) F-actin organization in A. thaliana and R. pseudoacacia pollen tubes at 28 °C and after heat shock (28 °C for 3 h in the dark, then 37 °C for 30 min), visualized with Actin-Tracker. Yellow dashed boxes mark the subapical region used for quantification. Scale bar, 10 μm. (f) F-actin fluorescence intensity in the subapical region shown in (e). Data are mean ± SEM (n = 13, 17, 14, and 15 pollen tubes for A. thaliana 28 °C, A. thaliana 37 °C, R. pseudoacacia 28 °C, and R. pseudoacacia 37 °C, respectively); each dot represents an individual pollen tube. Two-tailed Student's t-test, ** p < 0.01; N.S., not significant.
-
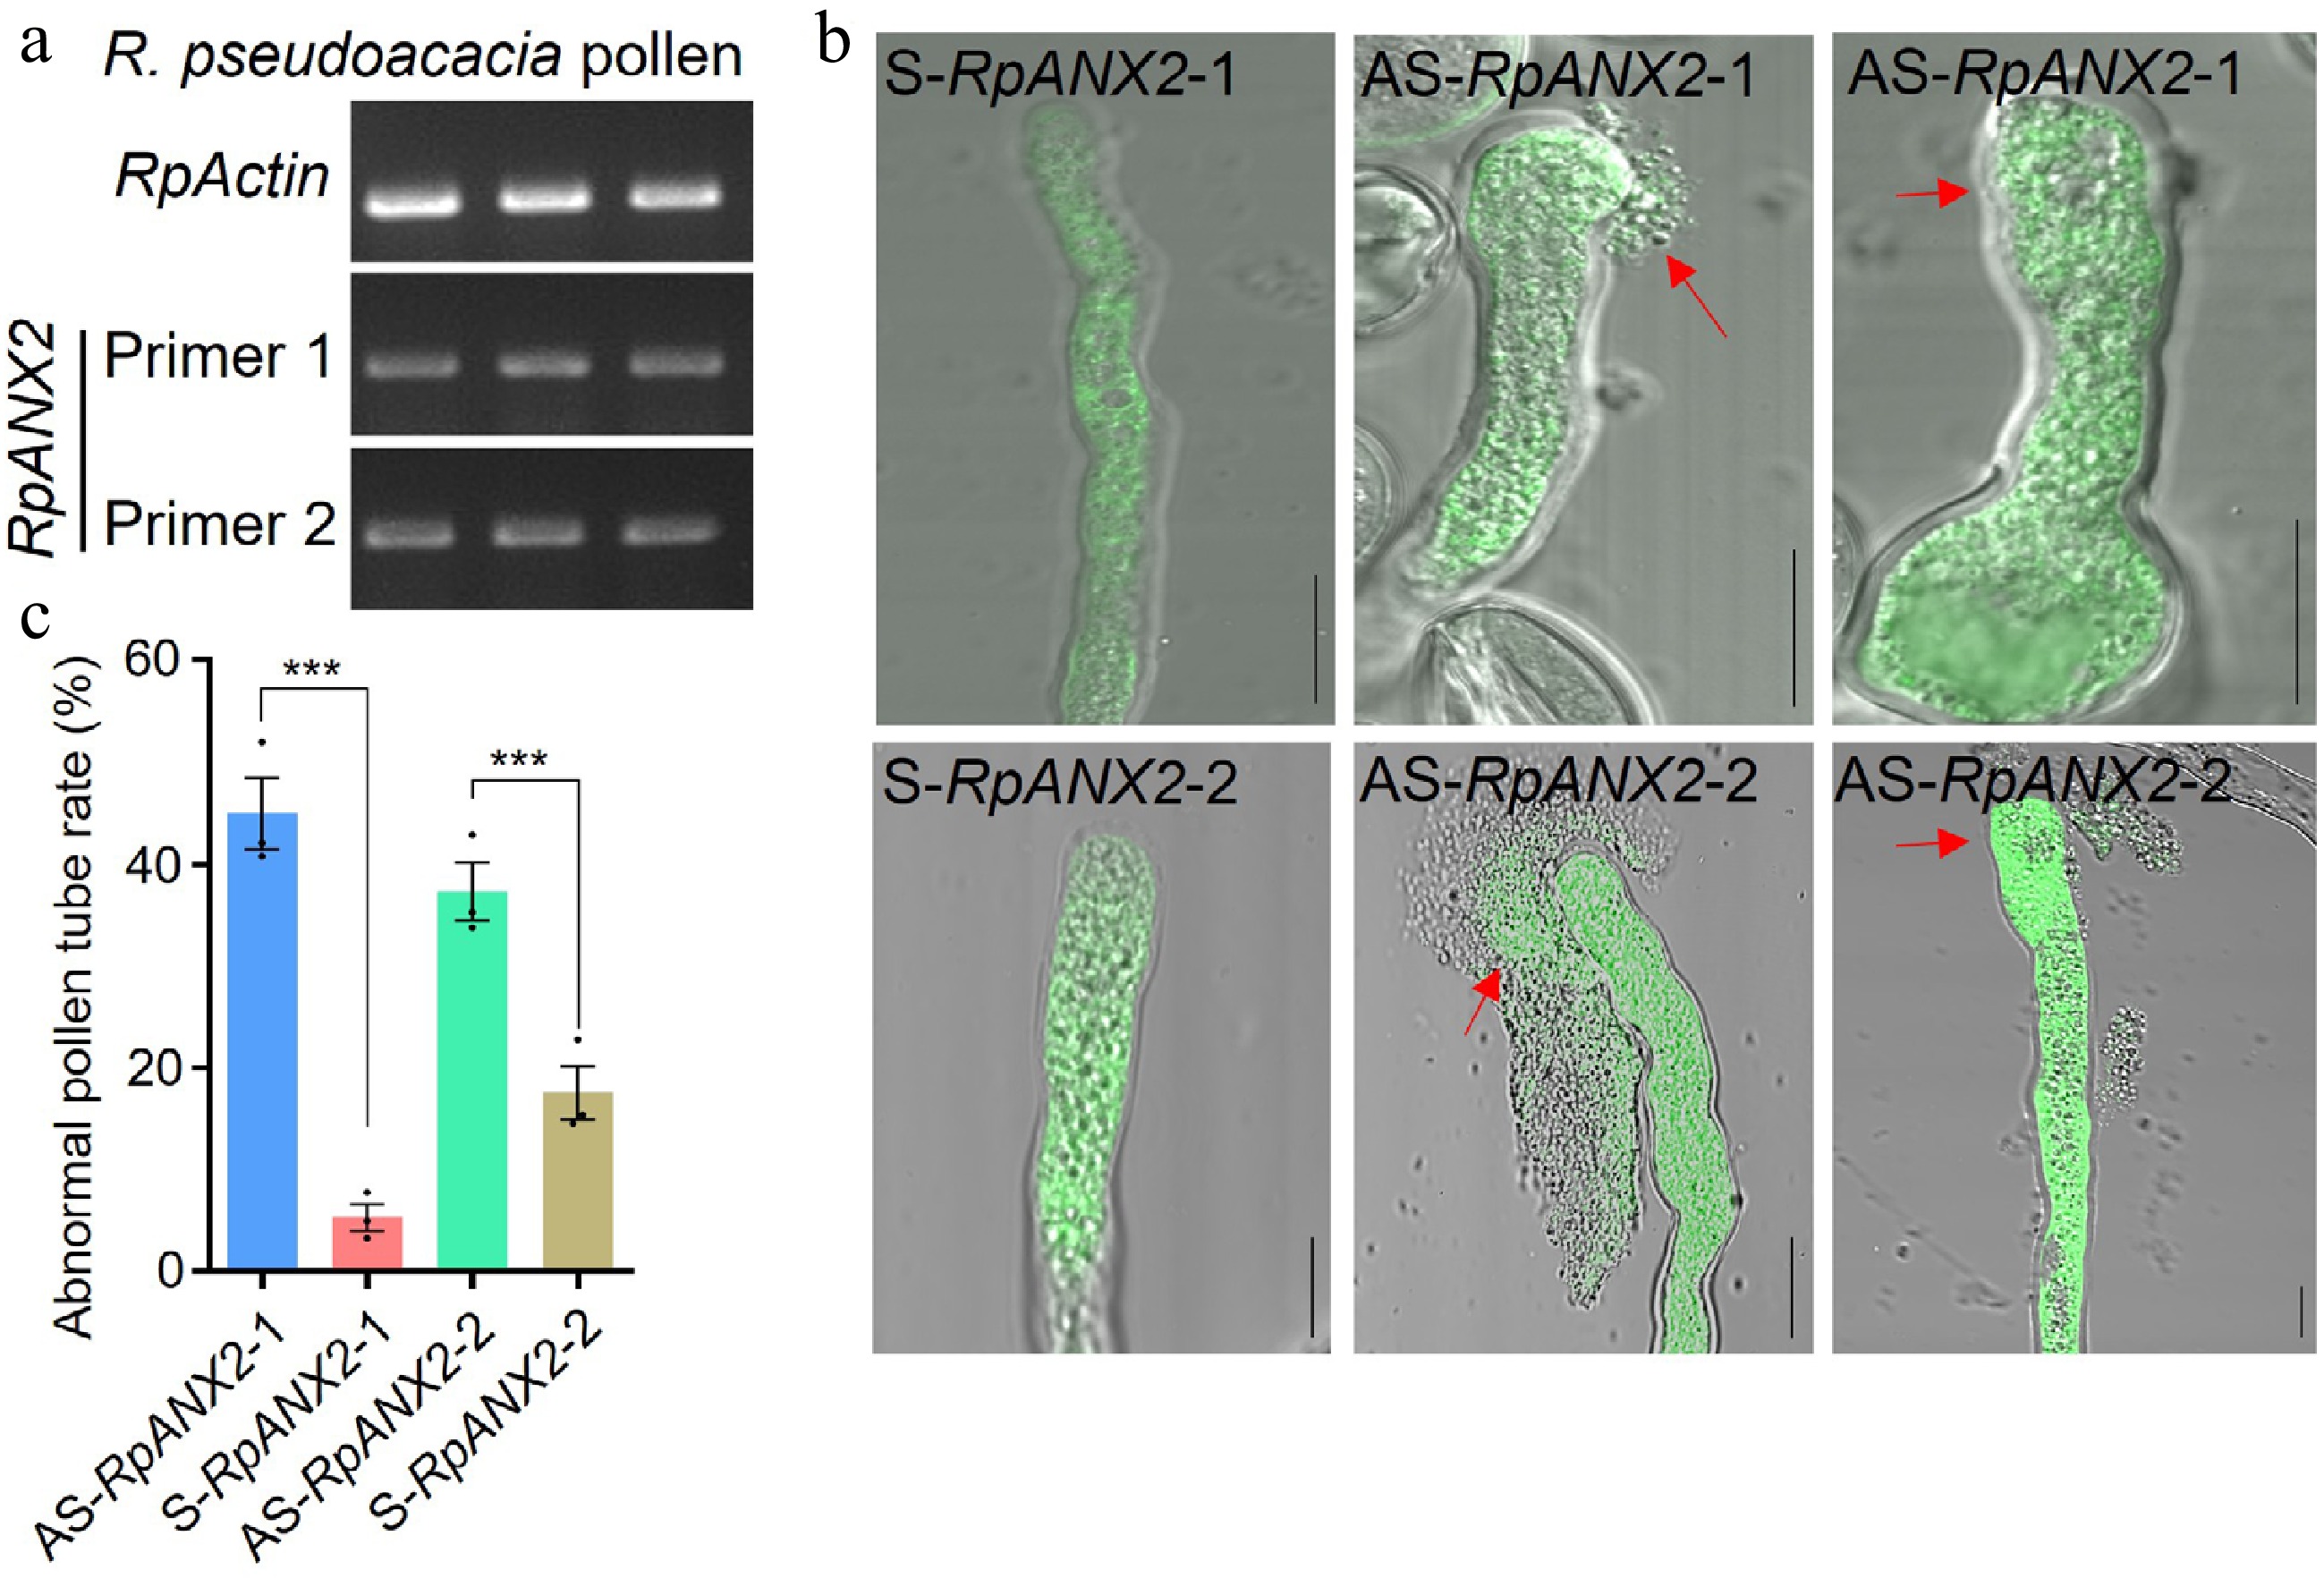
Figure 4.
RpANX2 regulates R. pseudoacacia pollen tube growth. (a) Reverse transcription-polymerase chain reaction (RT-PCR) analysis of RpANX2 expression in R. pseudoacacia pollen, performed with two independent primer pairs (primer 1 and primer 2). RpActin served as an internal reference gene. (b) Representative images of pollen tubes treated with antisense oligonucleotides targeting RpANX2 (AS-RpANX2-1 and AS-RpANX2-2) or with the corresponding sense-strand control oligonucleotides (S-RpANX2-1 and S-RpANX2-2). Two representative abnormal phenotypes are shown for each antisense treatment; red arrows indicate sites of tube rupture or swelling. Scale bars, 10 μm. (c) Percentage of abnormal pollen tubes for the treatments shown in (b). Data are mean ± SEM (n = 3 biological replicates, ≥ 60 pollen tubes per replicate); each dot represents one biological replicate. Two-tailed Student's t-test; *** p < 0.001.
-
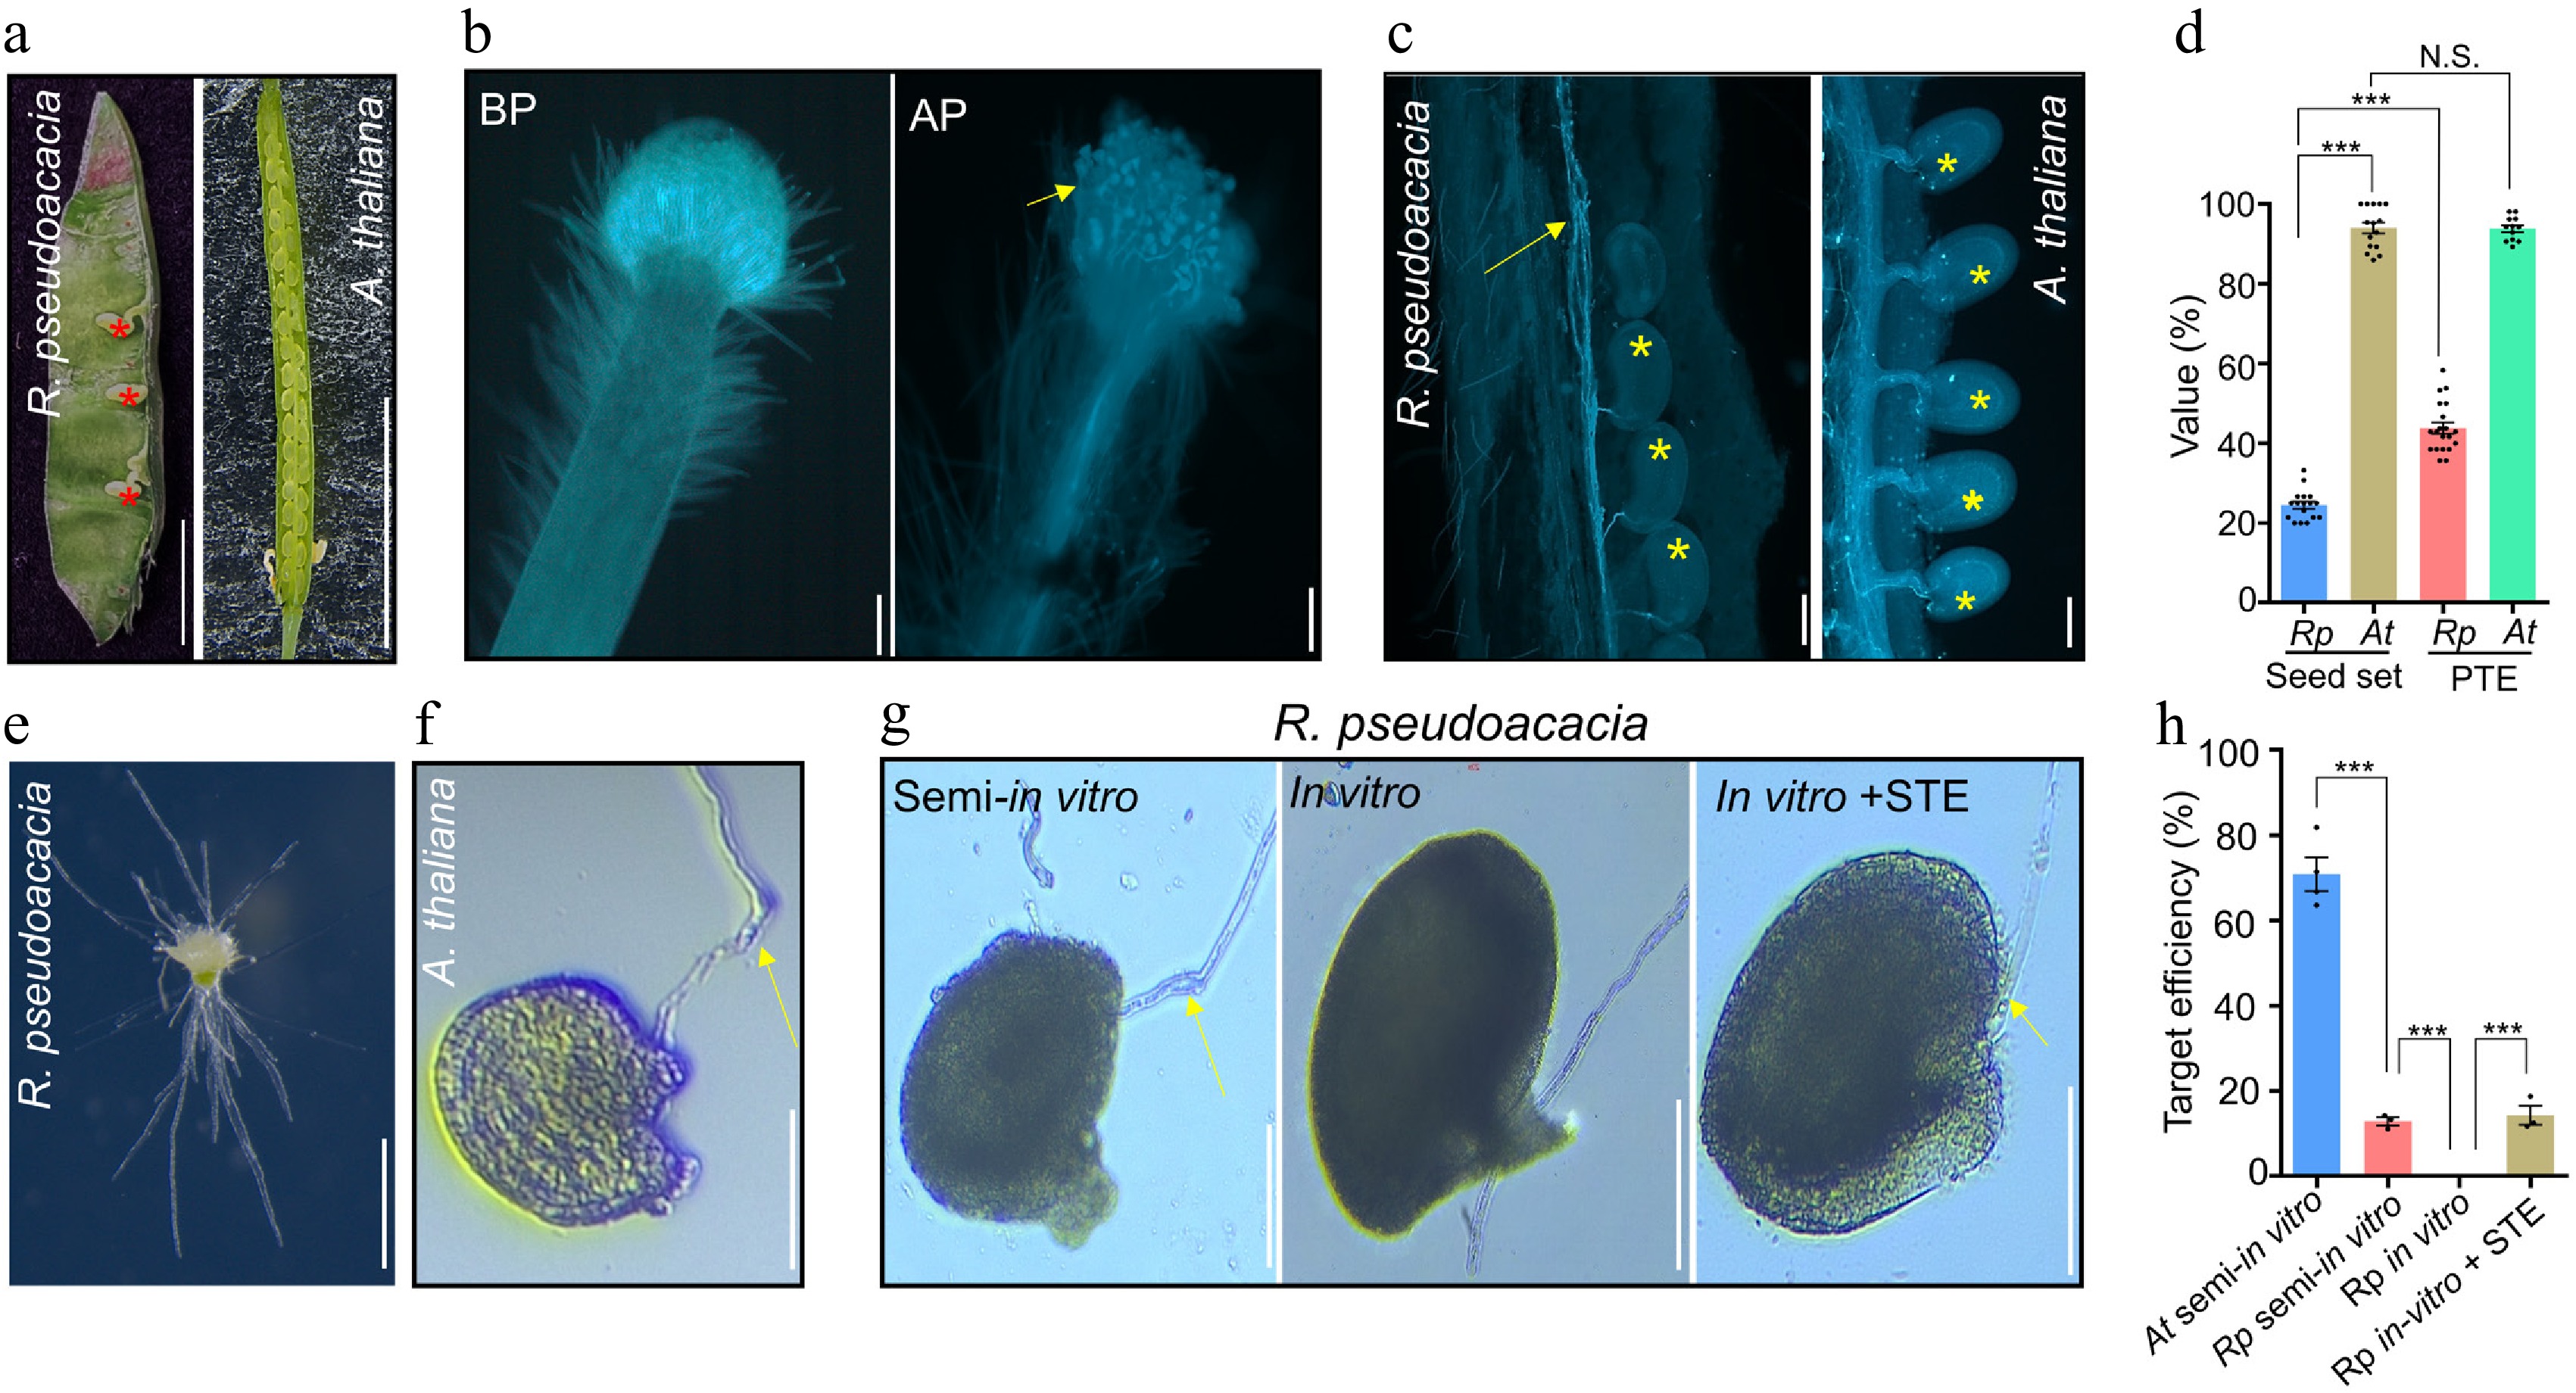
Figure 5.
Aberrant pollen tube guidance limits seed set in R. pseudoacacia. (a) Seed production in fruits of R. pseudoacacia (legume pod, left) and A. thaliana (silique, right). Red asterisks indicate developed seeds in the R. pseudoacacia pod; the majority of ovules aborted. Scale bars, 1 cm. (b) Aniline blue staining of an R. pseudoacacia stigma before pollination (BP, left) and after pollination (AP, right). The yellow arrowhead indicates pollen grains germinating on the stigma. Scale bars: 50 μm. (c) Aniline blue staining of R. pseudoacacia (left) and A. thaliana (right) pistils after pollination, showing pollen tube growth through the style and ovule targeting. Yellow arrow, pollen tubes; yellow asterisks, ovules reached by a pollen tube. Scale bars, 100 μm. (d) Quantification of seed set shown in (a) and pollen tube targeting efficiency (PTE, the percentage of ovules reached by at least one pollen tube) shown in (c) for both species. Data are mean ± SEM (n = 195, 571, 274, and 369 ovules for R. pseudoacacia seed set, A. thaliana seed set, R. pseudoacacia PTE, and A. thaliana PTE, respectively); each dot represents one biological replicate. Two-tailed Student's t-test; *** p < 0.001; N.S., not significant. Rp, R. pseudoacacia; At, A. thaliana. (e) Semi-in vitro pollen tube guidance assays. R. pseudoacacia pollen was germinated on an excised stigma, and pollen tubes emerging from the cut end of the style were used for subsequent ovule attraction assays. Scale bar, 100 μm. (f) An A. thaliana ovule attracting a conspecific pollen tube (yellow arrow) in the semi-in vitro assay. Scale bar, 100 μm. (g) Attraction of R. pseudoacacia pollen tubes to unfertilized R. pseudoacacia ovules: a semi-in vitro-grown pollen tube (left), an in vitro-grown pollen tube (middle), and an in vitro-grown pollen tube supplemented with stigma exudates (STE) (right). Yellow arrows indicate pollen tubes growing toward the ovule micropyle. Scale bars, 100 μm. (h) Quantification of ovule targeting efficiency for the assays shown in (f) and (g). Data are mean ± SEM (n = 18, 25, 19, and 27 ovules for A. thaliana pollen tubes and R. pseudoacacia pollen tubes grown semi-in vitro, in vitro, and in vitro with STE, respectively); each dot represents one biological replicate. Two-tailed Student's t-test; *** p < 0.001.
-
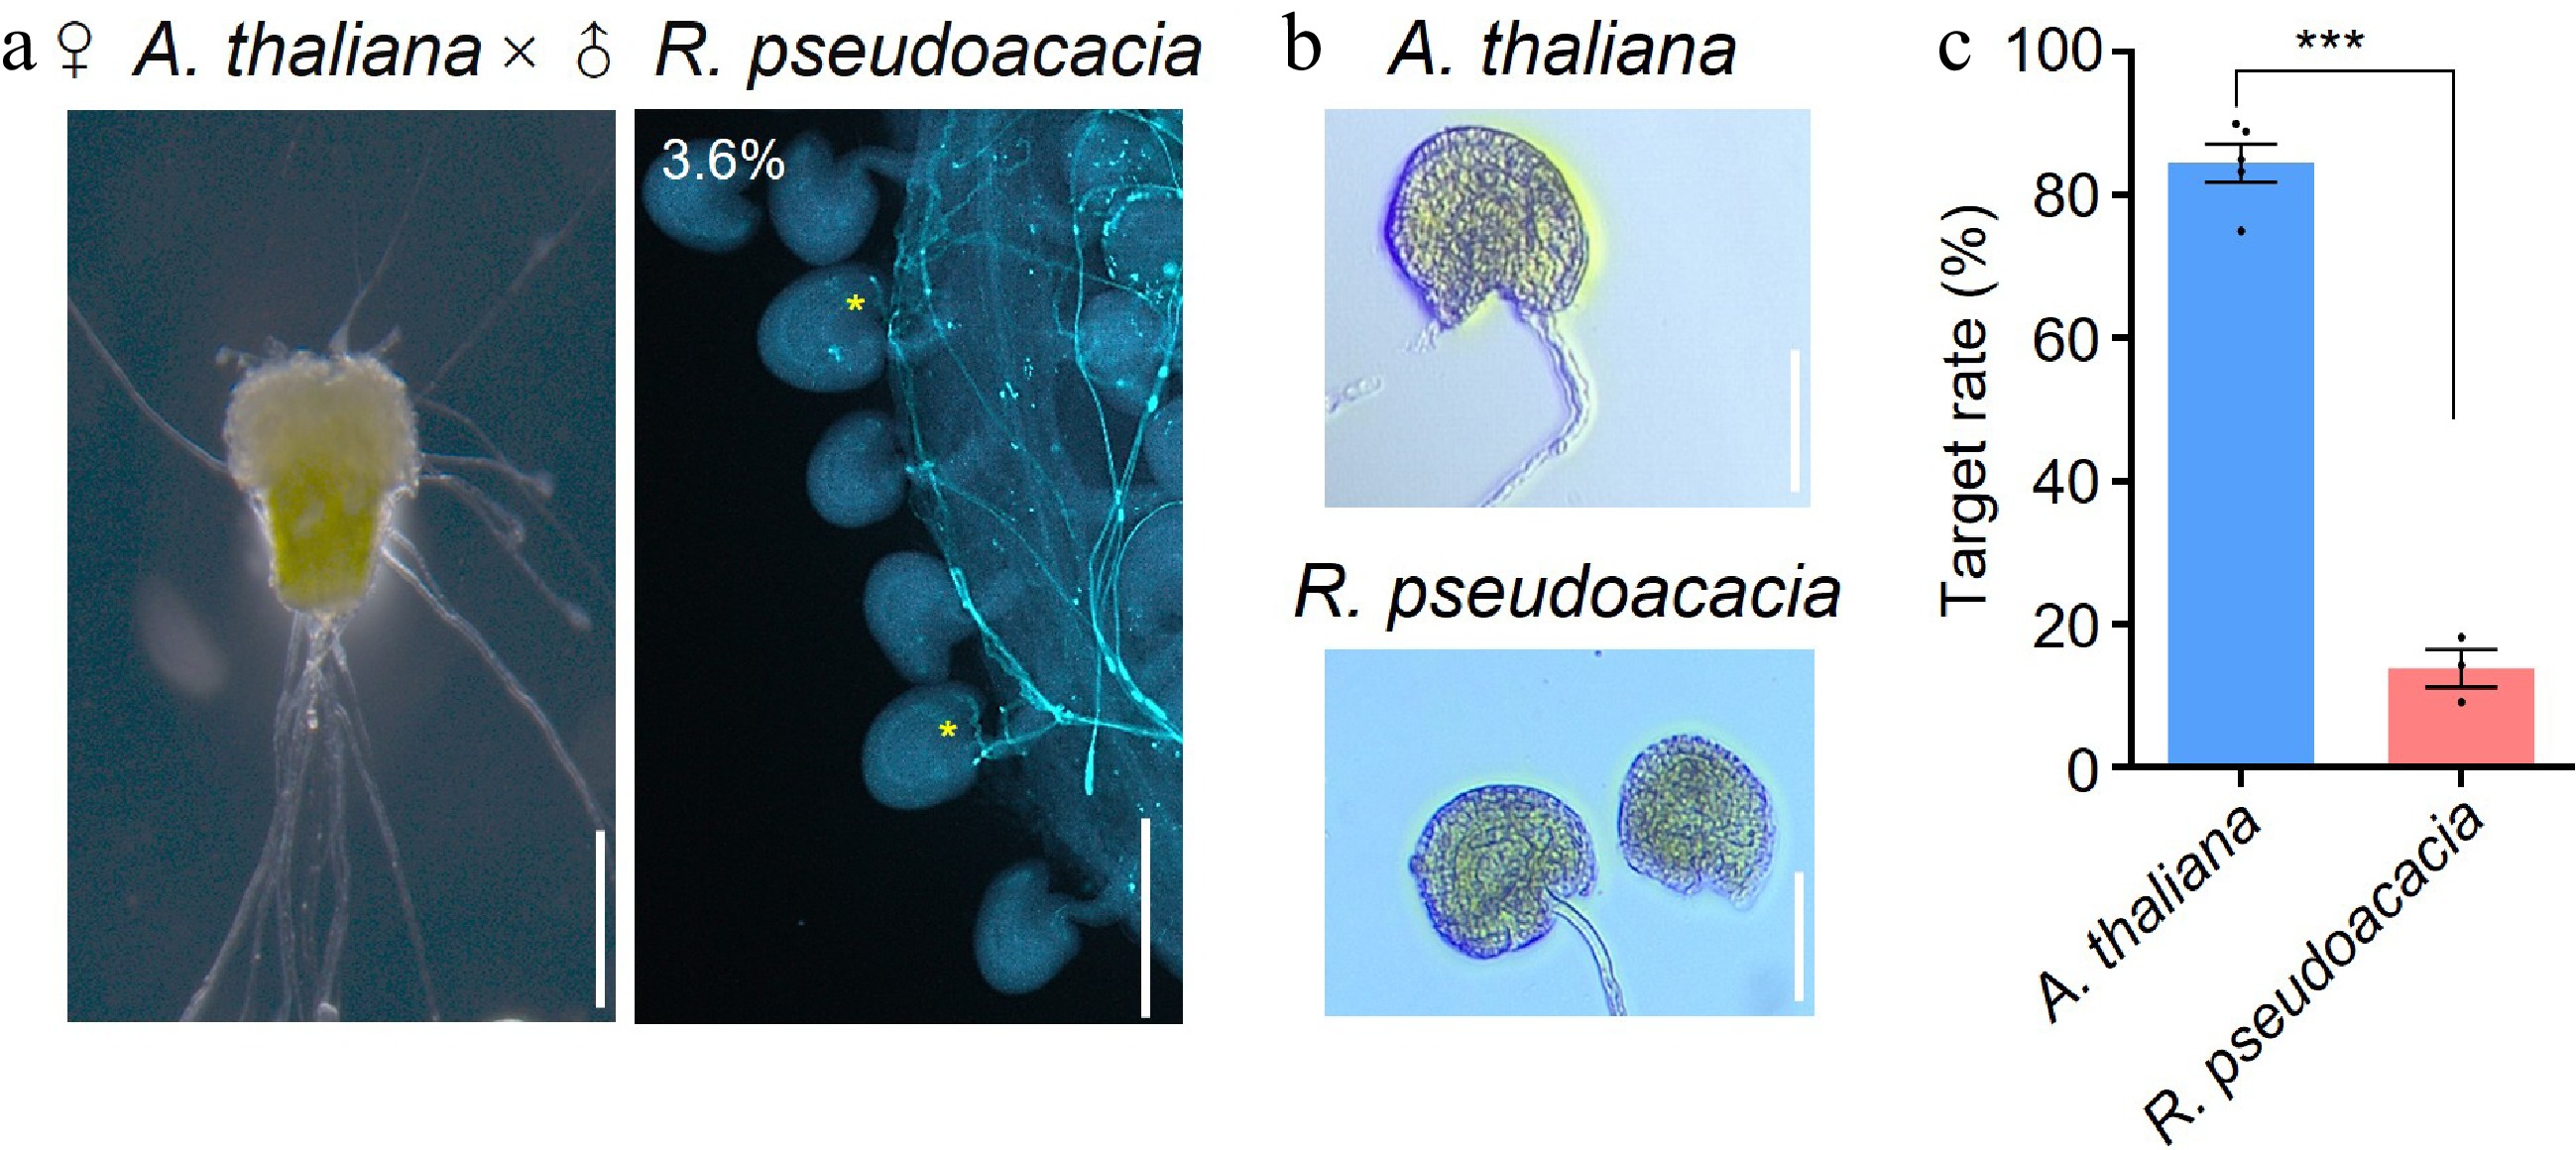
Figure 6.
R. pseudoacacia pollen tubes attracted by A. thaliana ovules. (a) Cross-pollination of A. thaliana (♀) with R. pseudoacacia pollen (♂). Left, semi-in vitro assay showing R. pseudoacacia pollen germinated on an A. thaliana stigma, with pollen tubes emerging from the cut end of the style; right, an aniline blue-stained A. thaliana pistil at 24 h after pollination, showing R. pseudoacacia pollen tubes that grew through the style and reached ovules (yellow asterisks; 3.6% of 424 ovules examined). Scale bars, 200 μm. (b) Ovule attraction assays in which A. thaliana ovules were co-cultured with semi-in vitro-grown pollen tubes of A. thaliana (upper panel) or R. pseudoacacia (lower panel). Scale bars, 100 μm. (c) Quantification of ovule targeting rates for the assays shown in (b). Data are mean ± SEM (n = 28 and 36 ovules for A. thaliana and R. pseudoacacia pollen tubes, respectively); each dot represents one biological replicate. Two-tailed Student's t-test; * p < 0.05.
Figures
(6)
Tables
(0)