-
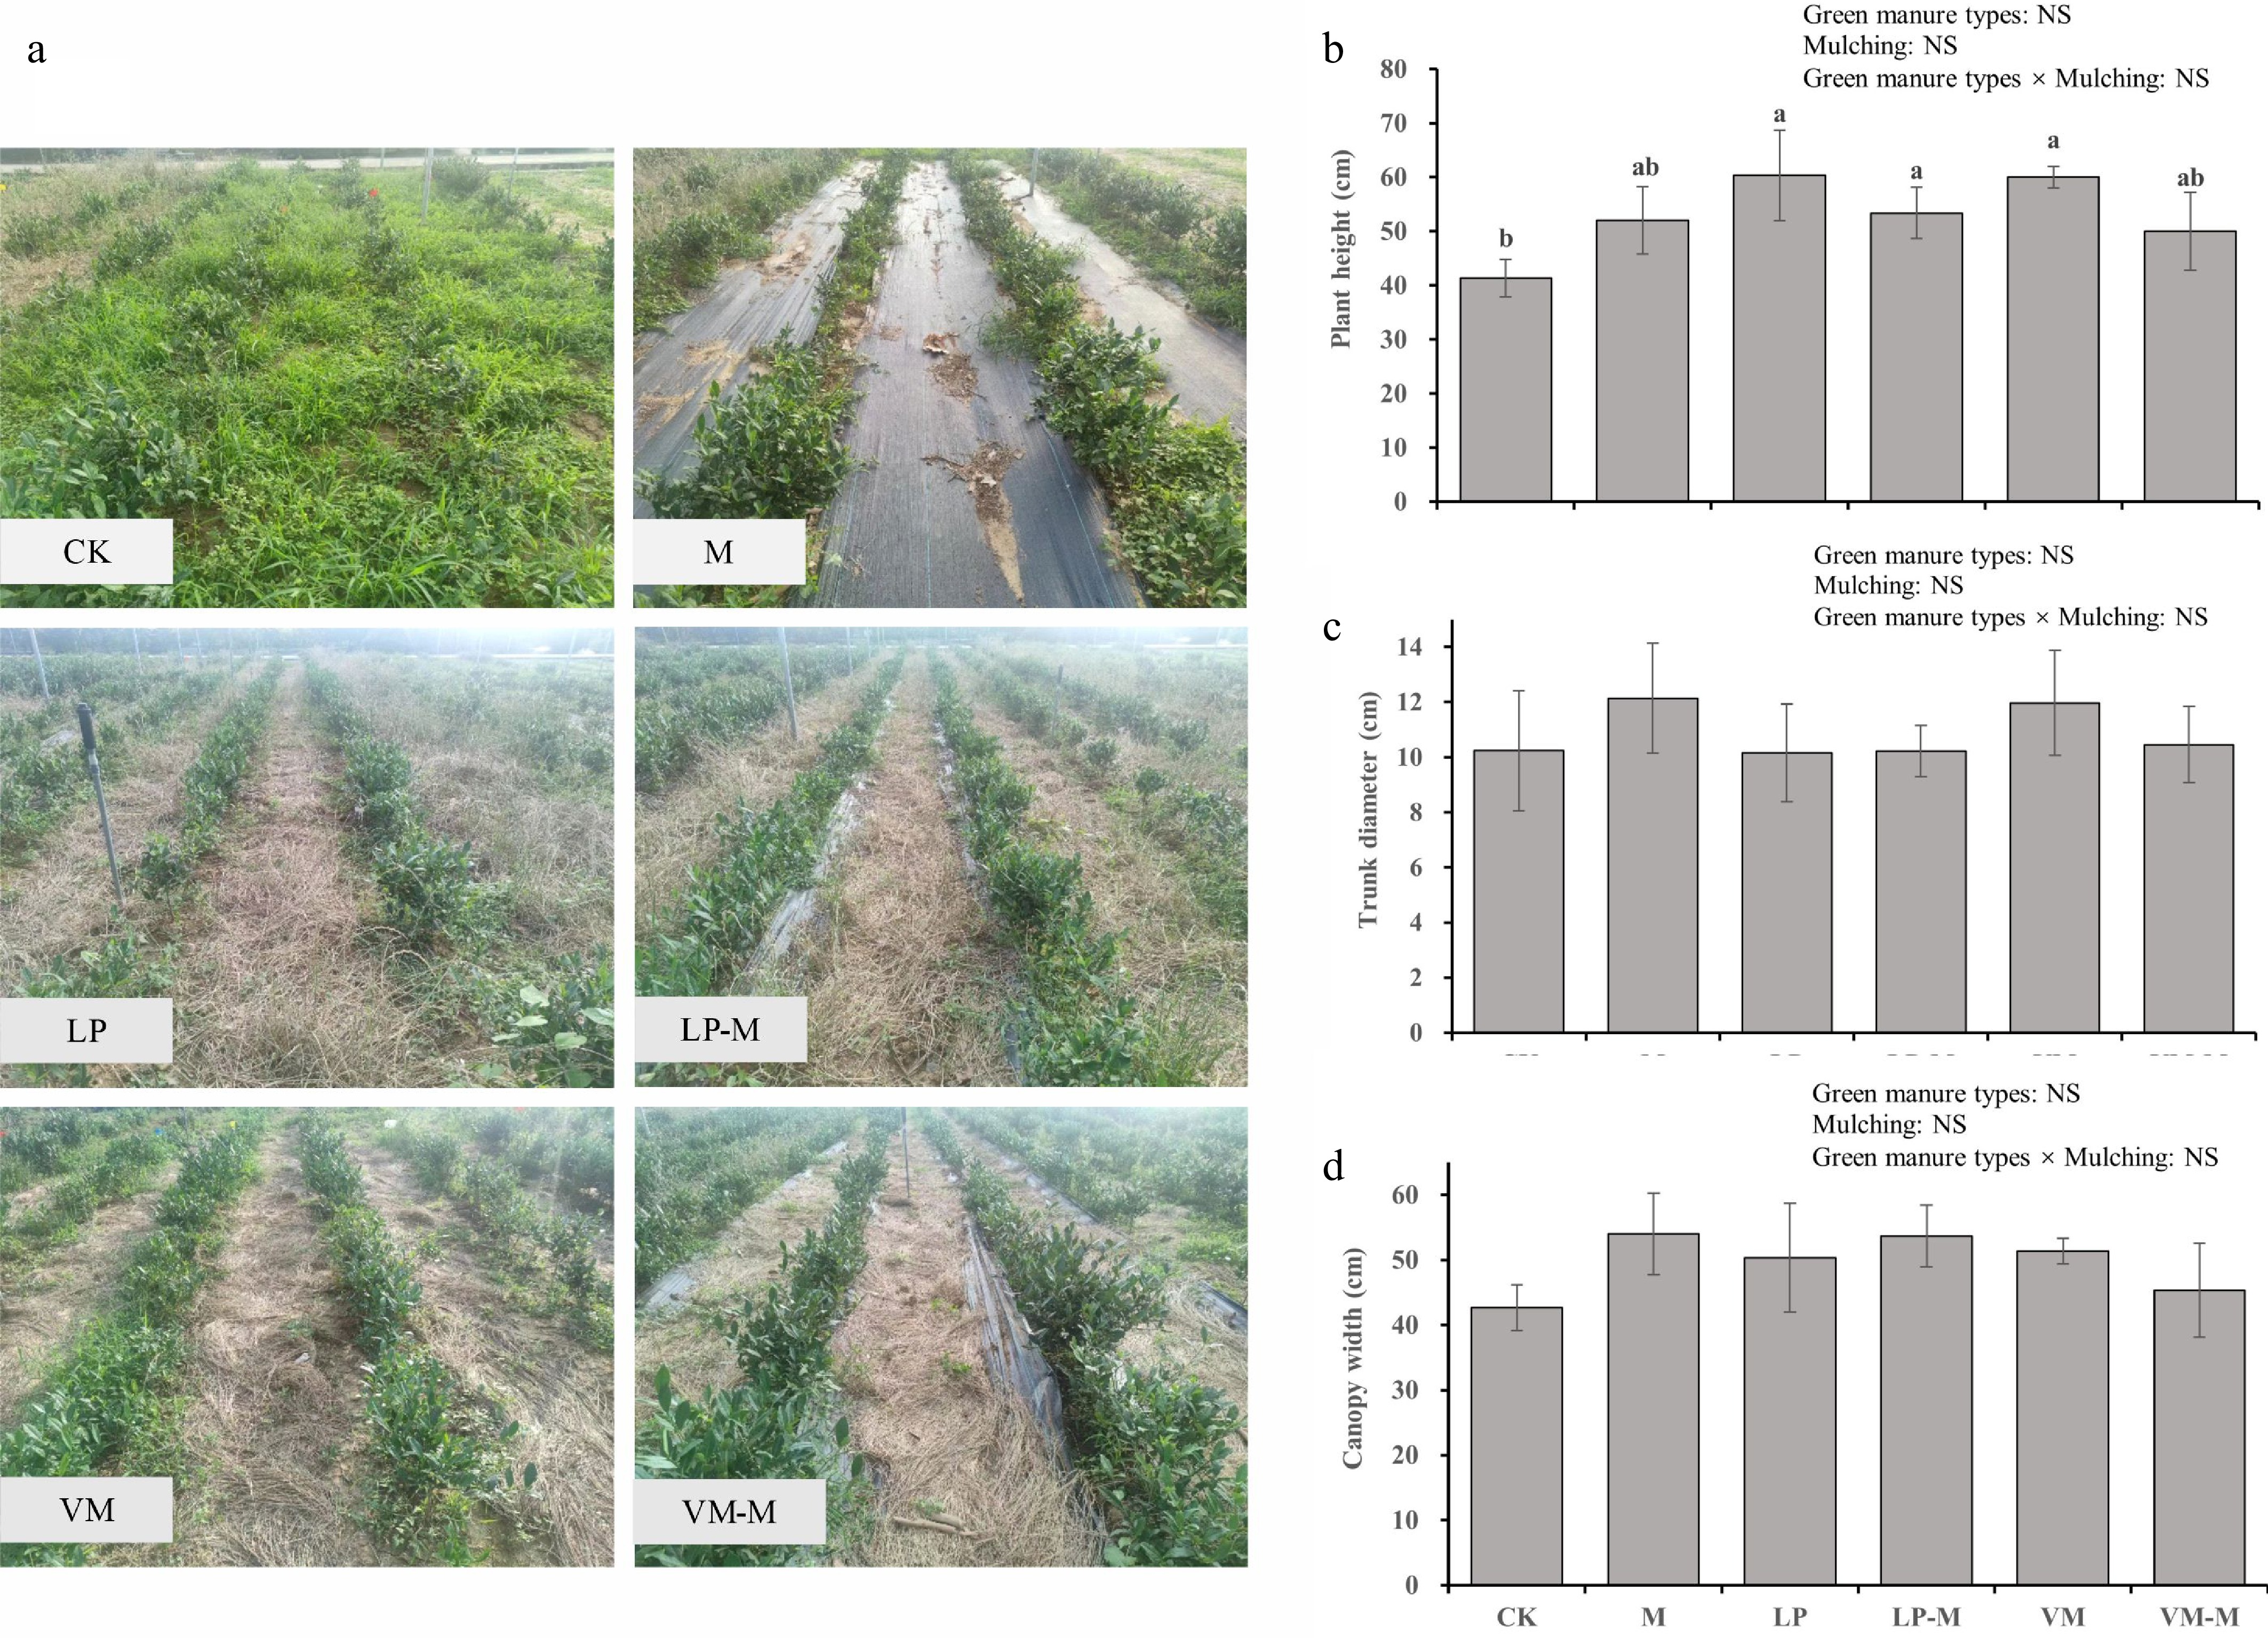
Figure 1.
Effects of different weed control treatments on the growth of (a) weeds, and (b)–(d) tea plants. CK, control; M, weed barrier fabric mulching; LP, L. perenne intercropping; LP-M, LP with mulching; VM, V. myuros intercropping; VM-M, VM with mulching. Different letters in the same column indicate significant differences in one-way ANOVA among groups (p < 0.05). Significant difference of two-way ANOVA indicated as ** p < 0.01; * p < 0.05; NS, not significant.
-
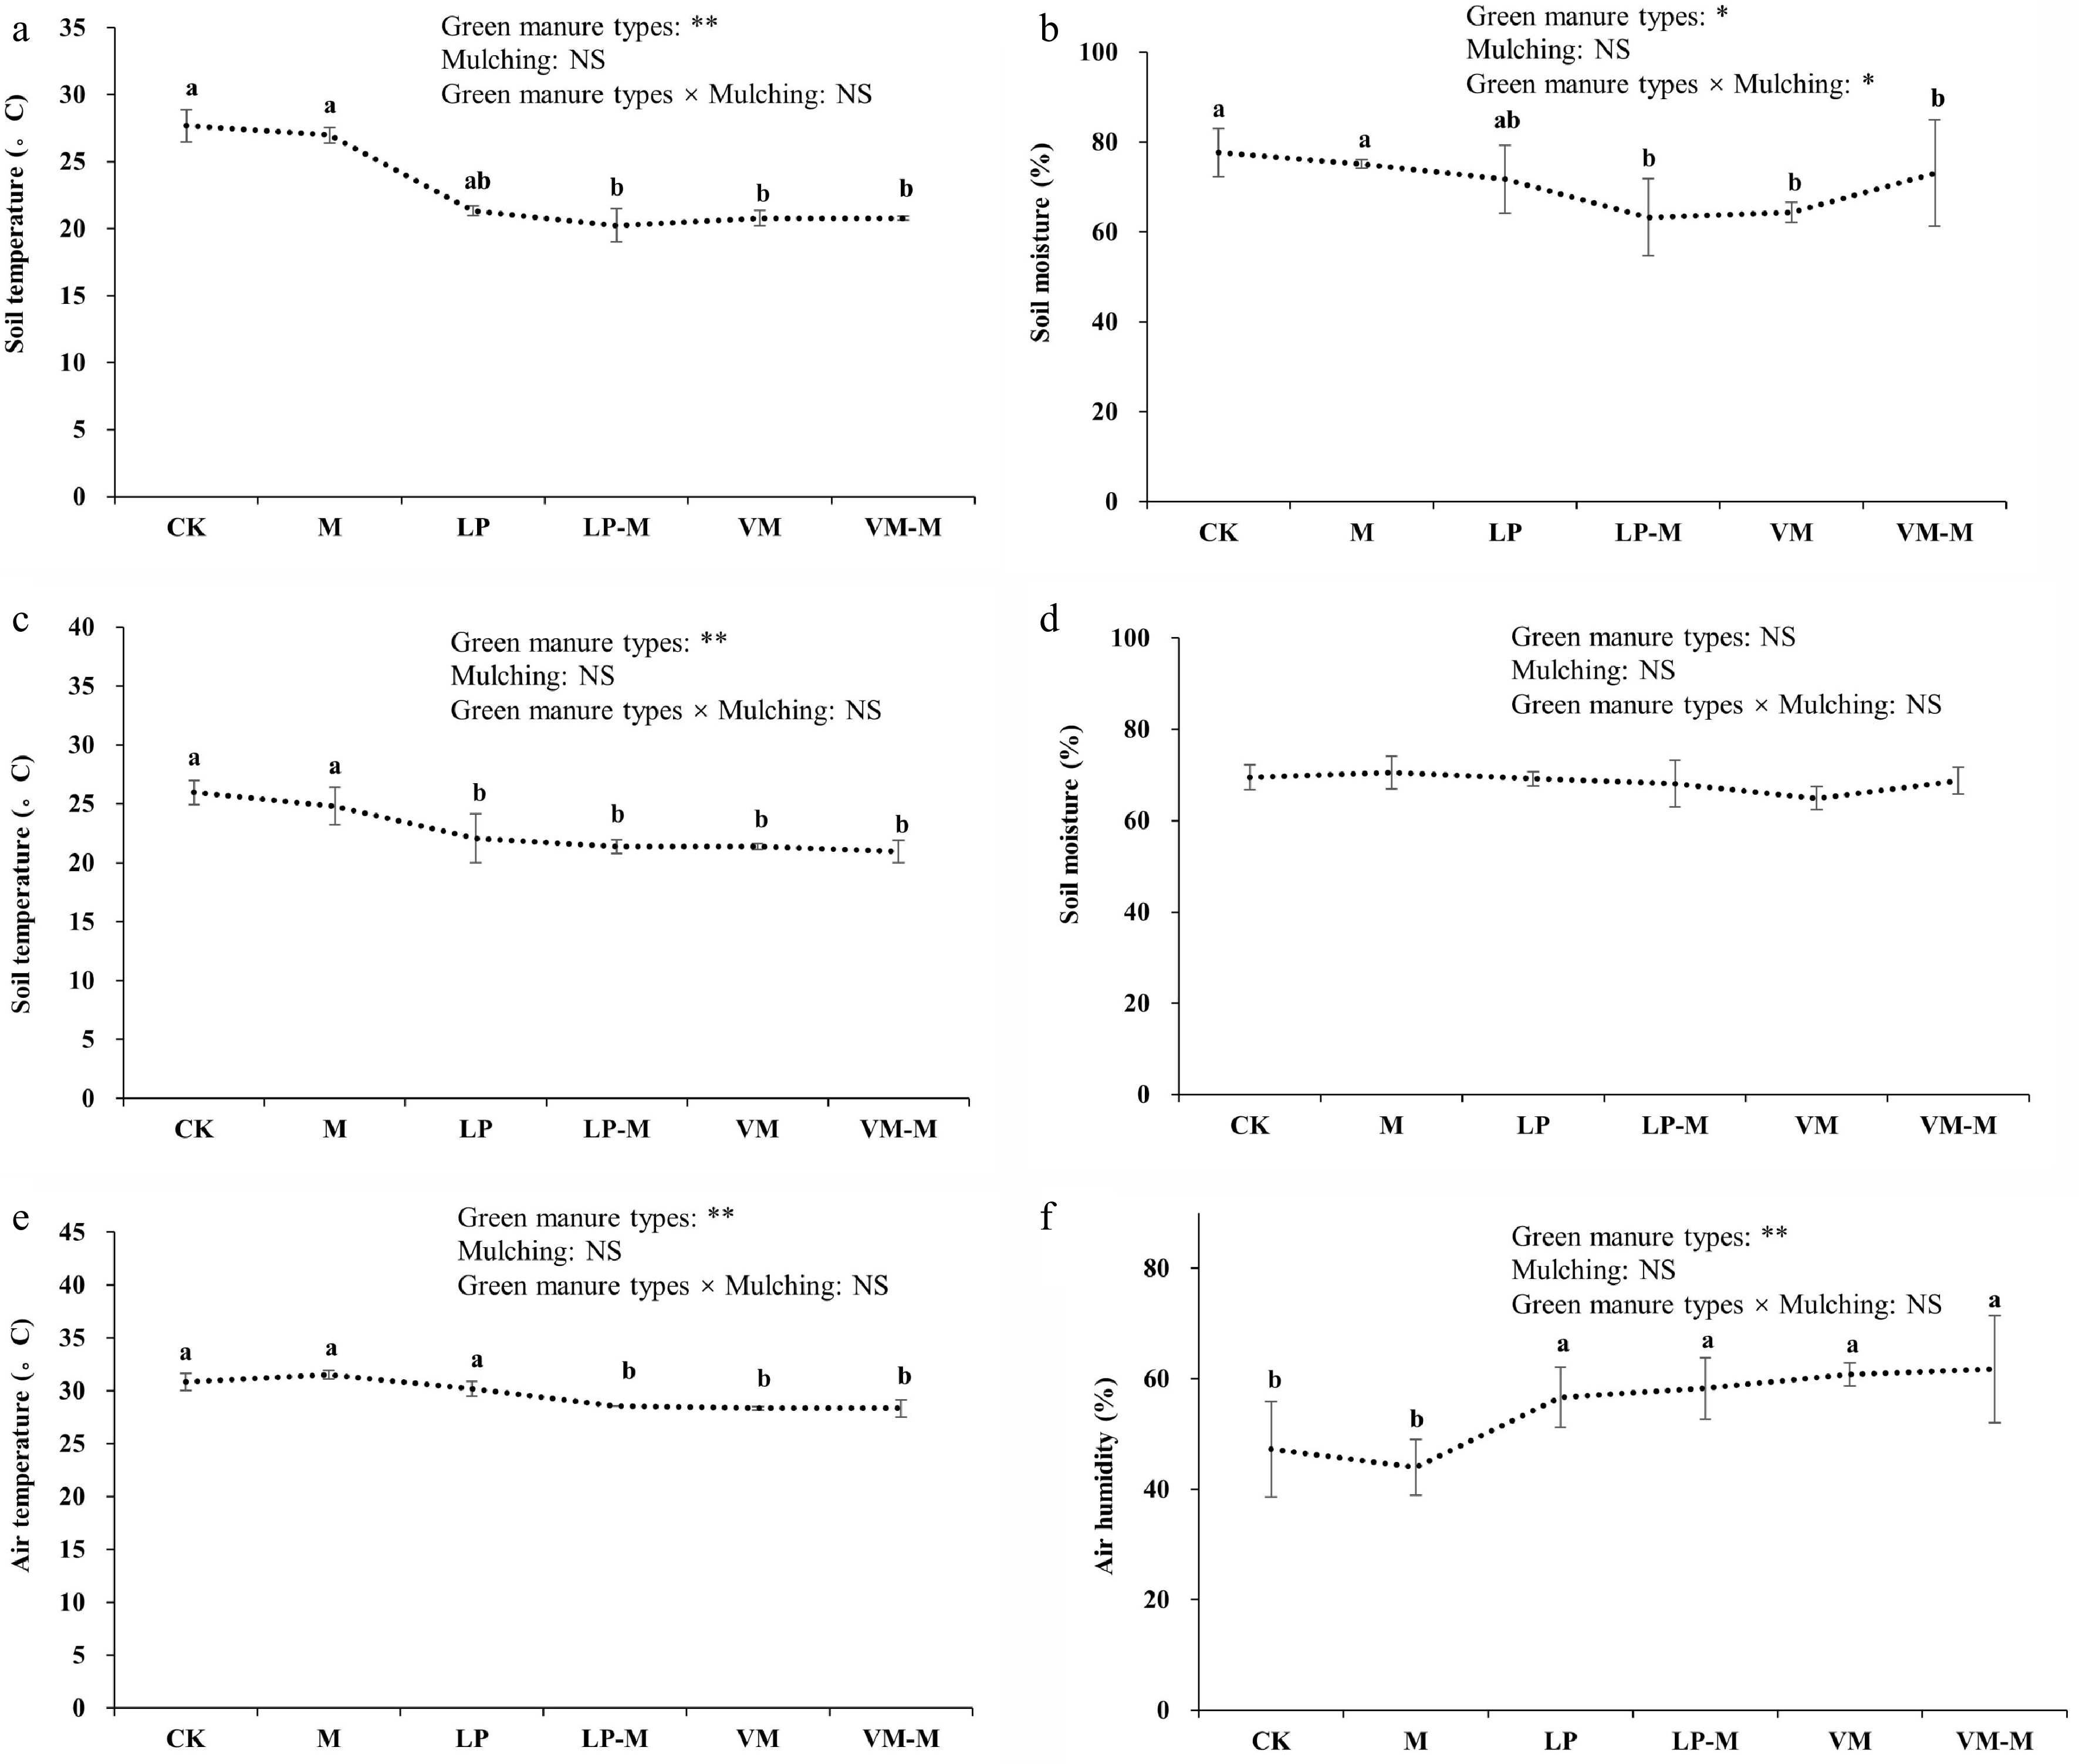
Figure 2.
The influence of different weed control treatments on the habitat of tea gardens at T1. (a) Interrow soil temperature; (b) interrow soil moisture; (c) fertilization furrow soil temperature; (d) fertilization furrow soil moisture; (e) canopy air temperature; (f) canopy air moisture. CK, control; M, weed barrier fabric mulching; LP, L. perenne intercropping; LP-M, LP with mulching; VM, V. myuros intercropping; VM-M, VM with mulching. Different letters indicate significant differences in the one-way ANOVA among groups (p < 0.05). Significant difference of two-way ANOVA indicated as ** p < 0.01; * p < 0.05; NS, not significant.
-
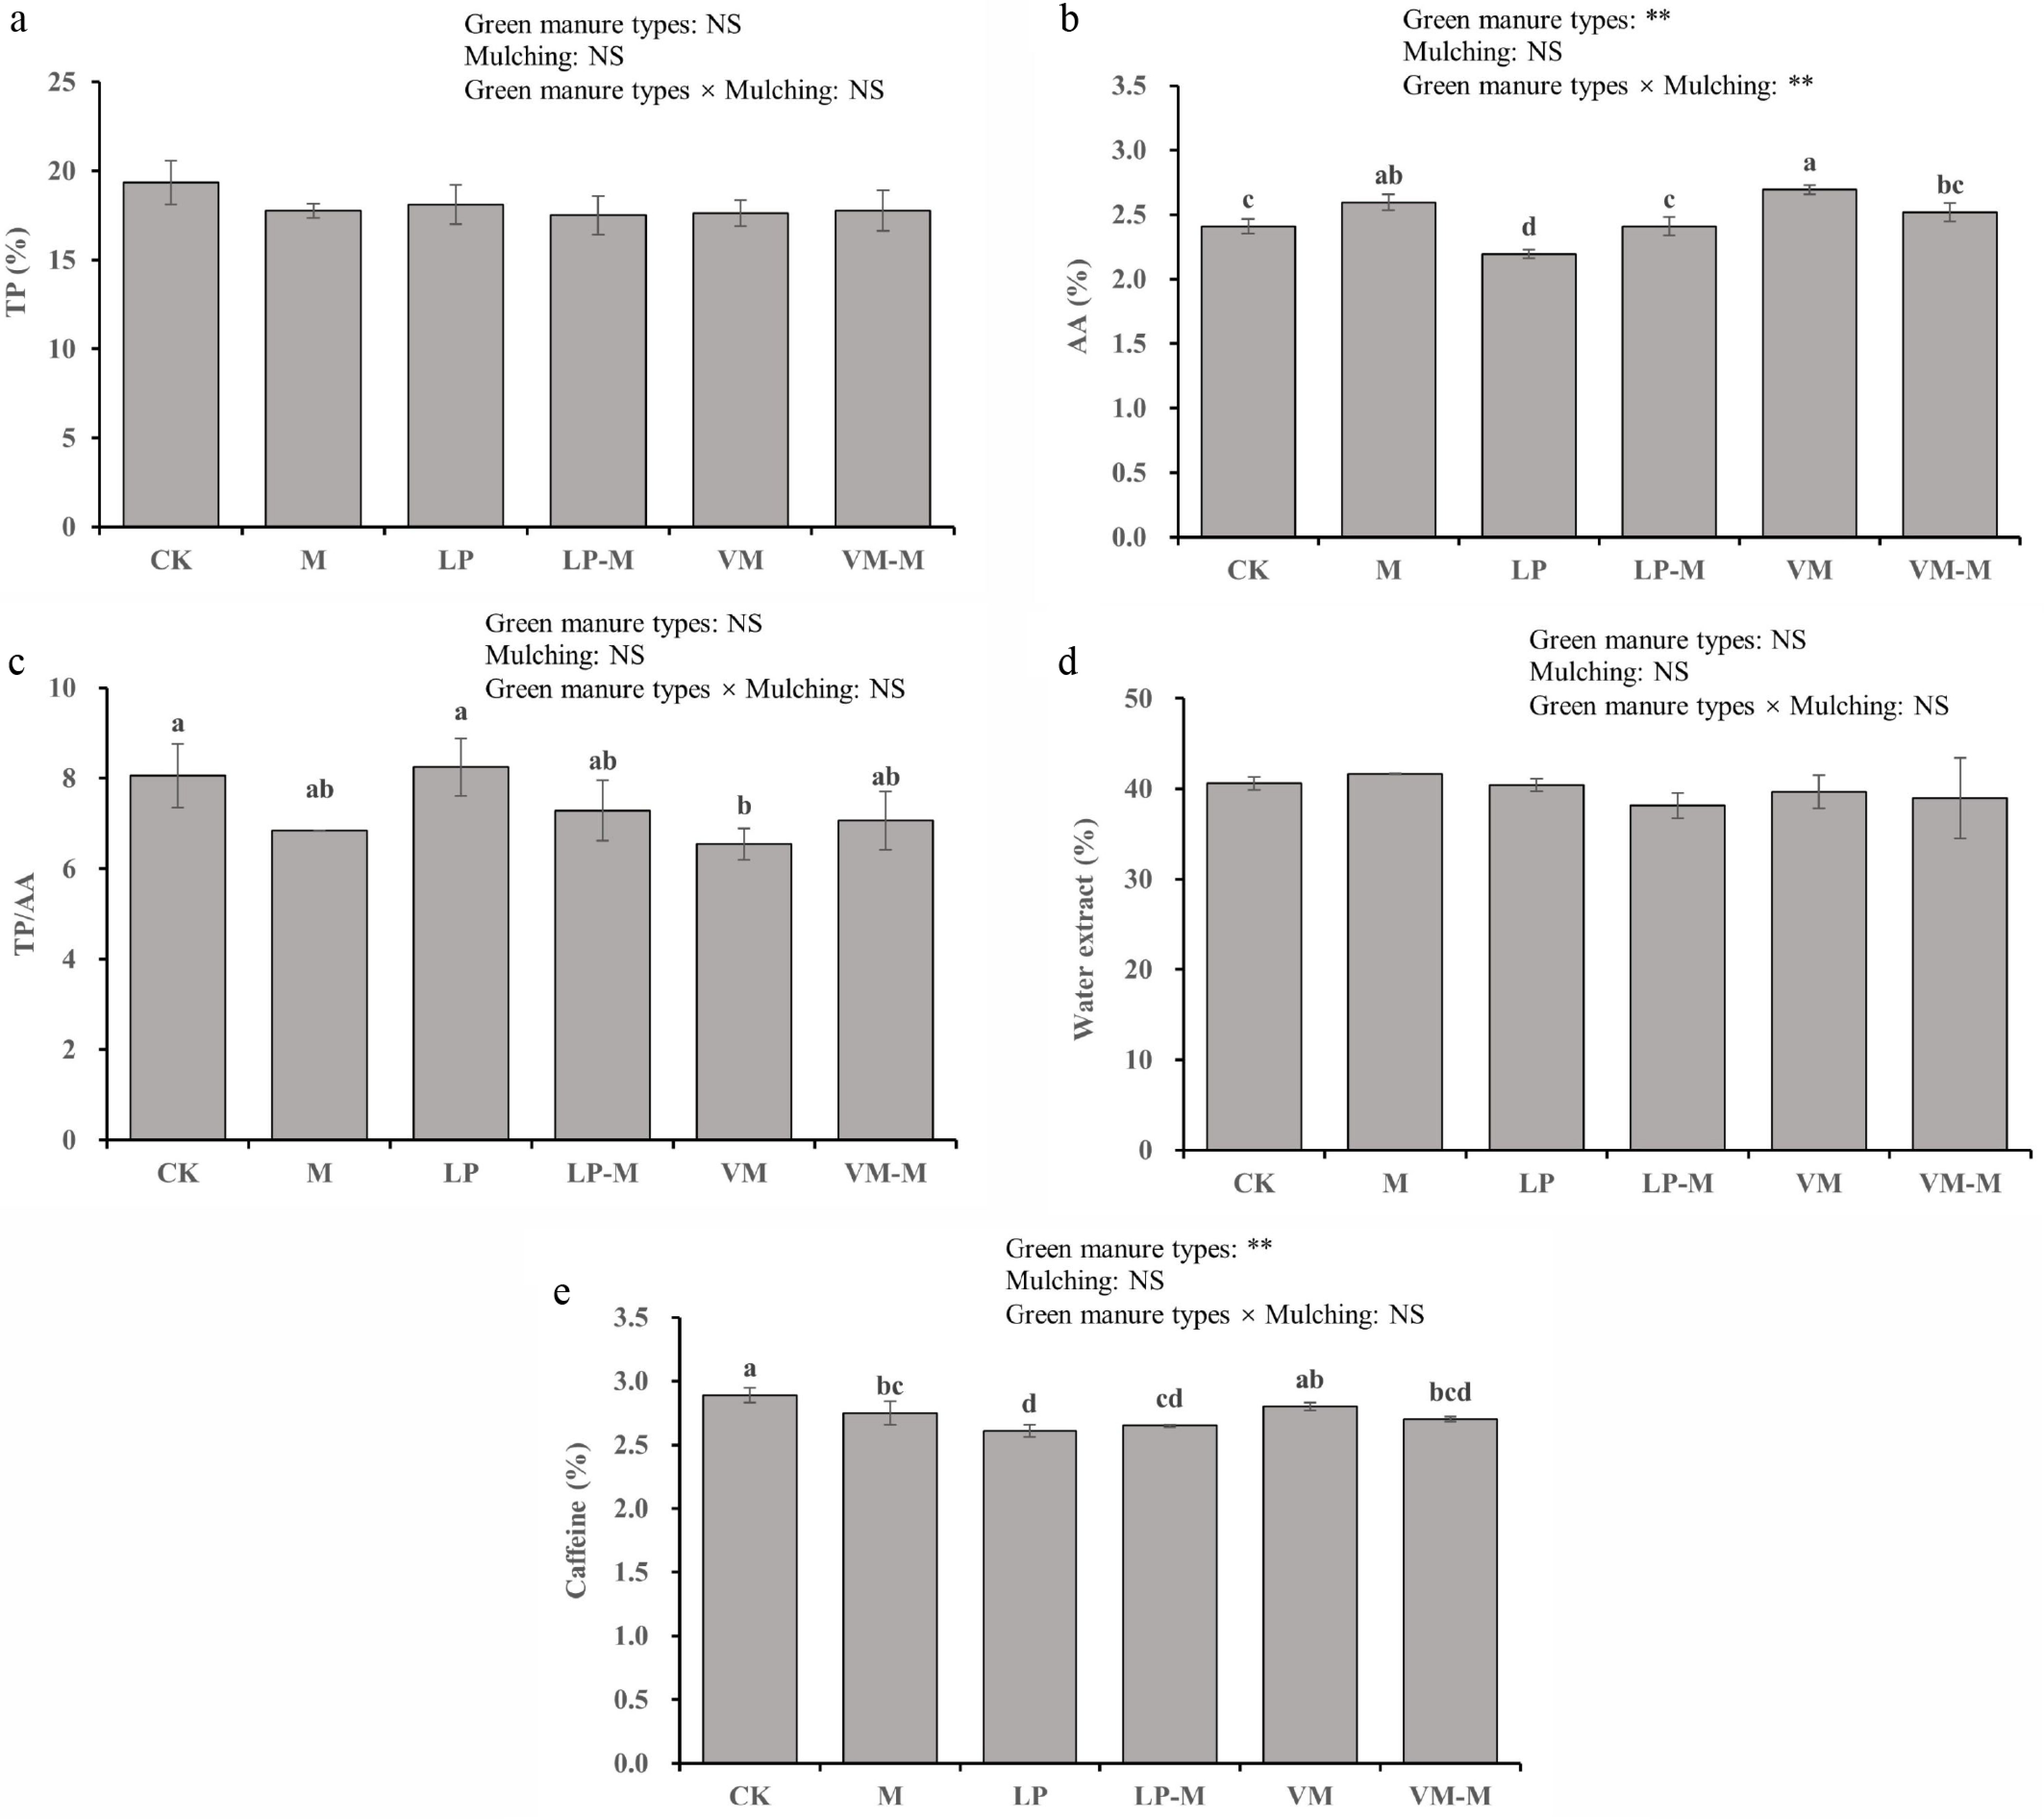
Figure 3.
Effects of different weed control treatments on the content of (a) AA, (b) TP, (c) water extract, (d) caffeine, and (e) ratio of TP/AA of tea shoots. Different letters in the same column indicate significant differences in one-way ANOVA among groups (p < 0.05). * Indicates significant differences in two-way ANOVA (** p < 0.01). CK, control; M, weed barrier fabric mulching; LP, L. perenne intercropping; LP-M, LP with mulching; VM, V. myuros intercropping; VM-M, VM with mulching; TP, total polyphenols; AA, free amino acids.
-
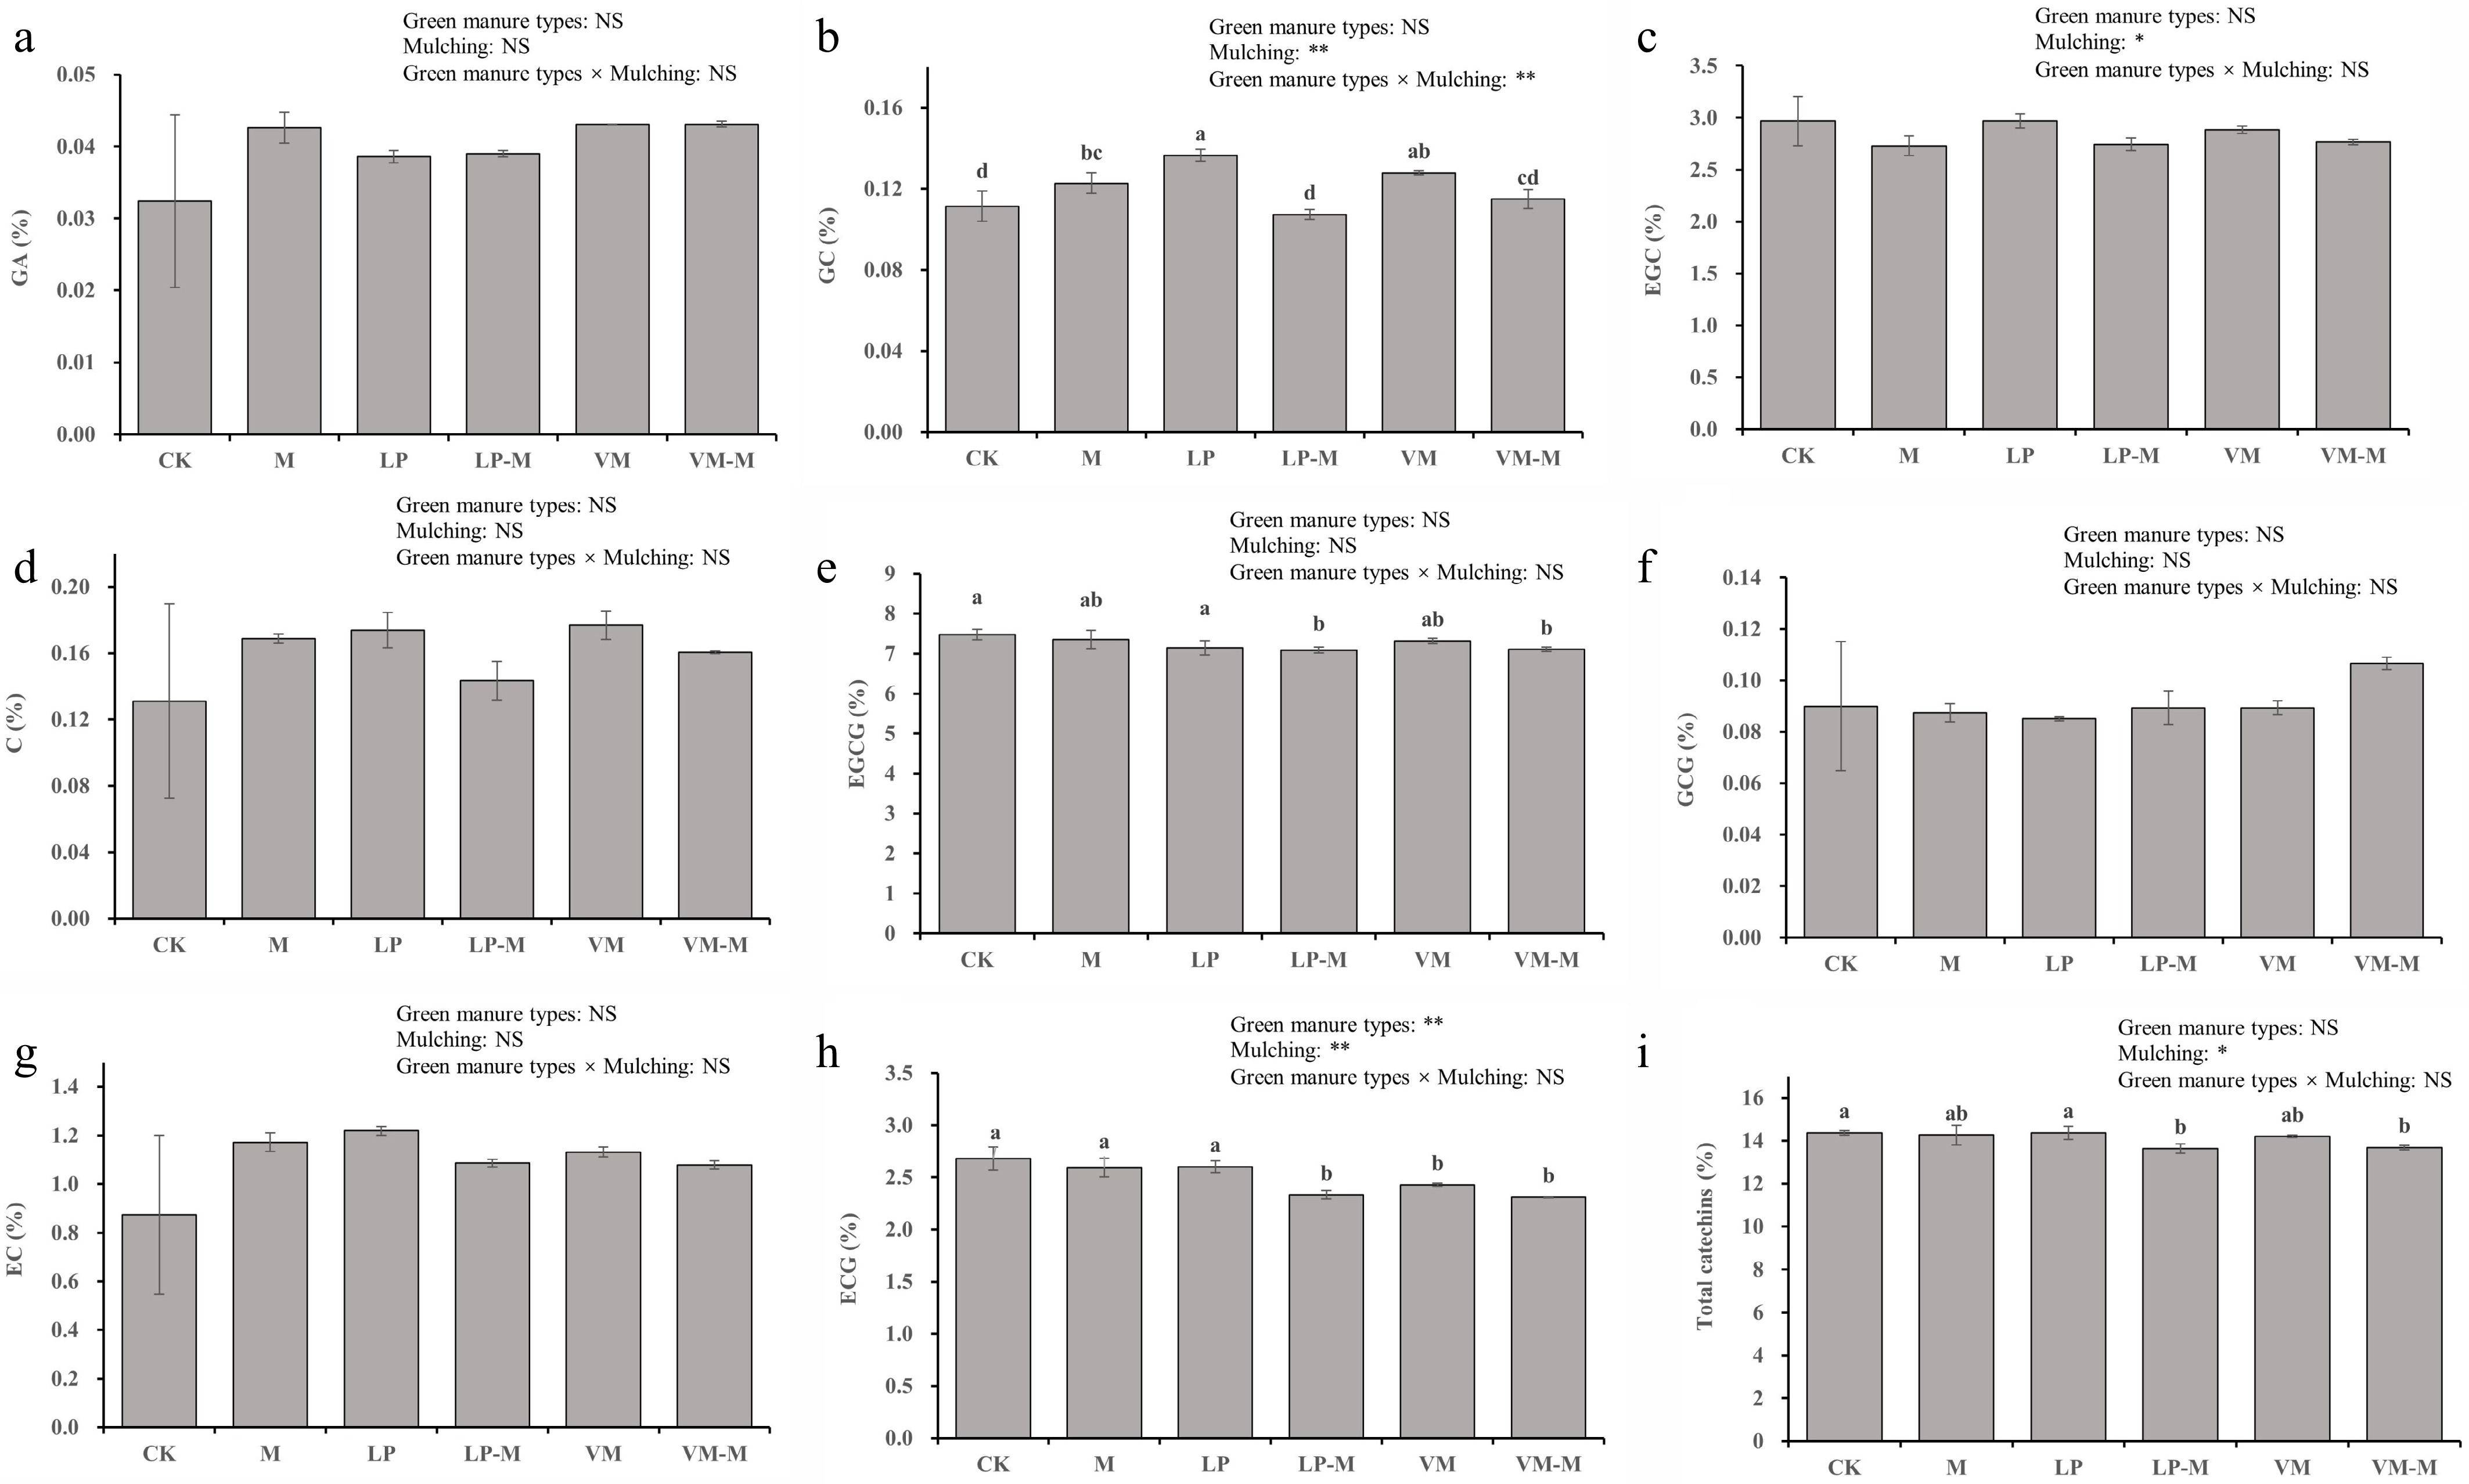
Figure 4.
Effects of different weed control treatments on the content of catechin components in tea shoots. Different letters in the same column indicate significant differences in one-way ANOVA among groups (p < 0.05). * Indicates significant differences in two-way ANOVA (* p < 0.05; ** p < 0.01). CK, control; M, weed barrier fabric mulching; LP, L. perenne intercropping; LP-M, LP with mulching; VM, V. myuros intercropping; VM-M, VM with mulching; GA, gallic acid; GC, gallocatechin; EGC, epigallocatechin; C, catechin; EGCG, epigallocatechin gallate; GCG, gallocatechin gallate; EC, epicatechin; ECG, epicatechin gallate.
-
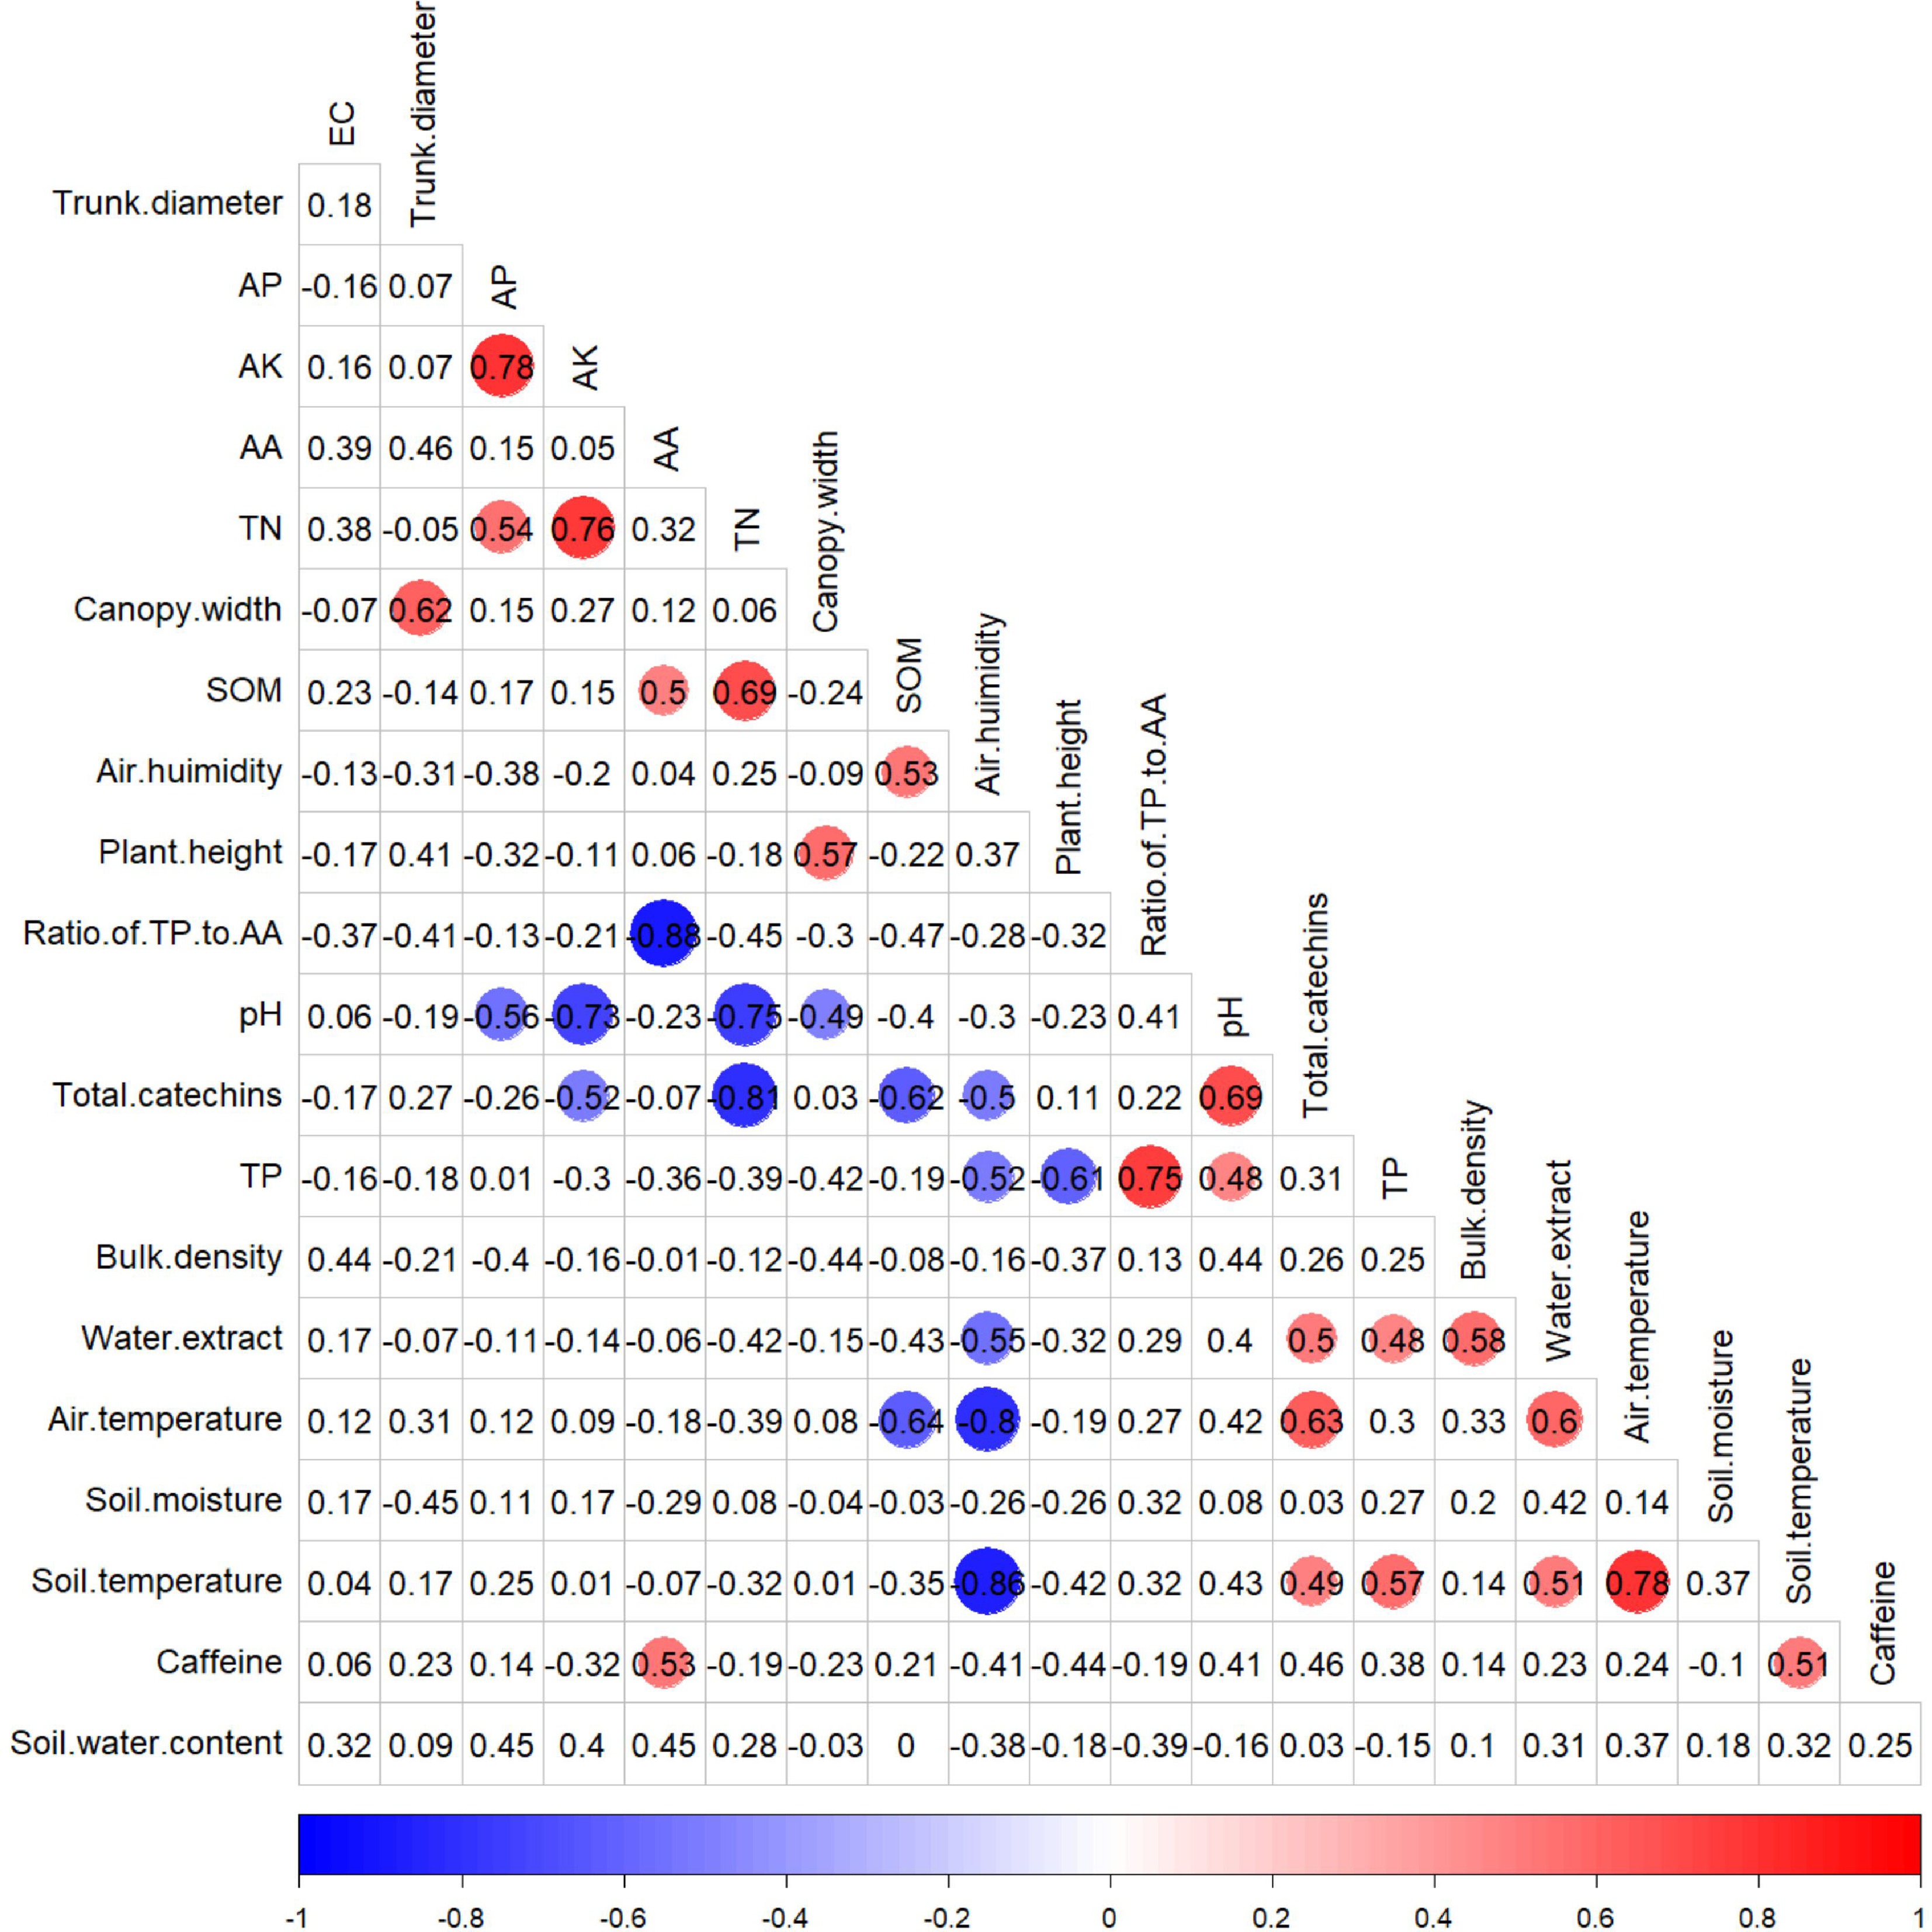
Figure 5.
Pearson correlation analysis of tea garden habitat, tea plant growth, soil physical and chemical properties, and tea quality under different intercropping treatments. More negative values (blue) indicate stronger negative correlations, and more positive values (red) indicate stronger positive correlations. The colored circle indicates statistical significance (p < 0.05).
-
Treatment Water content (%) Bulk density (g/cm3) pH EC (μS/cm) SOM (g/kg) TN (g/kg) AP (mg/kg) AK (mg/kg) CK 24.32 ± 1.31 b 1.38 ± 0.05 ab 5.27 ± 0.23 a 223.40 ± 0.46 c 15.74 ± 0.31 bc 1.35 ± 0.02 c 254.28 ± 8.30 b 457.4 ± 26.39 d M 26.25 ± 0.69 a 1.45 ± 0.06 a 4.94 ± 0.02 b 640.30 ± 1.47 b 14.53 ± 0.37 cd 1.61 ± 0.02 b 264.43 ± 12.96 b 624.77 ± 12.4 b LP 22.50 ± 0.83 c 1.40 ± 0.08 a 5.17 ± 0.08 a 199.80 ± 7.94 d 13.19 ± 0.31 d 1.17 ± 0.04 d 207.37 ± 14.57 c 446.87 ± 35.75 d LP-M 23.84 ± 1.28 bc 1.28 ± 0.03 b 4.51 ± 0.03 c 112.20 ± 5.38 e 16.76 ± 1.32 ab 1.92 ± 0.09 a 287.71 ± 16.83 a 682.53 ± 45.02 a VM 23.49 ± 1.83 bc 1.37 ± 0.08 ab 4.92 ± 0.03 b 226.23 ± 5.20 c 16.88 ± 1.39 ab 1.40 ± 0.09 c 226.74 ± 6.69 c 421.77 ± 9.52 d VM-M 22.63 ± 1.07 c 1.43 ± 0.16 a 4.92 ± 0.06 b 726.47 ± 24.06 a 18.20 ± 0.33 a 1.86 ± 0.01 a 221.47 ± 13.98 c 521.43 ± 13.48 c Two-way ANOVA (F-value) Green manure types 2.548 1.177 11.185** 1,131.804** 39.787** 37.855** 22.377** 107.468** Mulching 1.029 0.240 37.641** 2,205.230** 78.247** 1,530.065** 62.977** 708.081** Green manure types × mulching 0.553 0.226 8.735* 939.069** 58.513** 130.855** 42.724** 40.028** Different letters in the same column indicate significant differences in one-way ANOVA among groups (p < 0.05). * Indicates significant differences in two-way ANOVA (* p < 0.05; ** p < 0.01). CK, control; M, weed barrier fabric mulching; LP, L. perenne intercropping; LP-M, LP with mulching; VM, V. myuros intercropping; VM-M, VM with mulching; EC, electrical conductivity; SOM, soil organic matter; TN, total nitrogen; AP, available phosphorus; AK, available potassium. Table 1.
Influence of different weed control treatments on soil physicochemical parameters in tea gardens.
-
Treatment Material input Labor input Hay output Total input Net input Net input reduction Weed barrier
fabricGrass seed
costCovering and
planting costTotal cost of
manual weedingCK − − − 30,000 − 30,000 30,000 M 14,000 − 3,000 3,000 − 20,000 20,000 10,000 LP − 2,250 3,000 7,500 17,700 12,800 −4,900 34,900 LP-M 9,333 2,250 3,000 7,500 17,700 22,100 4,400 25,600 VM − 9,000 3,000 6,000 − 18,000 18,000 12,000 VM-M 9,333 9,000 3,000 6,000 − 27,333 27,333 2,700 '−' represents the absence of this item. Net input = total input – hay output; net input reduction was calculated as the absolute value relative to that of CK. CK, control; M, weed barrier fabric mulching; LP, L. perenne intercropping; LP-M, LP with mulching; VM, V. myuros intercropping; VM-M, VM with mulching. Table 2.
Economic benefit analysis under different weed control treatments (CNY/ha).
Figures
(5)
Tables
(2)