-
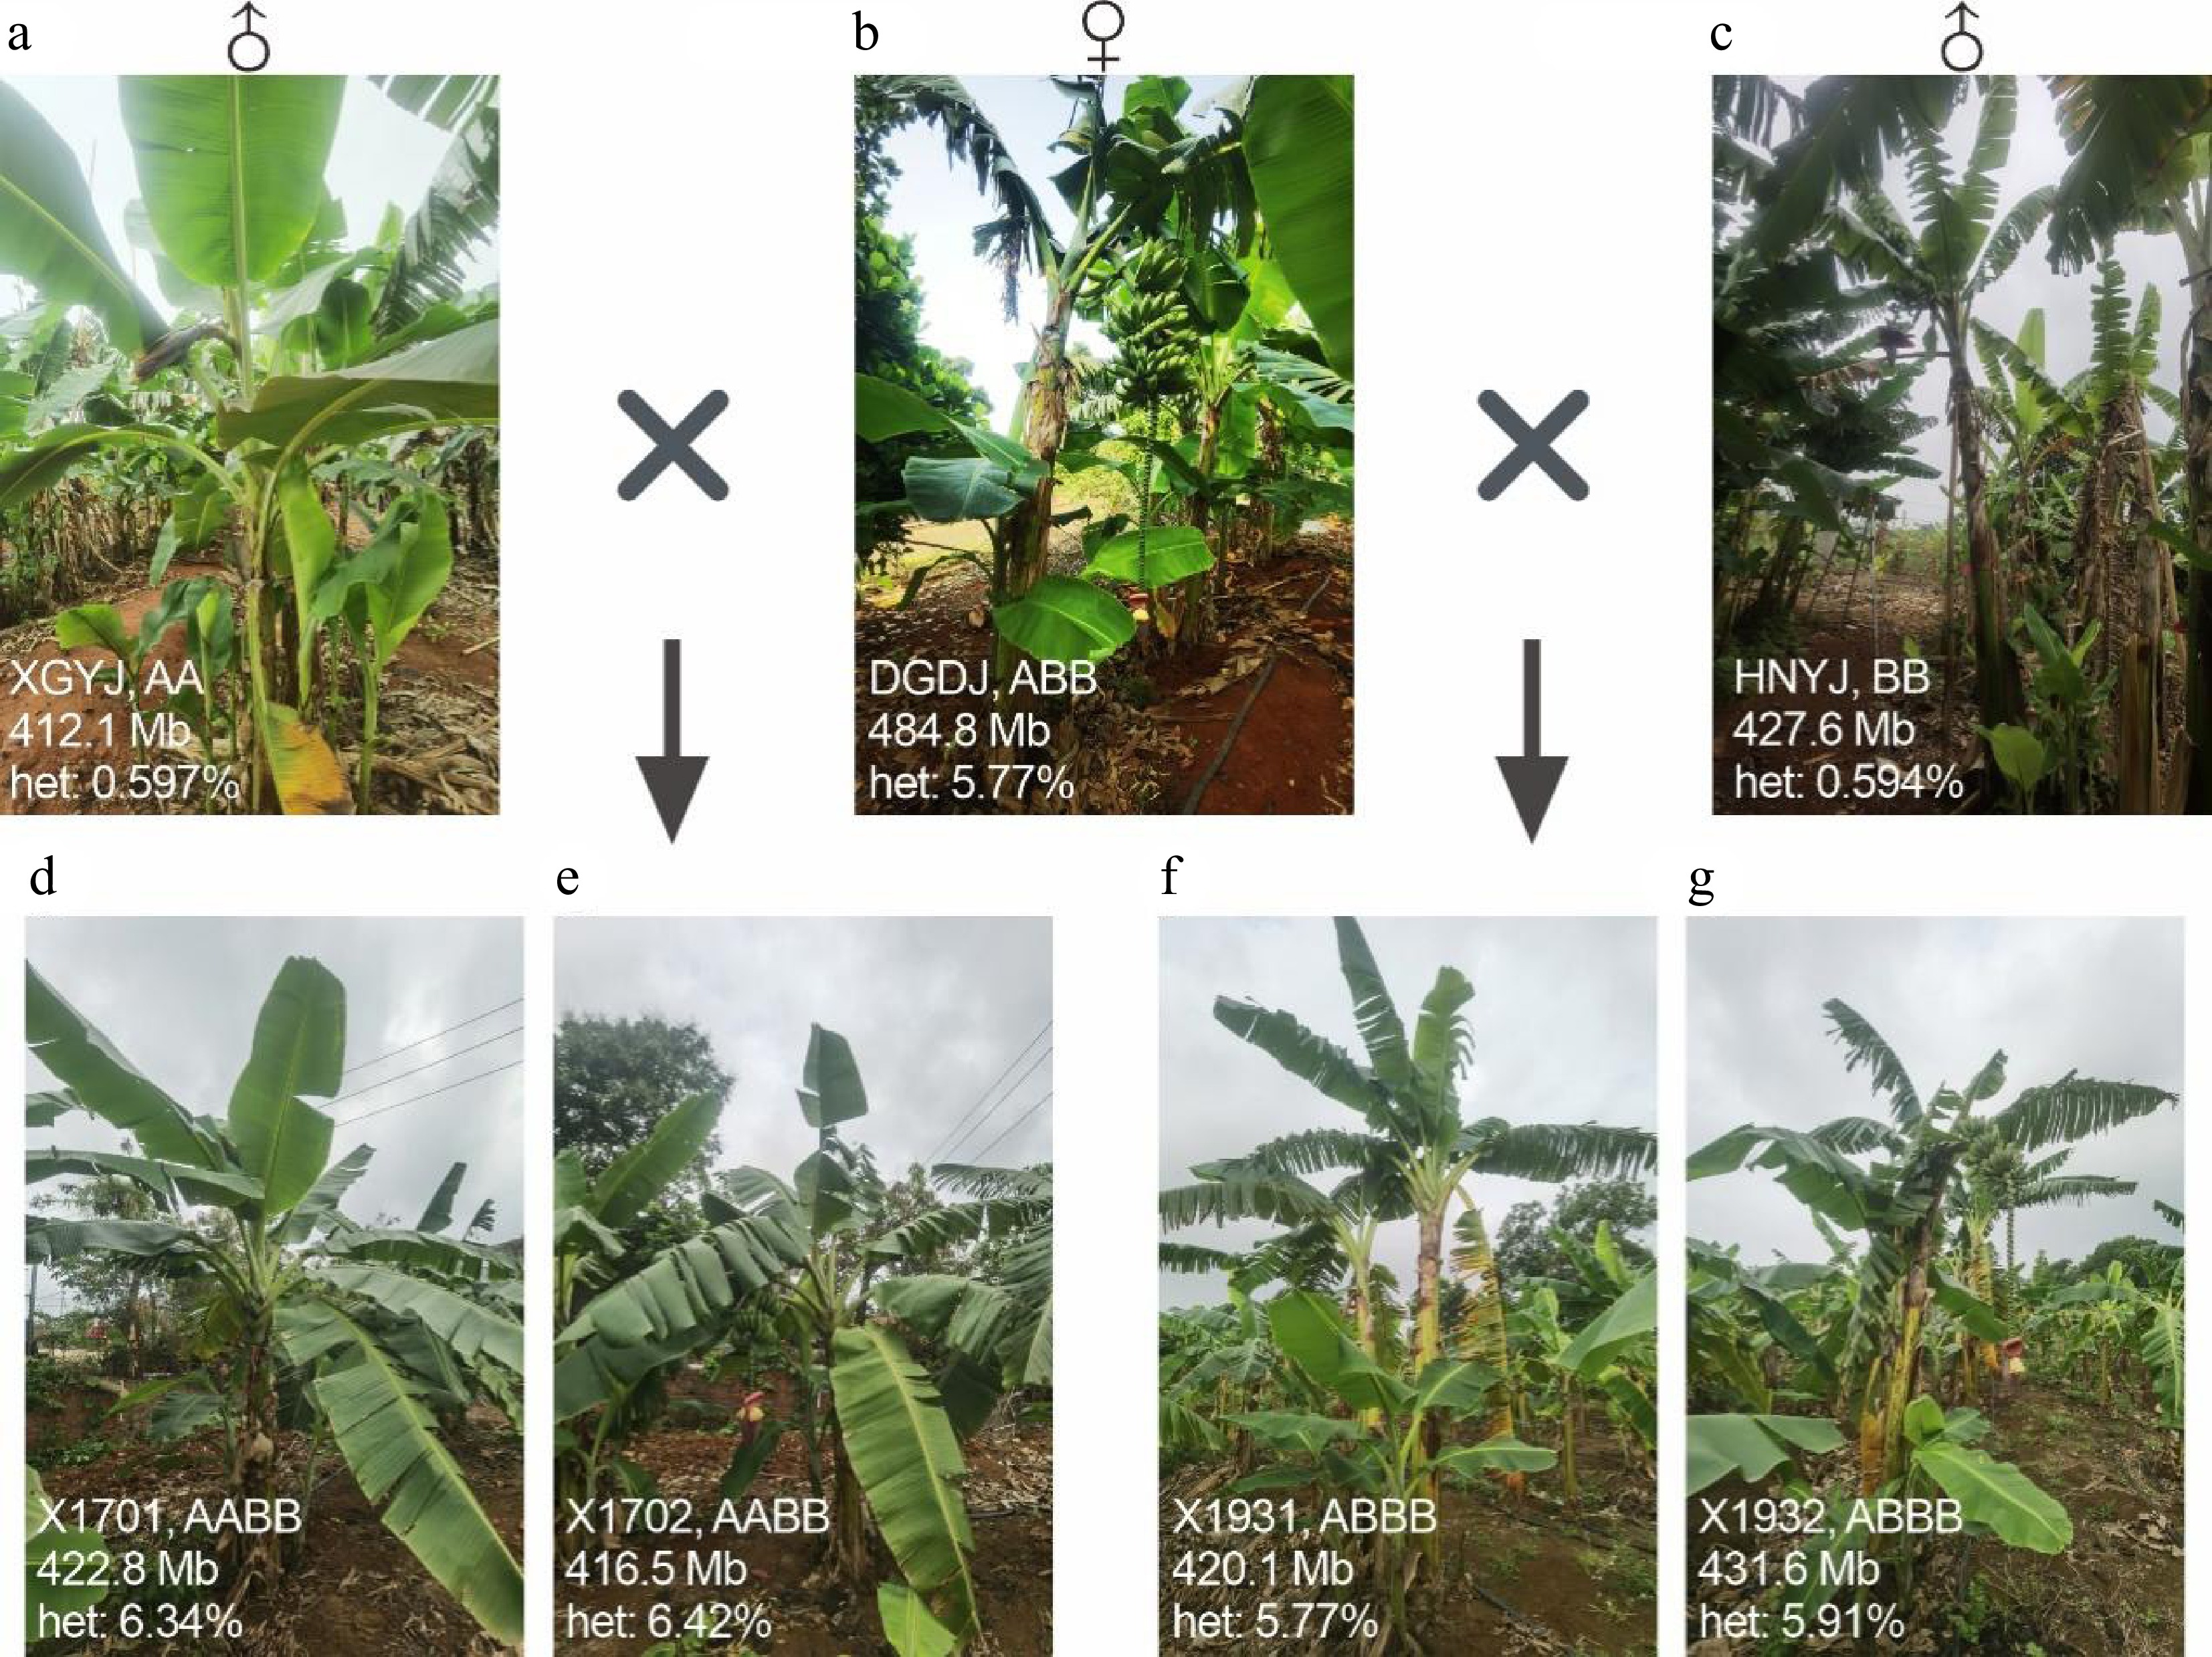
Figure 1.
Assessment genome size and heterozygosity of the parental lines and hybrid progeny. Panels (a)–(c) show the parental lines of the two hybrid combinations, whereas (d)–(g) show the hybrid progeny. X1701 and X1702 were derived from the cross DGDJ × XGYJ; X1931 and X1932 were derived from the cross DGDJ × HNYJ. The genome size and heterozygosity level shown in each panel were estimated using GenomeScope2. The ploidy parameter was set to p = 2 for XGYJ and HNYJ, p = 3 for DGDJ, and p = 4 for all hybrid progeny. The estimated genome size represents the haploid genome size.
-
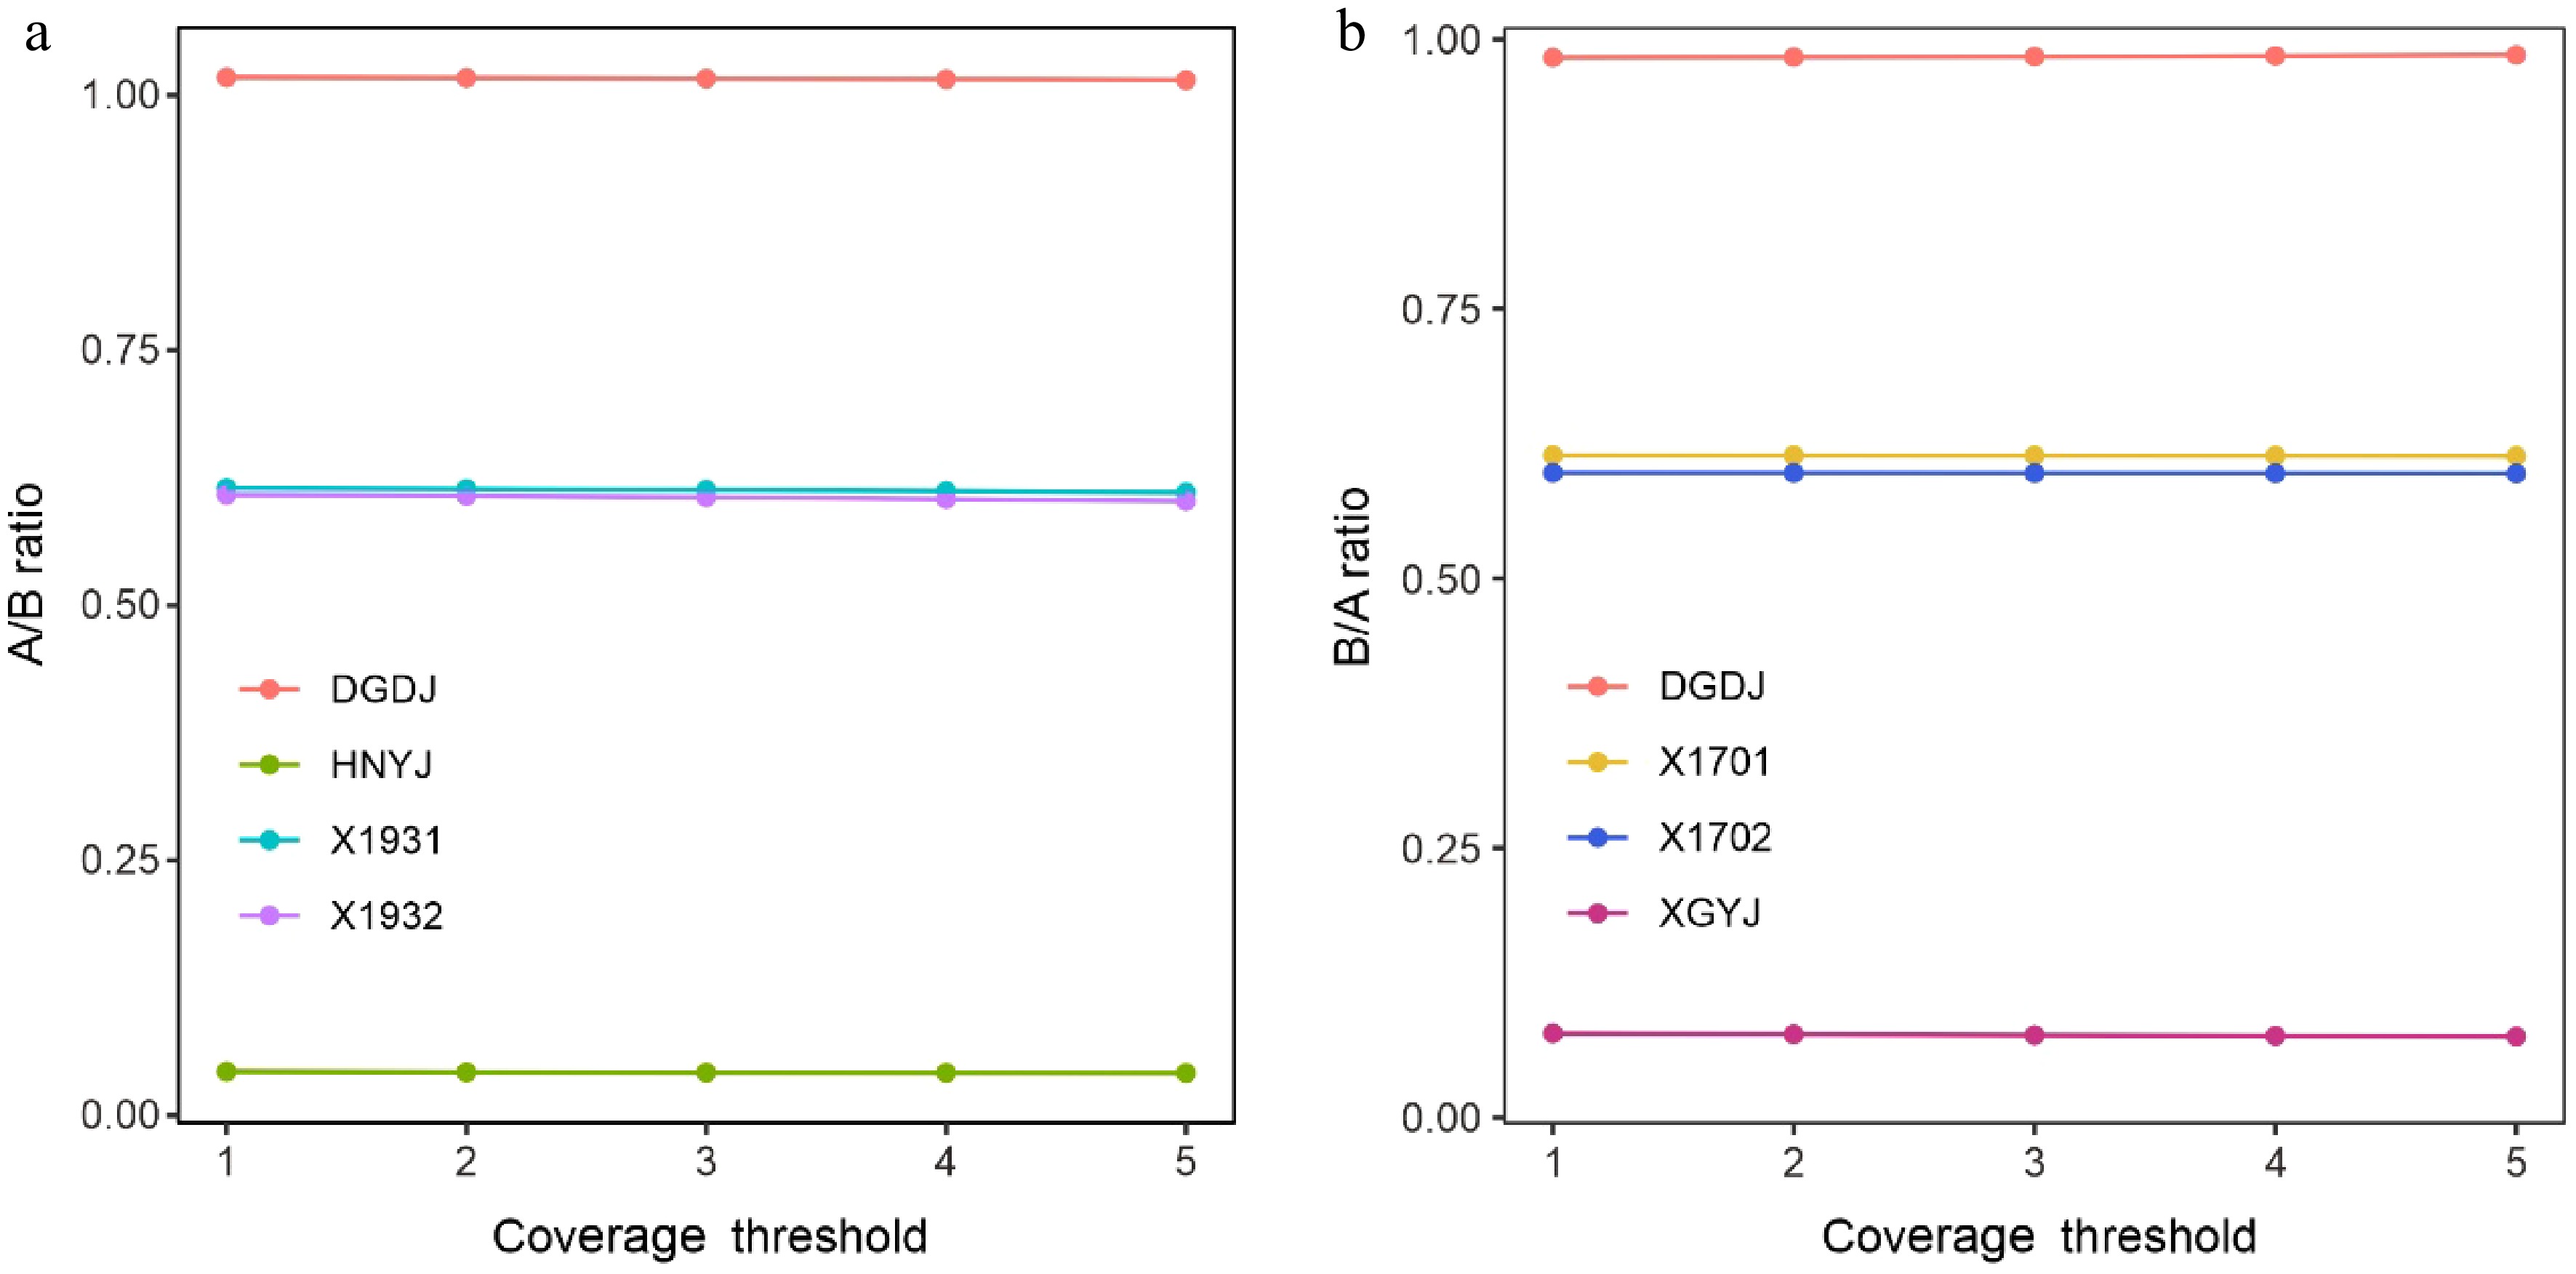
Figure 2.
Genotypic evaluation of parental lines and hybrid progeny. HiFi sequencing reads were aligned to the published reference (A + B) genomes, and the ratio of bases mapped to the A and B genomes was calculated for each parent and hybrid offspring. Panel (a) represents the hybrid combination between DGDJ and HNYJ, whereas (b) represents the hybrid combination between DGDJ and XGYJ.
-
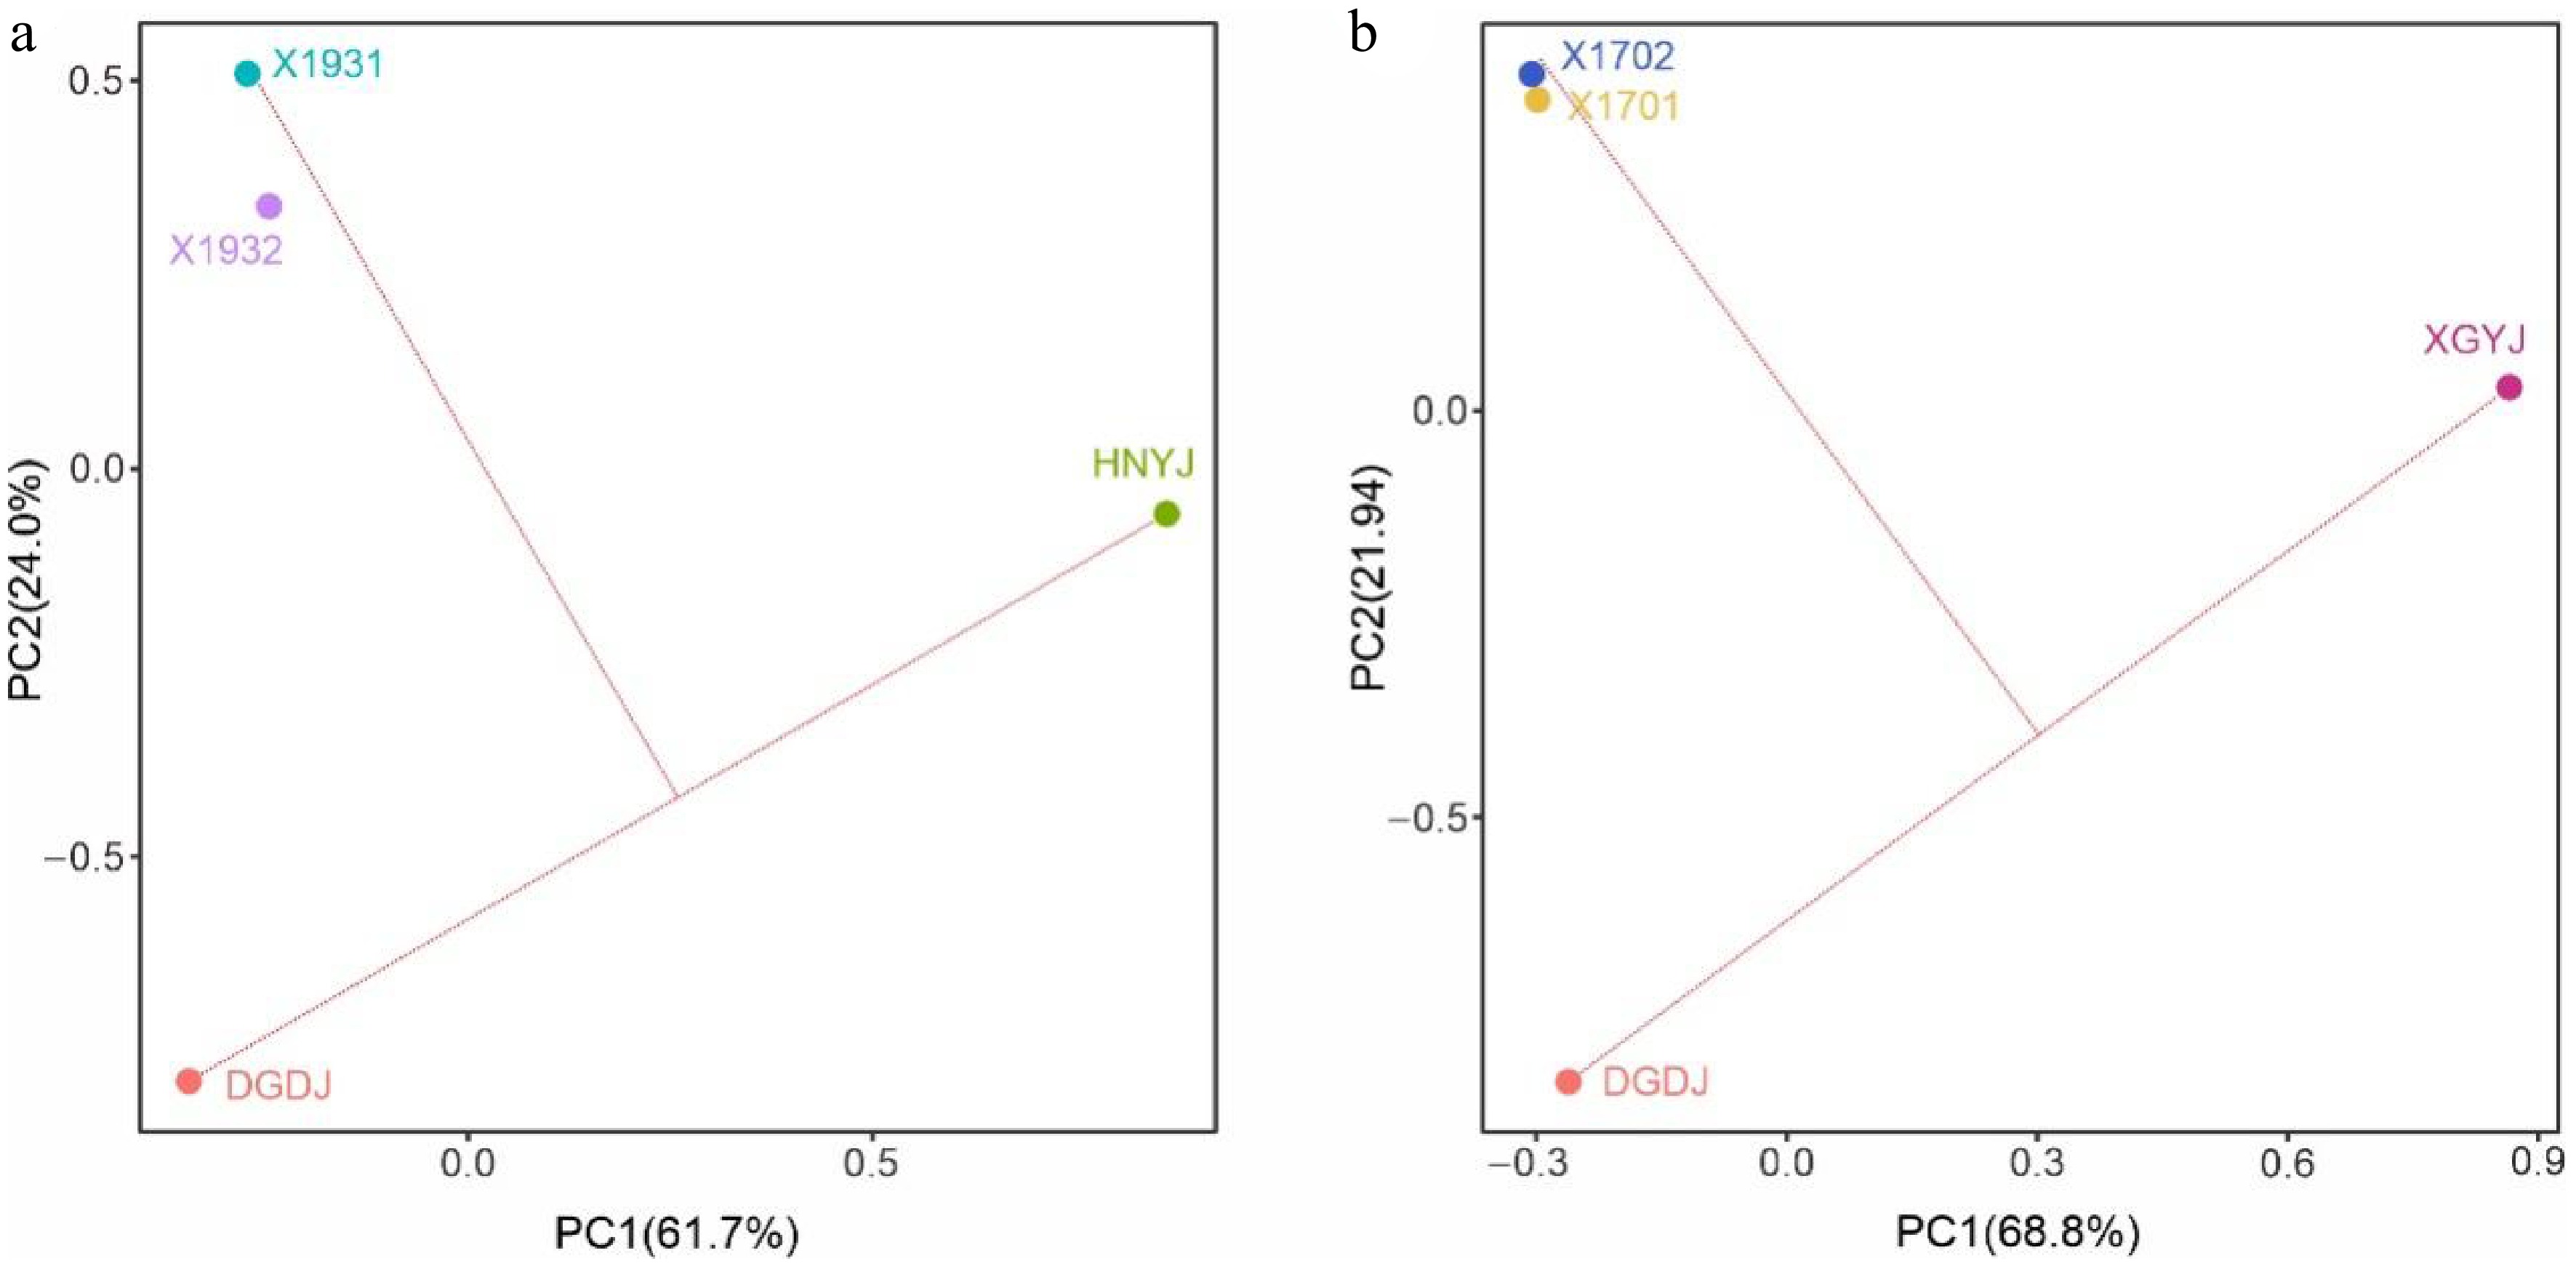
Figure 3.
Principal component analysis of k-mers from the parental lines and hybrid progeny. (a) PCA plot for the HNYJ × DGDJ cross. PC1 and PC2 explain 61.7% and 24.0% of the variance, respectively. The hybrid progeny X1931 and X1932 also cluster between the maternal and paternal parents. (b) PCA plot for the XGYJ × DGDJ cross. PC1 and PC2 explain 68.8% and 21.9% of the total variance, respectively. The hybrid progeny X1701 and X1702 are located near the perpendicular bisector between the two parents, confirming their status as true hybrids. In both crosses, the progeny and the maternal parent DGDJ cluster on the left side of PC1, indicating closer genetic affinity to the maternal parent.
-
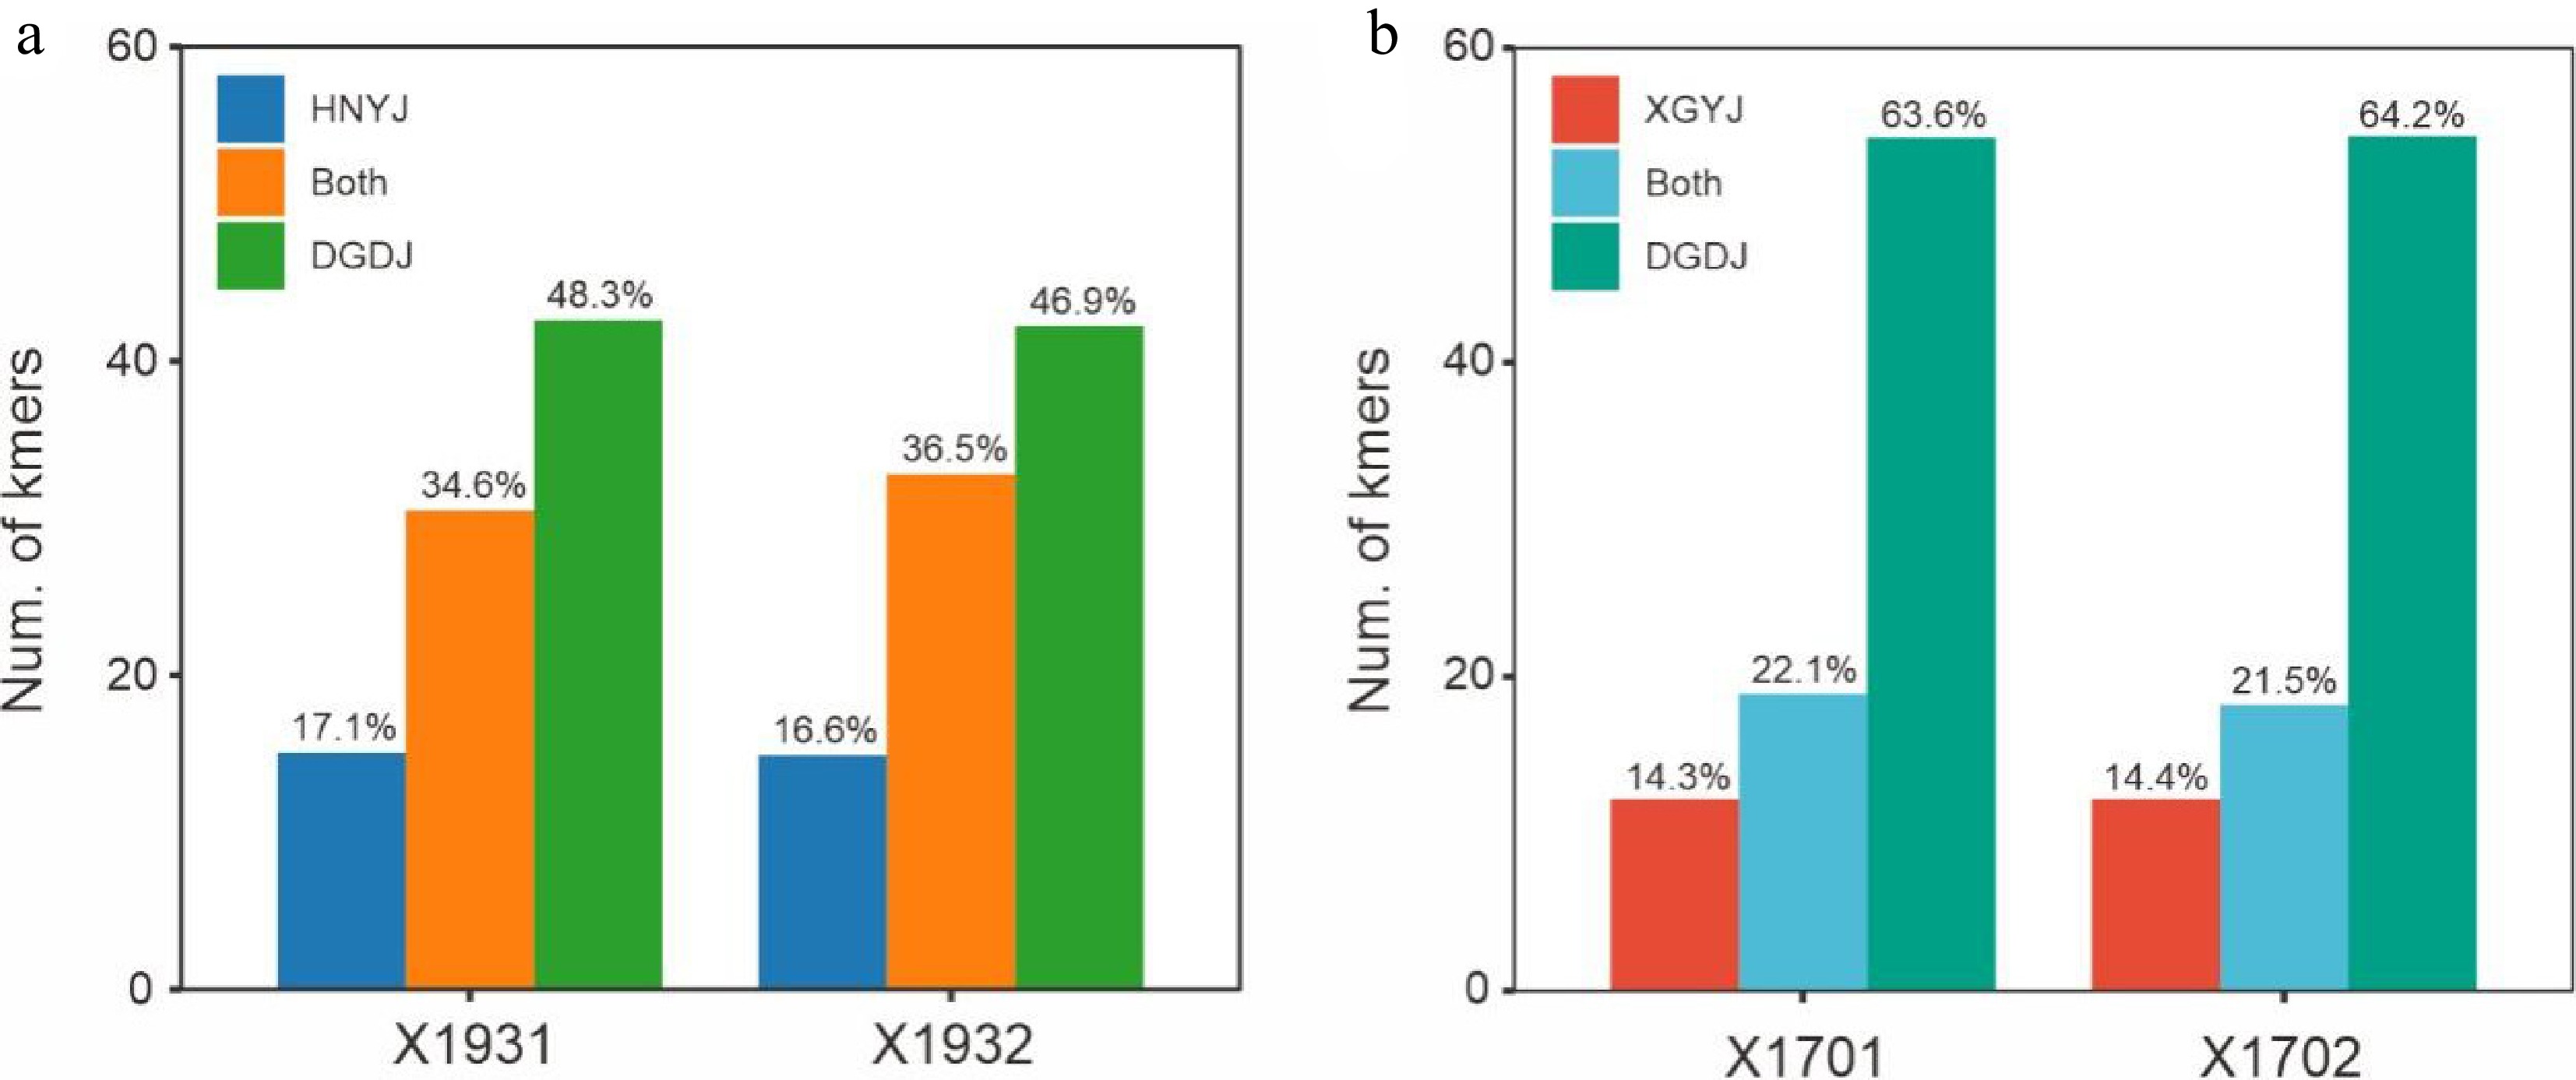
Figure 4.
Analysis of genetic inheritance in hybrid progeny. (a) Proportional composition of k-mers in X1931 and X1932, classified as paternal-specific (derived from HNYJ, steel blue), maternal-specific (derived from DGDJ, green), or shared (orange). (b) Proportional composition of k-mers in X1701 and X1702. The k-mers are classified as paternal-specific (derived from XGYJ, red), maternal-specific (derived from DGDJ, green), or shared (cyan). In all progeny, maternal-specific k-mers account for the largest proportion (> 48%), and the proportion of inherited paternal k-mers ranges from 14.3% to 17.1%, consistent with a 3n (maternal) × n (paternal) inheritance model.
-
Sample A (%) B (%) S (%) T (%) DGDJ 38.39 43.23 14.84 3.54 HNYJ 2.49 90.76 3.04 3.71 X1701 51.31 32.61 13.01 3.07 X1702 52.04 32.53 12.86 2.58 X1931 29.06 56.54 11.63 2.76 X1932 28.78 56.62 11.71 2.88 XGYJ 78.44 3.19 15.24 3.14 Values represent the percentage of bases mapped to each subgenome (A, B, S, T) relative to the total mapped bases for each sample. The T genome contributed less than 4% in all samples. Table 1.
Genotypic proportions of each genome (%).
-
Genome num_seqs sum_len min_len avg_len max_len DGDJ 14,553 1,947,668,911 7,441 133,832.80 43,112,517 HNYJ 3,863 851,980,049 9,267 220,548.80 27,489,044 XGYJ 8,421 1,117,300,856 8,451 132,680.30 23,313,597 X1701 2,536 1,964,185,925 11,558 774,521.30 41,161,095 X1702 2,428 1,964,474,777 9,408 809,091.80 36,305,017 X1931 5,951 2,005,365,046 12,654 336,979.50 47,283,826 X1932 4,711 1,982,262,728 11,611 420,773.20 25,176,664 Table 2.
Genome statistics of parent and hybrids.
Figures
(4)
Tables
(2)