-
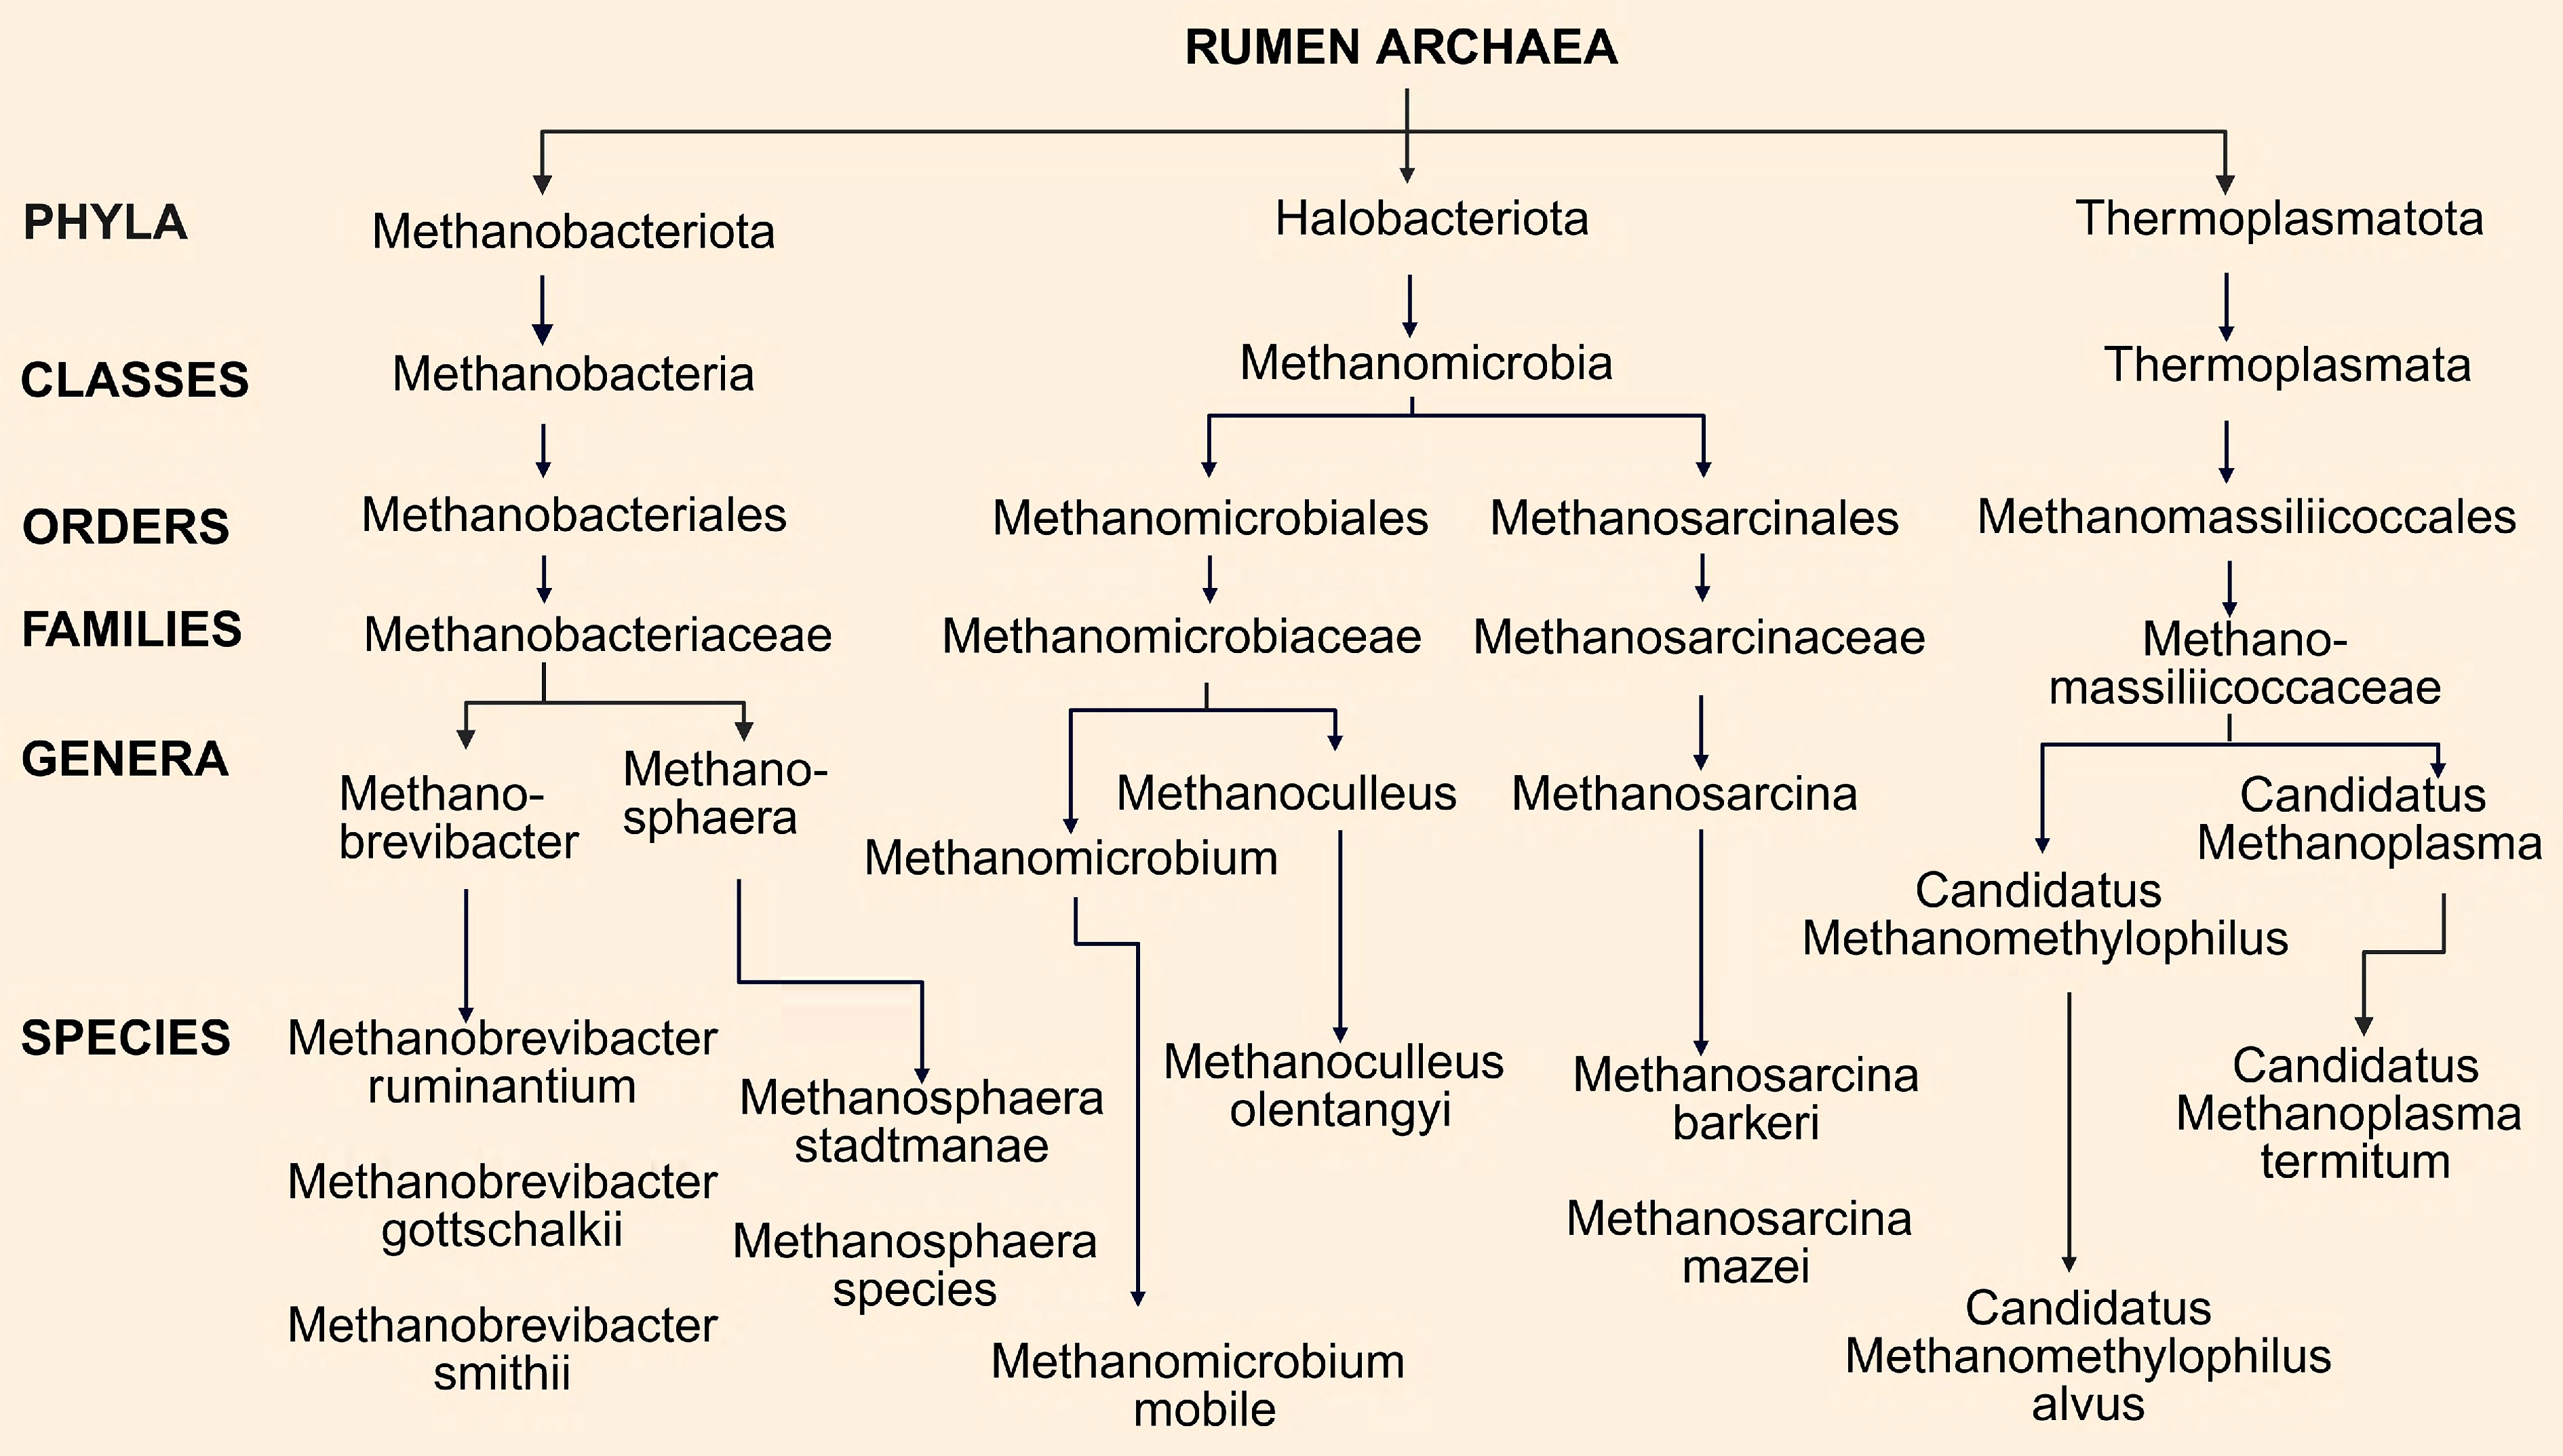
Figure 1.
Classification of methanogenic archaea.
-
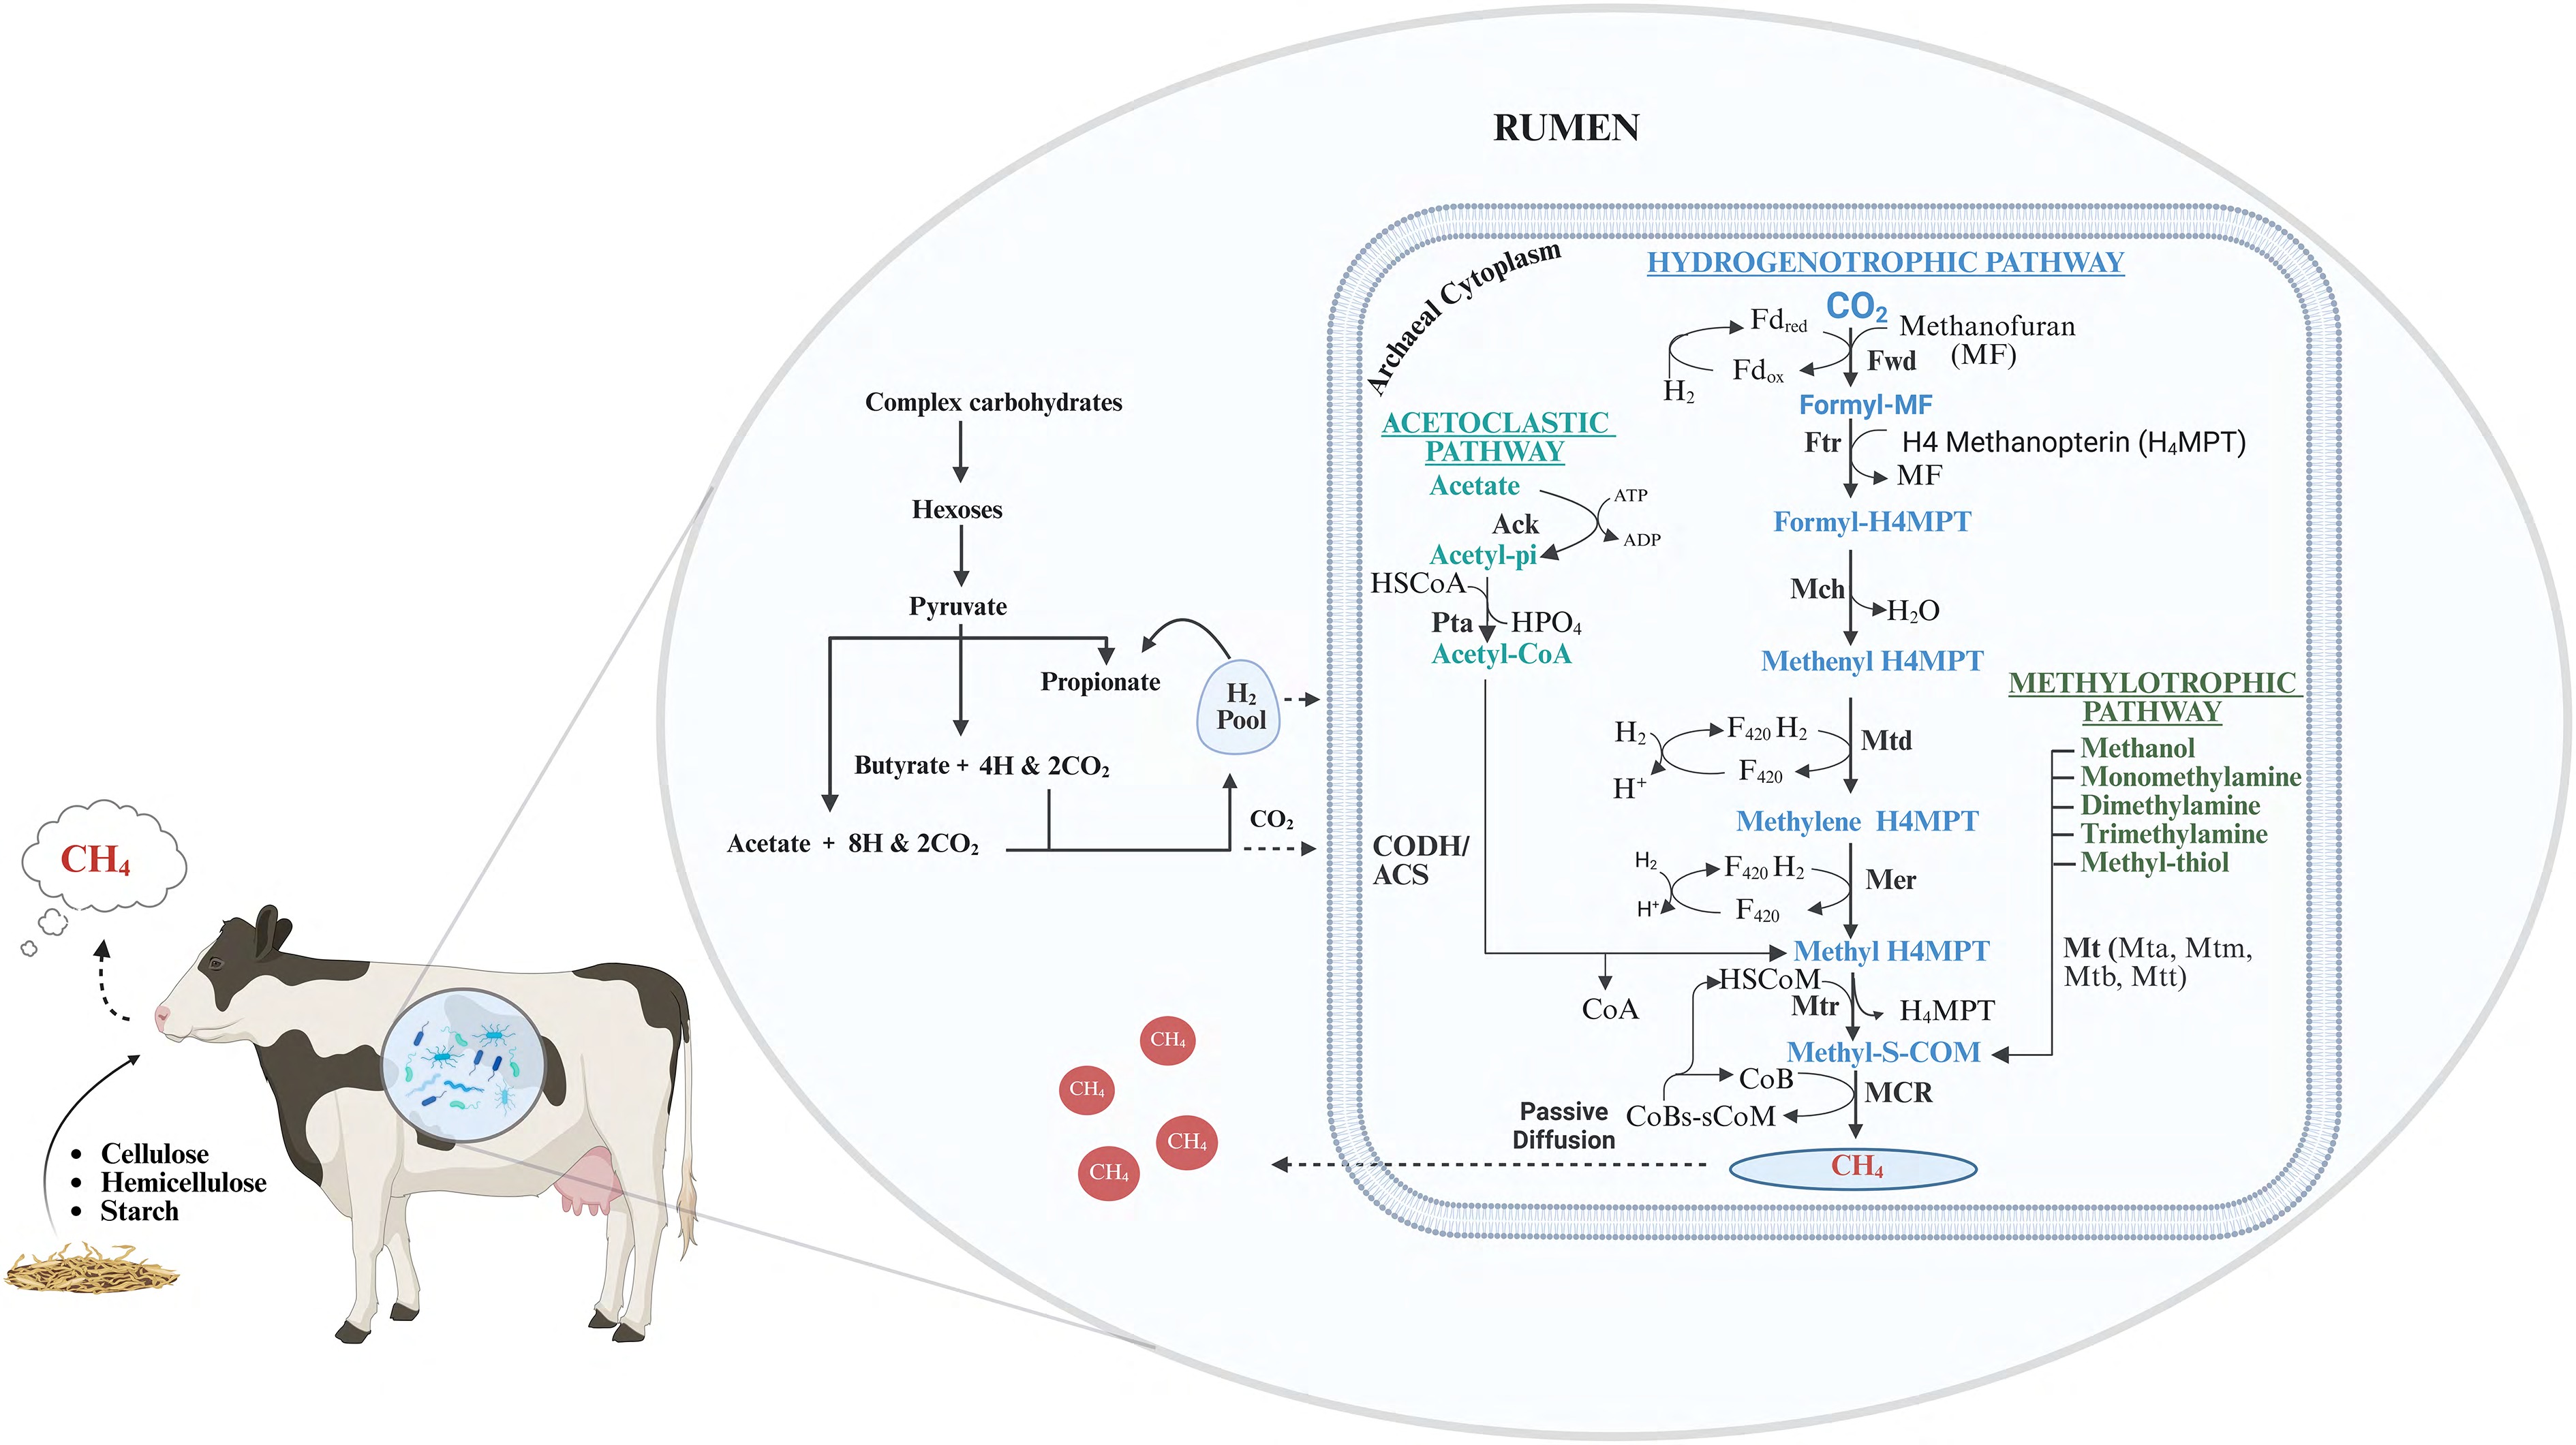
Figure 2.
Major biochemical pathways involved in the rumen methanogenesis (adapted from reference[20]). Abbreviations: Ack, acetate kinase; ACS, acetyl-CoA synthase; ATP, adenosine triphosphate; CH4, methane; CODH, carbon monoxide dehydrogenase; CoA, coenzyme A; CoB, coenzyme B; F430, cofactor F430; Fd, ferredoxin; Ftr, formyltransferase; H4MPT, tetrahydromethanopterin; Mer, methylene-H4MPT reductase; MF, methanofuran; Mch, methenyl-H4MPT cyclohydrolase; Mtd, methylene-H4MPT dehydrogenase; Mtr, methyl-H4MPT:coenzyme M methyltransferase; Mt (Mta, Mtm, Mtb, Mtt), methyltransferases; Pta, phosphotransacetylase.
-
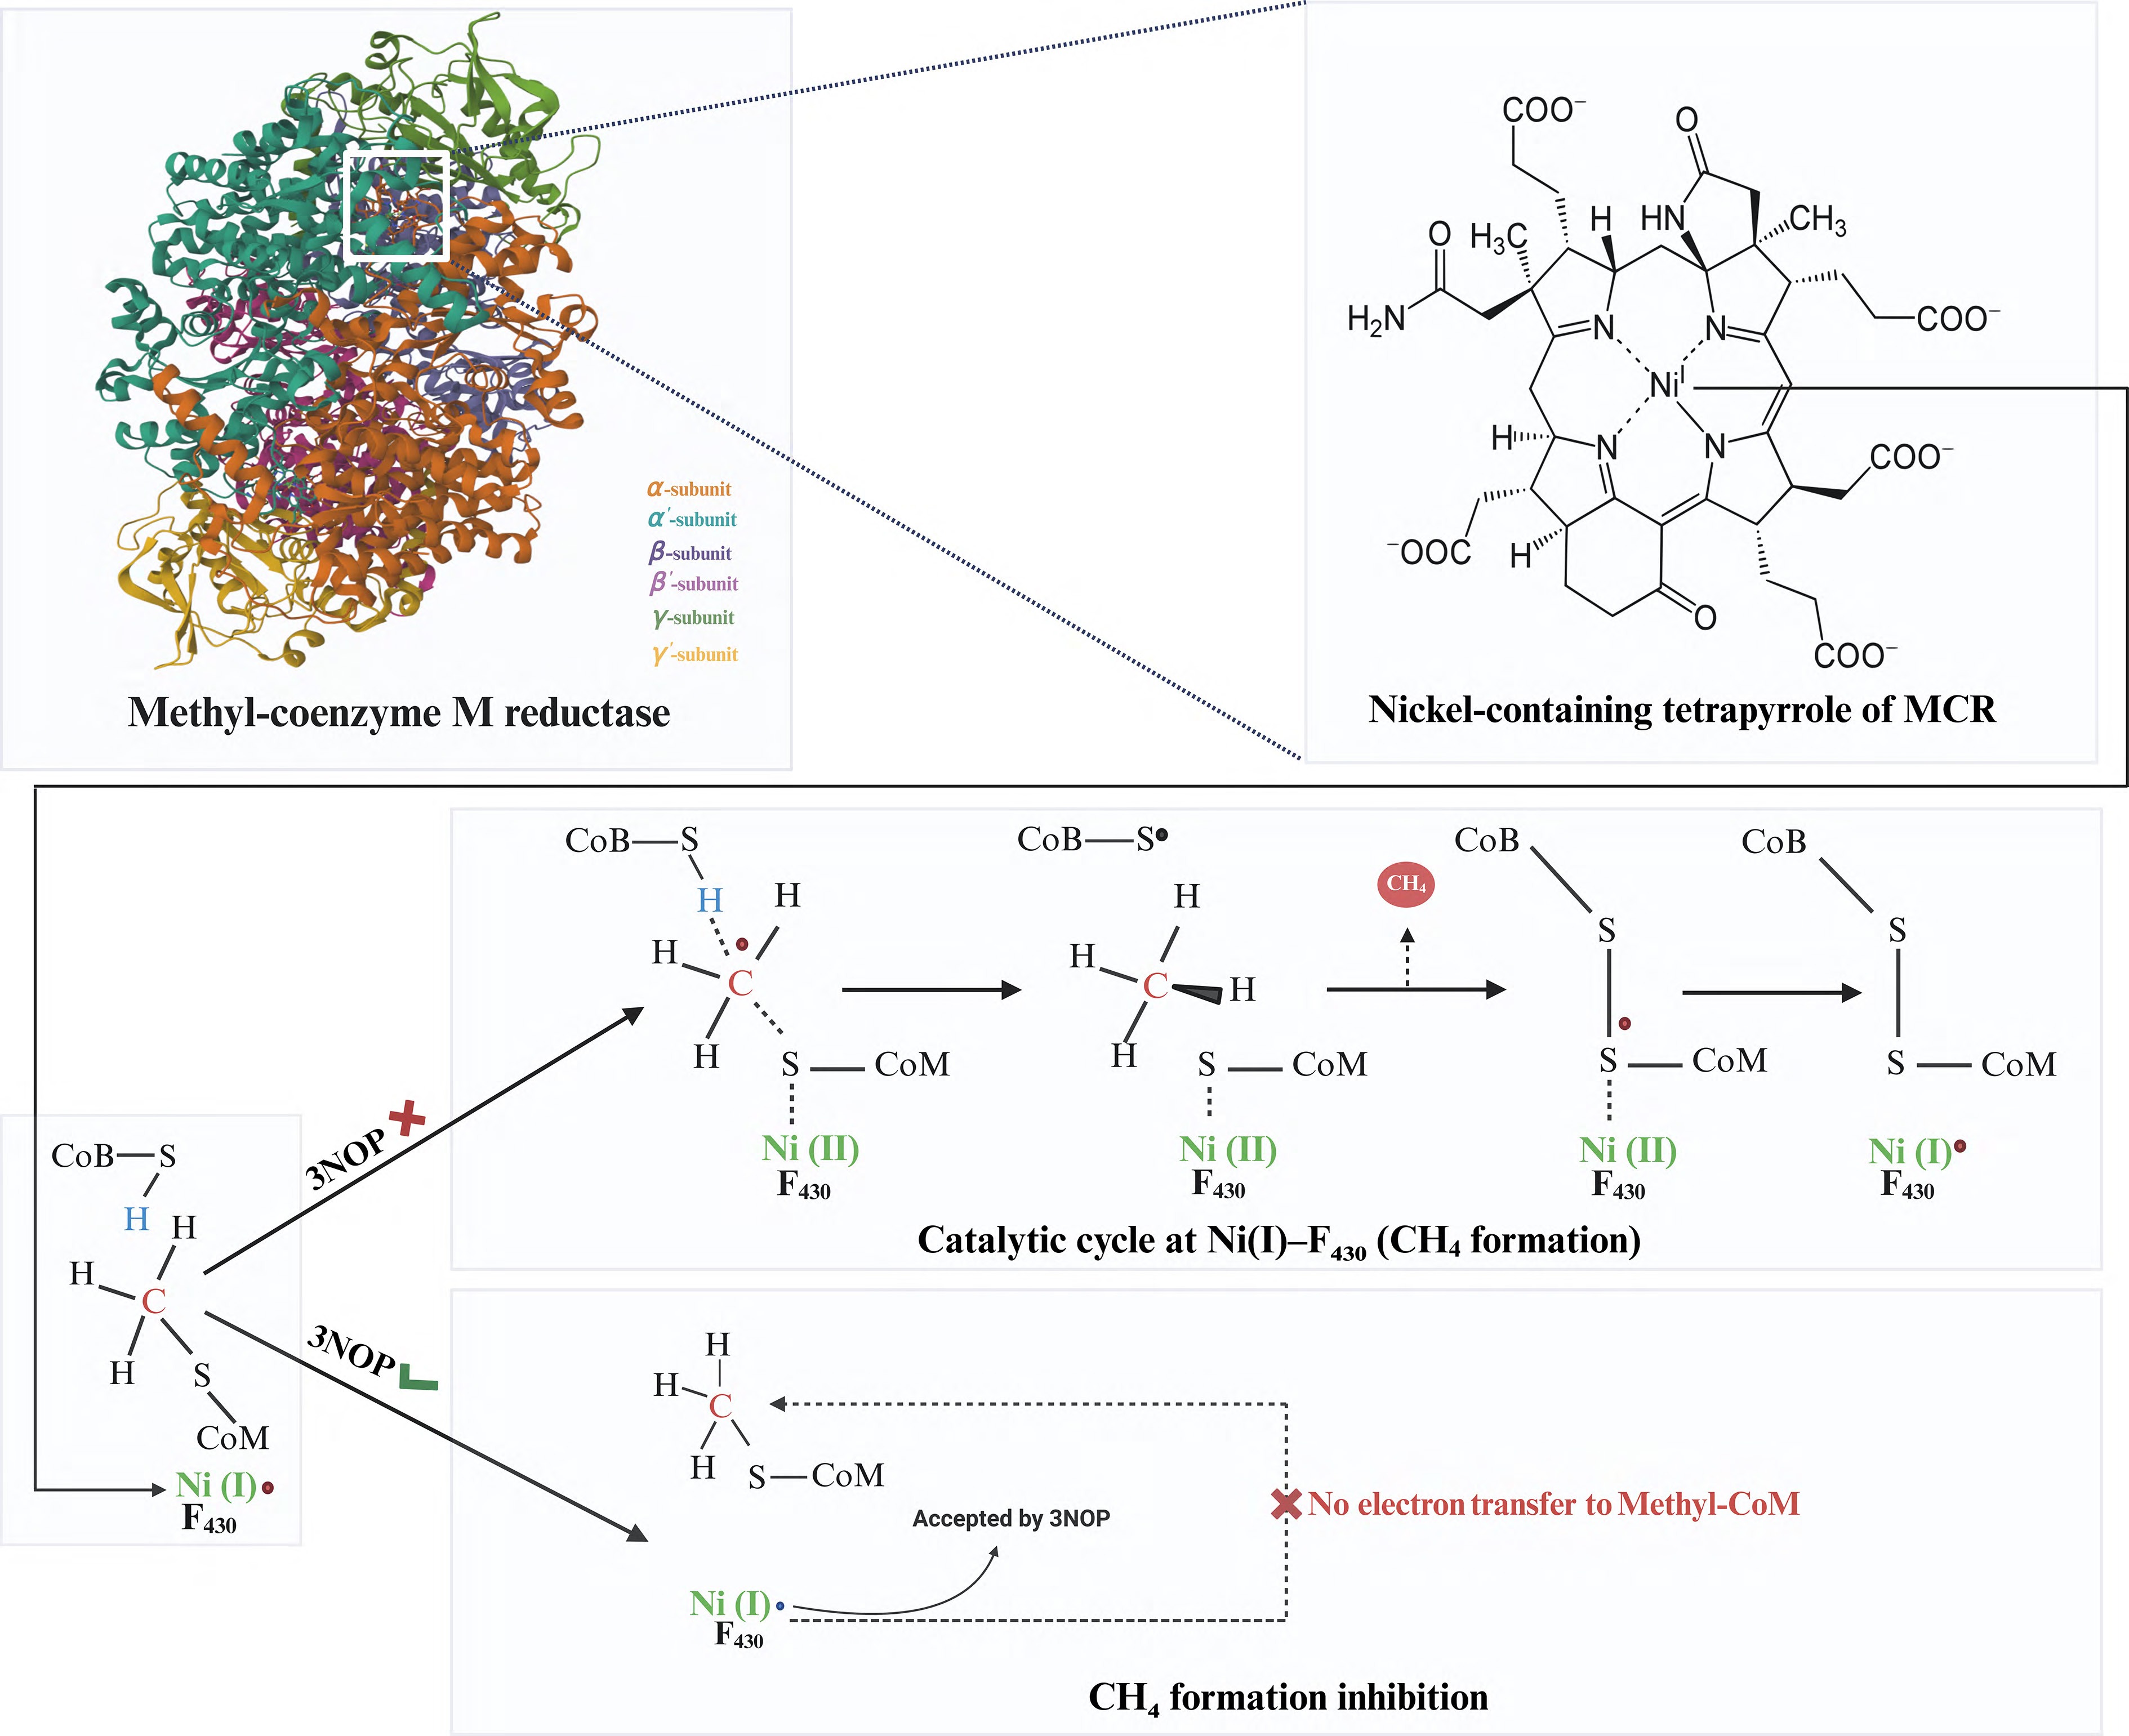
Figure 3.
Three-dimensional structure of MCR, highlighting the nickel-containing active site and the inhibitory mechanism of 3NOP (adapted from the study by Shima et al.[37]).
-
Animal type Diet 3NOP dose
(mg kg/DMI)CH4 yield
(g/kg DMI) (△%)H2 fold change Volatile fatty acids Ref. Acetate (△%) Propionate (△%) A:P ratio (△%) Dairy cow F:C (63:37) 60 ↓46 ↑4.2 ↓7.7 ↑6.6 (T) ↓14.9 [83] Dairy Cow PMR-based diet 80 ↓26−28 ↑2.7−2.8 − − − [84] Dairy Cow F:C (68:32) 60 ↓11−21.8 ↑2.5−3.7 − − − [85] Dairy Cow F:C (56:44) 60, 80 ↓31−34 − − − − [86] Dairy Cow F:C (60:40) 68, 132 ↓23−60 − − − − [77] Dairy Cow Grass silage 80 ↓22 ↑4.4 − − − [87] Dairy Cow Grazing 80 ↓28.5 ↑1.6 − − − [88] Dairy Cow Grazing 130 ↓9.7−10.2 ↑1.6 ↓5.7 ↑11.8 ↓14.7 [55] Dairy Cow F:C (53:47) 80 ↓23 − − − − [43] Dairy Cow F:C (76:24, 81:19, 65:35, 75:25) 80 ↓20 ↑3.3 − − − [50] Dairy Cow F:C (70:30) 60 ↓8−18 ↑1.53−2.85 − − − [89] Dairy Cow F:C (60:40) with low or high-fat 80 ↓24 ↑36 ↓8.5 ns ↓7.2 (T) [90] Dairy Cow F:C (53:47) 80 ↓18−23 ↑3.54 − − − [91] Dairy Cow Plant protein or urea-based 100 ↓53.5 − ↓5 ↑23 ↓25 [92] Dairy Cow F:C (60:40) 60 ↓26−30 − ↓10 ns ↓10 [75] Dairy Cow Grass or corn silage 60, 80 ↓30.9−35.9 ↑3.7−4.7 − − − [59] Dairy Cow LC (30%) and HC (55%) 48, 51 ↓23−35 − ↓4.9 ↑9.3 ↓15 [71] Dairy Cow F:C (58:42) 60 ↓21 ↑6 − − − [56] Dairy Cow F:C (60:40) 40–200 ↓16−36 ↑6−10 − − − [93] Dairy Cow F:C (58:42) 60 ↓27 ↑6 − − − [49] Dairy Cow F:C (60:40) 60 ↓16 ↑12 − − − [94] Dairy Cow S:C (66:34) 100 ↓21−23 − − − − [95] Dairy Cow S:C (60:40) 66.5, 133 ↓23−37 − ↓9.9 ↑10.9 ↓18.7 [80] Dairy Cow F:C (55:45) 60 ↓34 − ↓6.1 ↑5.2 ↓11 [70] Dairy Cow F:C (54:46) 40, 60, 80 ↓25−32 − − − − [54] Dairy Cow F:C (38:62) 130 ↓60 − ↓6.1 ↑10.5 (T) ↓14.4 [48] Dairy Cow Maize silage-based 25, 124 ↓7−9.8 − ↓6.3 ↓8.9 ↑9.7 [53] Beef cattle F:C (83:17) 121 ↓19.4 ↑4.21 − − − [96] Beef Cattle F:C (90:10) 200 ↓31.6−51.4 − − − − [81] Beef Cattle F:C (10:90) 100 ↓38 ↑3.73 − − − [45] Beef Cattle F:C (50:50) 150 ↓27.2 ↑3.27 − − − [57] Beef Cattle F:C (11:89) 100, 150 ↓40.7 − − − − [97] Beef Cattle F:C (90:10) 150 ↓22.0 ↑320 ↓7.9 ↑13.5 ↓18.9 [52] Beef Cattle F:C (3:97) 0, 50, 75, 100, 125 ↓65.5−87.6 − − − − [42] Beef Cattle F:C (90:10) 200 ↓28.2 ↑37.5 ↓8 ↑18 ↓25 [98] Beef Cattle F:C (90:10) 200 ↓36.6 ↑46 ↓11.5 ↑16.5 ↓22 [68] Beef Cattle F:C (89:11) 100, 125, 150 ↓52−76 ↑1.9 ↓8 ↑23 ↓30 [99] Beef Cattle S:C (70:30) 150, 175, 200 ↓20−25 ↑3.5−4 − − − [100] Beef Cattle F:C (90:10) 150 ↓53 ↑8.8 − − − [101] Beef Cattle S:barley grain (92:8) 125 ↓70 − − − − [102] Beef Cattle F:C (65:35) 100 ↓18 − ↓7.8 ↑13.5 ↓18.7 [63] Beef Cattle Rhodes grass hay 325 ↓38 − − − − [51] Beef Cattle S:C (65:35, 8:92) 125, 200 ↓37−42 ↑89 ↓9.4 ↑15.5 ↓19.5 [103] Beef Cattle S:C (65:35, 8:92) 50, 75, 100, 150, 200 ↓23−45 − − − − [104] Beef Cattle S:C (70:30, 8:92) 100, 200 ↓16−45.2 ↑2.6–621.5 − − − [105] Beef Cattle F:C (60:40) 280 ↓59.2 − ↓9 ↑19.9 ↓25 [78] Sheep F:C (70:30) 80−120 ↓11.8−14.7 ↑3.1−11.8 − − − [106] Sheep F:C (60:40) 55, 623 ↓21.7−22.1 − ↓6.8 ↑22.4 ↓20.4 [107] CH4: methane; H2: hydrogen; (△%): treatment response over control; ns: not-significant; ↓: decreased; ↑: increased; −: not reported; DMI = dry matter intake; A:P ratio: acetate to propionate ratio; DW: drinking water; DM: dry matter; T: numerical tendency (p > 0.05); F:C: forage to concentrate ratio; S:C: silage to concentrate ratio; B: Bovaer®; fold change: control vs 3NOP. Table 1.
Effects of 3NOP supplementation on CH4 emission, H2 production, and rumen fermentation in ruminants.
-
Rumen fluid Diet 3NOP (mg/g OM) CH4 yield
(g/kg DMI) (△%)H2 fold change Volatile fatty acids Ref. Acetate (△%) Propionate (△%) A:P ratio (△%) Cattle F:C (56:44) 2, 2 (Vita B12) ↓9−12 − ↓2.60 ↑2.55 ↓4.79 [108] Cattle F:C (56:44) 2, 100 (Fumarate) ↓9.7−11.5 − ns ns ↓3.6 [79] Cattle F:C (70:30, 40:60) 0.07, 0.16, 1.2 ↓17−97 ↑27−6.2 ↓4 ns ns [109] Cattle F:C (50:50) 0.08 ↓44 − ↓5.5 ↑7.1 ↓13.6 [110] Cattle S:C (60:40) 0.5 ↓75 ↑1.81 ↓15.8 ↑10.2 (T) ns [111] Cattle S:C (60:40) 0.5, 1, 2 ↓74.6−86 ↑2.6−3.18 − − − [112] Sheep F:C (60:40) 0.025, 0.05, 0.1 ↓97 ↑484 ↓15.8 ↑5.9 ↓15.2 [66] Sheep Alfalfa hay and oats 8, 16 ↓86−95.4 − − − ↓33.1 [107] CH4: methane; H2: hydrogen; (△%): treatment response over control; ns: not-significant; ↓: decreased; ↑: increased; −: not reported; T: numerical tendency (p > 0.05); OM: organic matter; A:P ratio: acetate to propionate ratio; F:C: forage to concentrate ratio; S:C: silage to concentrate ratio; fold change: control vs 3NOP. Table 2.
Summary of in-vitro studies on the effects of 3NOP on CH4 emissions, H2 production, and rumen fermentation.
-
Animal Type 3NOP dose (mg/kg DMI) DMI (△%) Milk yield (△%) ADG (△%) Feed efficiency (product/DMI) Ref. Dairy Cow 60 ↓5.7 ns − ↓ [83] Dairy Cow 80 ↓5−6 ↓6.6 − ns [84] Dairy Cow 60, 80 ↓9 ↓5 ↓42 ns [86] Dairy Cow 130 ↓6 ↓6 (T) ns ns [55] Dairy Cow 80 ns ns − ↑ [50] Dairy Cow 60 ns ns ns ns [89] Dairy Cow 80 ↓11 ↓7.2 − − [90] Dairy Cow 80 ↓13.4 ↓11.7 ↓168.9 ↓ [91] Dairy Cow 100 ↓16.6 ↓11.4 − − [92] Dairy Cow 48, 51 ns ↓8.7 ns ns [71] Dairy Cow 60, 80 ↓6.5 ↓4.4 − ns [59] Dairy Cow 130 ns ns ↑171.8 ns [48] Beef Cattle 100 ns − ns ↑ [45] Beef Cattle 100, 150 ns − ↓8(T) ns [97] Beef Cattle 200 ↓1.9 − − − [68] Beef Cattle 100, 125, 150 ↓6.4 − − − [99] Beef Cattle 150, 175, 200 ↓5.4 − ns ↑ [100] Beef Cattle 121 ↓11.6 − ↓10.3 ↑ [96] Beef Cattle 100 ns − ns ↑ [45] Beef Cattle 2.5 g d−1 ns − ↑ − [51] Beef Cattle 125, 200, B:80 ↓7 − ns ↑ [103] Beef Cattle 50, 75, 100, 150, 200 ns − ns ↑ (T) [104] Beef Cattle 100, 200 ↓8 − ↓10.3 (T) ↓ [105] (△%): treatment response over control; DMI: dry matter intake; ADG: average daily gain; ECM: energy-corrected milk. Product = ECM for dairy, ADG for beef; ns: not significant; -: not reported; ↓: decreased; ↑: increased; T: numerical tendency (p > 0.05); B: Bovaer@. Table 3.
Effects of 3NOP supplementation on DMI, production performance, and feed efficiency in ruminants.
Figures
(3)
Tables
(3)