-
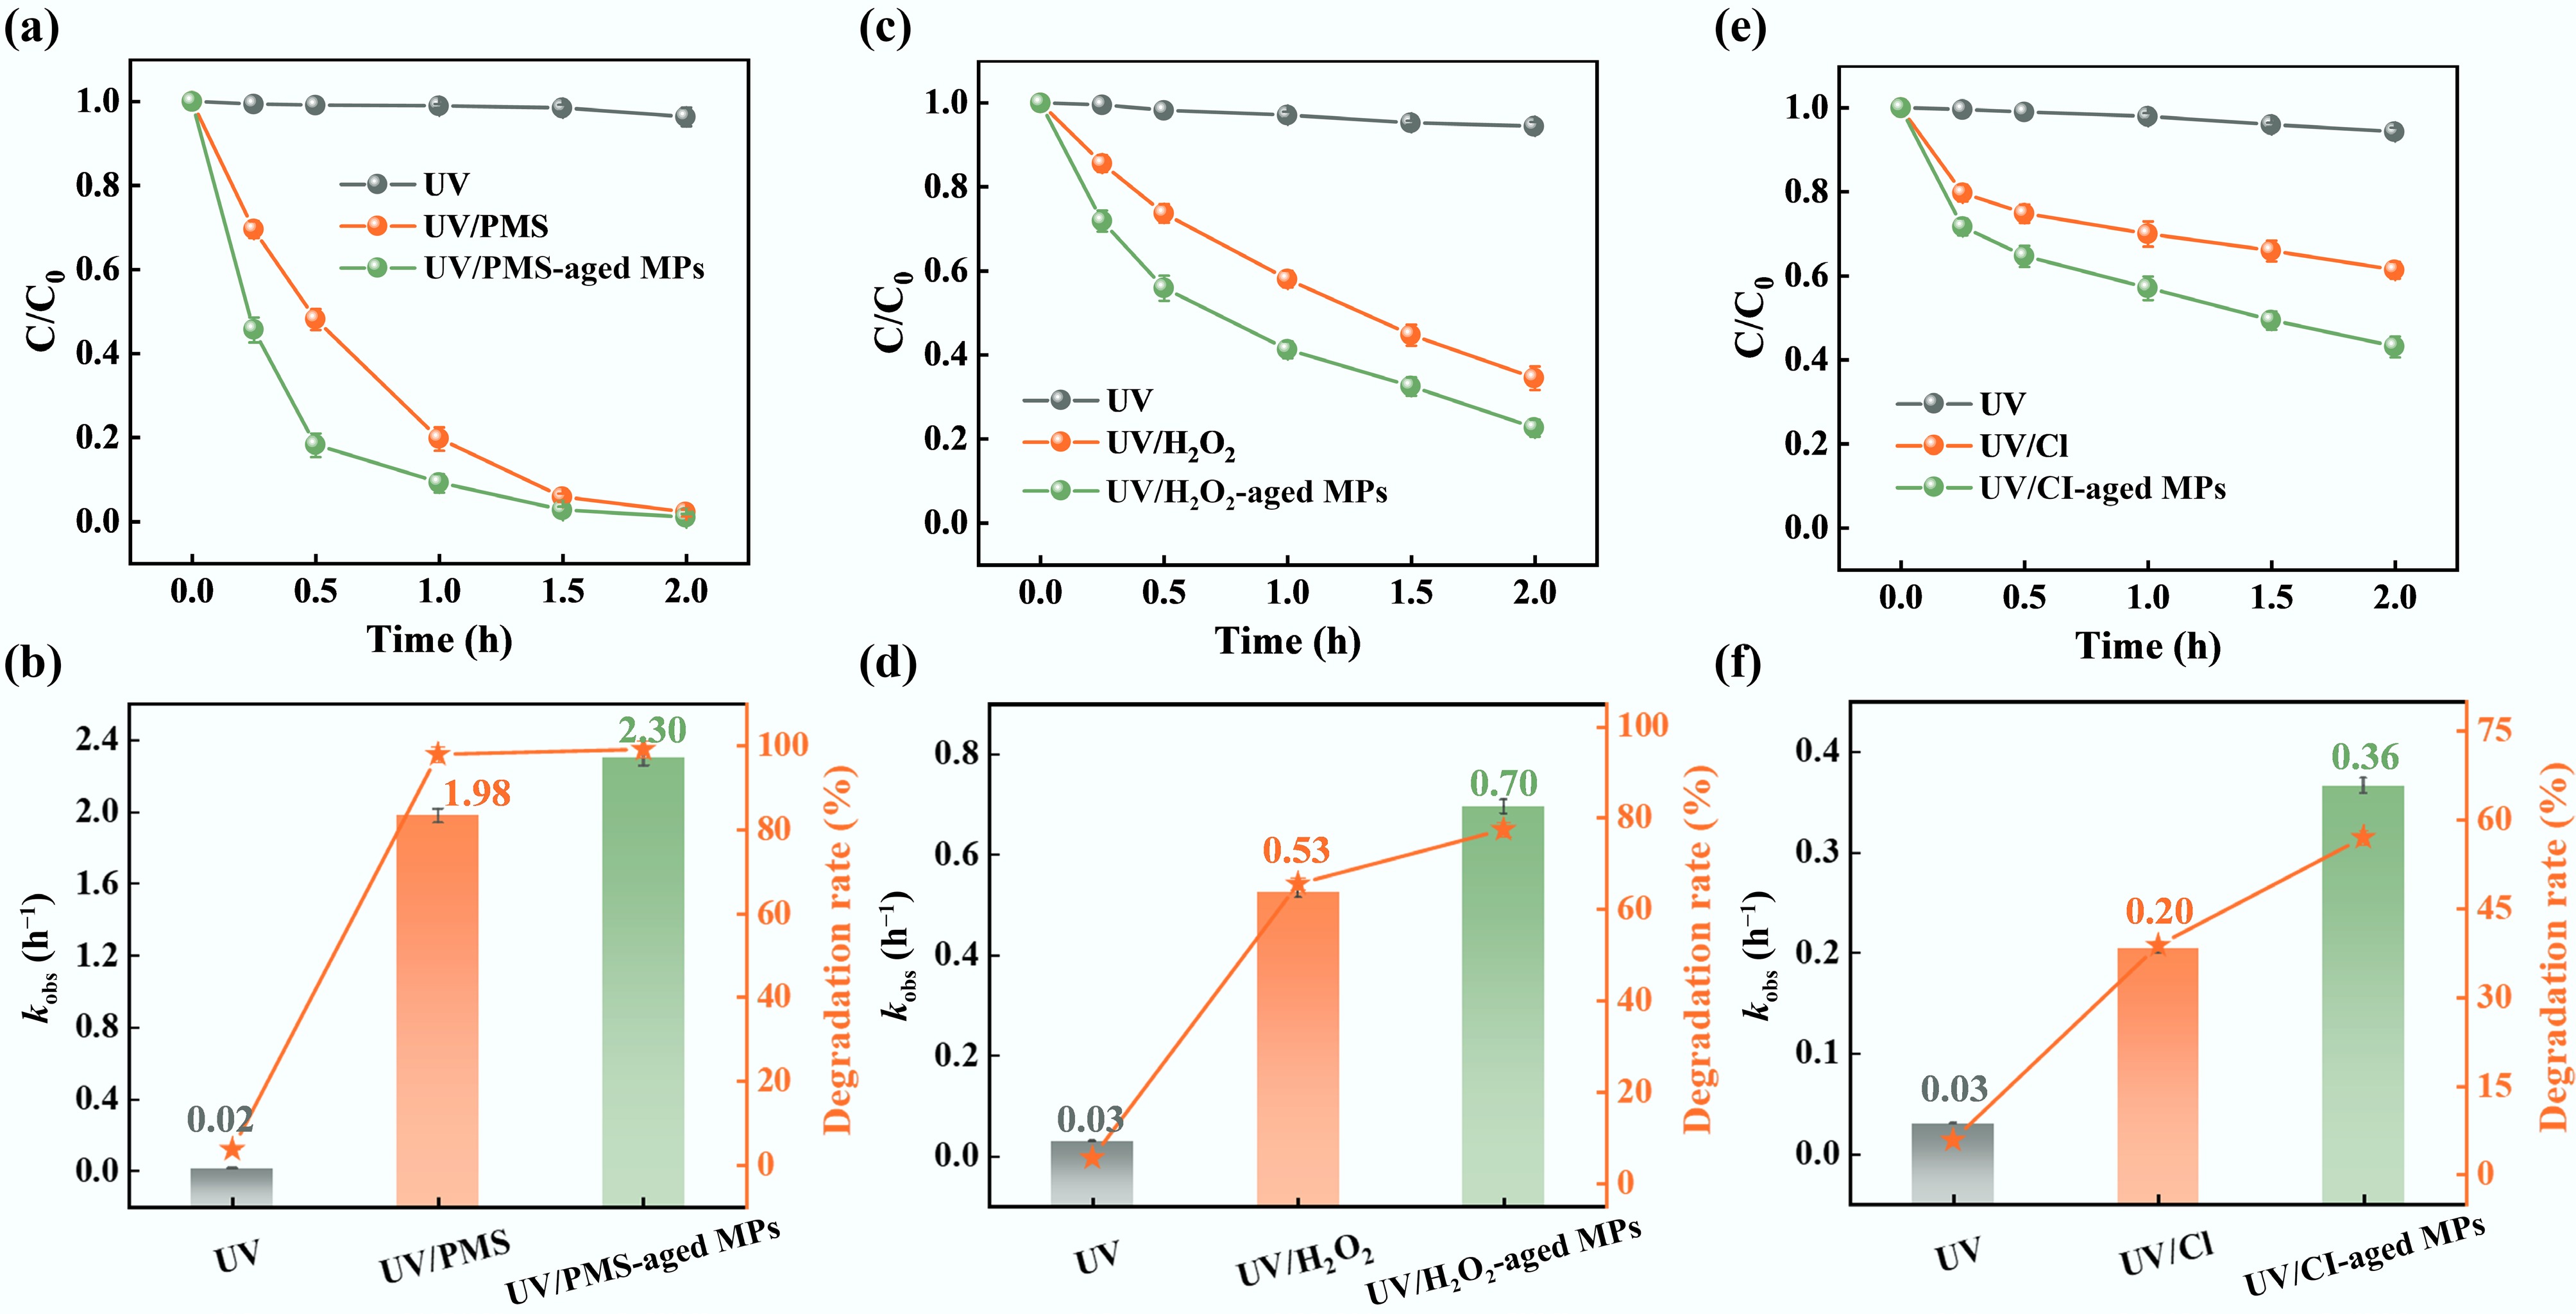
Figure 1.
Effect of aged MPs on CBZ degradation in (a), (b) UV/PMS, (c), (d) UV/H2O2, and (e), (f) UV/Cl systems. Reaction conditions: (CBZ)0 = 1 mg·L−1, (PMS)0 = (H2O2)0 = (Cl)0 = 0.2 mM, (PA MPs)0 = 2 g·L−1, pH = 6.0 ± 0.5, T = 25 °C. kobs, observed pseudo-first-order rate constant. (All experiments were performed in triplicate; error bars are included but are smaller than the symbols in most cases).
-
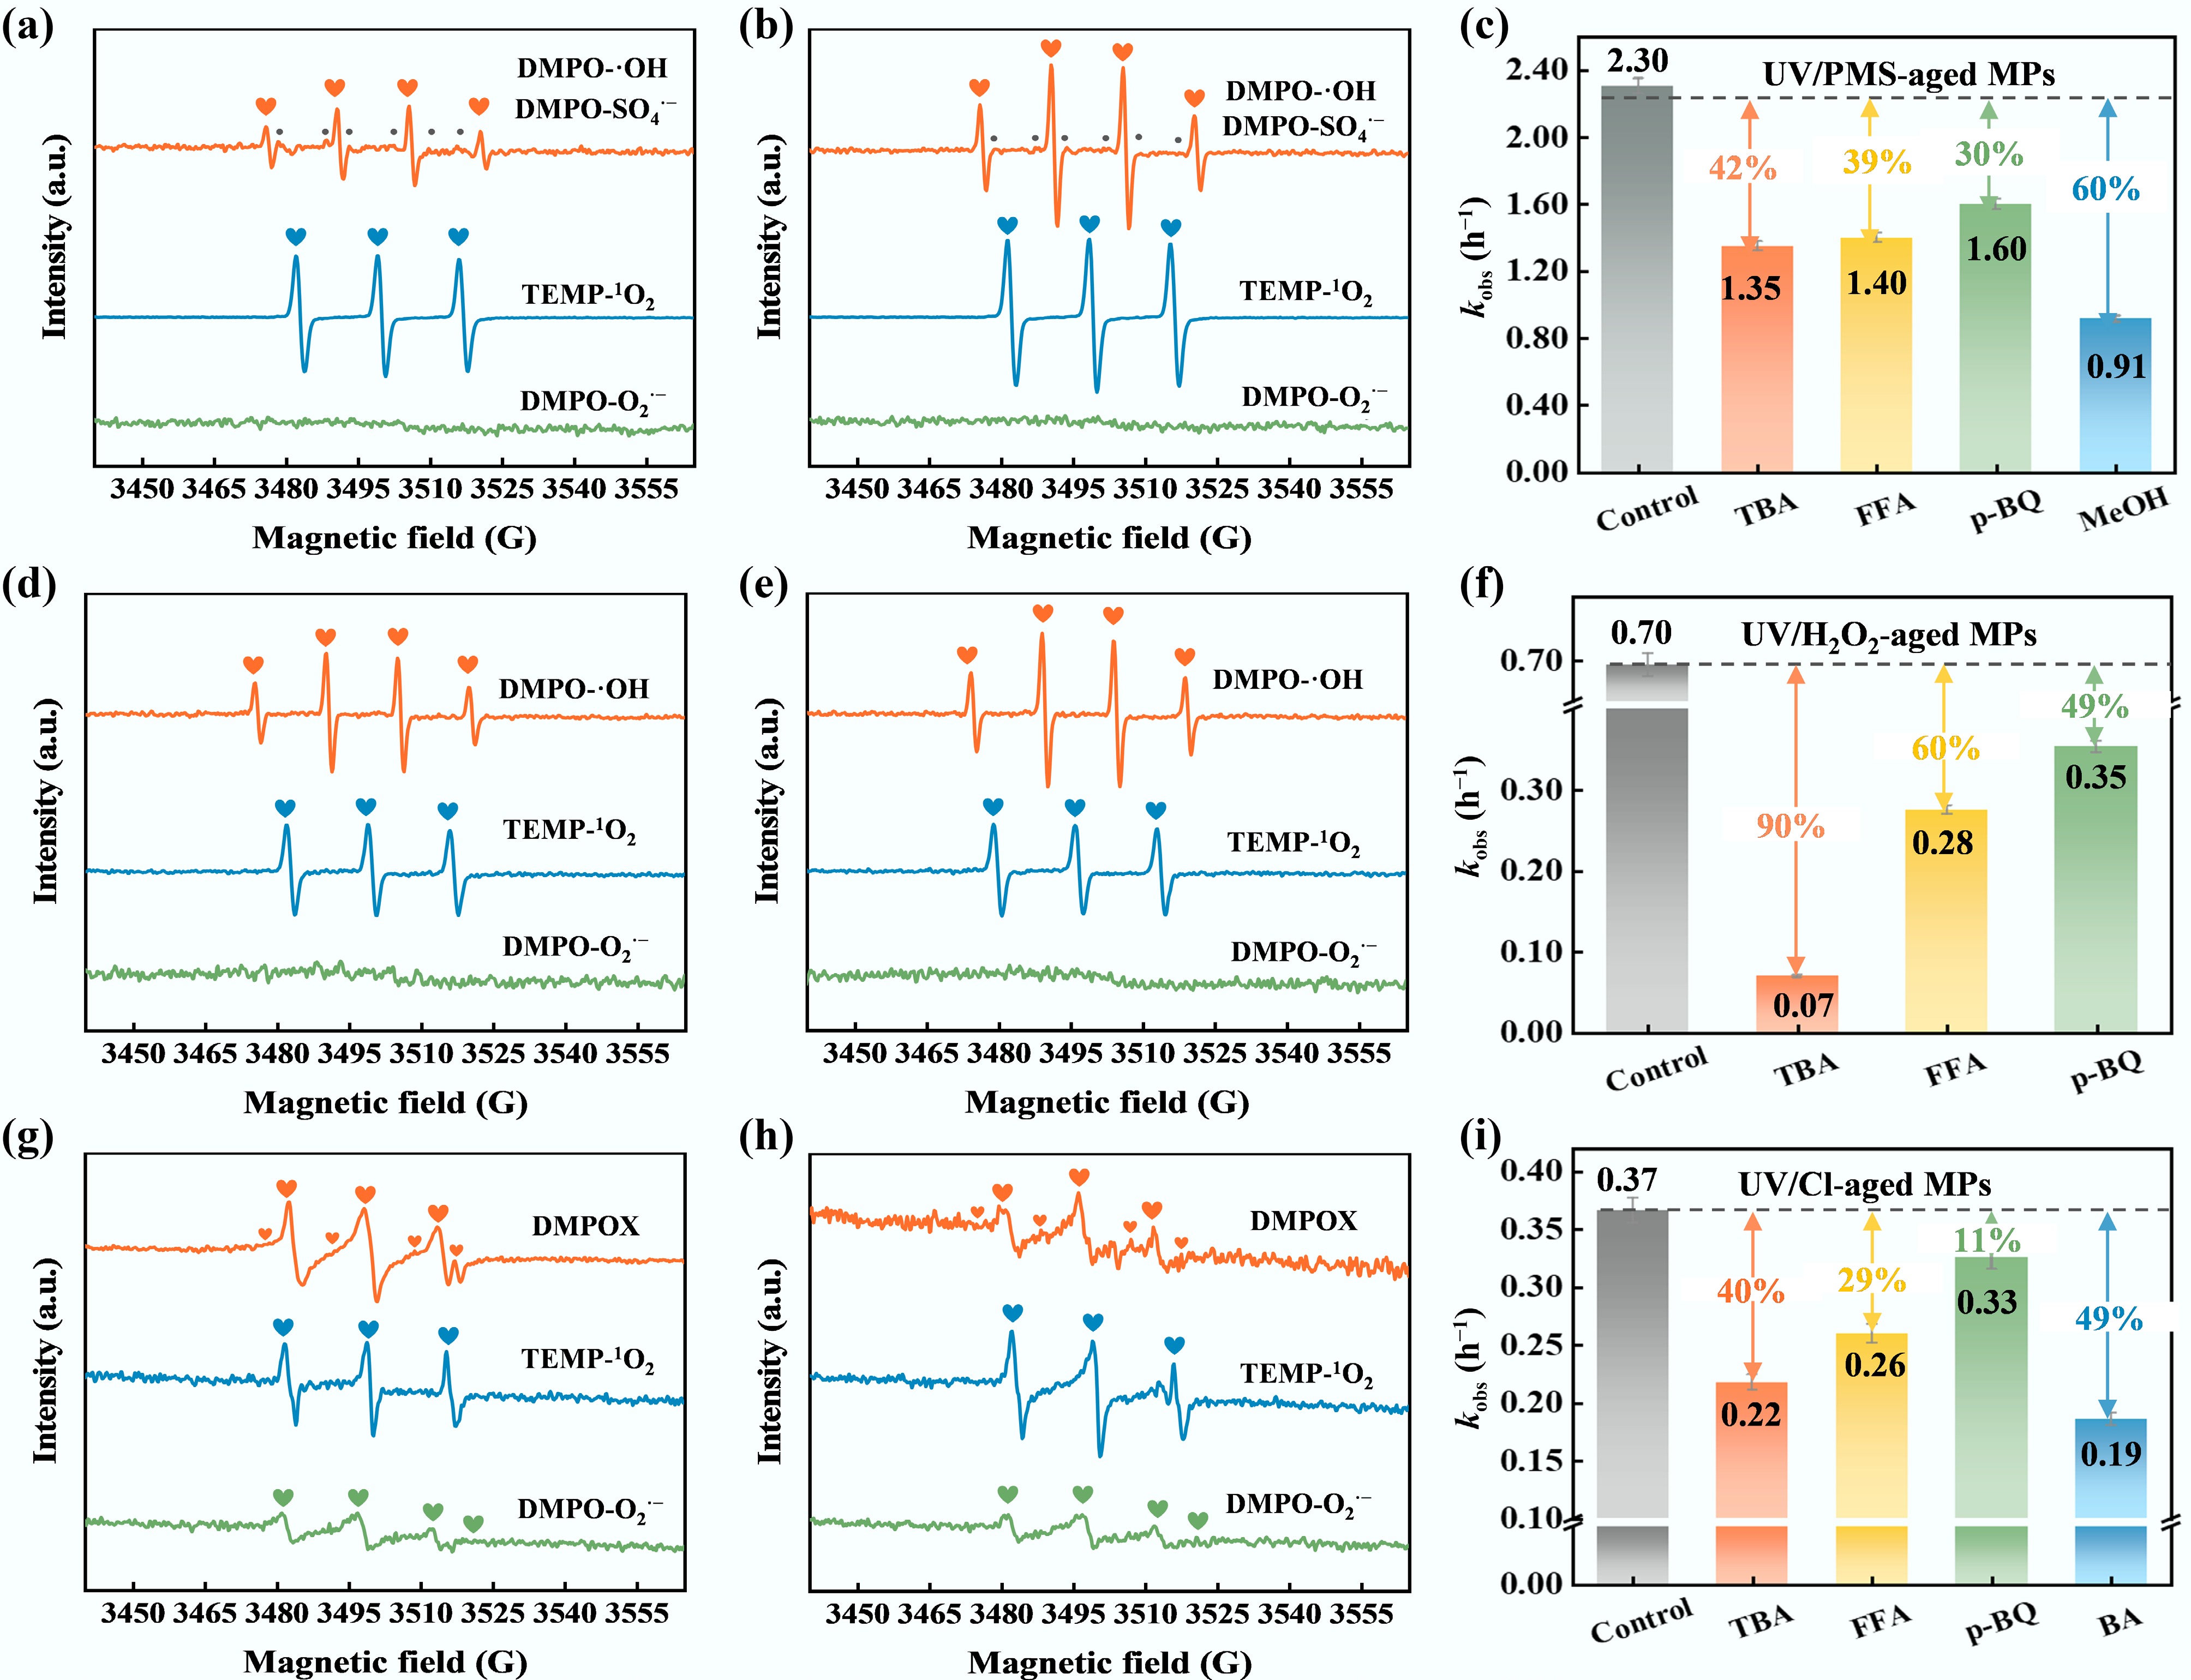
Figure 2.
EPR spectra of active species in the (a) UV/PMS, (b) UV/PMS-aged MPs, (d) UV/H2O2, (e) UV/H2O2-aged MPs, (g) UV/Cl, and (h) UV/Cl-aged MPs systems. Quenching experiments were conducted in the (c) UV/PMS-aged MPs, (f) UV/H2O2-aged MPs, and (i) UV/Cl-aged MPs reaction systems. MeOH, methanol; TBA, tert-butanol; FFA, furfuryl alcohol; p-BQ, p-benzoquinone; BA, benzoic acid.
-
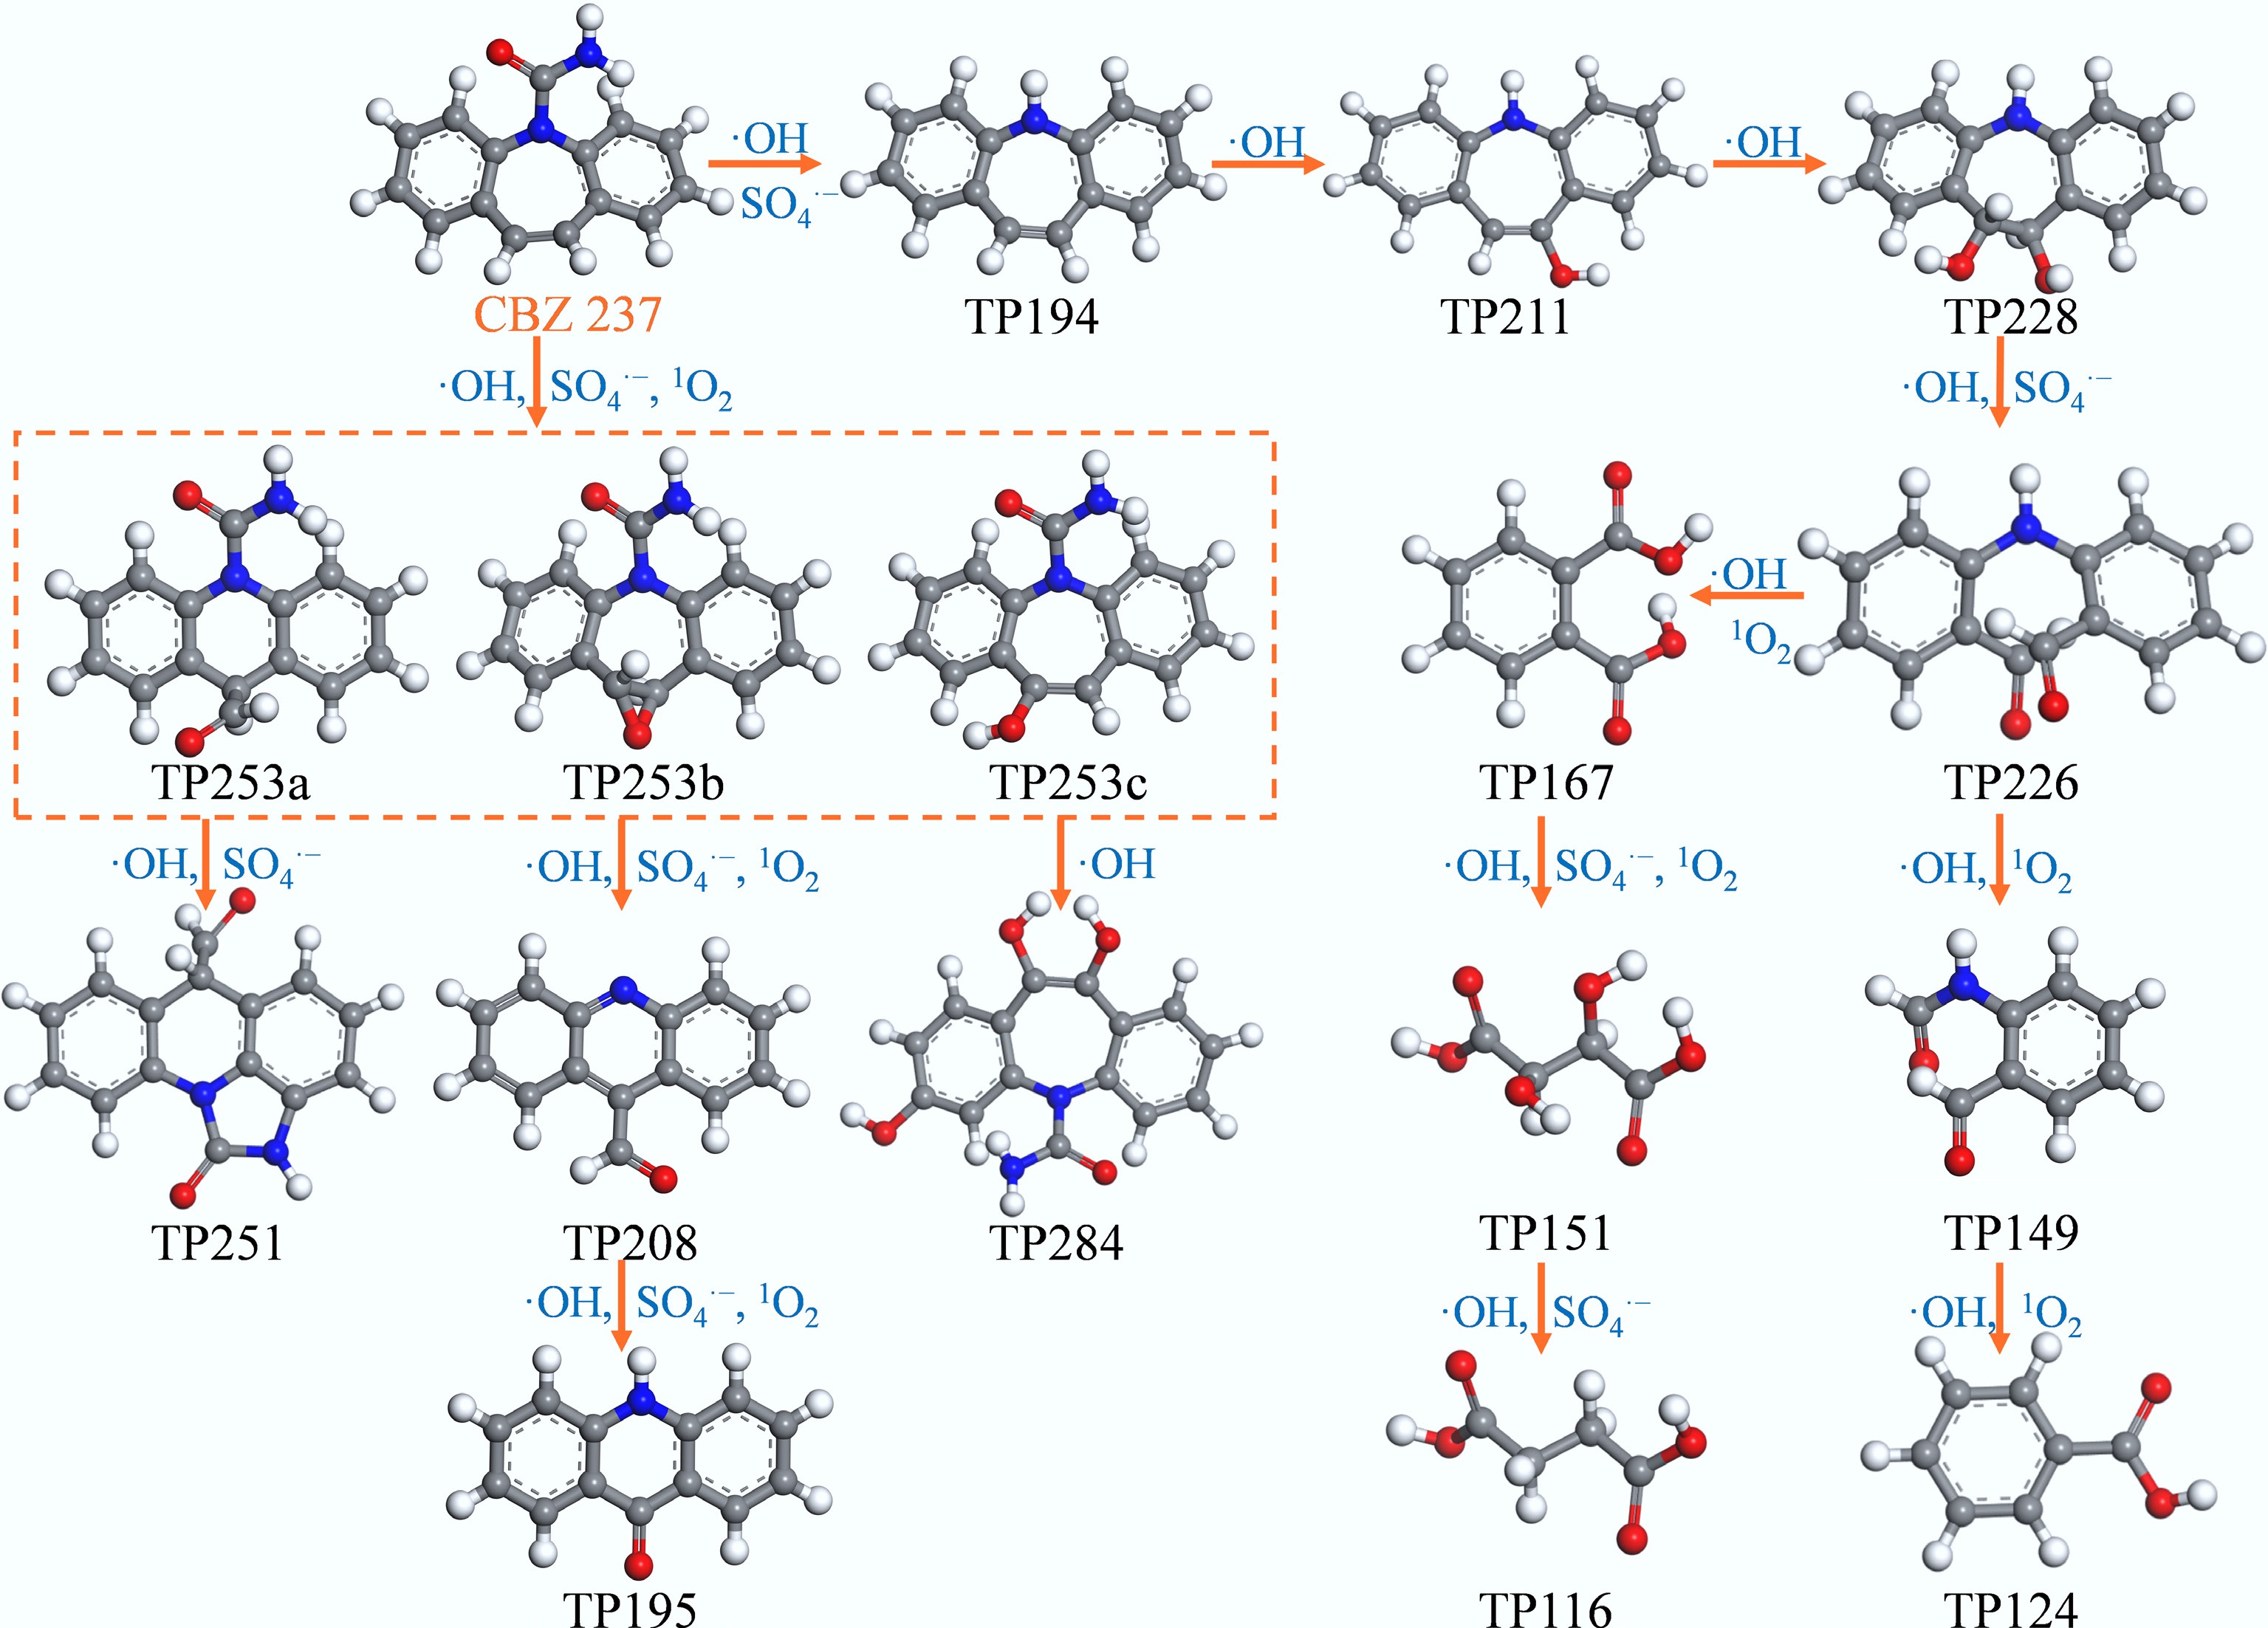
Figure 3.
Degradation pathways of CBZ in UV/PMS and UV/PMS-aged MPs systems.
-
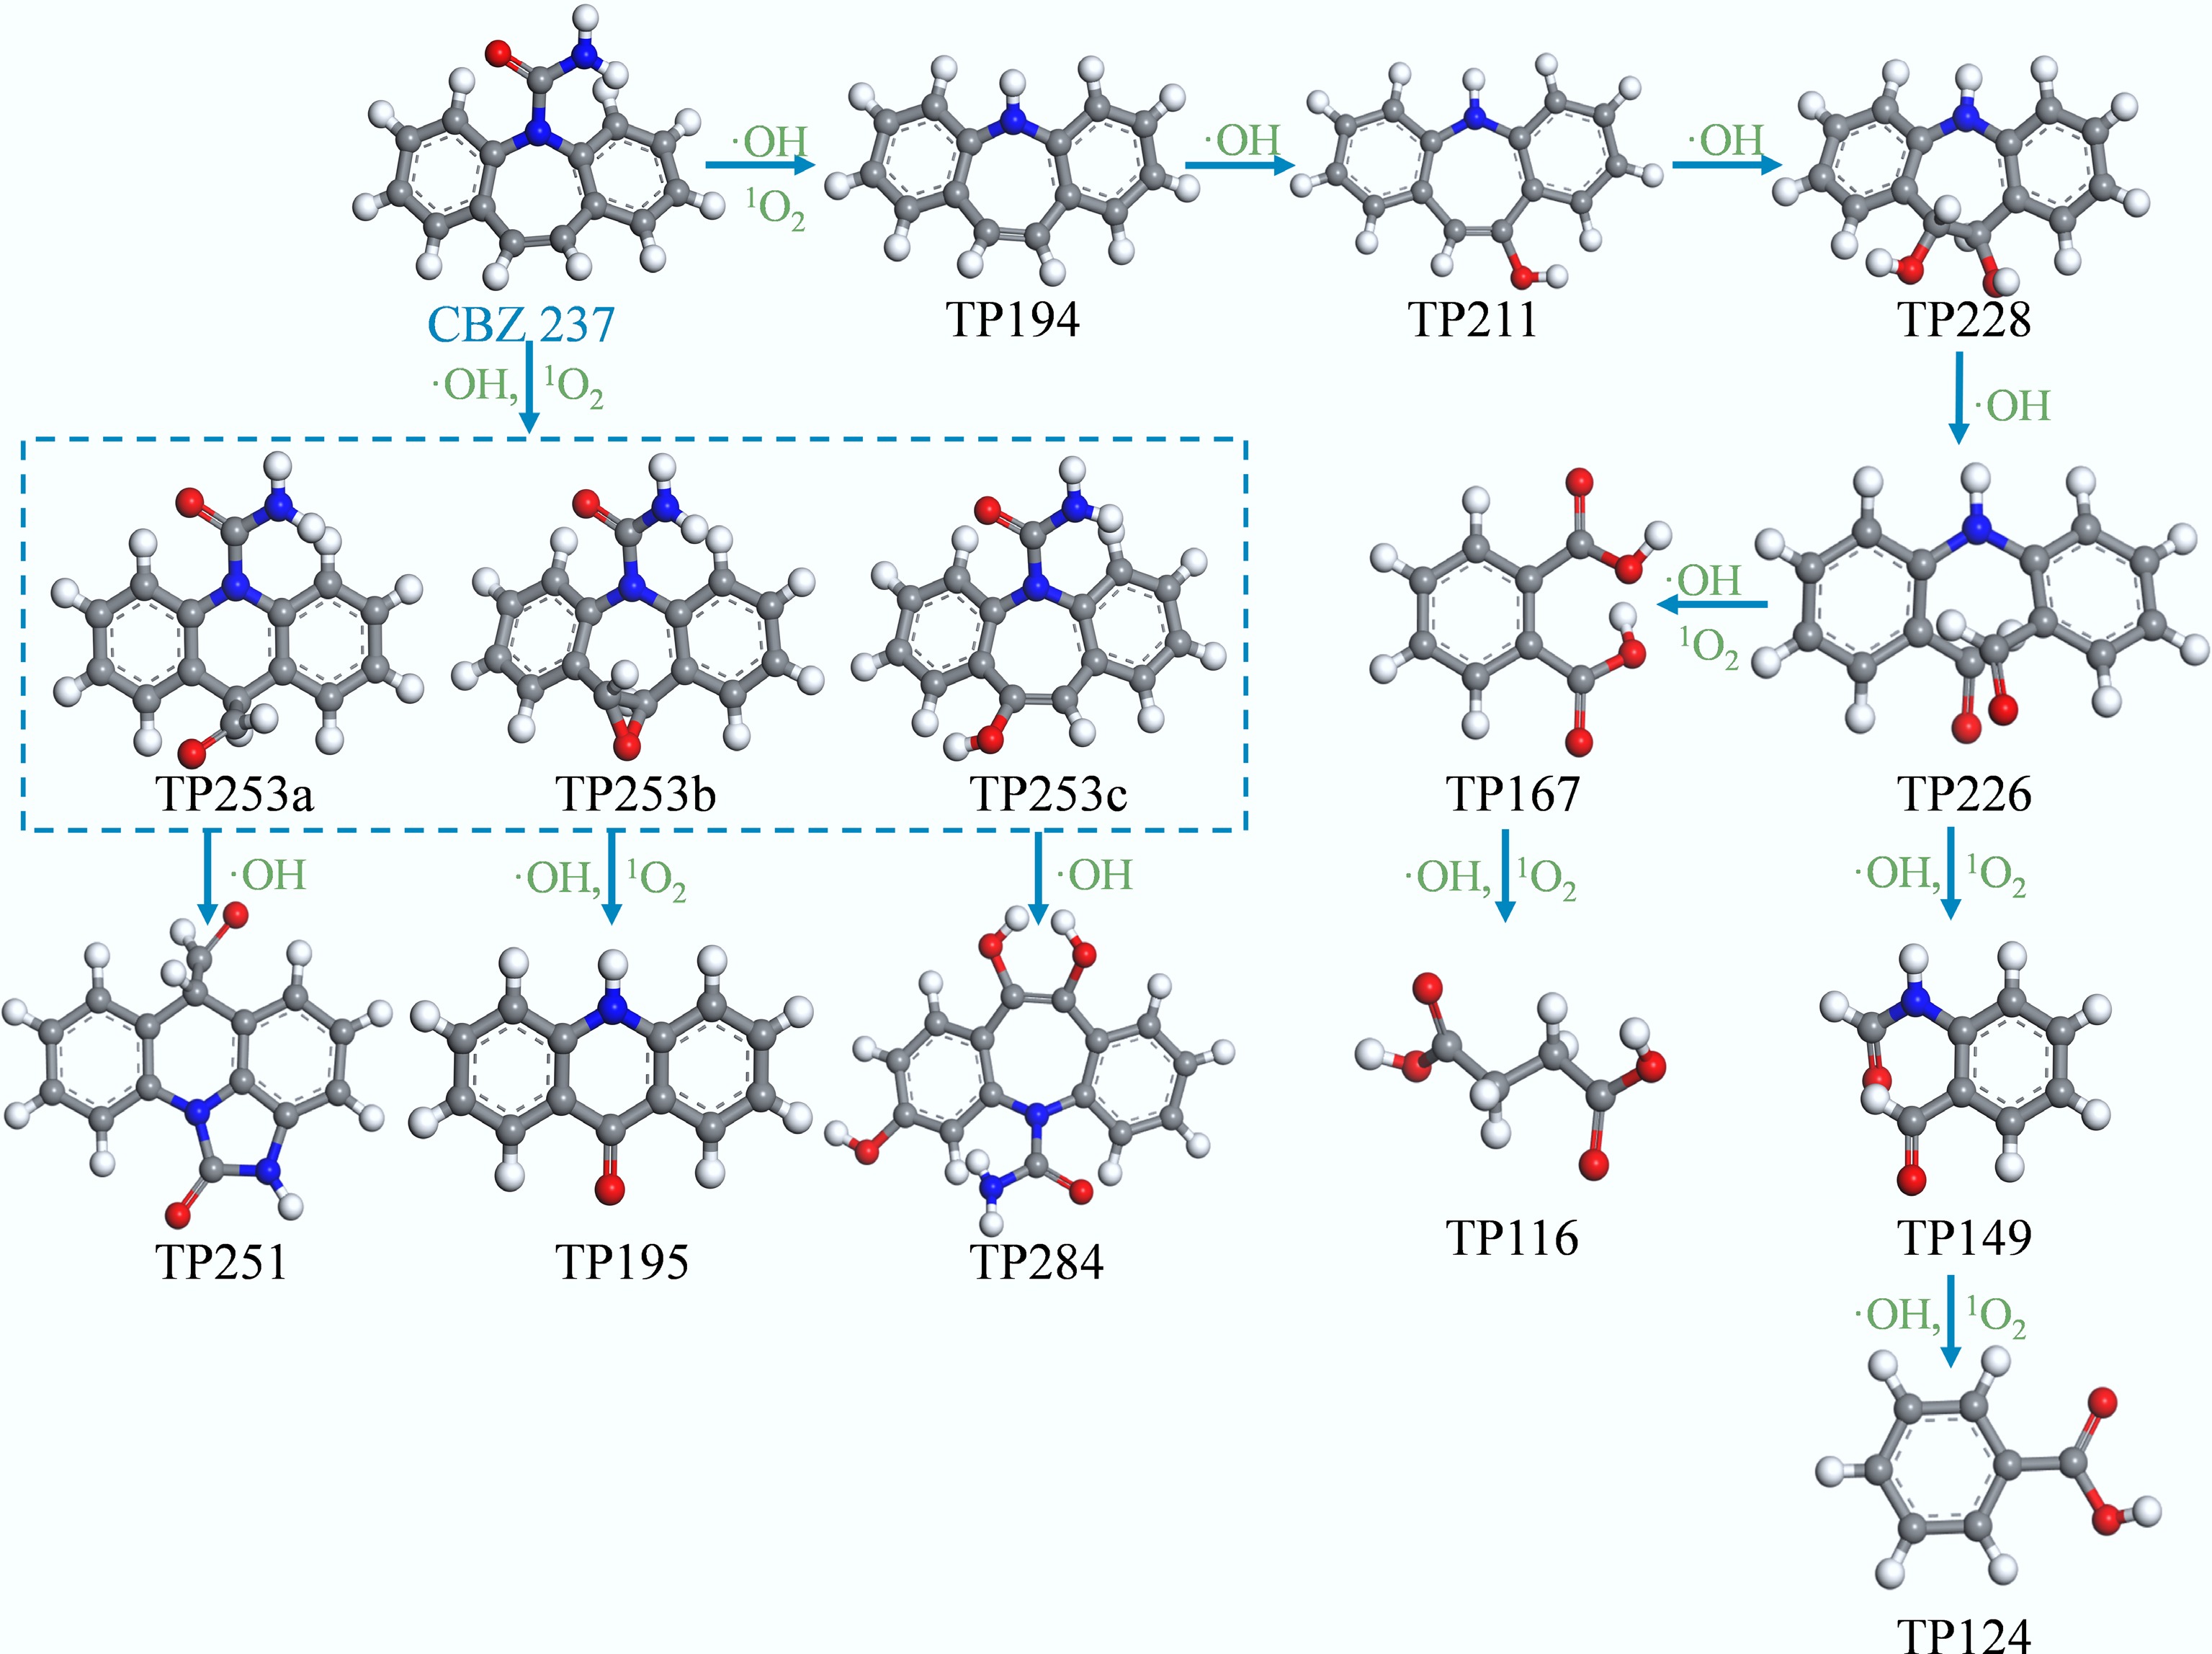
Figure 4.
Degradation pathways of CBZ in UV/H2O2 and UV/H2O2-aged MPs systems.
-
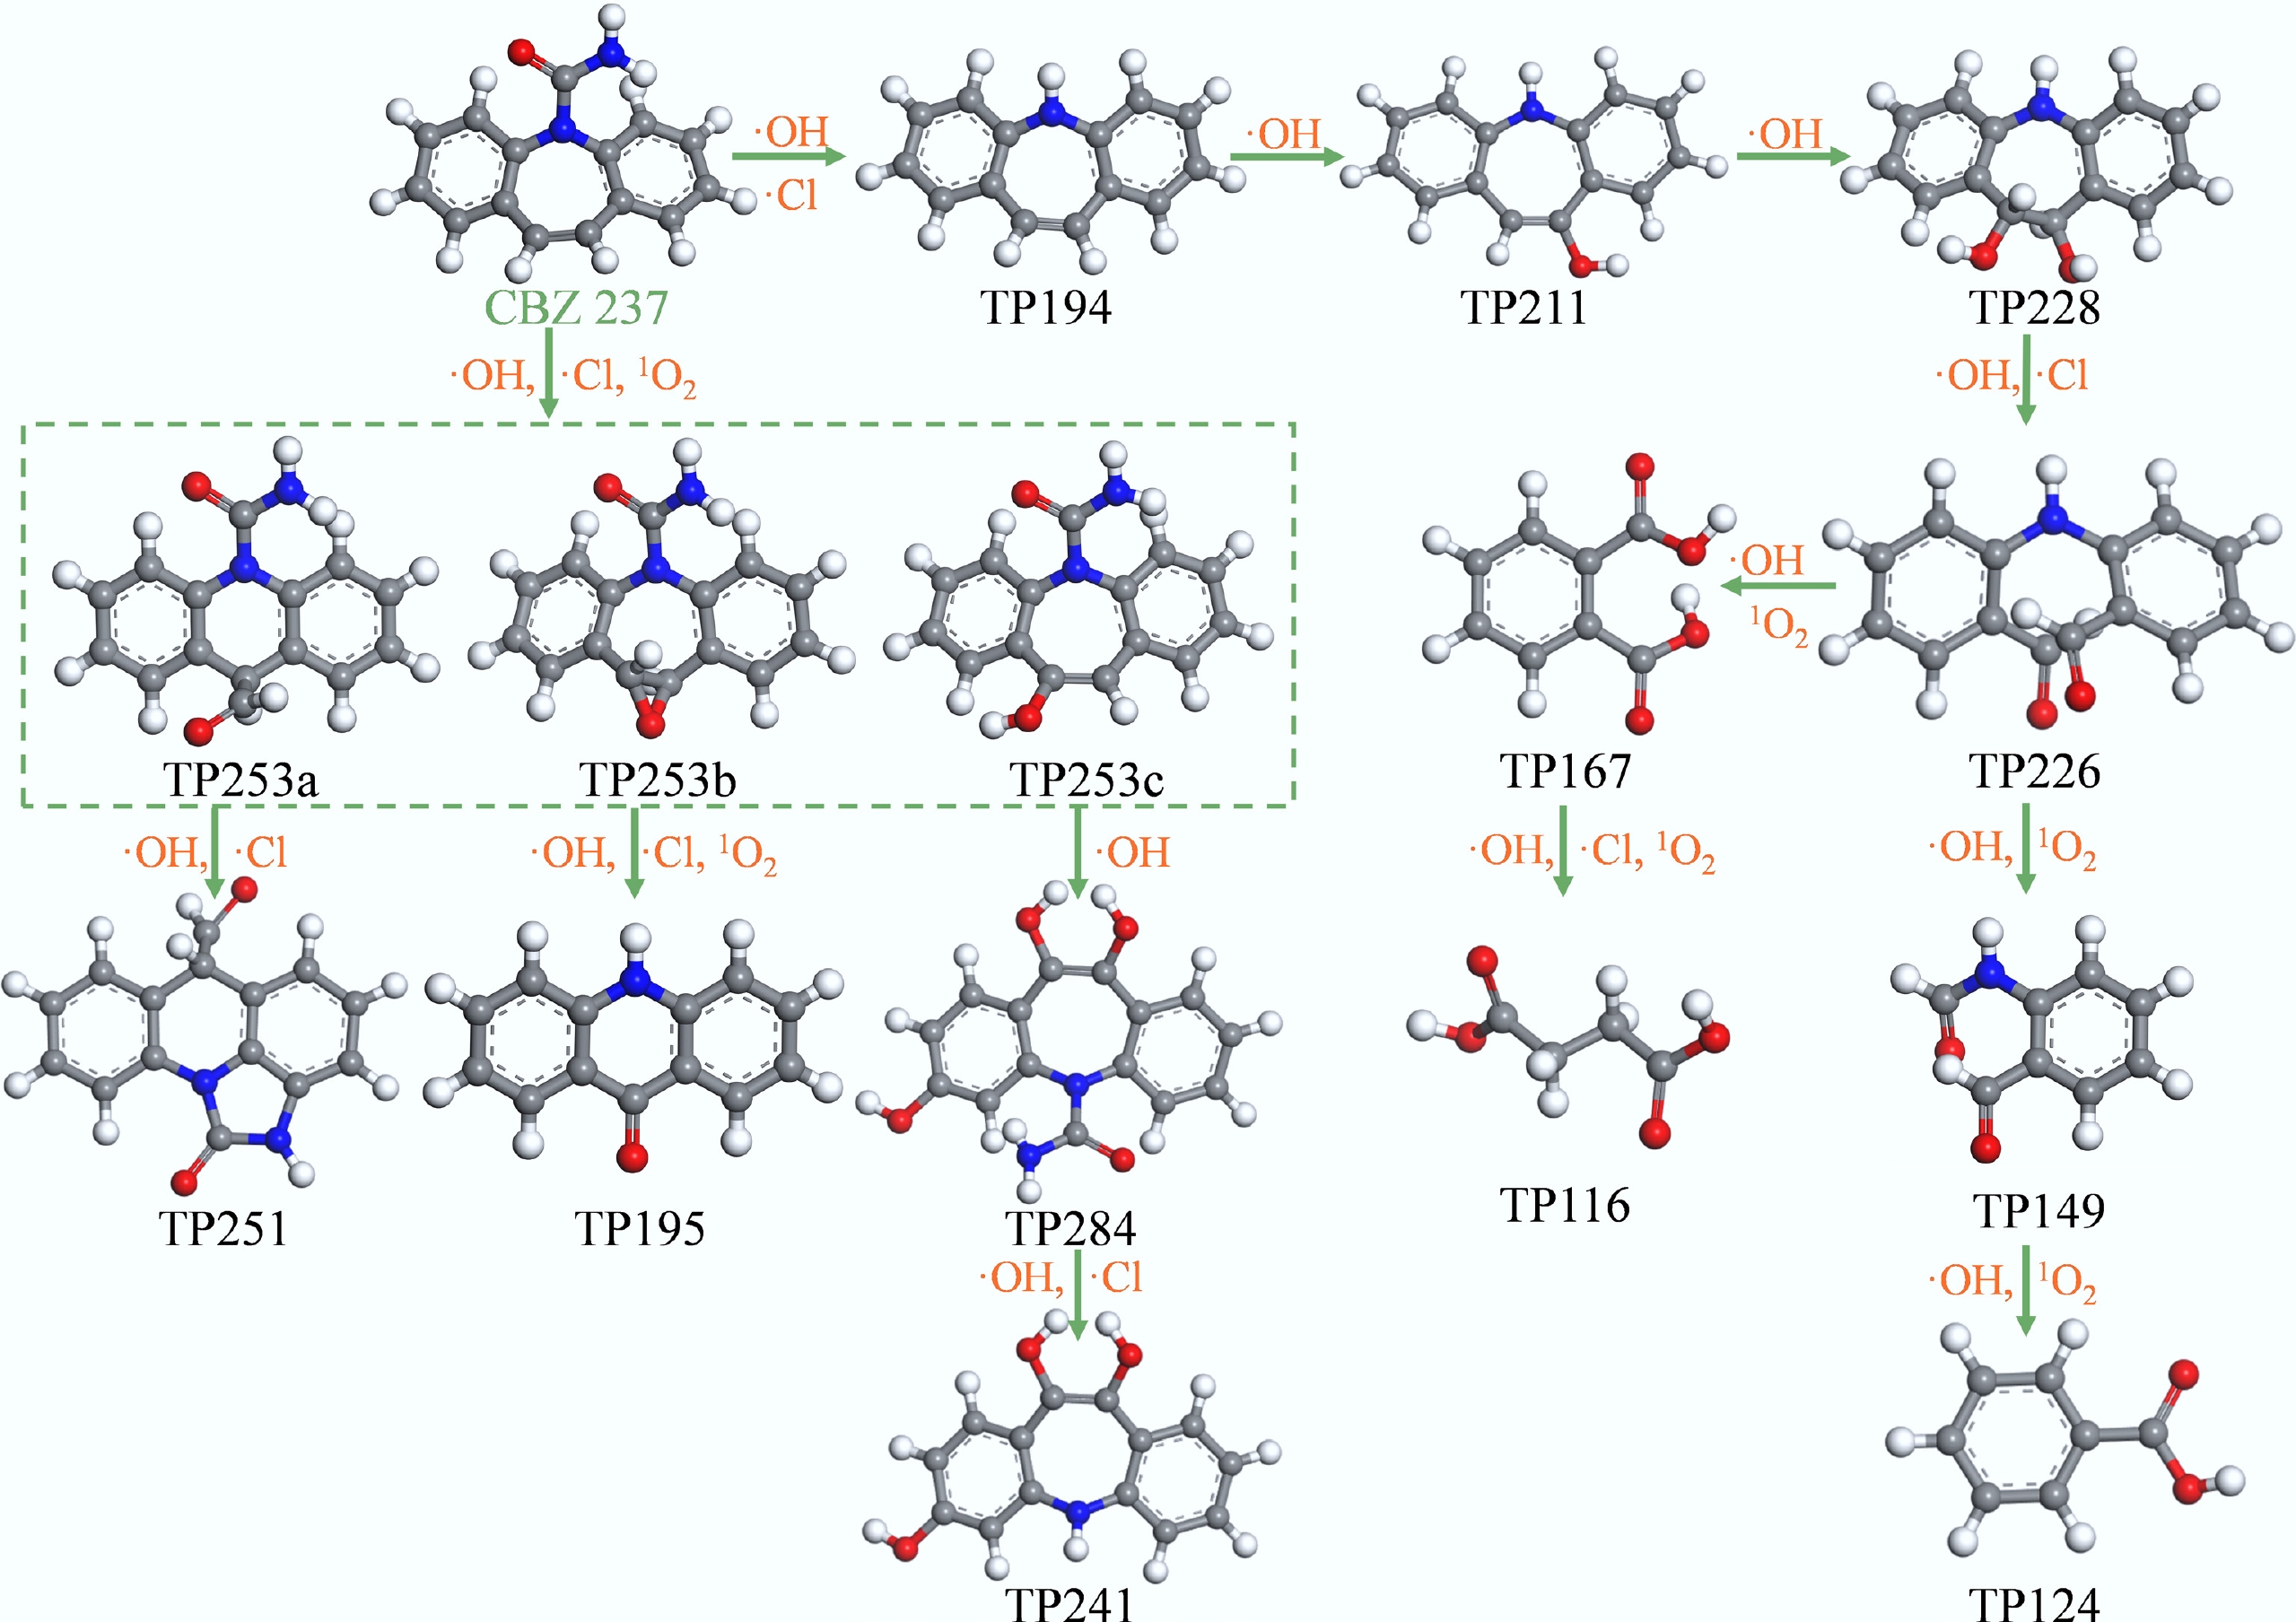
Figure 5.
Degradation pathways of CBZ in UV/Cl and UV/Cl-aged MPs systems.
-
-
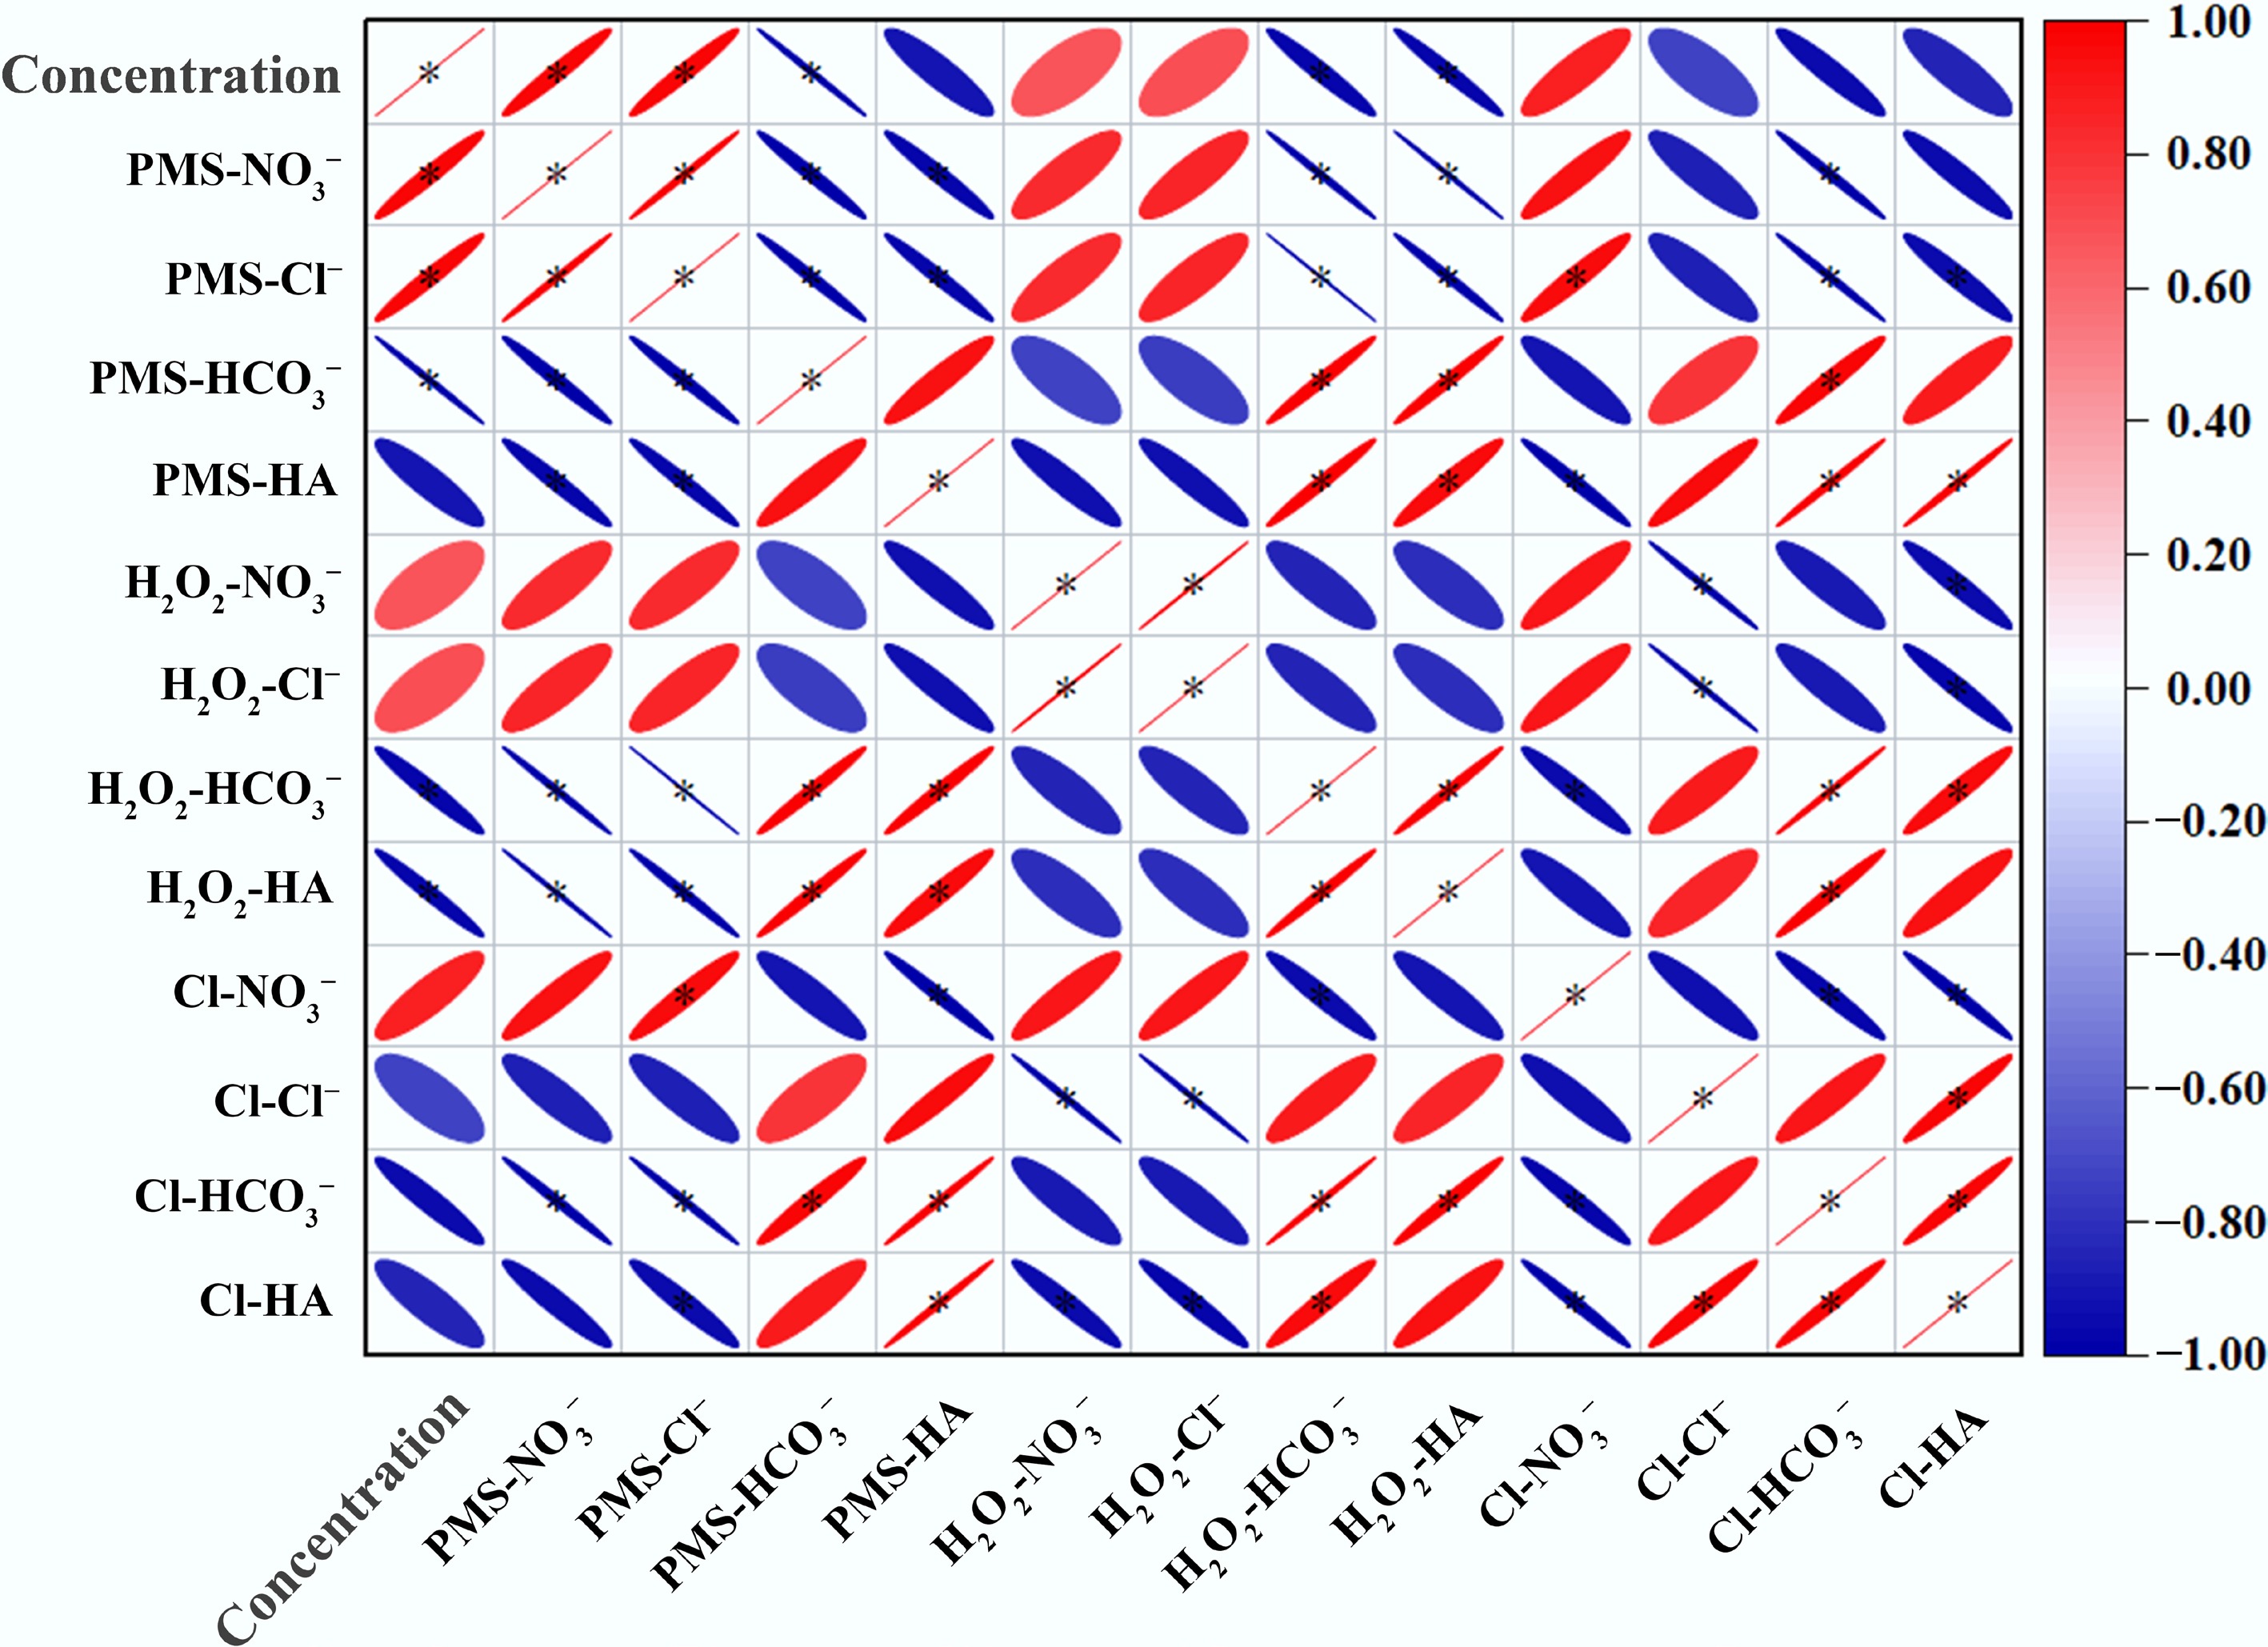
Figure 7.
Pearson correlation analysis of the effect of different concentrations of anions and humic acid (HA) on CBZ degradation. The red and blue colors indicate positive and negative correlations, respectively, and the depth of the color indicates the strength of the correlation. * p ≤ 0.05 indicates a statistically significant correlation.
Figures
(7)
Tables
(0)