-
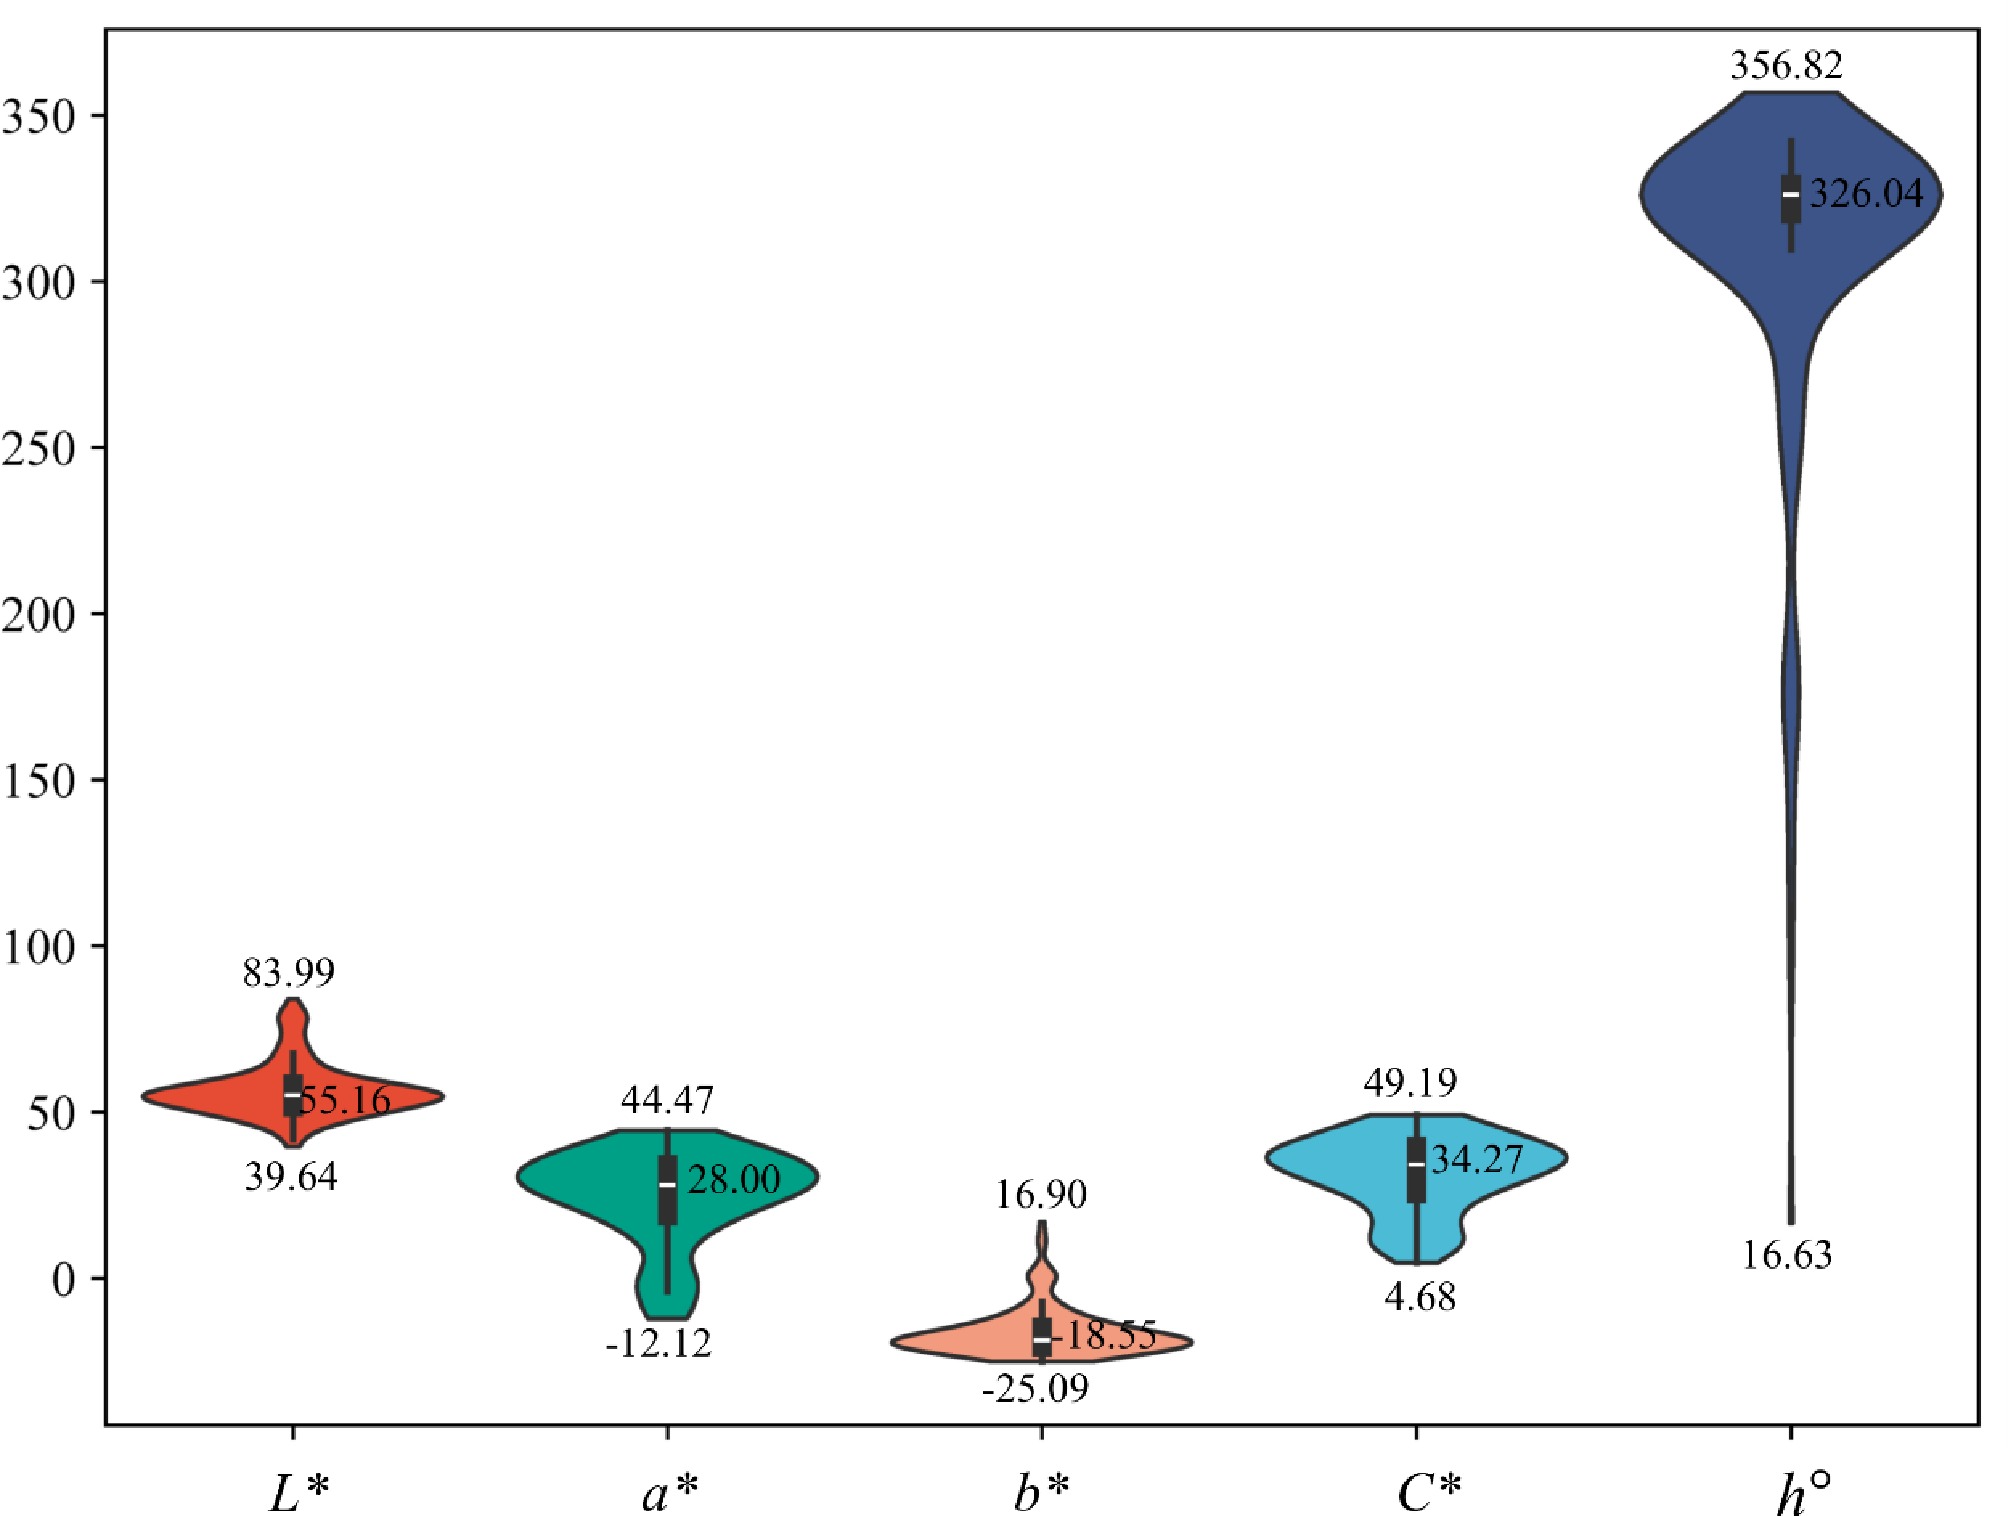
Figure 1.
Distribution of colorimetric parameters measured from 142 floral scans of Phlox, with each scan including five flowers. Violin plots depict the full distribution of L*, a*, b*, C*, and h° values. lightness (L*), green/red (a*), blue/yellow (b*), and chroma (C*) are unitless; hue (h°) is represented numerically in degrees (0°–360°) on chromaticity. Annotated numbers indicate the maximum, median, and minimum values across all samples.
-
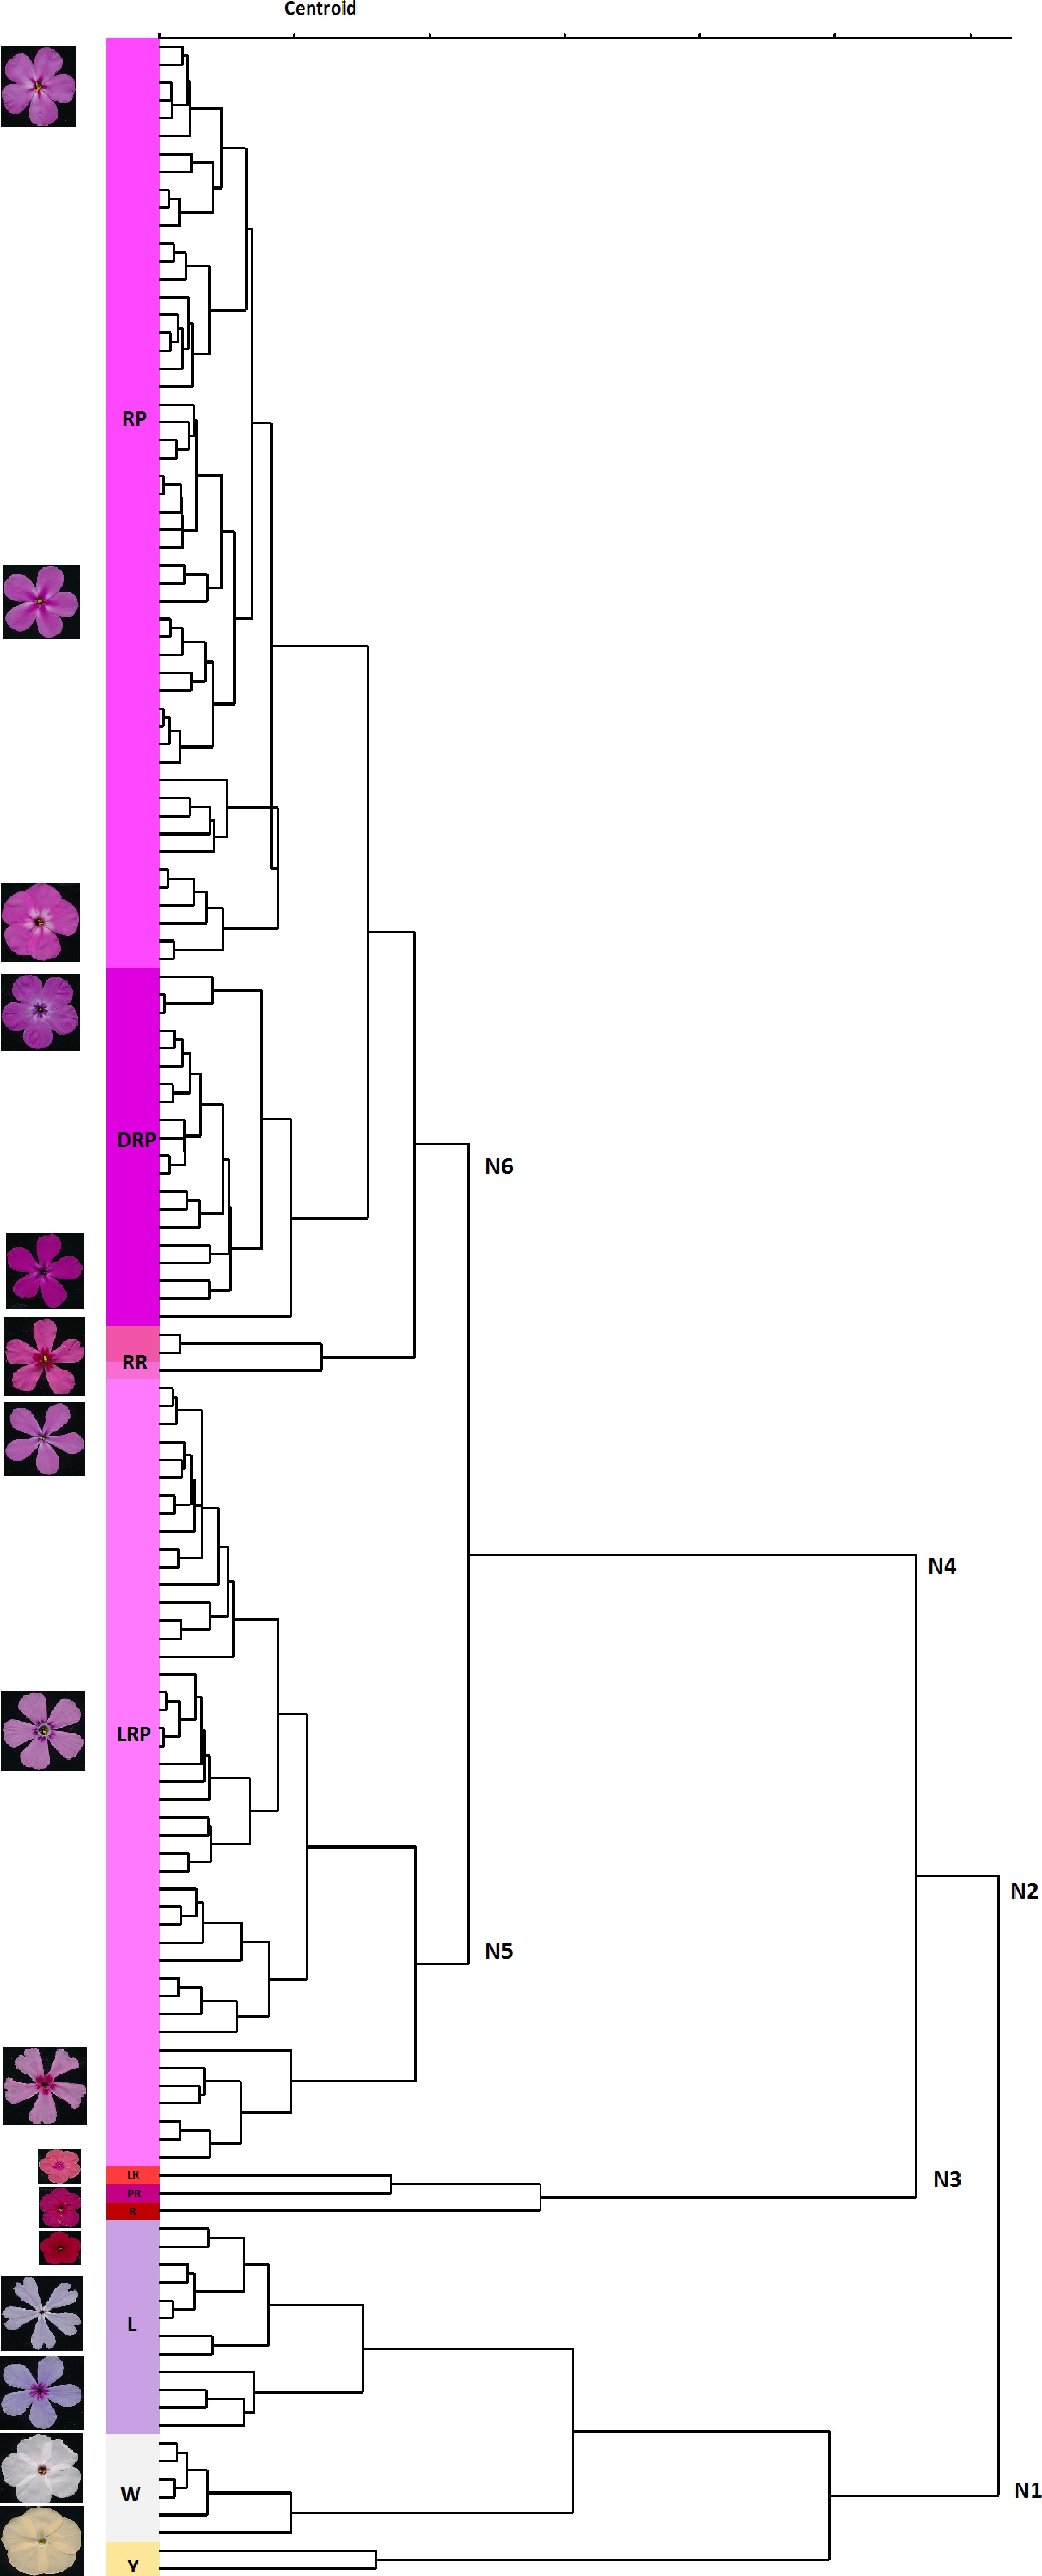
Figure 2.
Dendrogram of Phlox flowers using the L*, a*, and b* colorimetric parameters. Representative flower images illustrate the characteristic appearance of each cluster. Nodes indicate major hierarchical divisions. Color clusters include dark red-purple (DRP), lavender (L), light red (LR), light red-purple (LRP), purple-red (PR), red (R), reddish (RR), red-purple (RP), white (W), and yellow (Y).
-
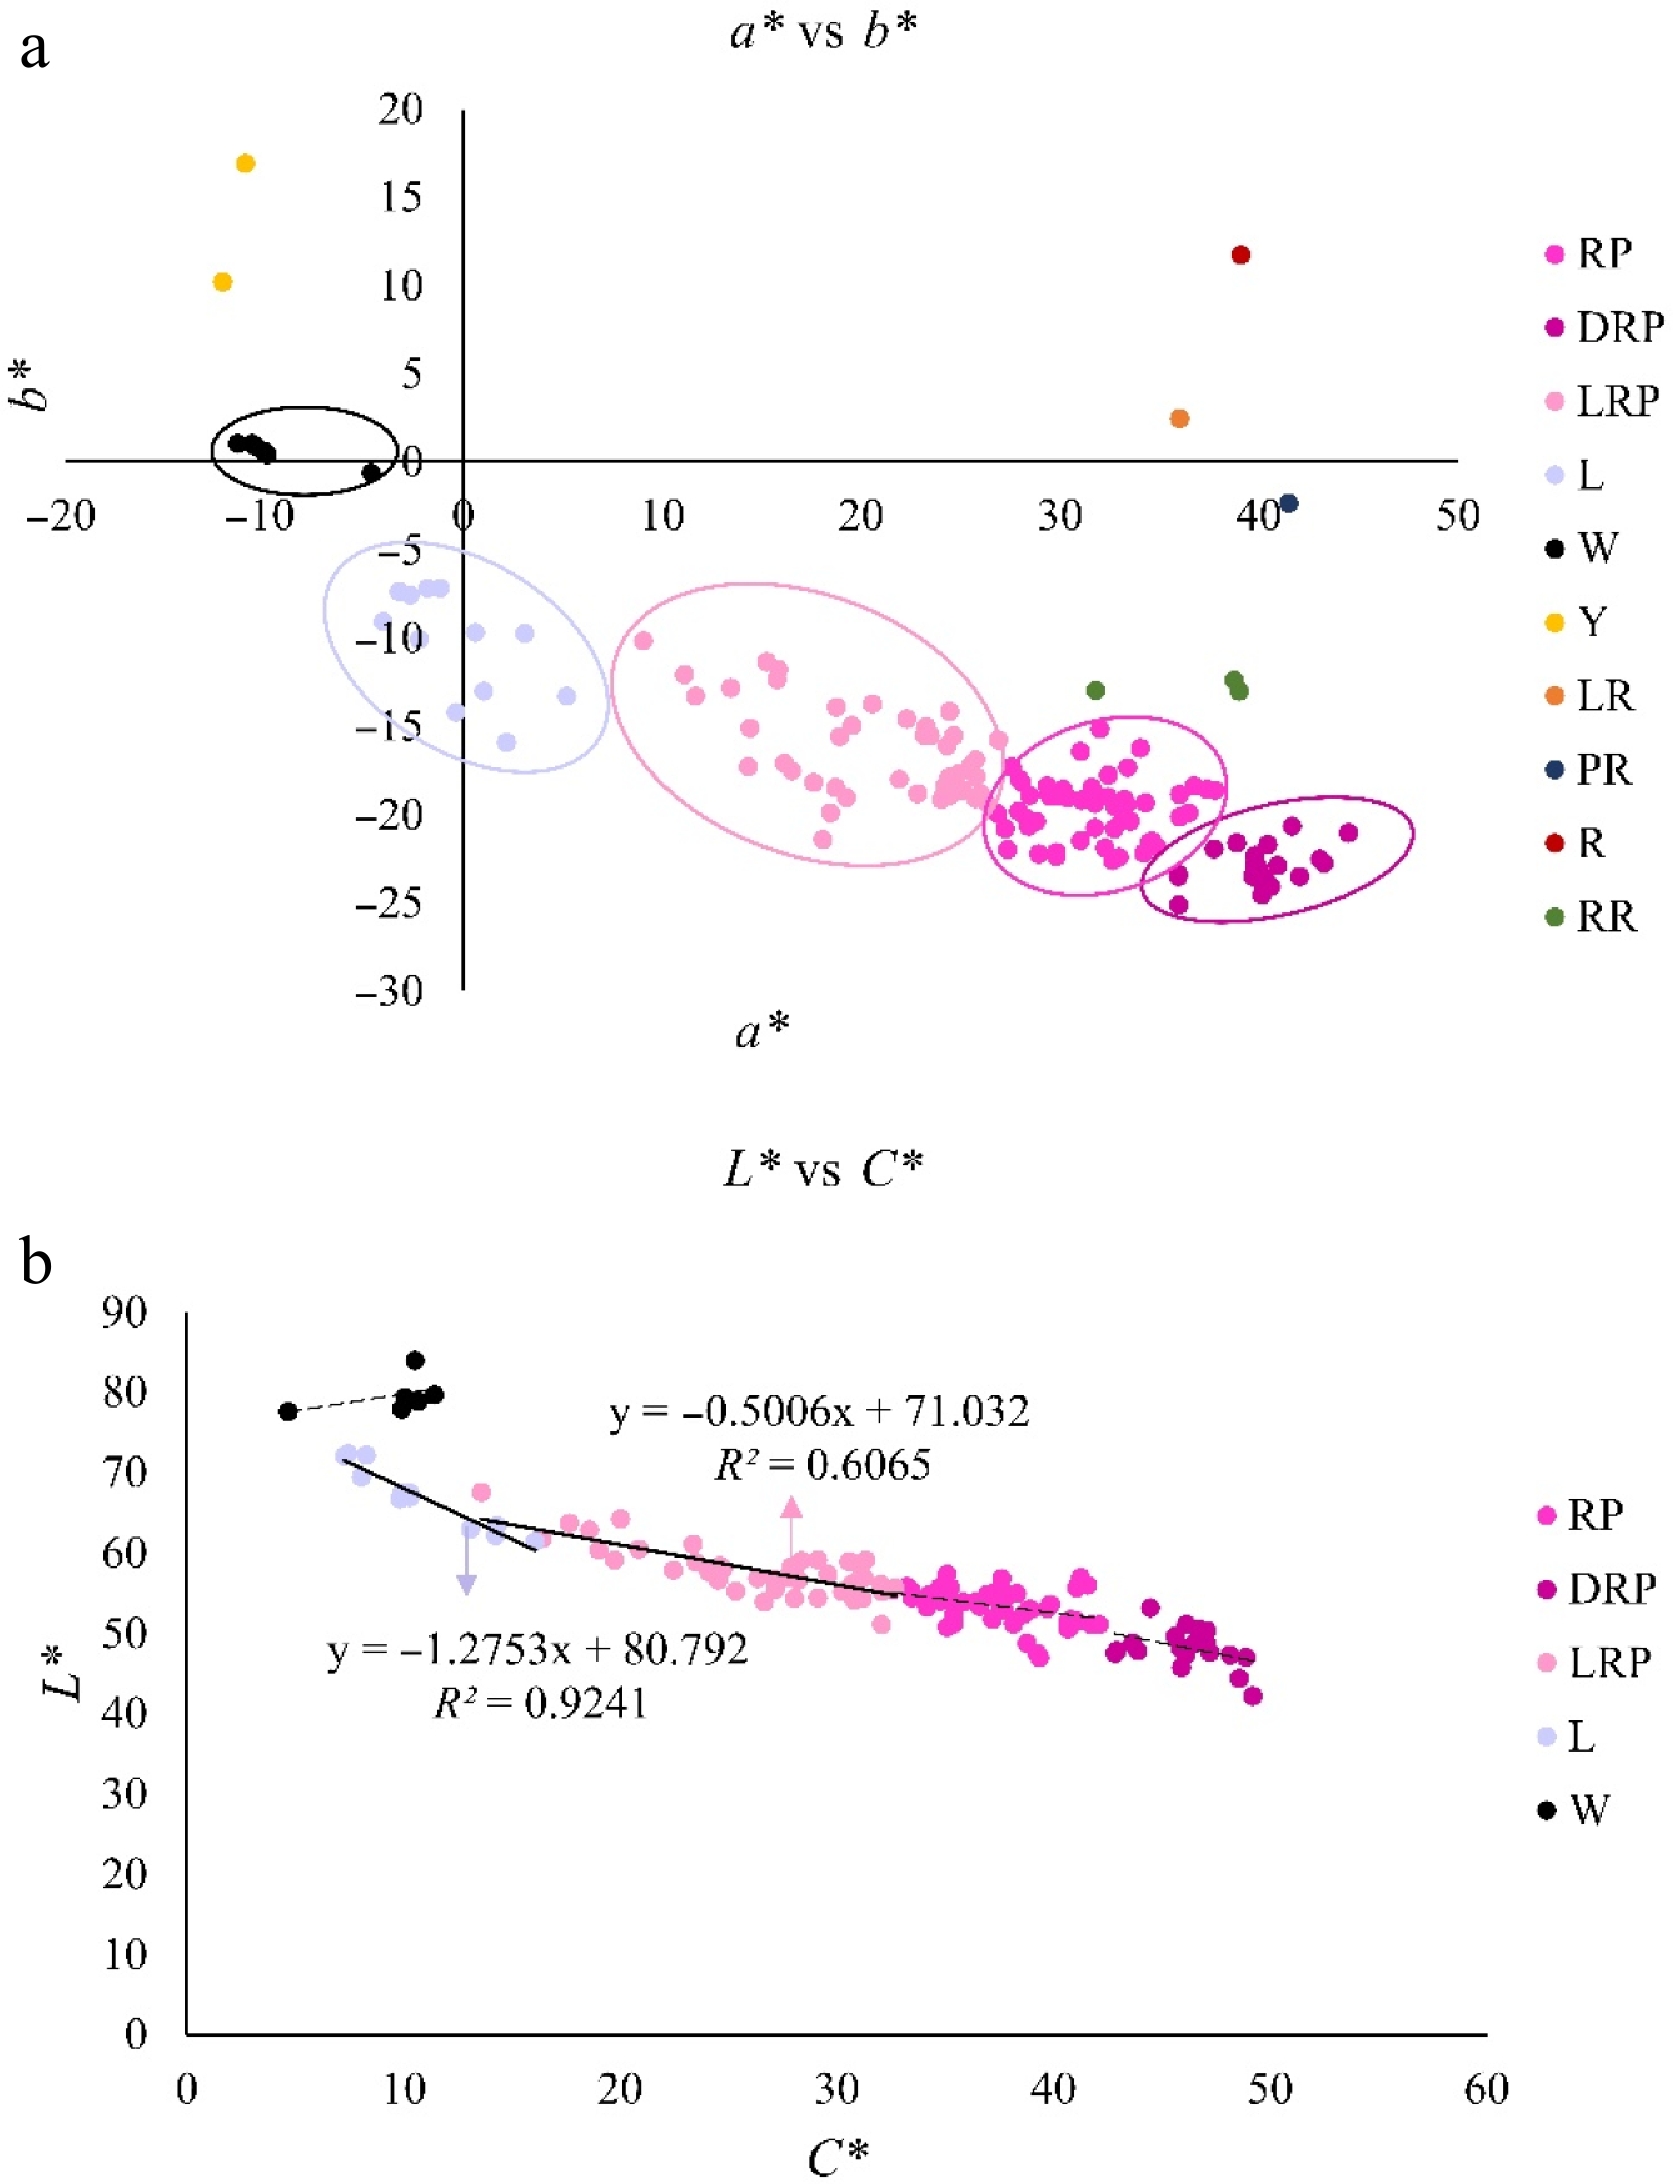
Figure 3.
Distribution and correlation of colorimetric parameters in Phlox flower clusters. (a) Distribution of color clusters based on a* and b* values. (b) Correlation between L* and C* for color clusters with a sample size greater than six. Linear regression lines, fitted equations, and the corresponding coefficient of determination (R2) values are provided. Color clusters include dark red-purple (DRP), lavender (L), light red (LR), light red-purple (LRP), purple-red (PR), red (R), reddish (RR), red-purple (RP), white (W), and yellow (Y).
-
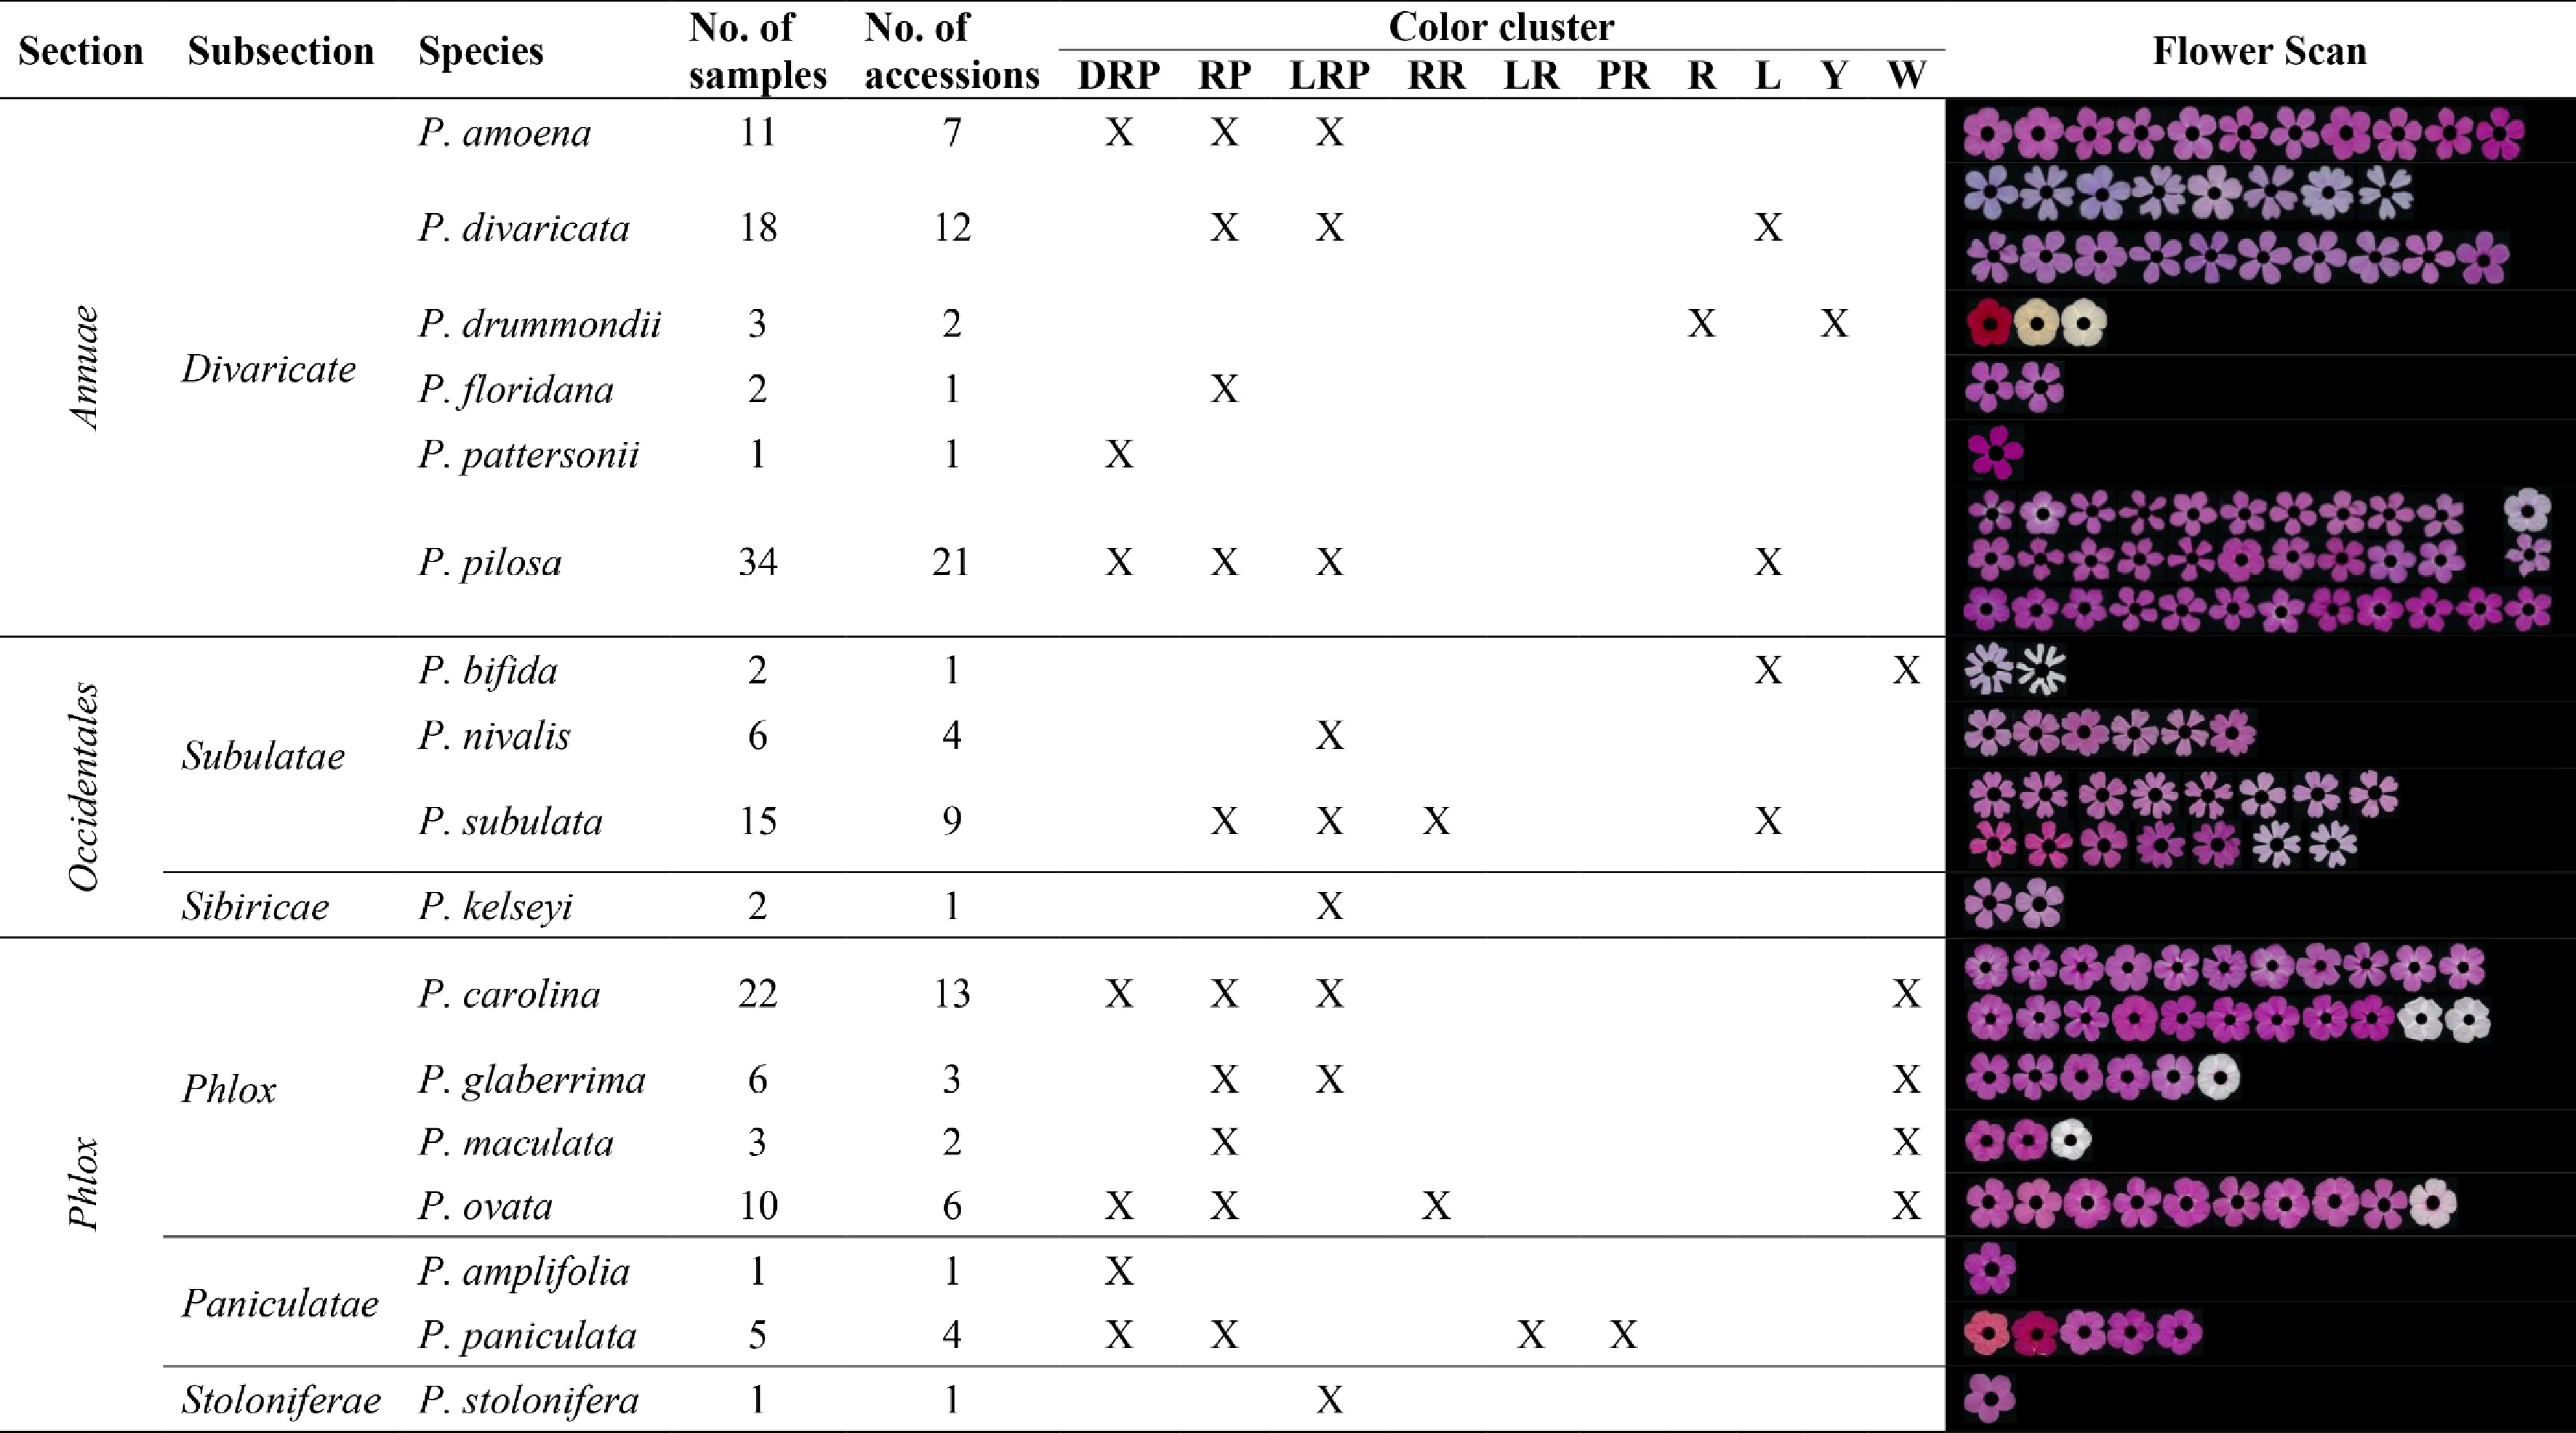
Figure 4.
Phlox species included in this study and their assigned color clusters, determined by hierarchical clustering of the colorimetric parameters. Representative flowers are shown, with the flower eye covered by a black dot to indicate the petal area analyzed. An 'X' indicates samples classified within the corresponding color clusters. Color clusters include dark red-purple (DRP), lavender (L), light red (LR), light red-purple (LRP), purple-red (PR), red (R), reddish (RR), red-purple (RP), white (W), and yellow (Y).
-
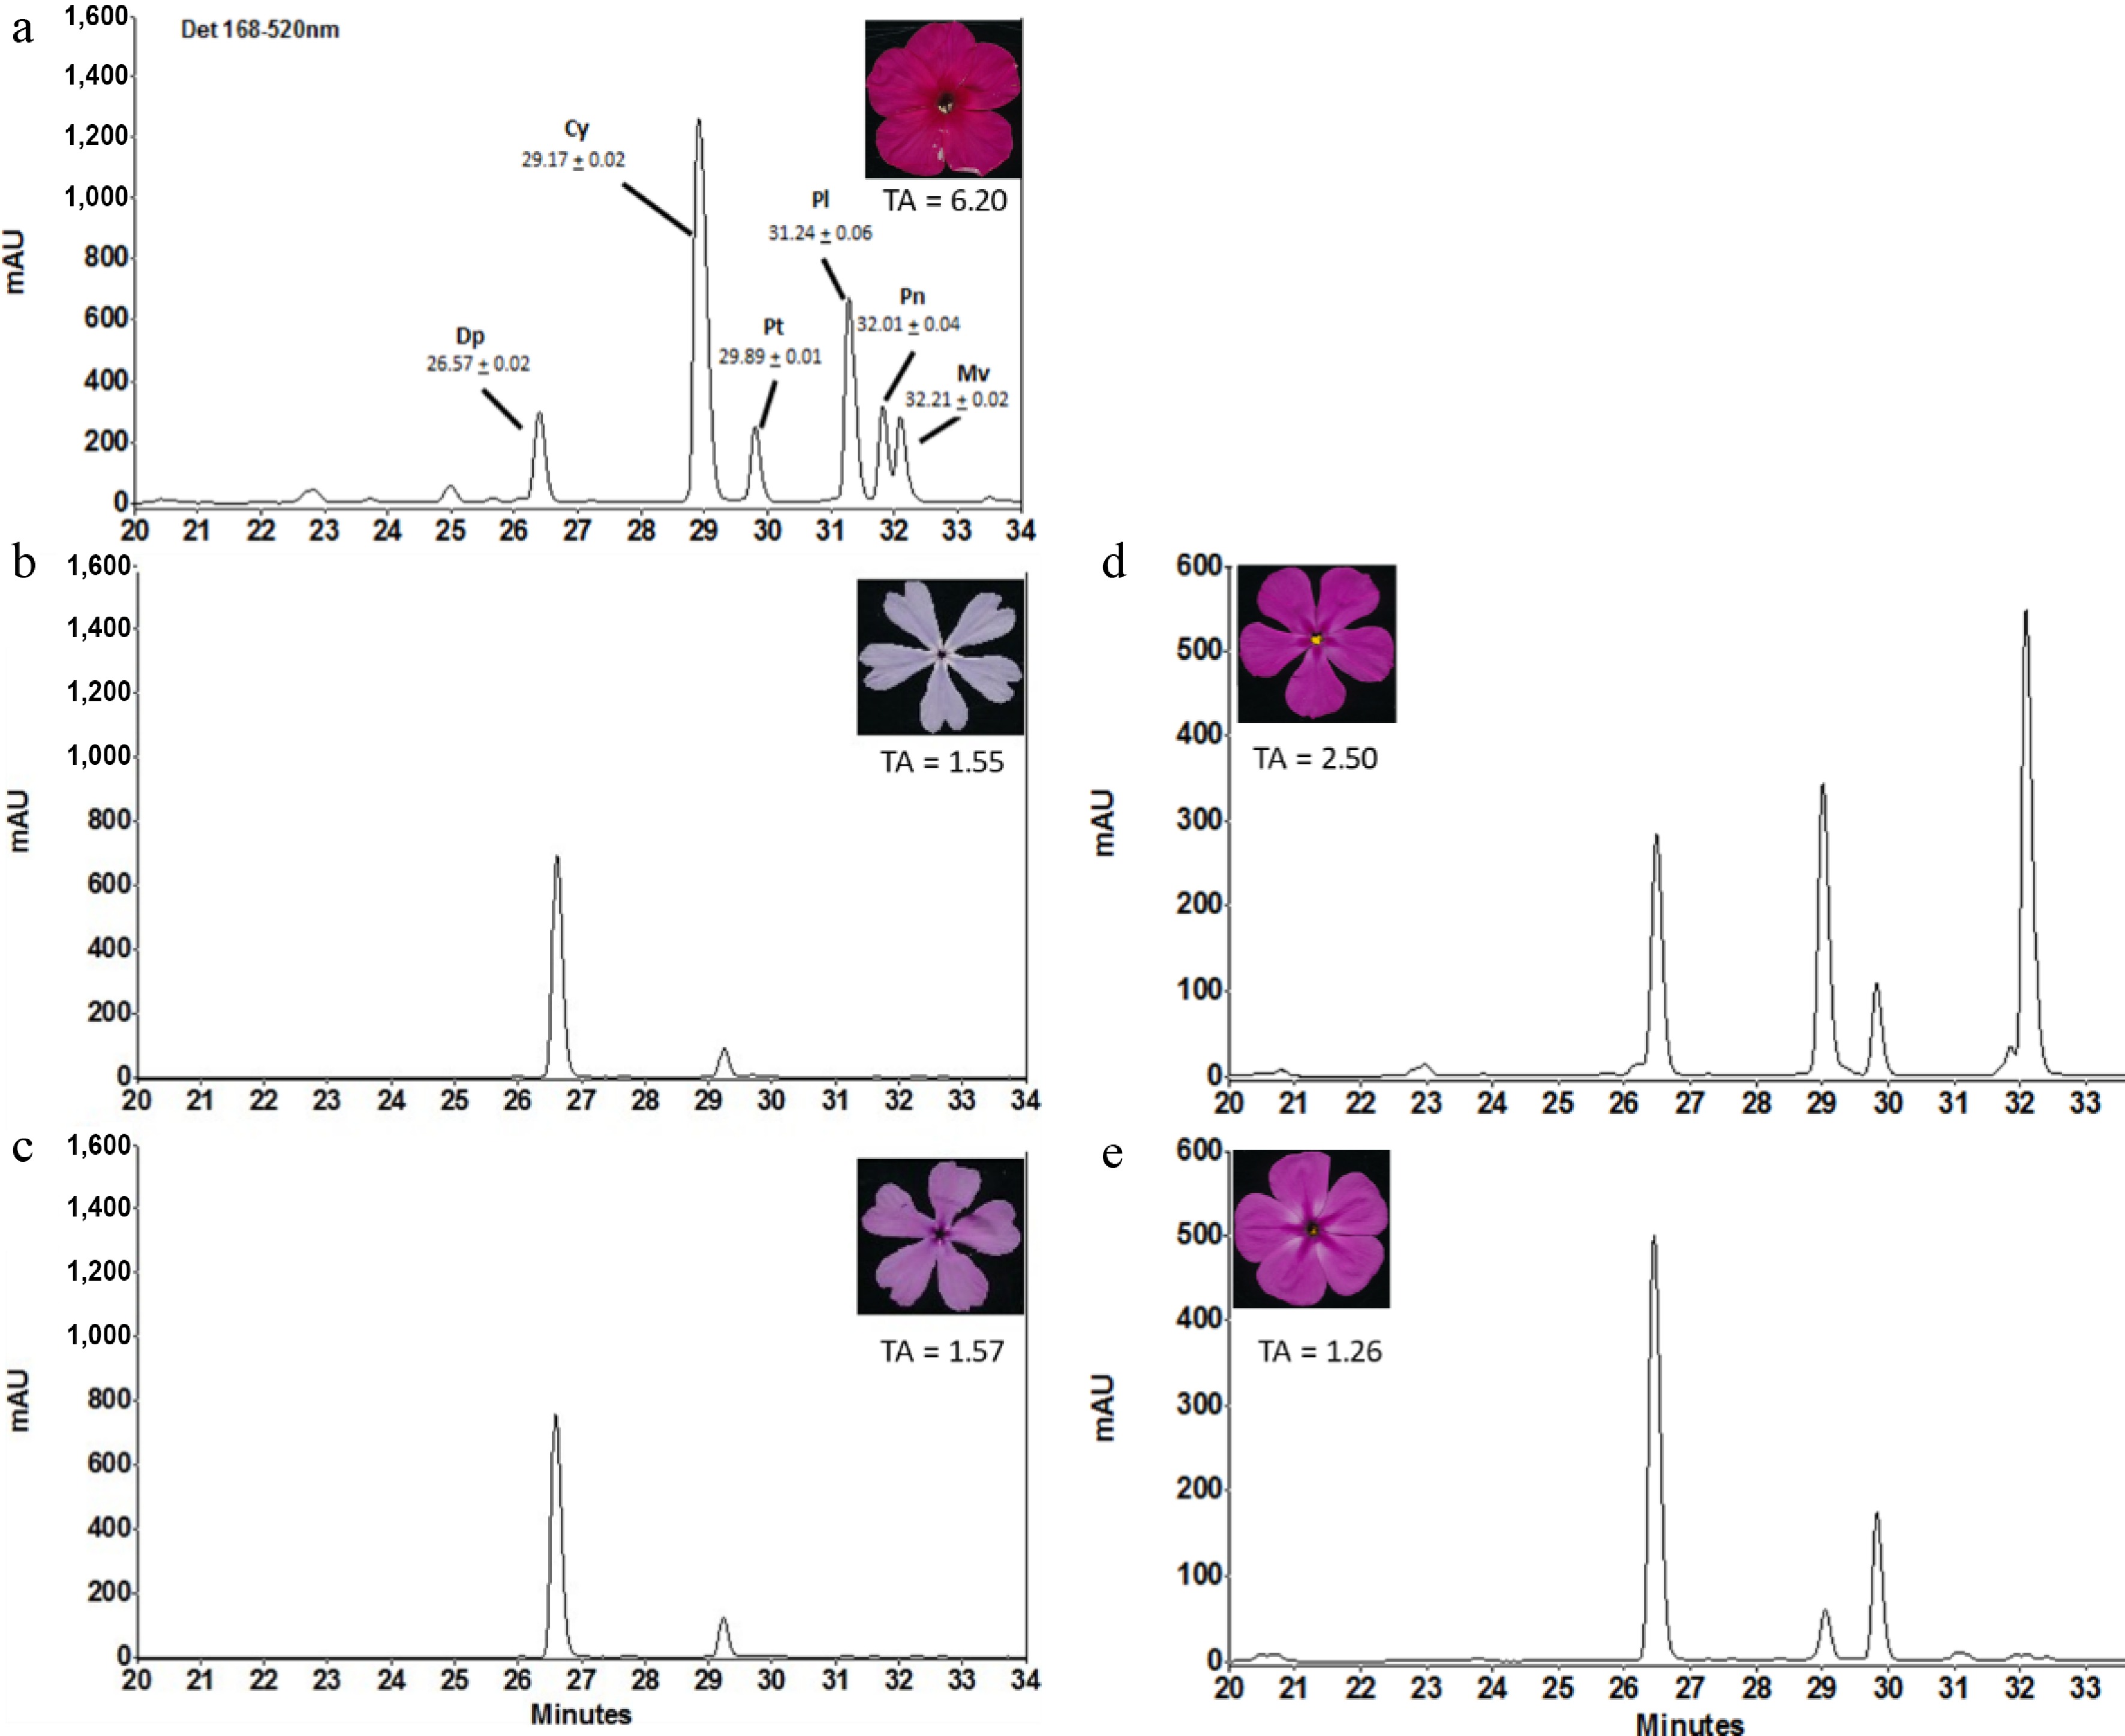
Figure 5.
High-performance liquid chromatography (HPLC) chromatograms illustrating variations in anthocyanidin composition and flower color in Phlox. (a) Representative HPLC chromatogram (P. paniculata, PZ12- 032 p1) showing the separation and identification of individual anthocyanidins detected at 520 nm, including delphinidin (Dp), cyanidin (Cy), petunidin (Pt), peonidin (Pn), pelargonidin (Pl), and malvidin (Mv). (b, c) Two accessions with highly similar anthocyanidin profiles and total anthocyanidins (TA, µg anthocyanidins/mg tissue) but distinct flower colors: (b) P. divaricata (PZ11-008 p1); (c) P. divaricata (PZ10-100 p1). (d, e) Two accessions with similar flower color but contrasting anthocyanidin profiles and total anthocyanidins: (d) P. amoena (PZ12-057 p2); (e) P. carolina (PZ12-047 p2). Images of representative flowers and total anthocyanidins are shown in each panel.
-
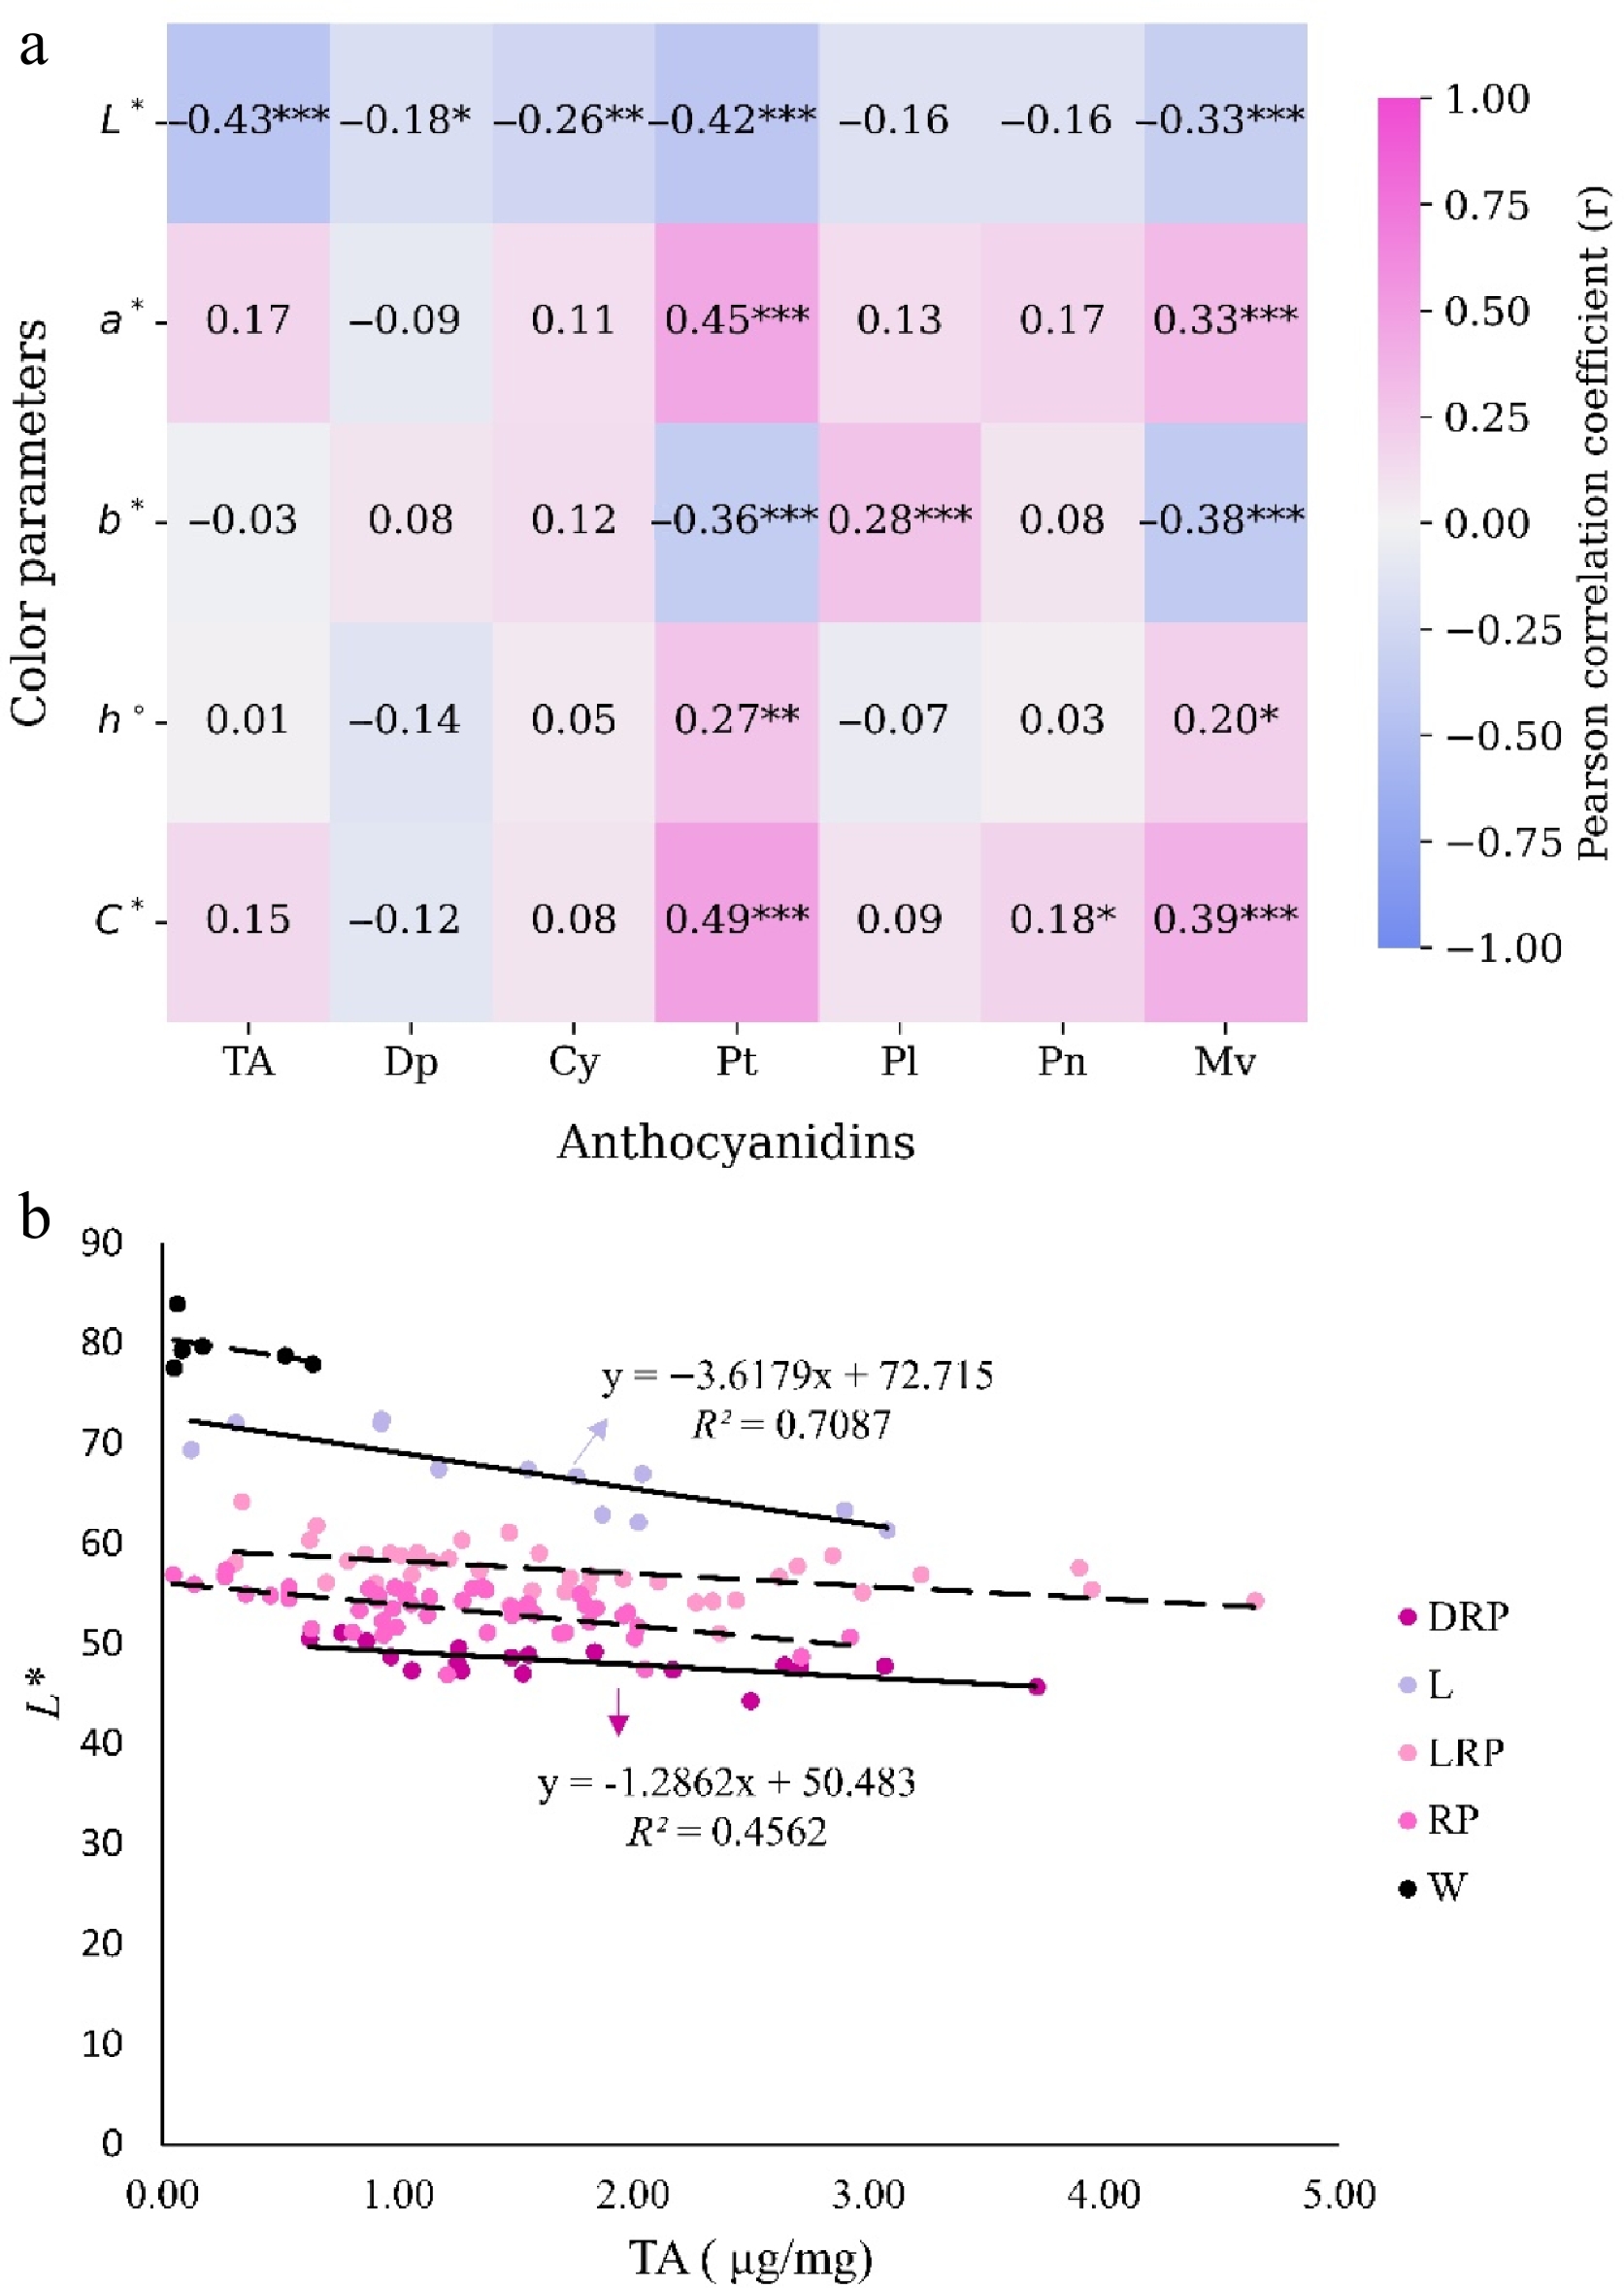
Figure 6.
Relationships between colorimetric parameters and anthocyanidin profiles in Phlox.(a) Heatmap of Pearson correlation coefficients (r) between color coordinates and both total and individual anthocyanidins. Statistical significance is denoted as follows: * p < 0.05, ** p < 0.01, *** p < 0.001. (b) The relationship between total anthocyanidins (TA; µg anthocyanidins/mg tissue) and lightness (L*) across five color clusters. Fitted regression lines and corresponding equations are displayed exclusively for clusters exhibiting a coefficient of determination (R2) > 0.35. Abbreviations: Delphinidin (Dp), cyanidin (Cy), petunidin (Pt), pelargonidin (Pl), peonidin (Pn), malvidin (Mv), dark red-purple (DRP), lavender (L), light red-purple (LRP), red-purple (RP), and white (W).
-
Dendrograma Color clusterb Number of samplesc L* a* b* C* h° 
RP 52 53.4 ± 0.3 31.6 ± 0.4 −19.7 ± 0.2 37.3 ± 0.4 327.9 ± 0.5 DRP 20 48.2 ± 0.5 40.0 ± 0.5 −22.9 ± 0.3 46.2 ± 0.4 330.1 ± 0.5 RR 3 53.2 ± 2.3 36.5 ± 2.4 −12.8 ± 0.2 38.7 ± 2.2 340.5 ± 1.4 LRP 44 57.8 ± 0.5 20.7 ± 0.7 −16.3 ± 0.4 26.5 ± 0.7 321.1 ± 0.9 LR 1 55.7 36.0 2.5 36.1 93.9 PR 1 41.9 41.5 −2.3 41.6 356.8 R 1 39.6 39.1 11.7 41.0 16.6 L 12 67.1 ± 1.1 −29.8 ± 0.8 −10.3 ± 0.9 9.2 ± 1.0 265.3 ± 4.5 W 6 79.6 ± 0.9 −9.5 ± 1.0 0.6 ± 0.3 9.5 ± 1.0 177.9 ± 2.2 Y 2 77.5 ± 1.7 −11.5 ± 0.6 13.6 ± 3.3 18.0 ± 2.2 131.5 ± 8.4 Values are presented as the mean ± standard deviation; for measurements based on a single sample, only the mean is reported. (a) Hierarchical clustering dendrogram of 10 color clusters. (b) Color clusters: Dark red-purple (DRP), lavender (L), light red (LR), light red-purple (LRP), purple-red (PR), red (R), reddish (RR), red-purple (RP), white (W), and yellow (Y). (c) A sample represents a single digital scan, which includes five flowers. Table 1.
Summary of colorimetric parameters and corresponding sample size for each color cluster.
-
Dendrograma Color clusterb Number of Samplesc Anthocyanidin relative abundance (peak area %)d TAf Dpe Cye Pte Ple Pne Mve 
RP 50 49.4 ± 31.3 20.0 ± 11.7 7.4 ± 7.0 0 1.0 ± 3.0 22.2 ± 20.9 1.2 ± 0.6 DRP 18 35.3 ± 24.0 19.8 ± 7.9 12.4 ± 6.7 0.2 ± 0.9 2.1 ± 4.3 30.1 ± 21.3 1.7 ± 0.9 RR 3 34.0 ± 56.4 65.1 ± 56.4 0 0 0 0 1.6 ± 1.1 LRP 39 63.1 ± 24.6 23.7 ± 13.7 − 0 0.3 ± 0.9 9.7 ± 19.2 1.8 ± 1.0 LR 1 4.3 32.2 4.0 46.3 7.9 5.4 1.0 PR 1 9.9 47.4 7.5 18.7 8.4 8.1 6.2 R 1 81.0 19.0 0 0 0 0 5.4 L 12 76.2 ± 10.3 22.8 ± 10.6 0.7 ± 1.7 0 0.2 ± 0.5 0.3 ± 1.0 1.6 ± 0.9 W 6 21.3 ± 29.0 54.2 ± 33.0 1.3 ± 3.2 0 8.7 ± 7.0 14.4 ± 13.5 0.2 ± 0.3 Y NA NA NA NA NA NA NA NA Values are represented as the mean ± standard deviation; for measurements based on a single sample, only the mean is reported. (a) Hierarchical clustering dendrogram of 10 color clusters. (b) Color clusters: Dark red-purple (DRP), lavender (L), light red (LR), light red-purple (LRP), purple-red (PR), red (R), reddish (RR), red-purple (RP), white (W), and yellow (Y). (c) A sample represents a single digital scan, which includes five flowers. (d) Peak area % is a normalized measure representing the relative abundance (percentage) of each anthocyanidin within a sample. (e) Six common anthocyanidins: Delphinidin (Dp), cyanidin (Cy), petunidin (Pt), pelargonidin (Pl), peonidin (Pn), and malvidin (Mv). (f) TA: total anthocyanidins (µg anthocyanidins/mg tissue). Table 2.
Relative abundance of individual and total anthocyanidins across 10 clusters, quantified using HPLC.
-
Colorimetric parameter Regression modela Adjusted R2 L* 51.9436 – 1.9546 ln(Dp) – 0.6396 ln(Pt) – 3.9944(Mv) 0.3835 a* 37.3184 + 1.9858 ln(Dp) + 1.9069 ln(Pt) 0.2914 b* –20.1089 – 0.4883 ln(Pt) – 1.3552 ln(Dp) – 8.8197(Mv) + 4.0881(Mv2) 0.4347 C* 42.3357 + 1.6979 ln(Pt) + 1.1835 ln(Dp) 0.3057 h° 348.2936 + 12.6019 ln(Dp) + 2.6938 ln(Pt) – 10.3791(Dp) 0.3637 (a) Delphinidin (Dp), petunidin (Pt), and malvidin (Mv). Table 3.
Stepwise multiple regression models using anthocyanidin content to explain variation in colorimetric parameters.
Figures
(6)
Tables
(3)