-
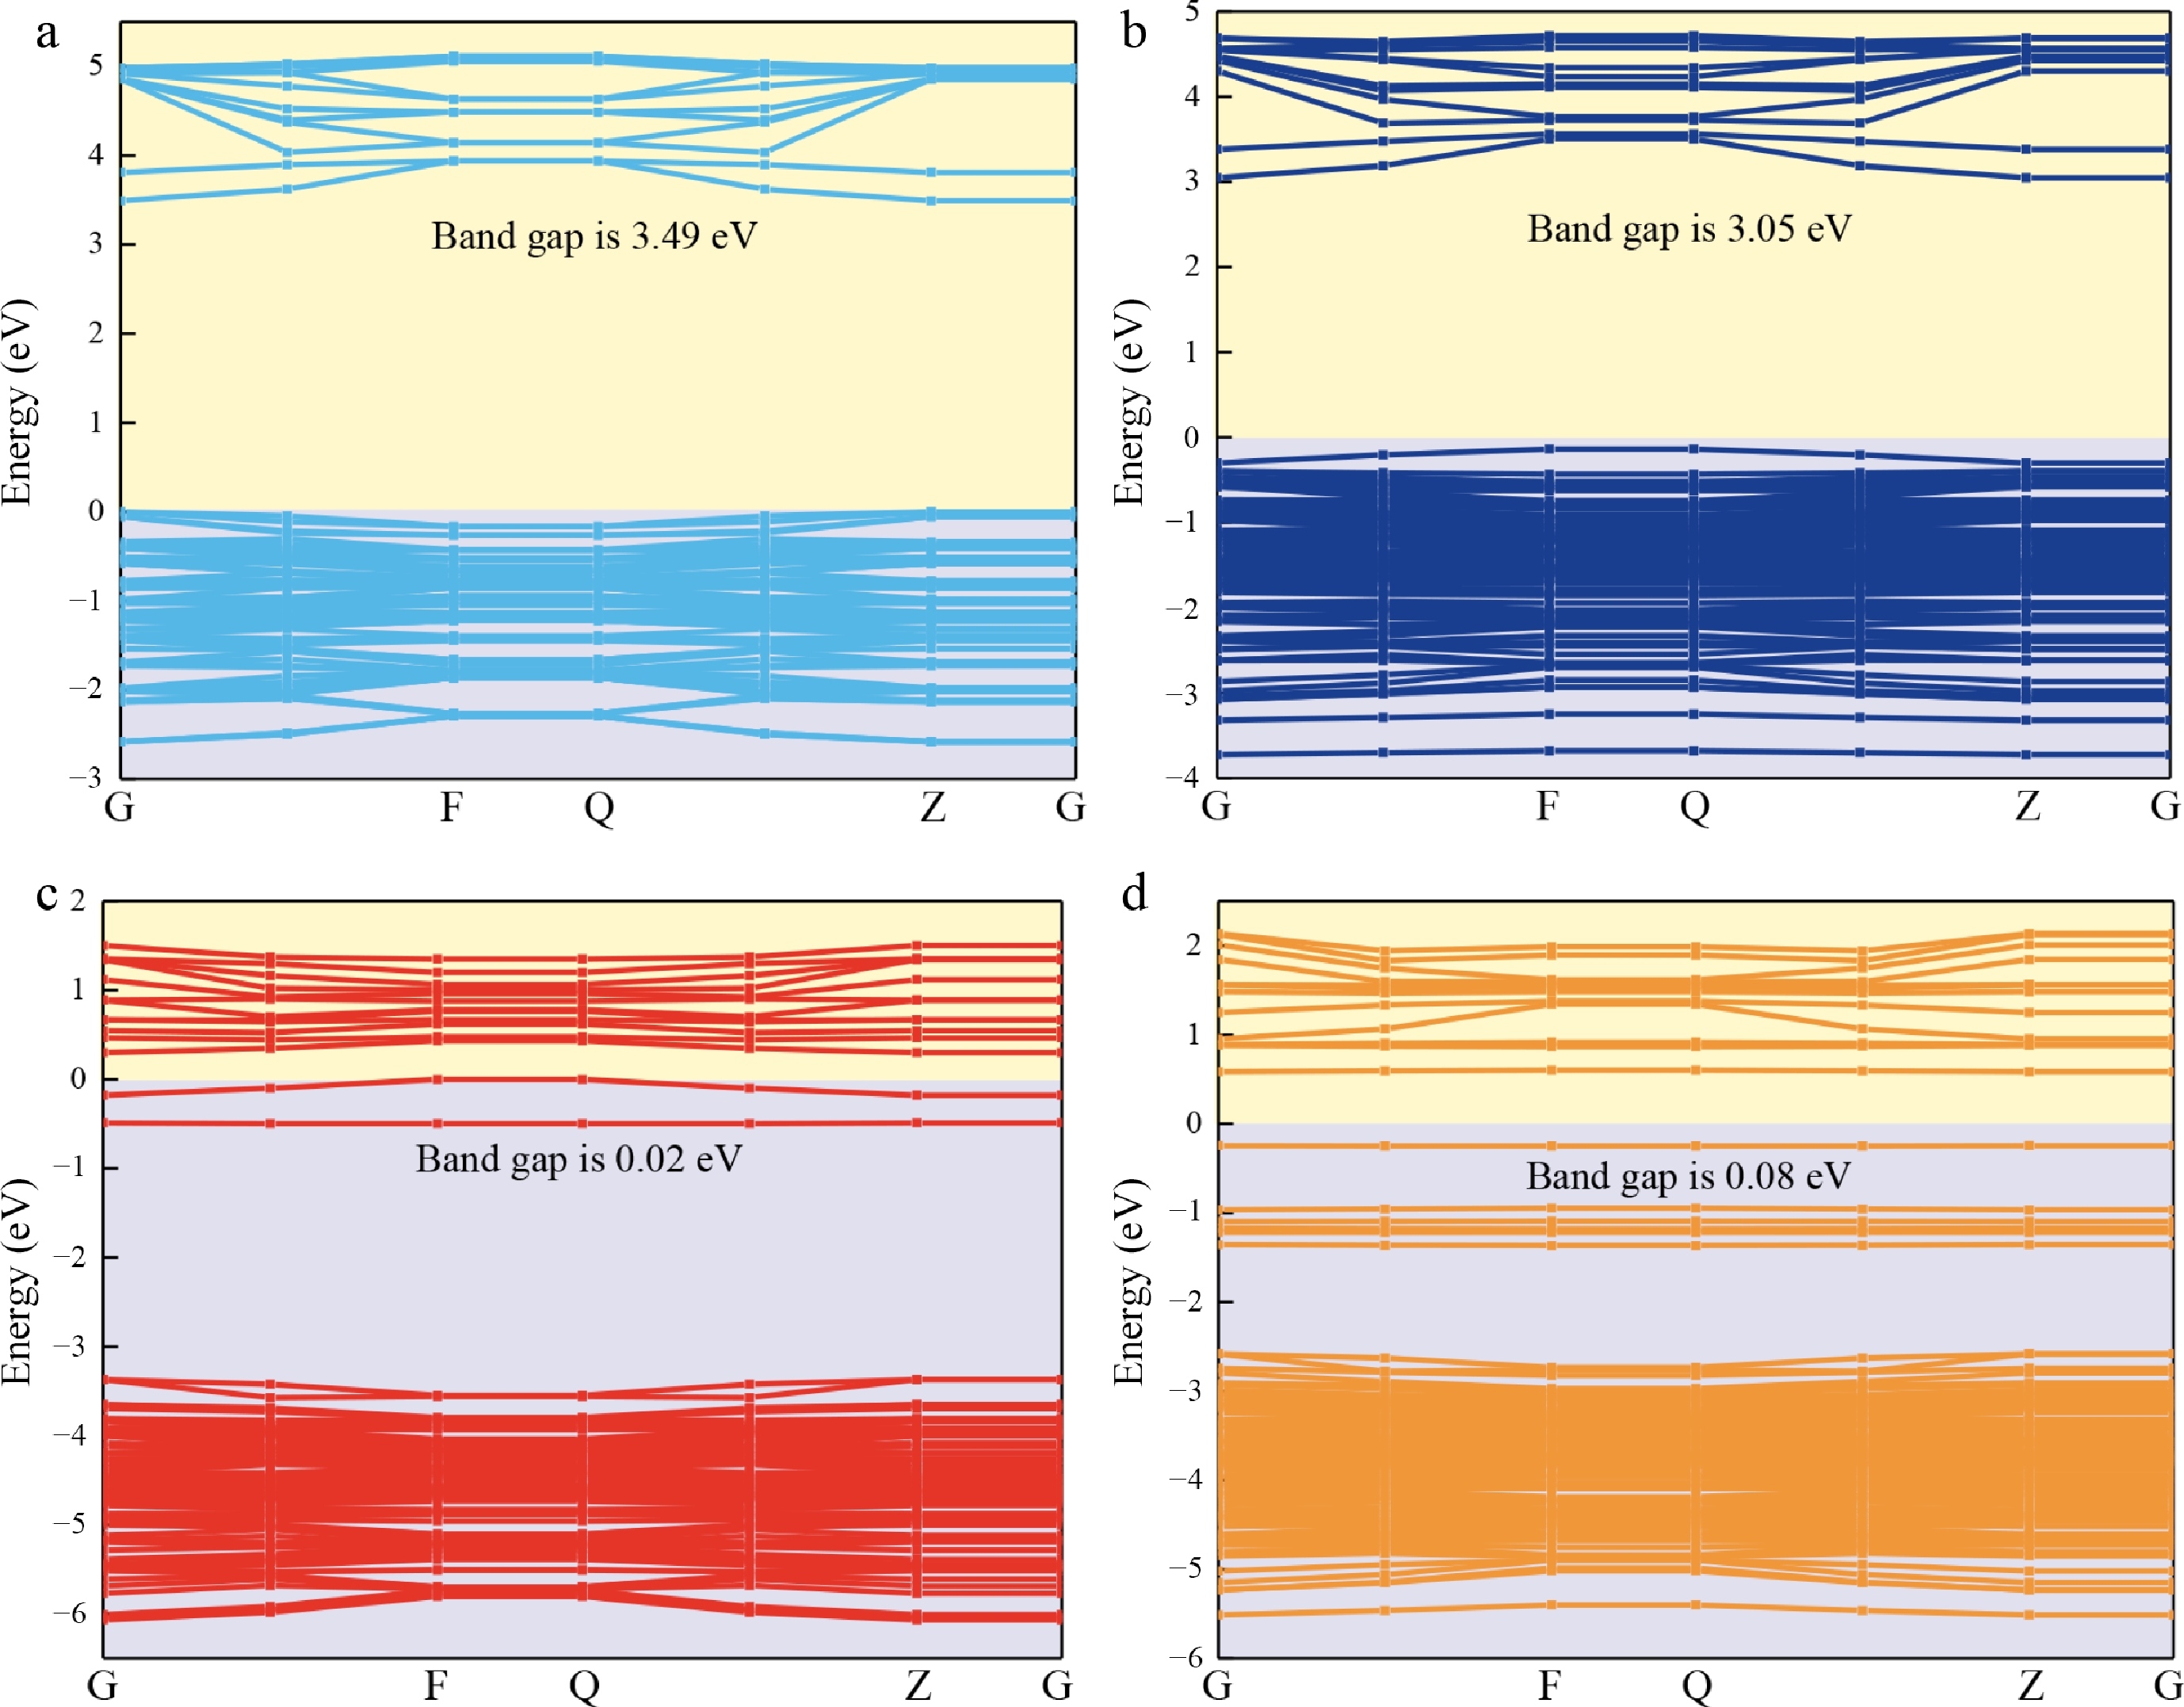
Figure 1.
Calculated band structure of (a) CaO, (b) Ni-CaO, (c) Ce-CaO, and (d) Ni-Ce-CaO surfaces.
-
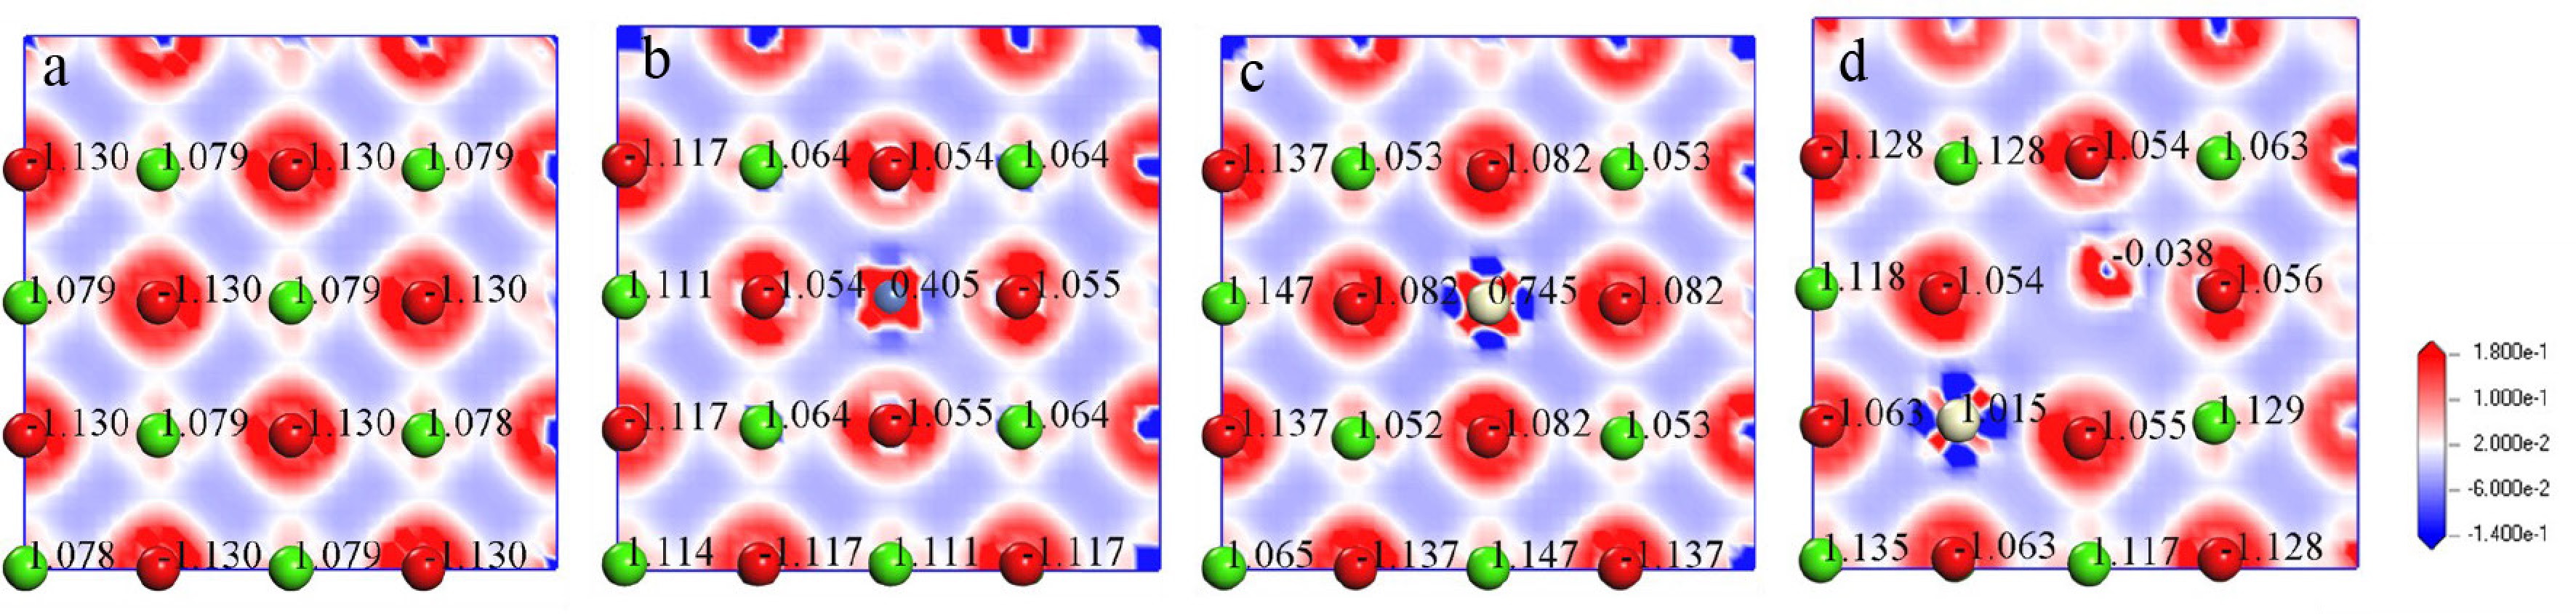
Figure 2.
Electron density difference and Mulliken charge population of (a) CaO, (b) Ni-CaO, (c) Ce-CaO, and (d) Ni-Ce-CaO surfaces.
-
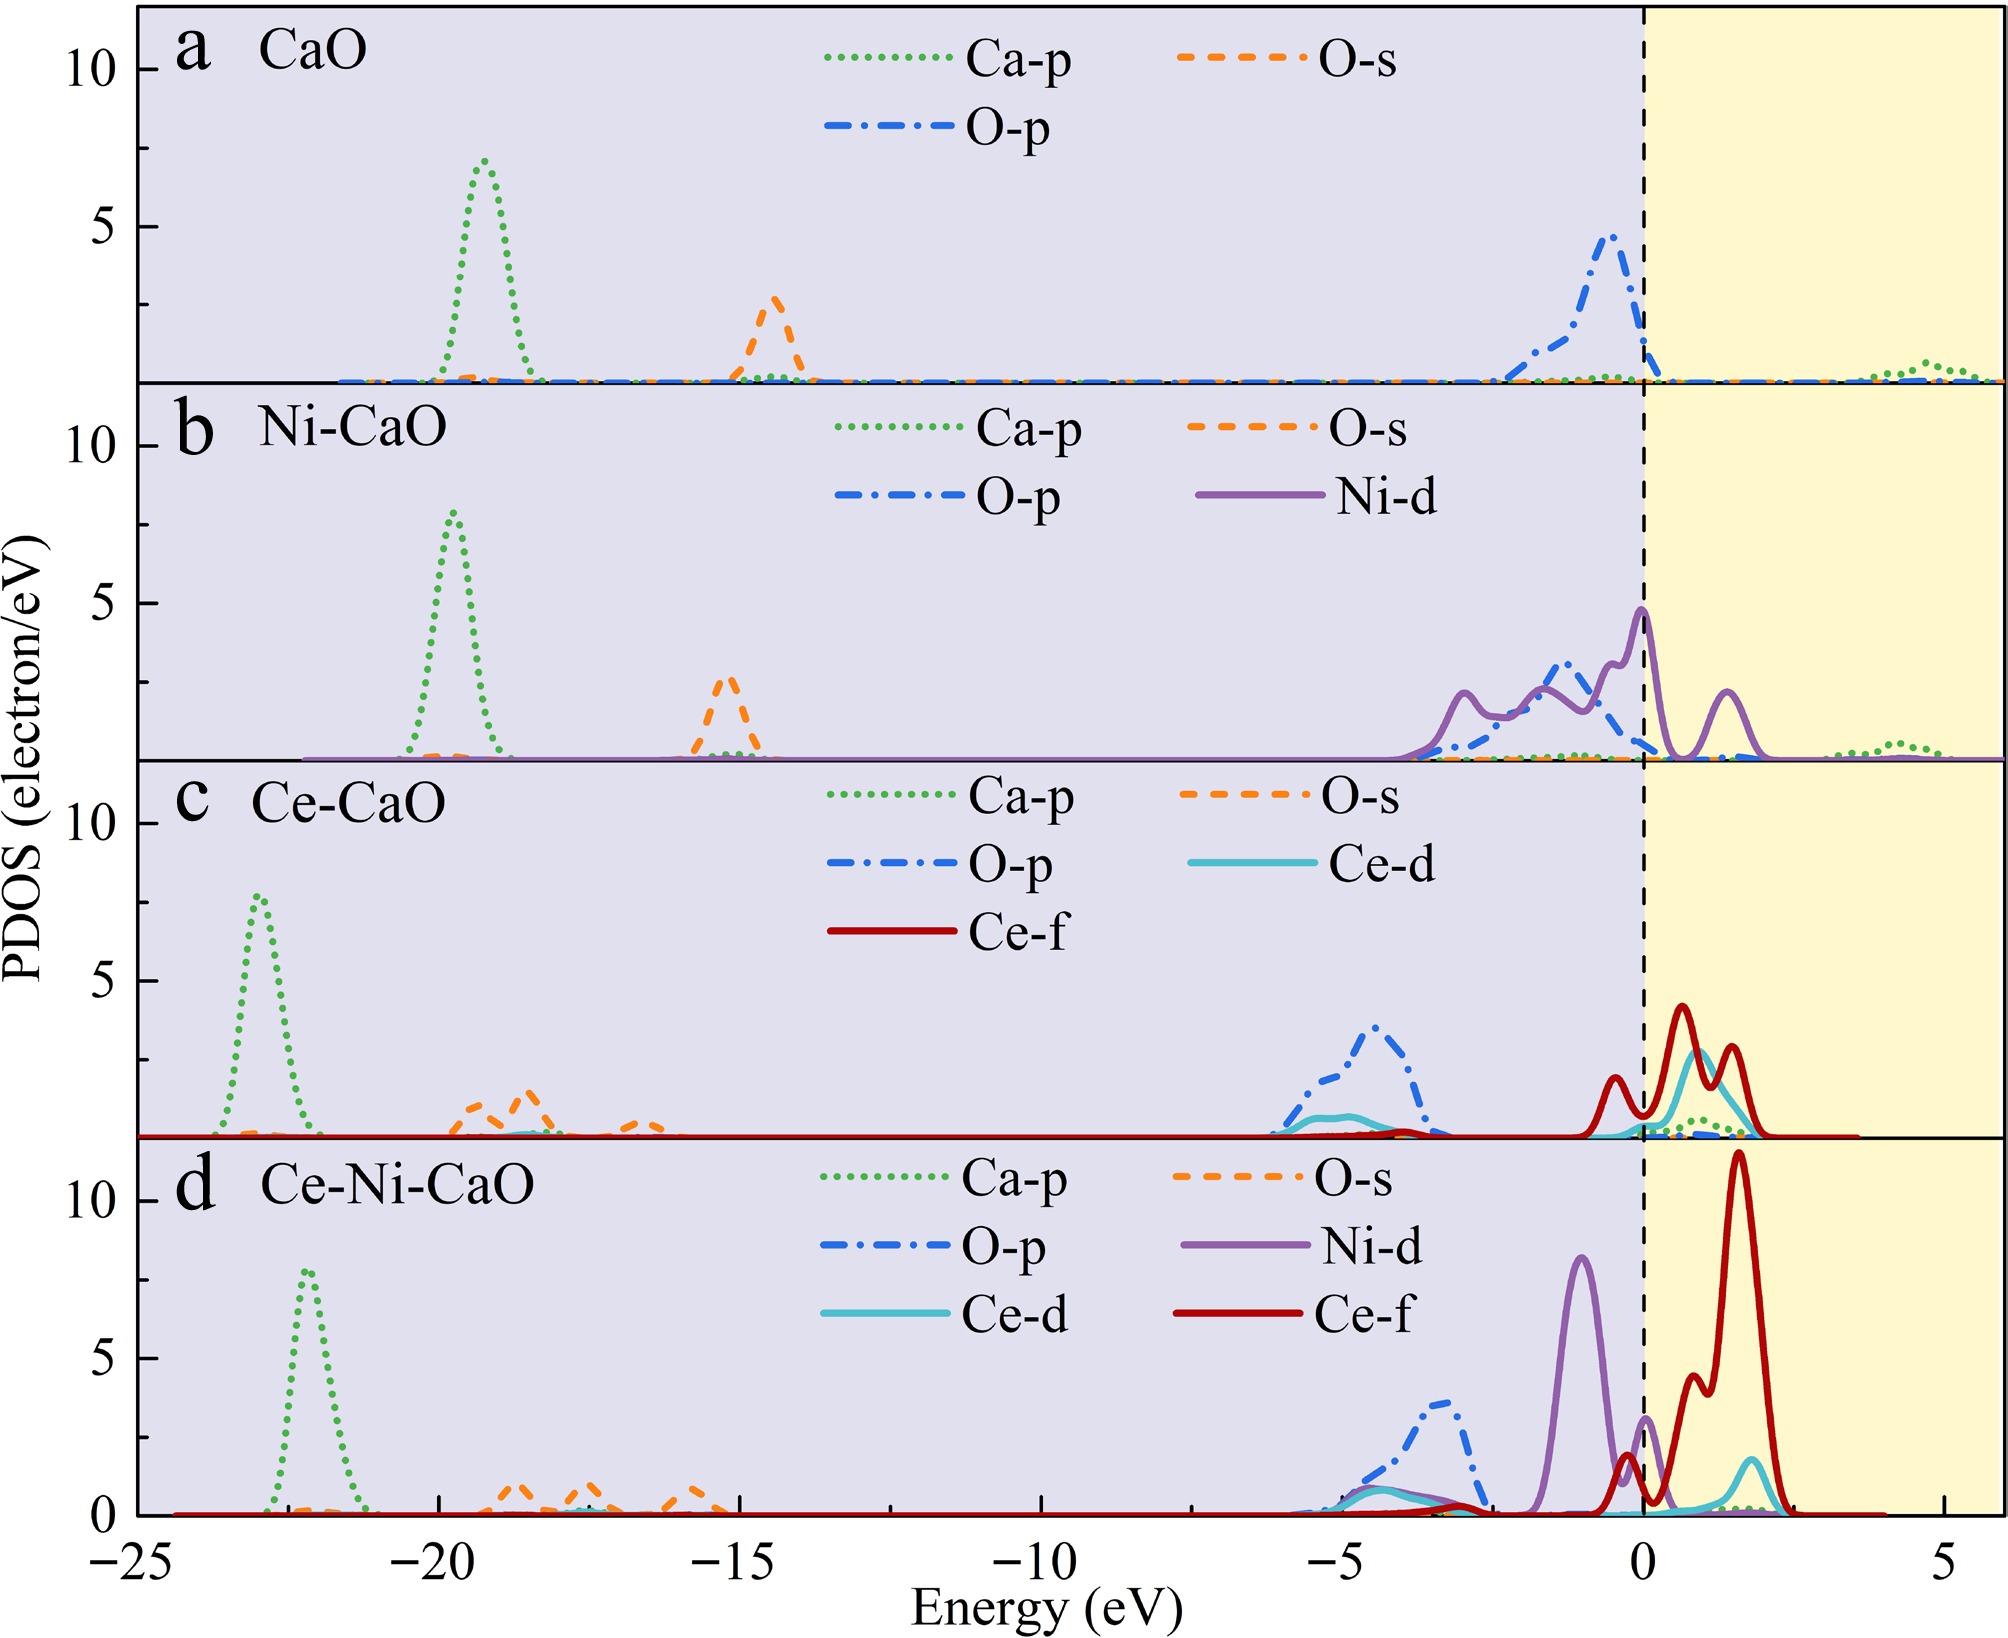
Figure 3.
PDOS of (a) CaO, (b) Ni-CaO, (c) Ce-CaO, and (d) Ni-Ce-CaO surfaces.
-
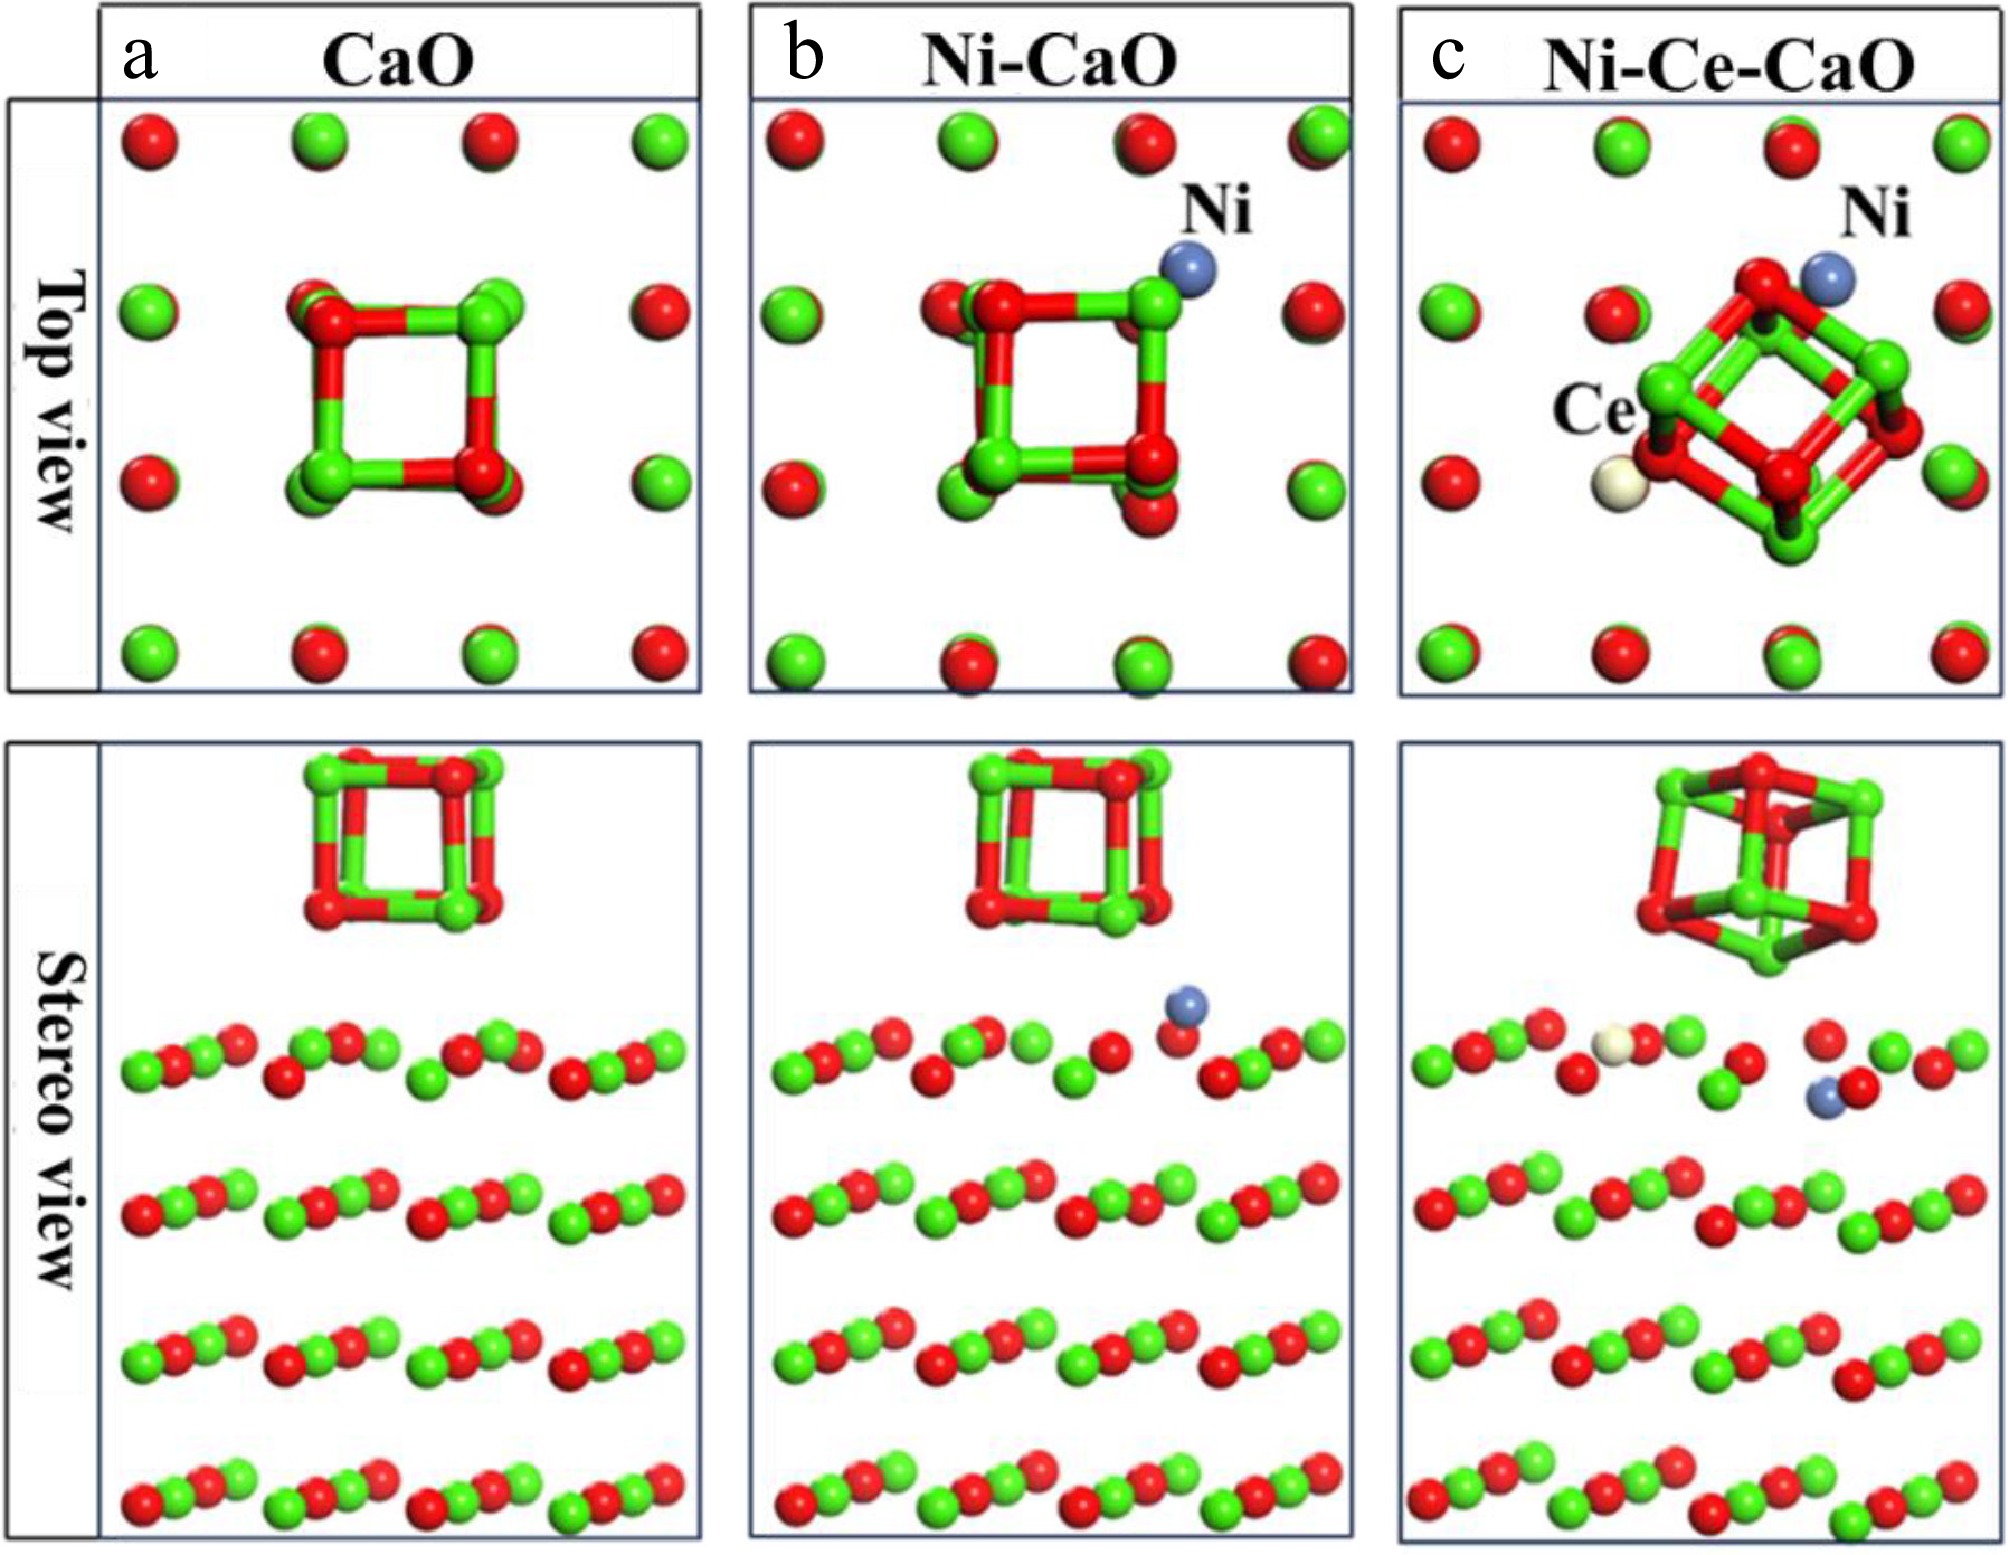
Figure 4.
Adsorption configurations of the Ca4O4 cluster on (a) CaO, (b) Ni-CaO, and (c) Ni-Ce-CaO surfaces.
-
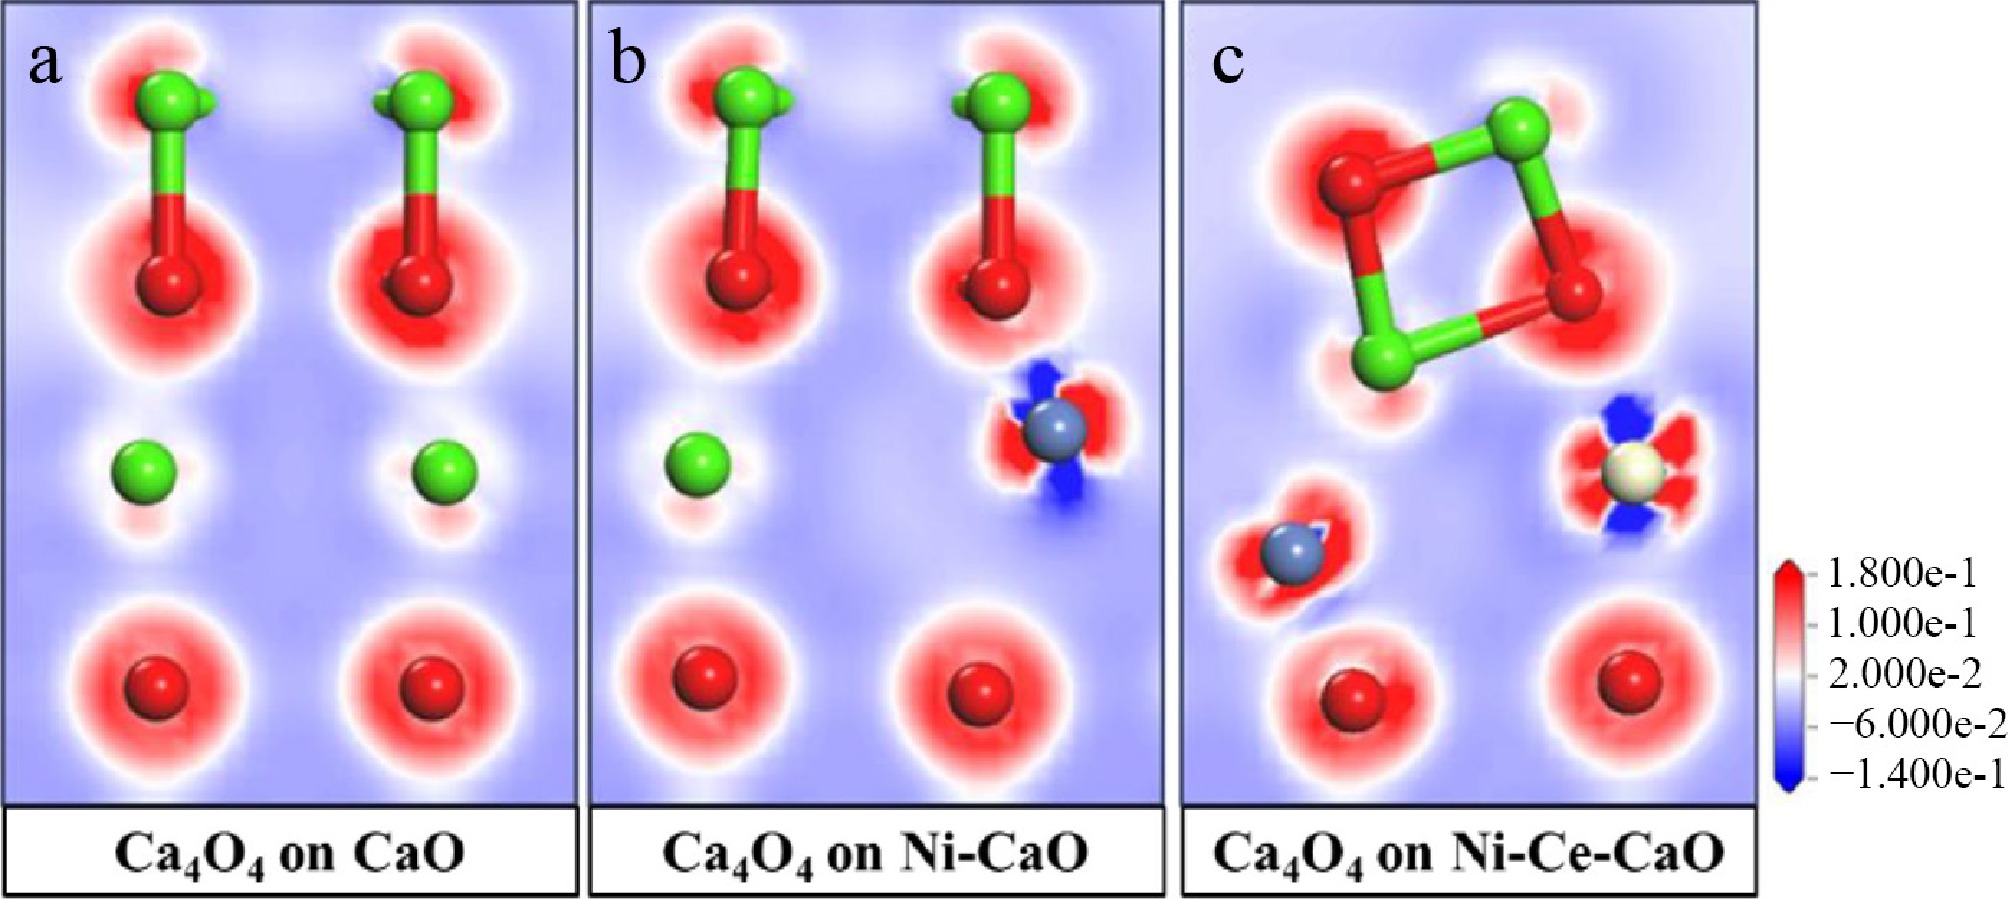
Figure 5.
Electron density difference of Ca4O4 cluster adsorption on (a) CaO, (b) Ni-CaO, and (c) Ni-Ce-CaO surfaces.
-
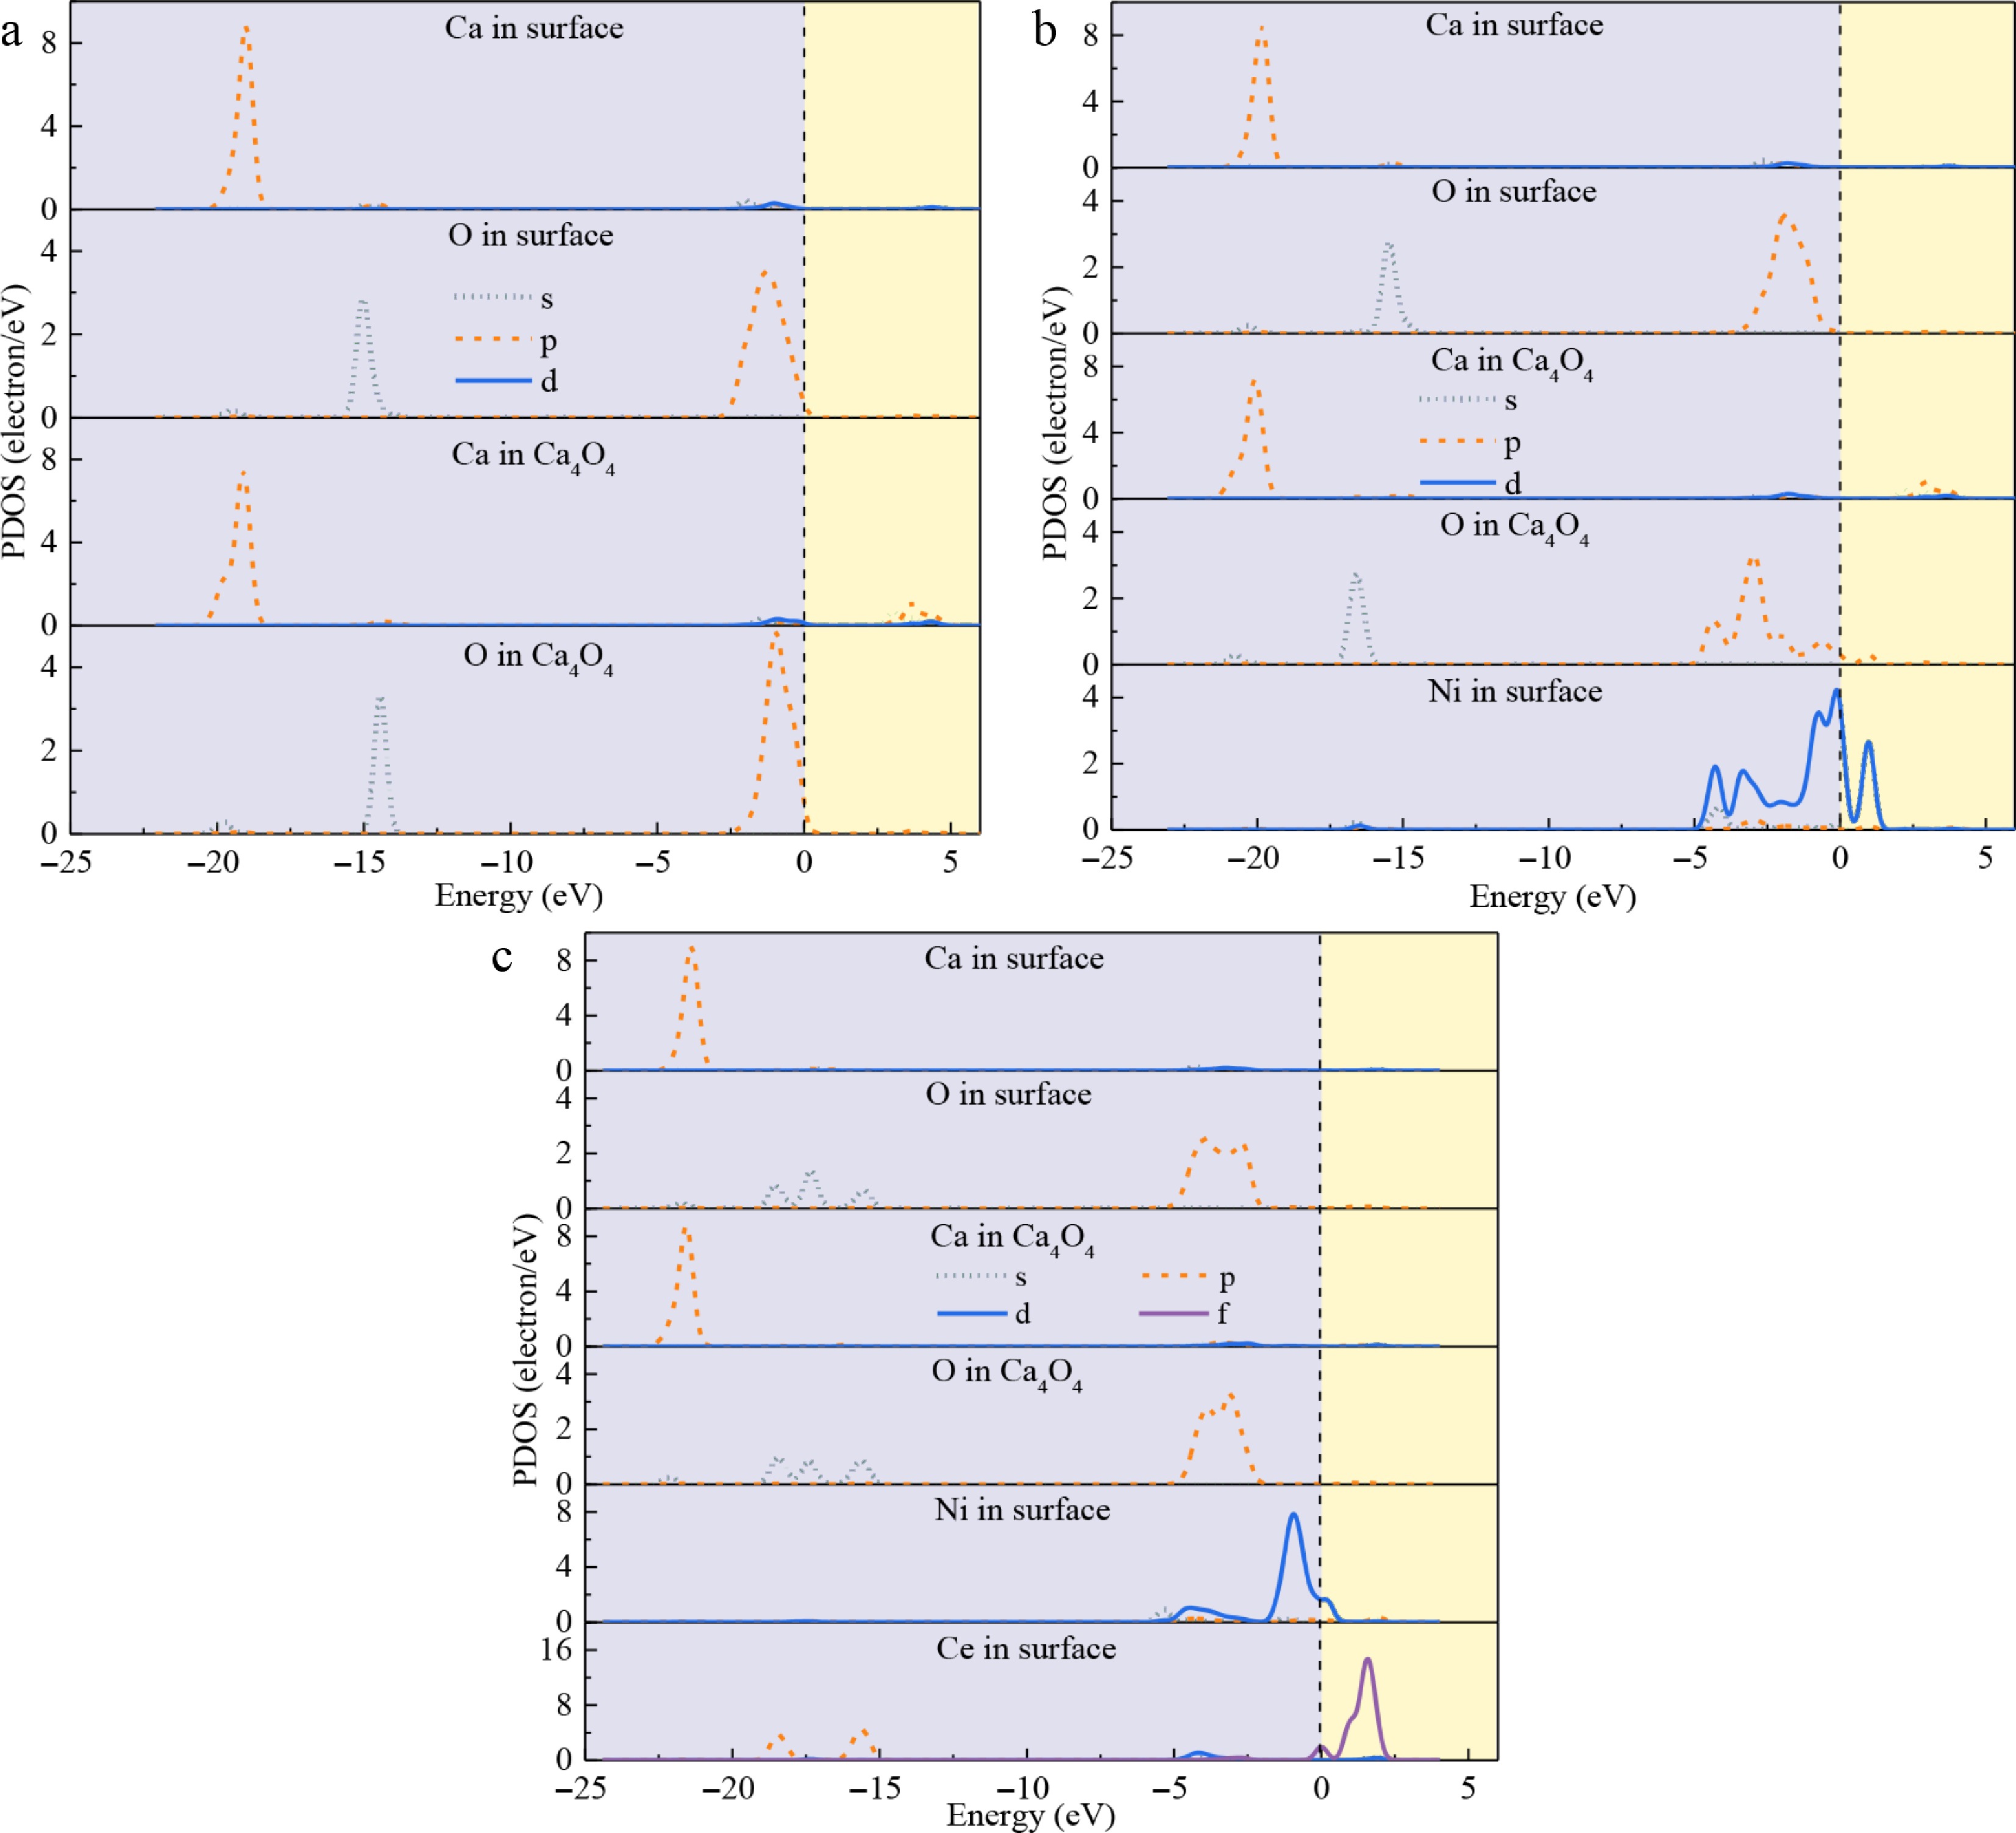
Figure 6.
PDOS of Ca4O4 cluster adsorption on (a) CaO, (b) Ni-CaO, and (c) Ni-Ce-CaO surfaces.
-
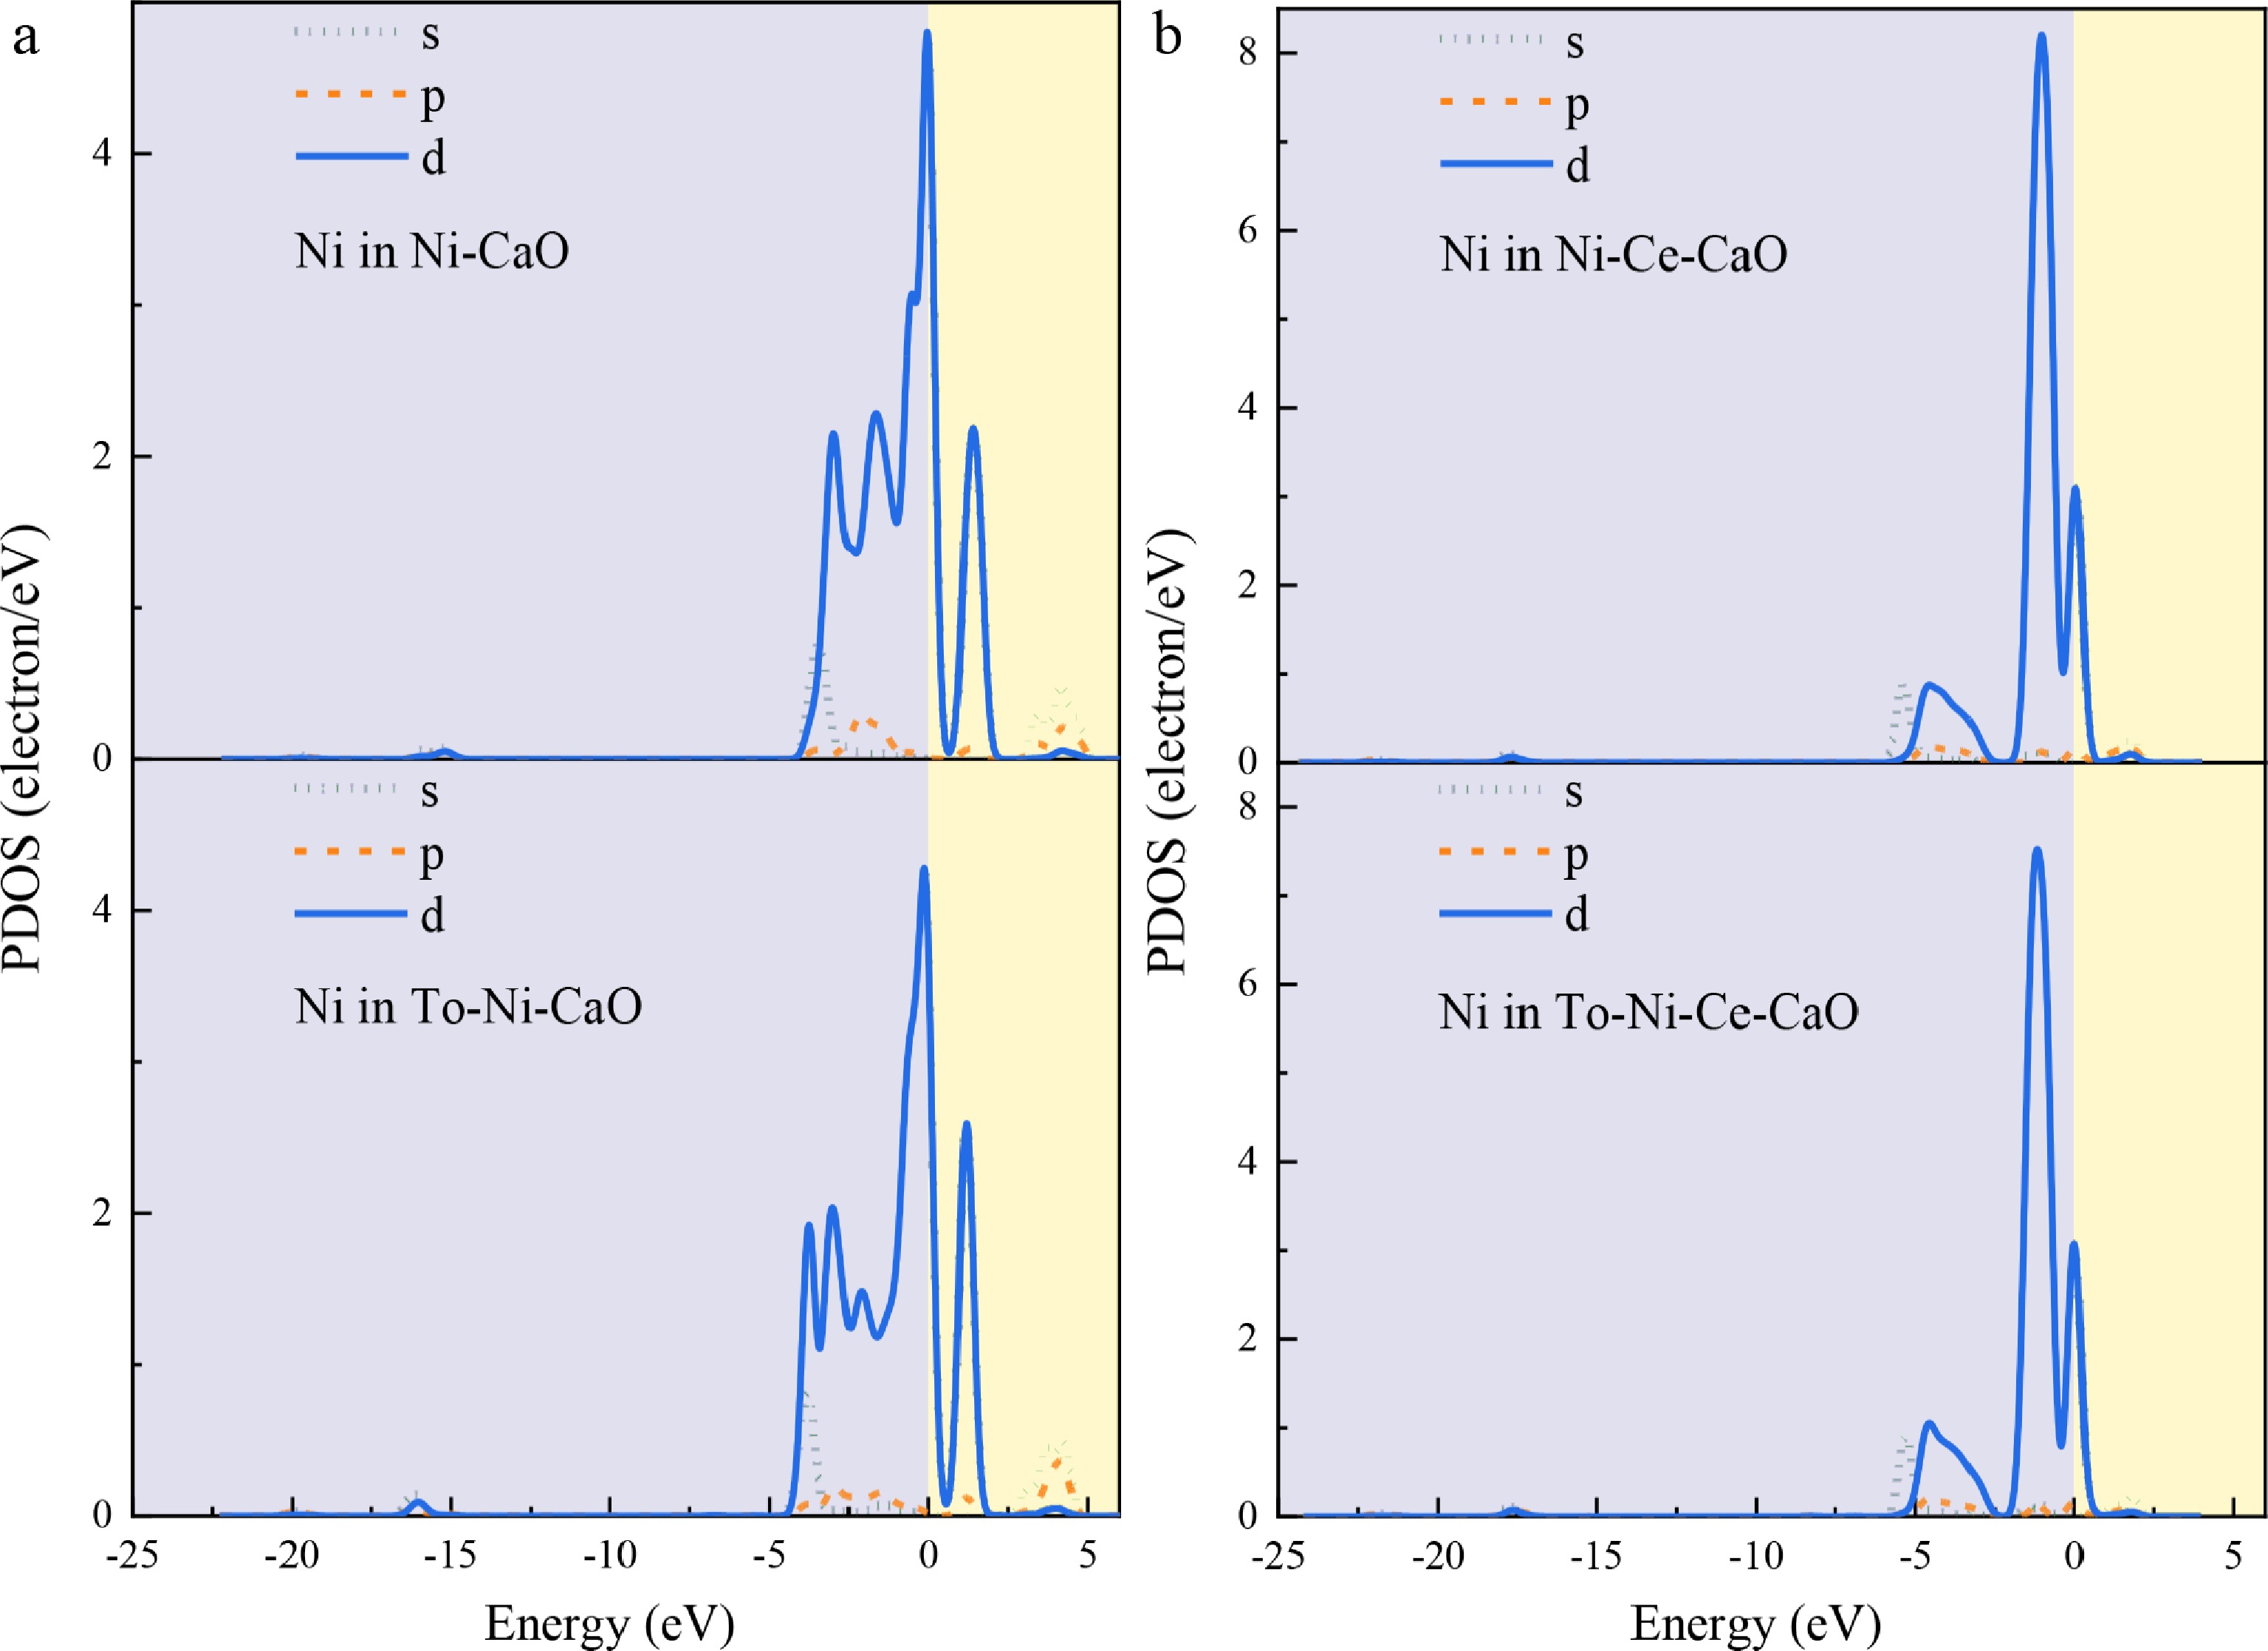
Figure 7.
PDOS of toluene adsorption on (a) Ni-CaO, and (b) Ni-Ce-CaO surfaces.
-
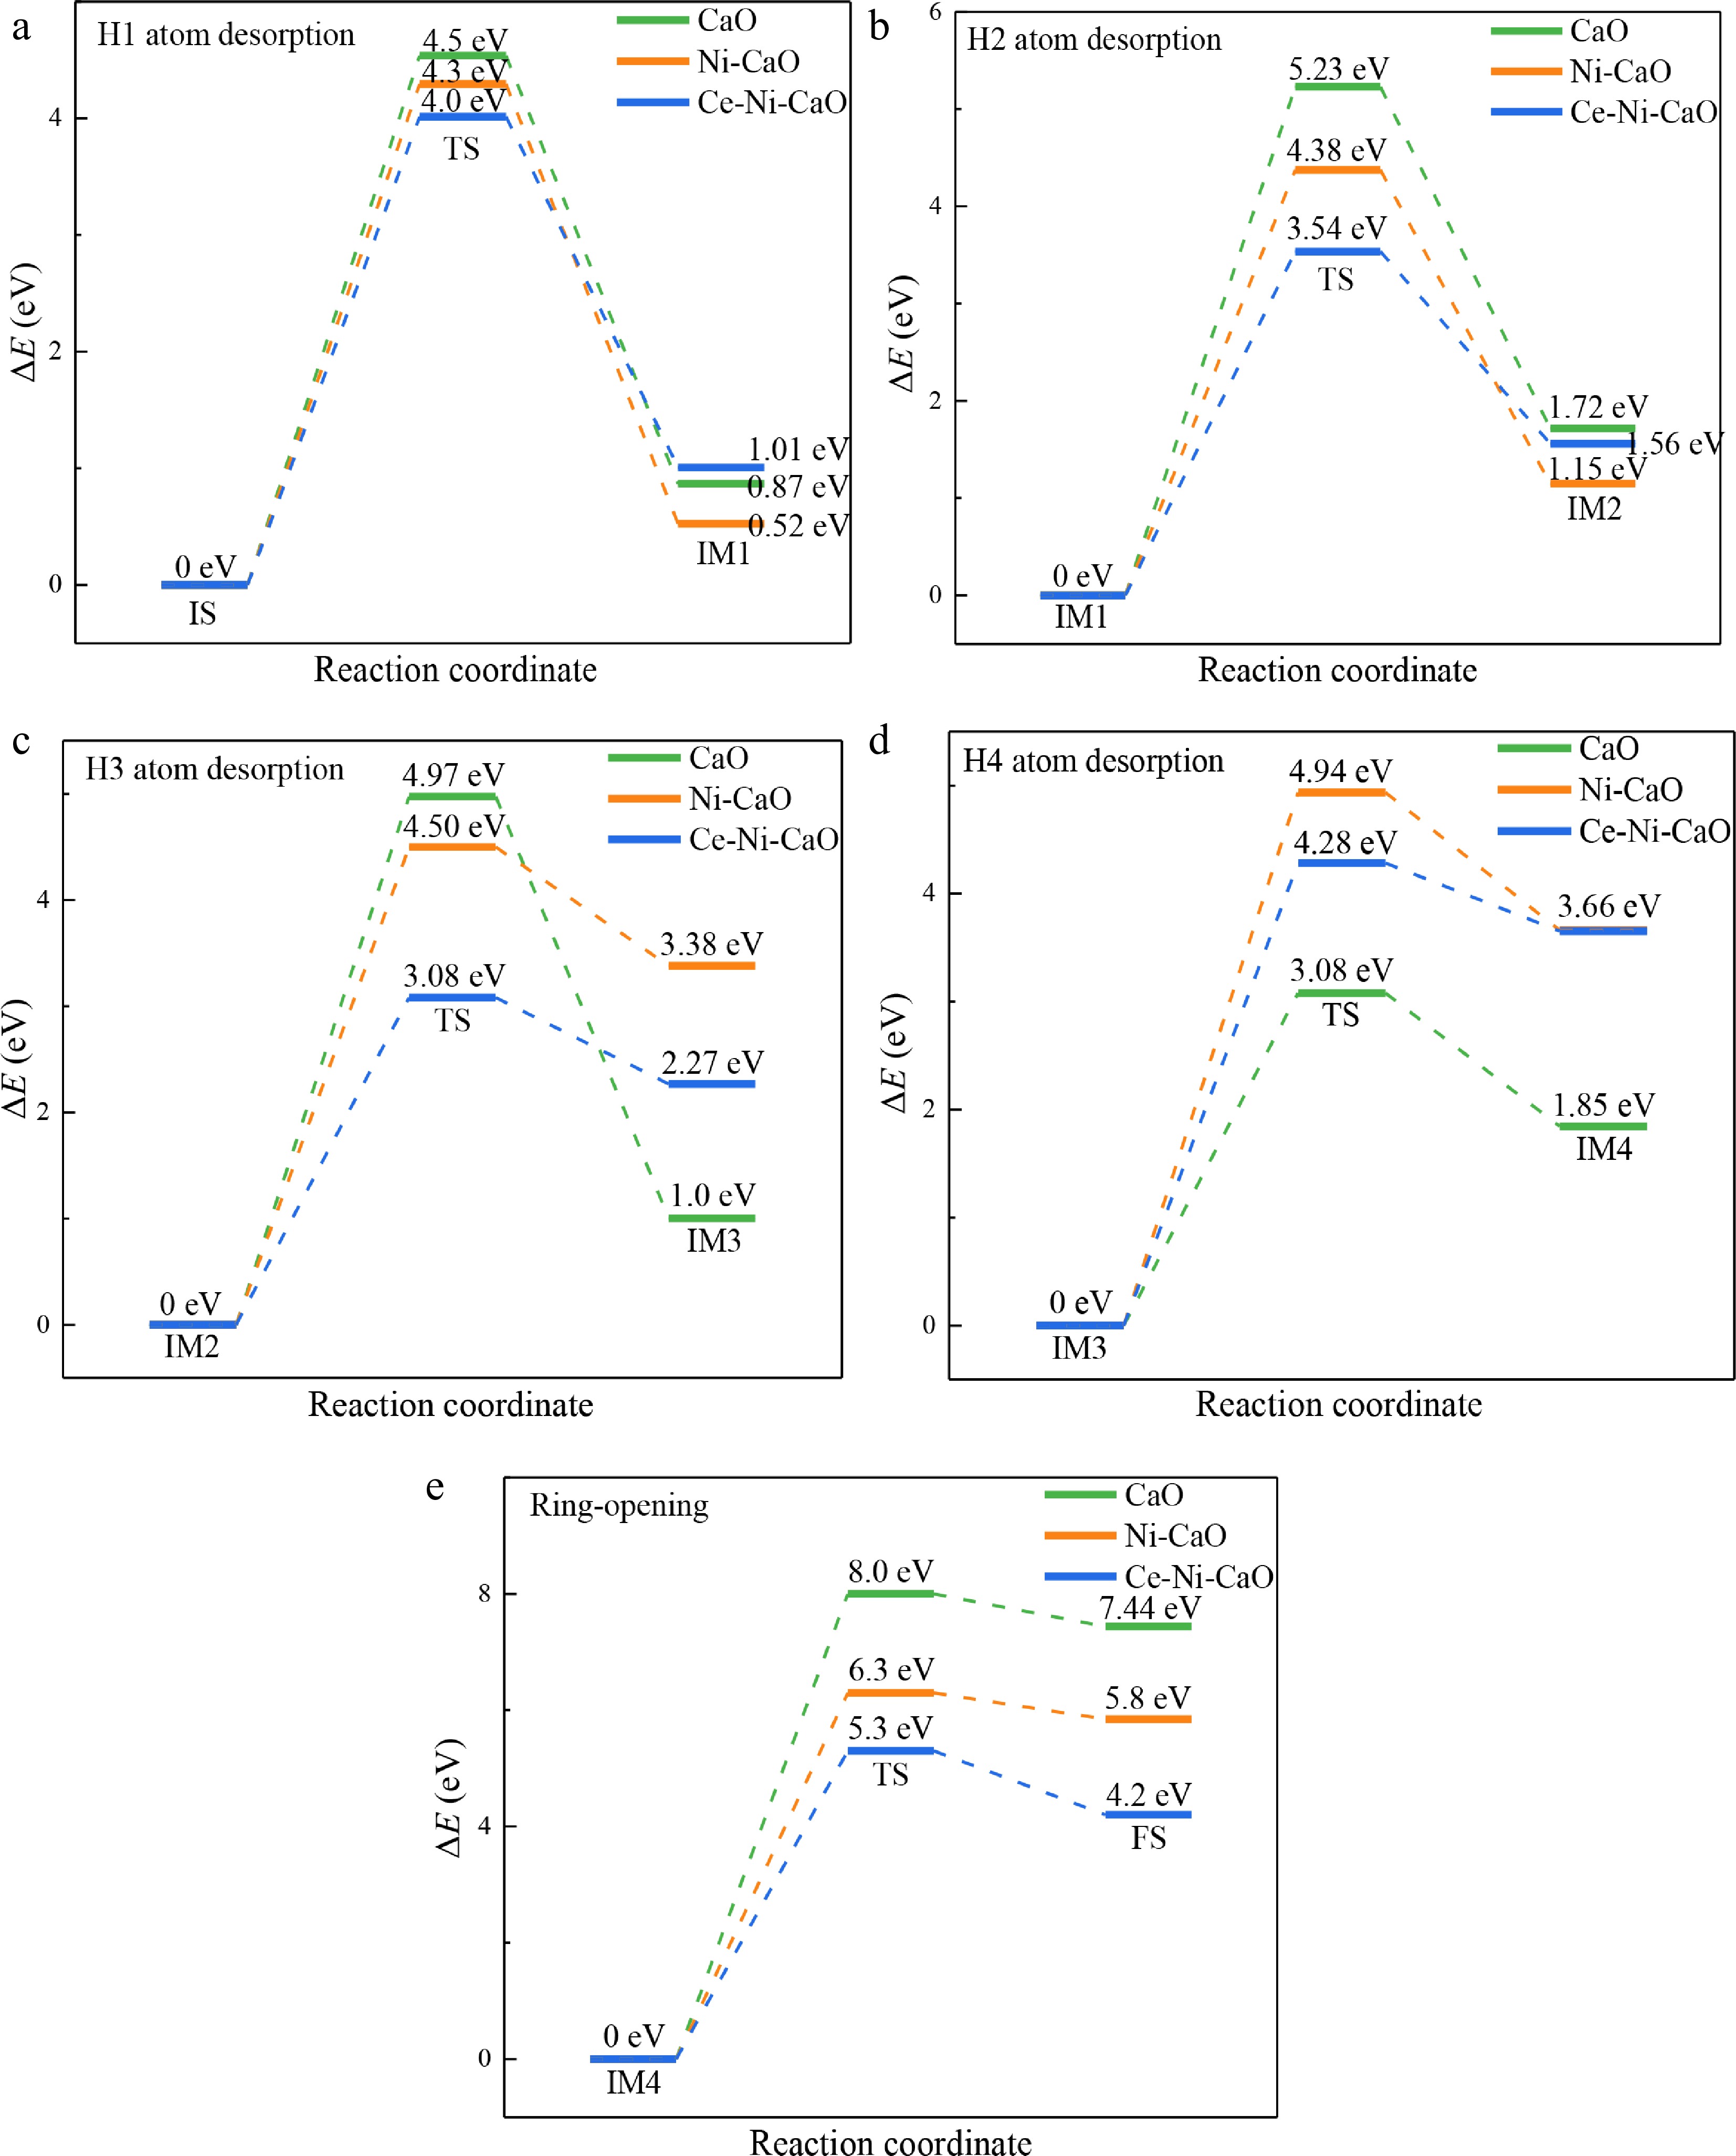
Figure 8.
Relevant energies of toluene cracking reaction on CaO, Ni-CaO, and Ni-Ce-CaO surfaces: (a) H1 atom desorption, (b) H2 atom desorption, (c) H3 atom desorption, (d) H4 atom desorption, and (e) ring-opening.
Figures
(8)
Tables
(0)