-
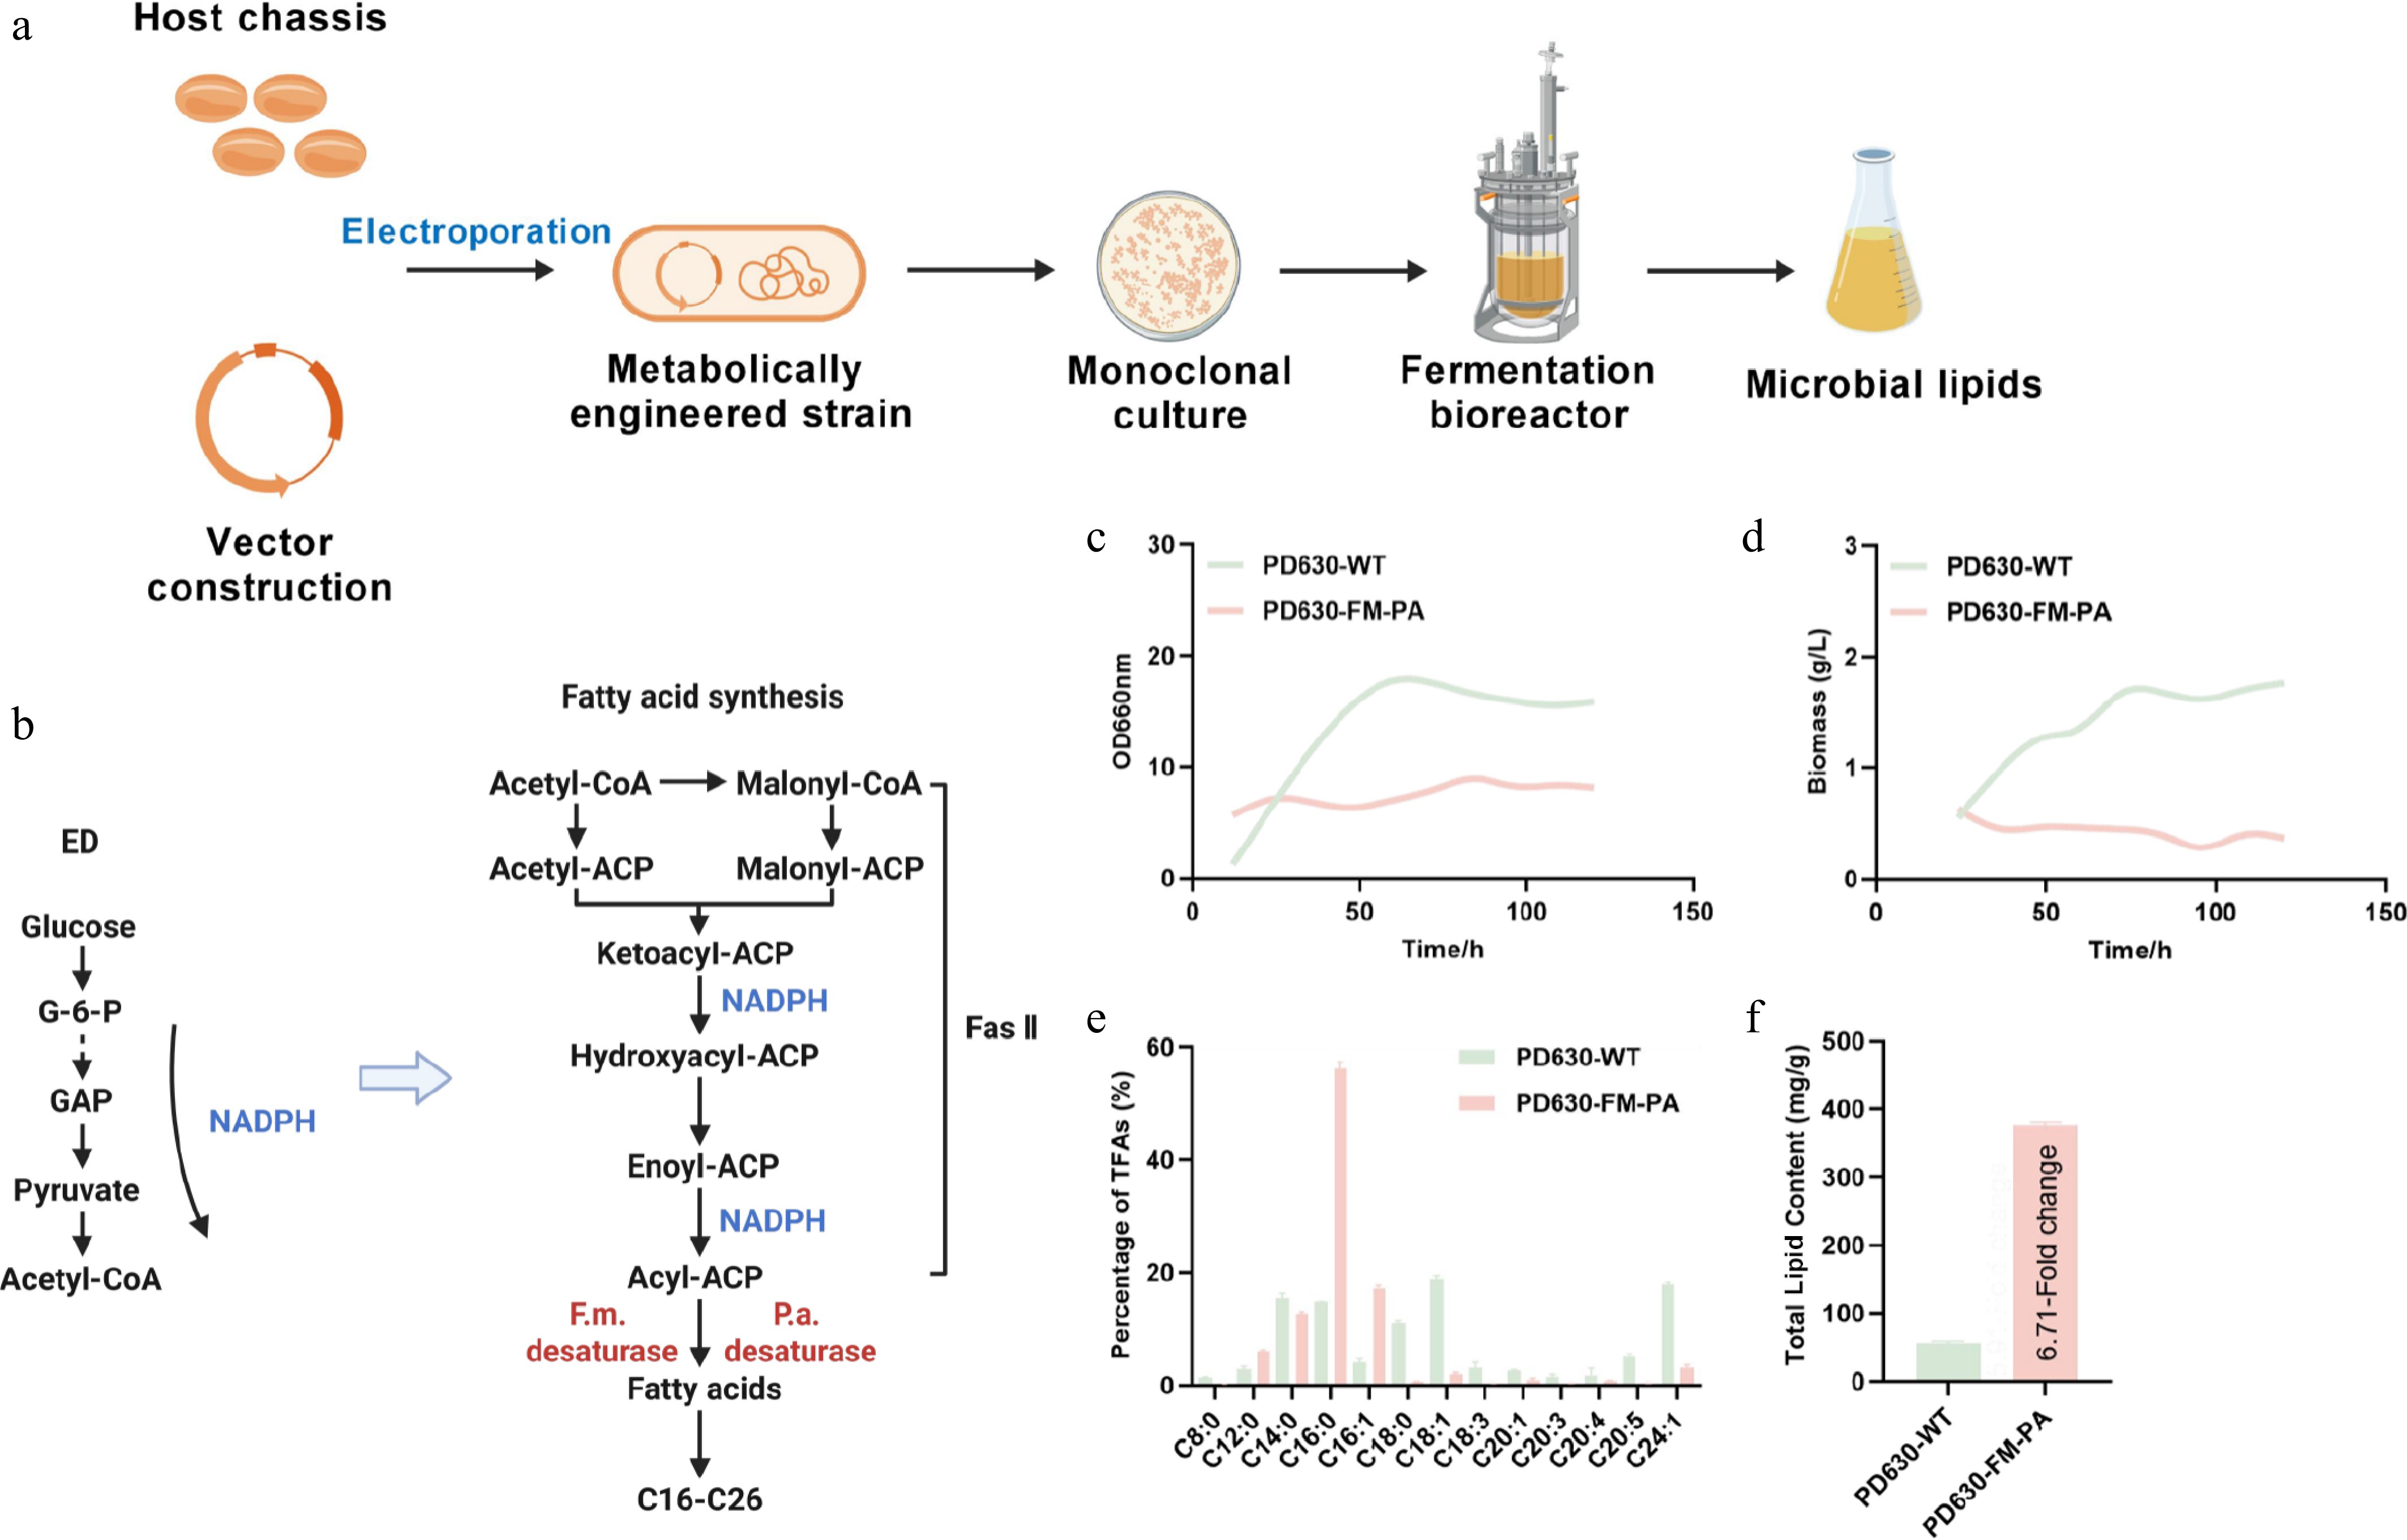
Figure 1.
Schematic workflow for constructing the engineered strain and for microbial lipid production. (a) Schematic diagram of the genetic engineering and fermentation process for microbial lipid production. (b) Proposed pathway for fatty acid biosynthesis from the glucose in PD630. Abbreviations: ED, Entner-Doudoroff pathway; G-6-P, glucose-6-phosphate; GAP, glyceraldehyde-3-phosphate; ACP, acyl carrier protein. (c) Growth curves of wild-type and engineered PD630 strains. (d) Biomass production of wild-type and engineered PD630 strains. (e) Fatty acid composition (relative abundance, %) and absolute content of wild-type and engineered PD630 strains. (f) Total lipid content of wild-type and engineered PD630 strains. Data are presented as the mean ± sem (n = 3). The three biological replicates represent independent PD630 bacterial samples used for molecular analysis.
-
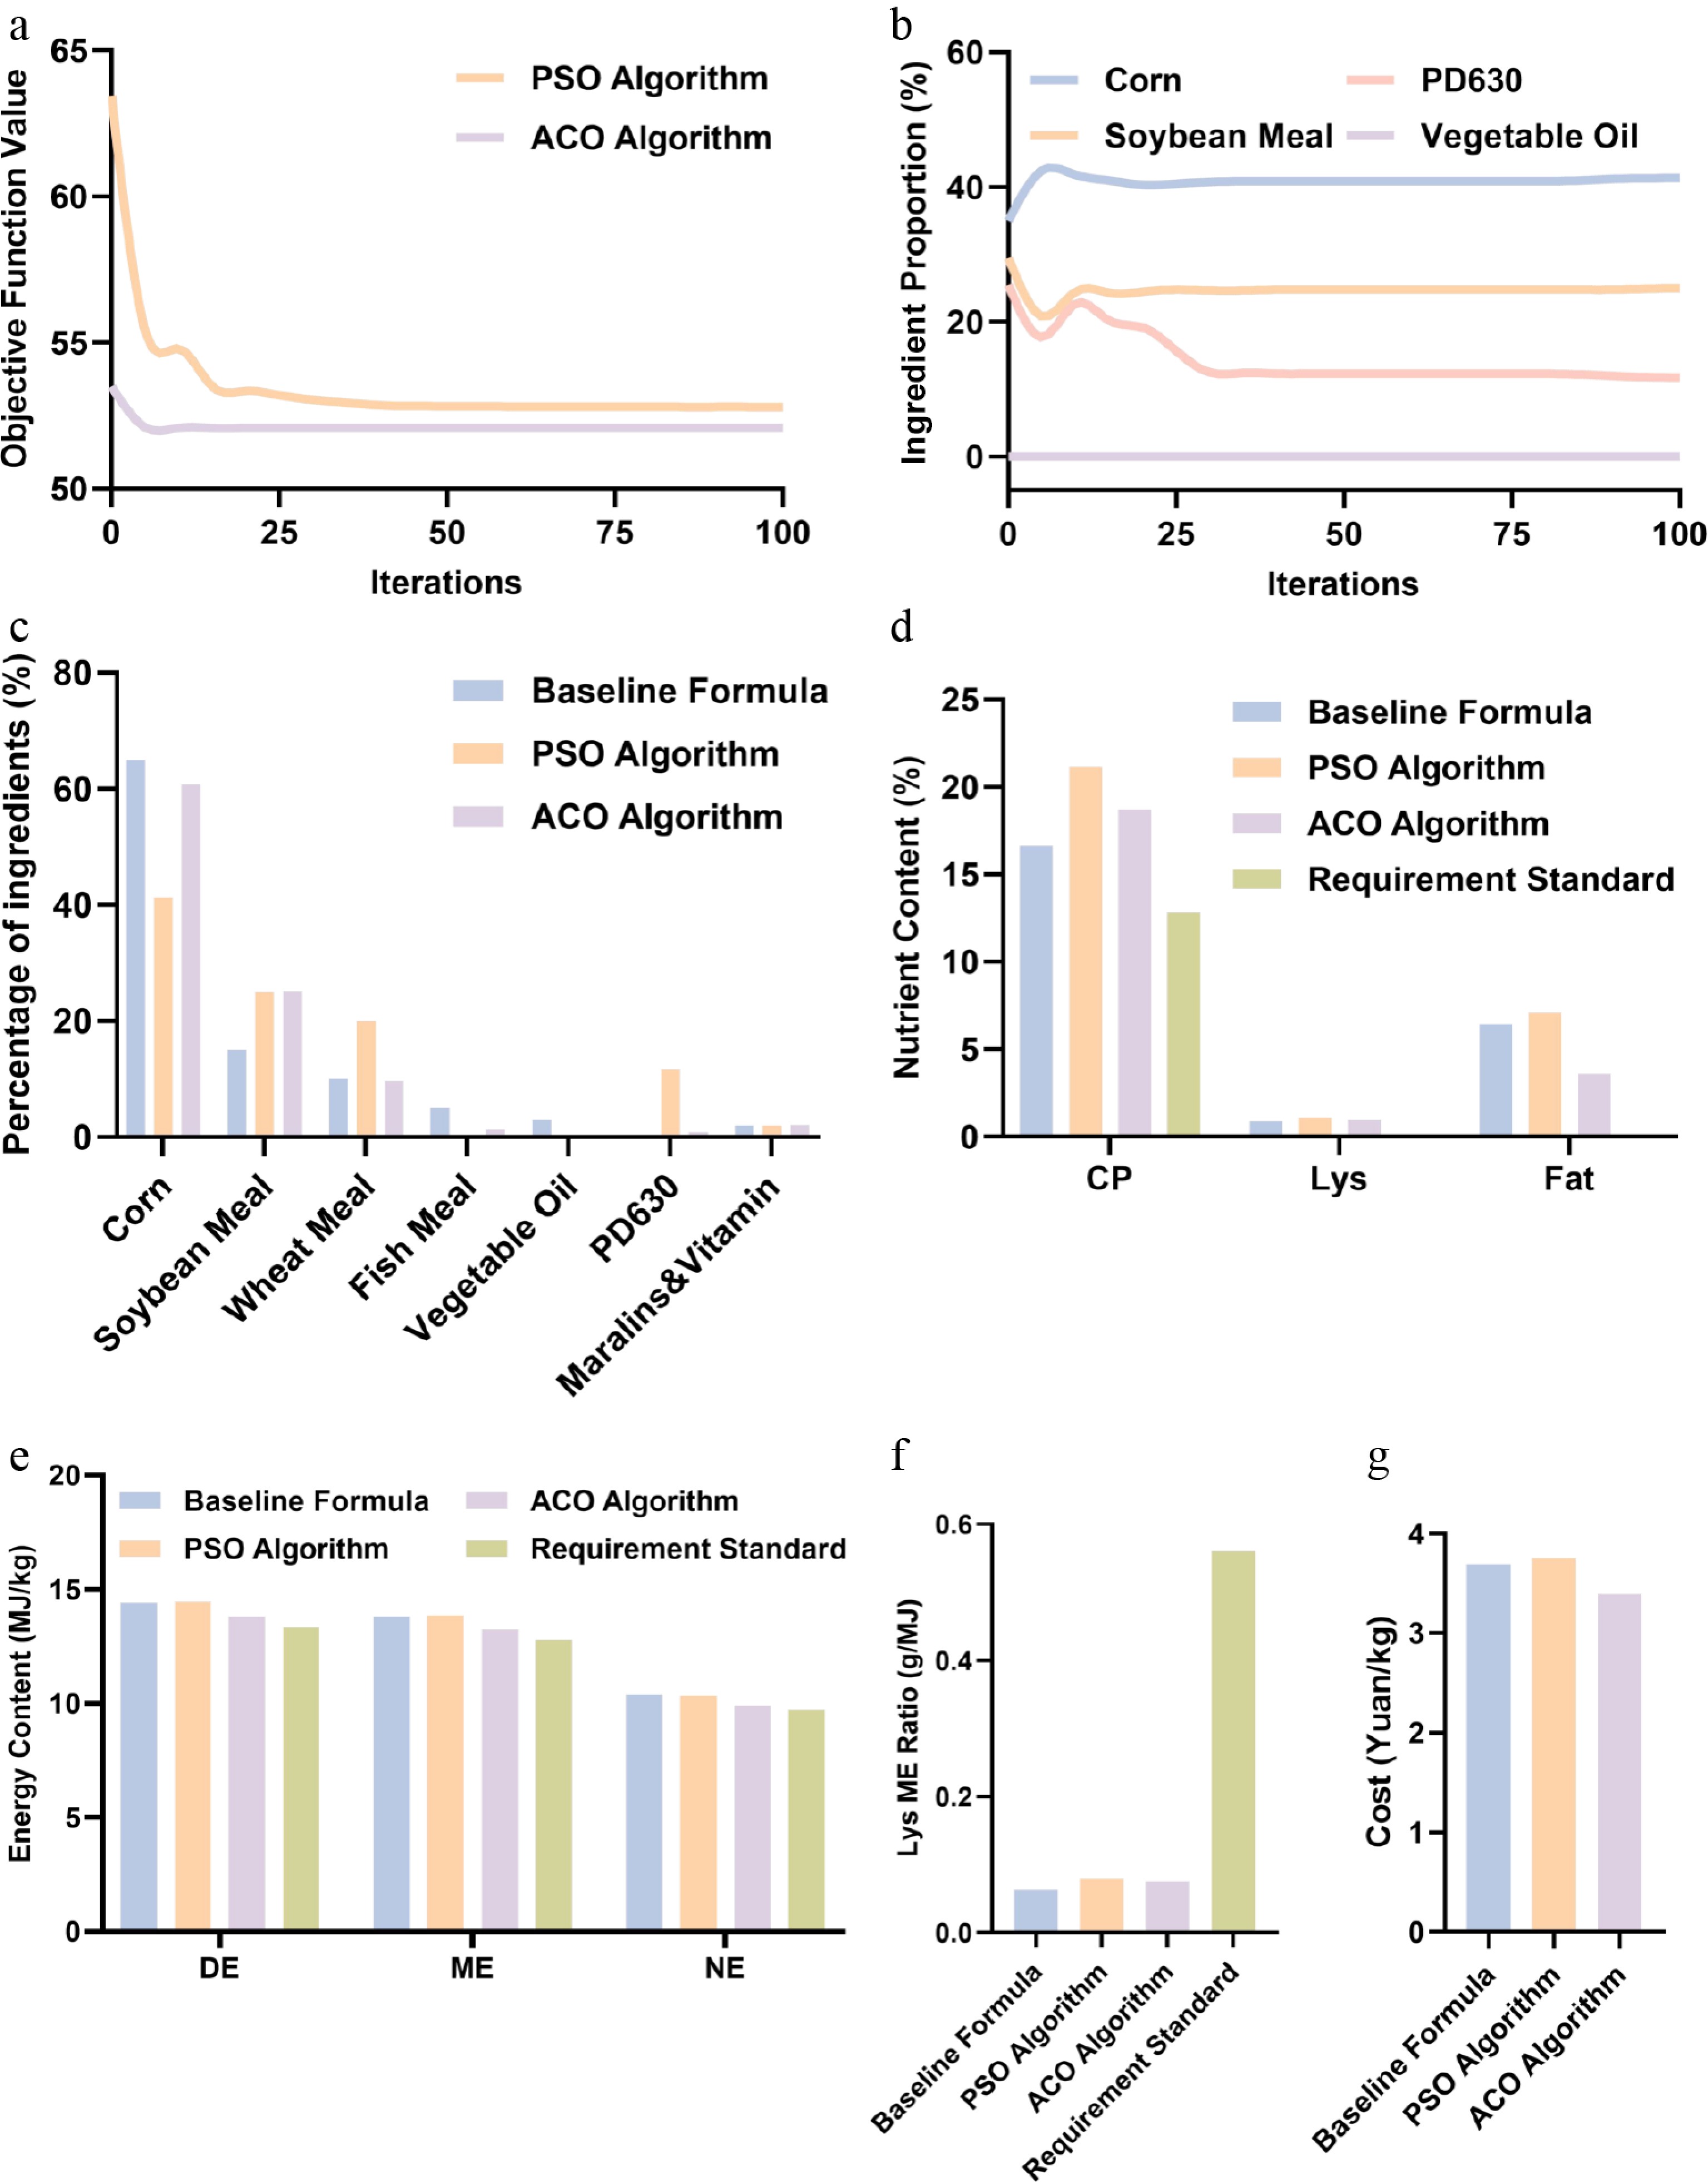
Figure 2.
Optimization of finishing pig feed formulations using PSO and ACO algorithms. (a) Comparison of convergence processes between PSO and ACO algorithms. (b) Variation in raw material proportions during the optimization process. (c) Feed composition in PSO and ACO algorithms. (d) Nutrient profiles of PSO and ACO algorithms. (e) Energy values (DE, ME, NE) of the ACO algorithm. (f) Lysine-to-ME ratio in PSO and ACO algorithms. (g) Comparison of feed cost among baseline, PSO, and ACO algorithms.
-
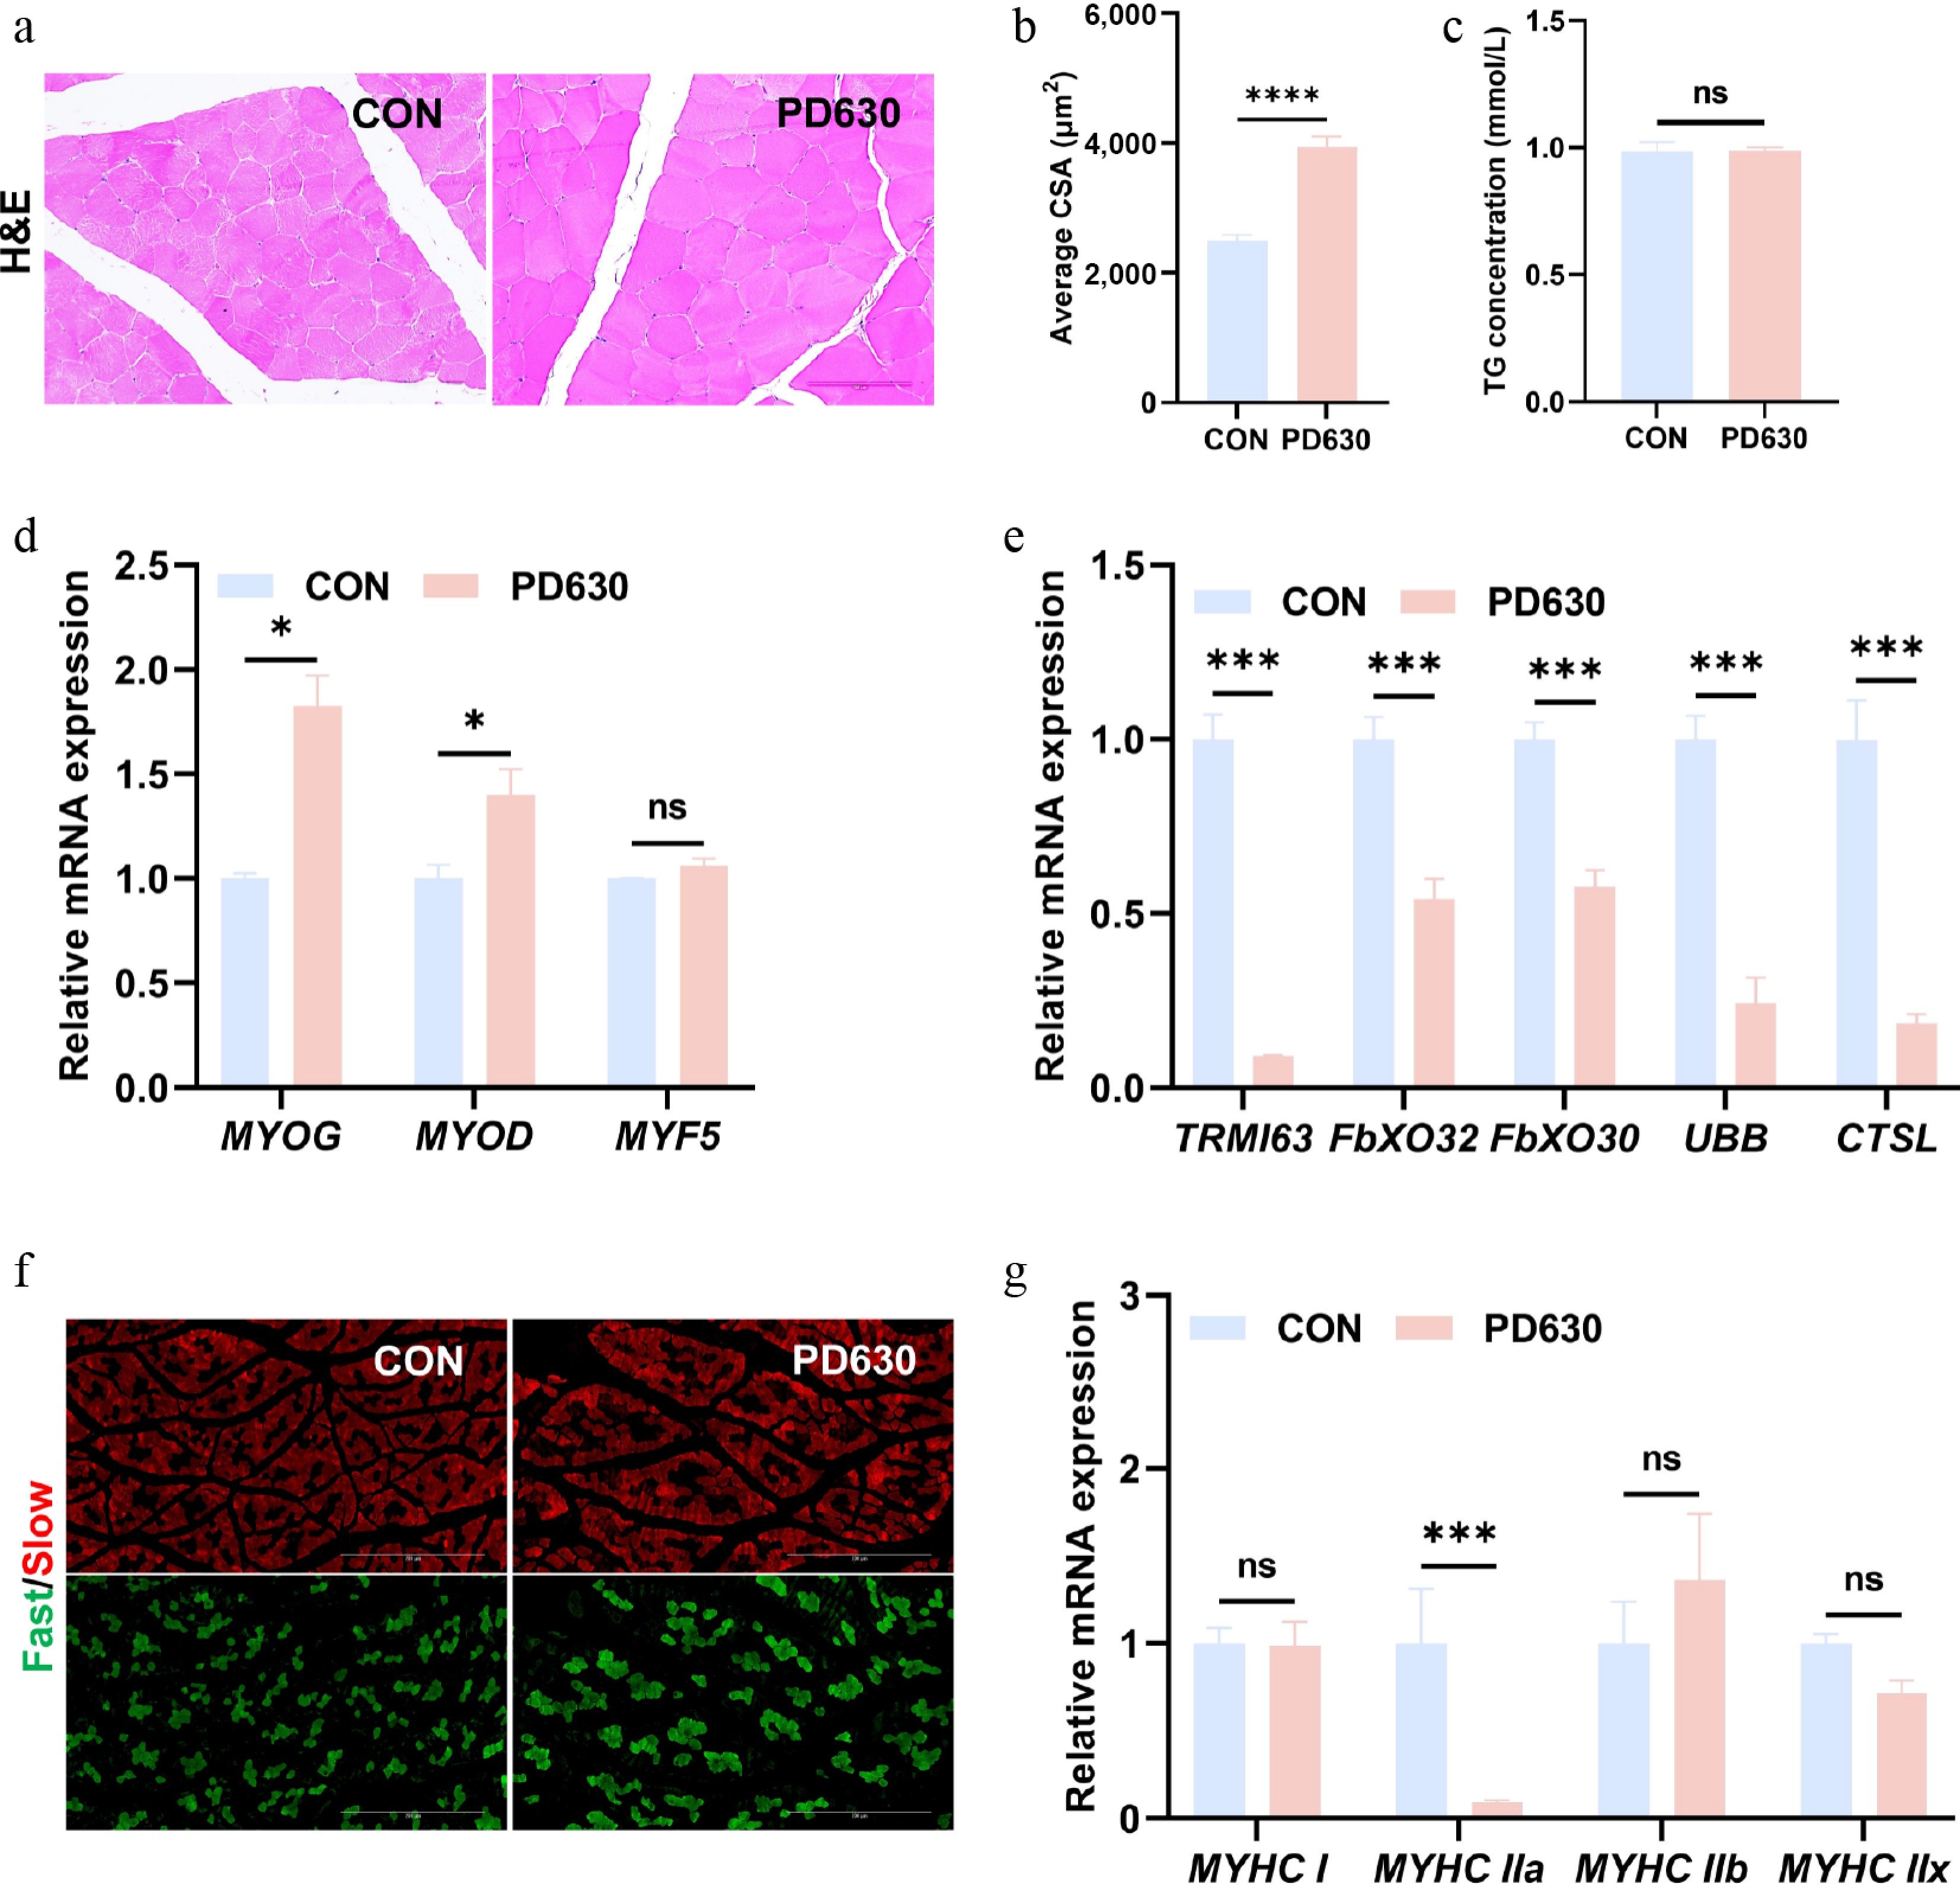
Figure 3.
Effects of lipids from engineered PD630 on muscle fiber type and morphology in the longissimus dorsi muscle of finishing pigs. (a) Representative images of muscle paraffin sections; scale bars, 150 μm. (b) Quantification of muscle fiber cross-sectional area. (c) Triglyceride content in the longissimus dorsi muscle. (d) Protein synthesis genes. (e) Protein degradation genes. (f) Immunofluorescence staining of fast (green) and slow (red) myofibers; scale bars, 200 μm. (g) Myofiber-type markers. Data are presented as the mean ± sem (n = 3). Three samples were randomly selected from the six slaughtered pigs in each group for subsequent molecular analysis.
-
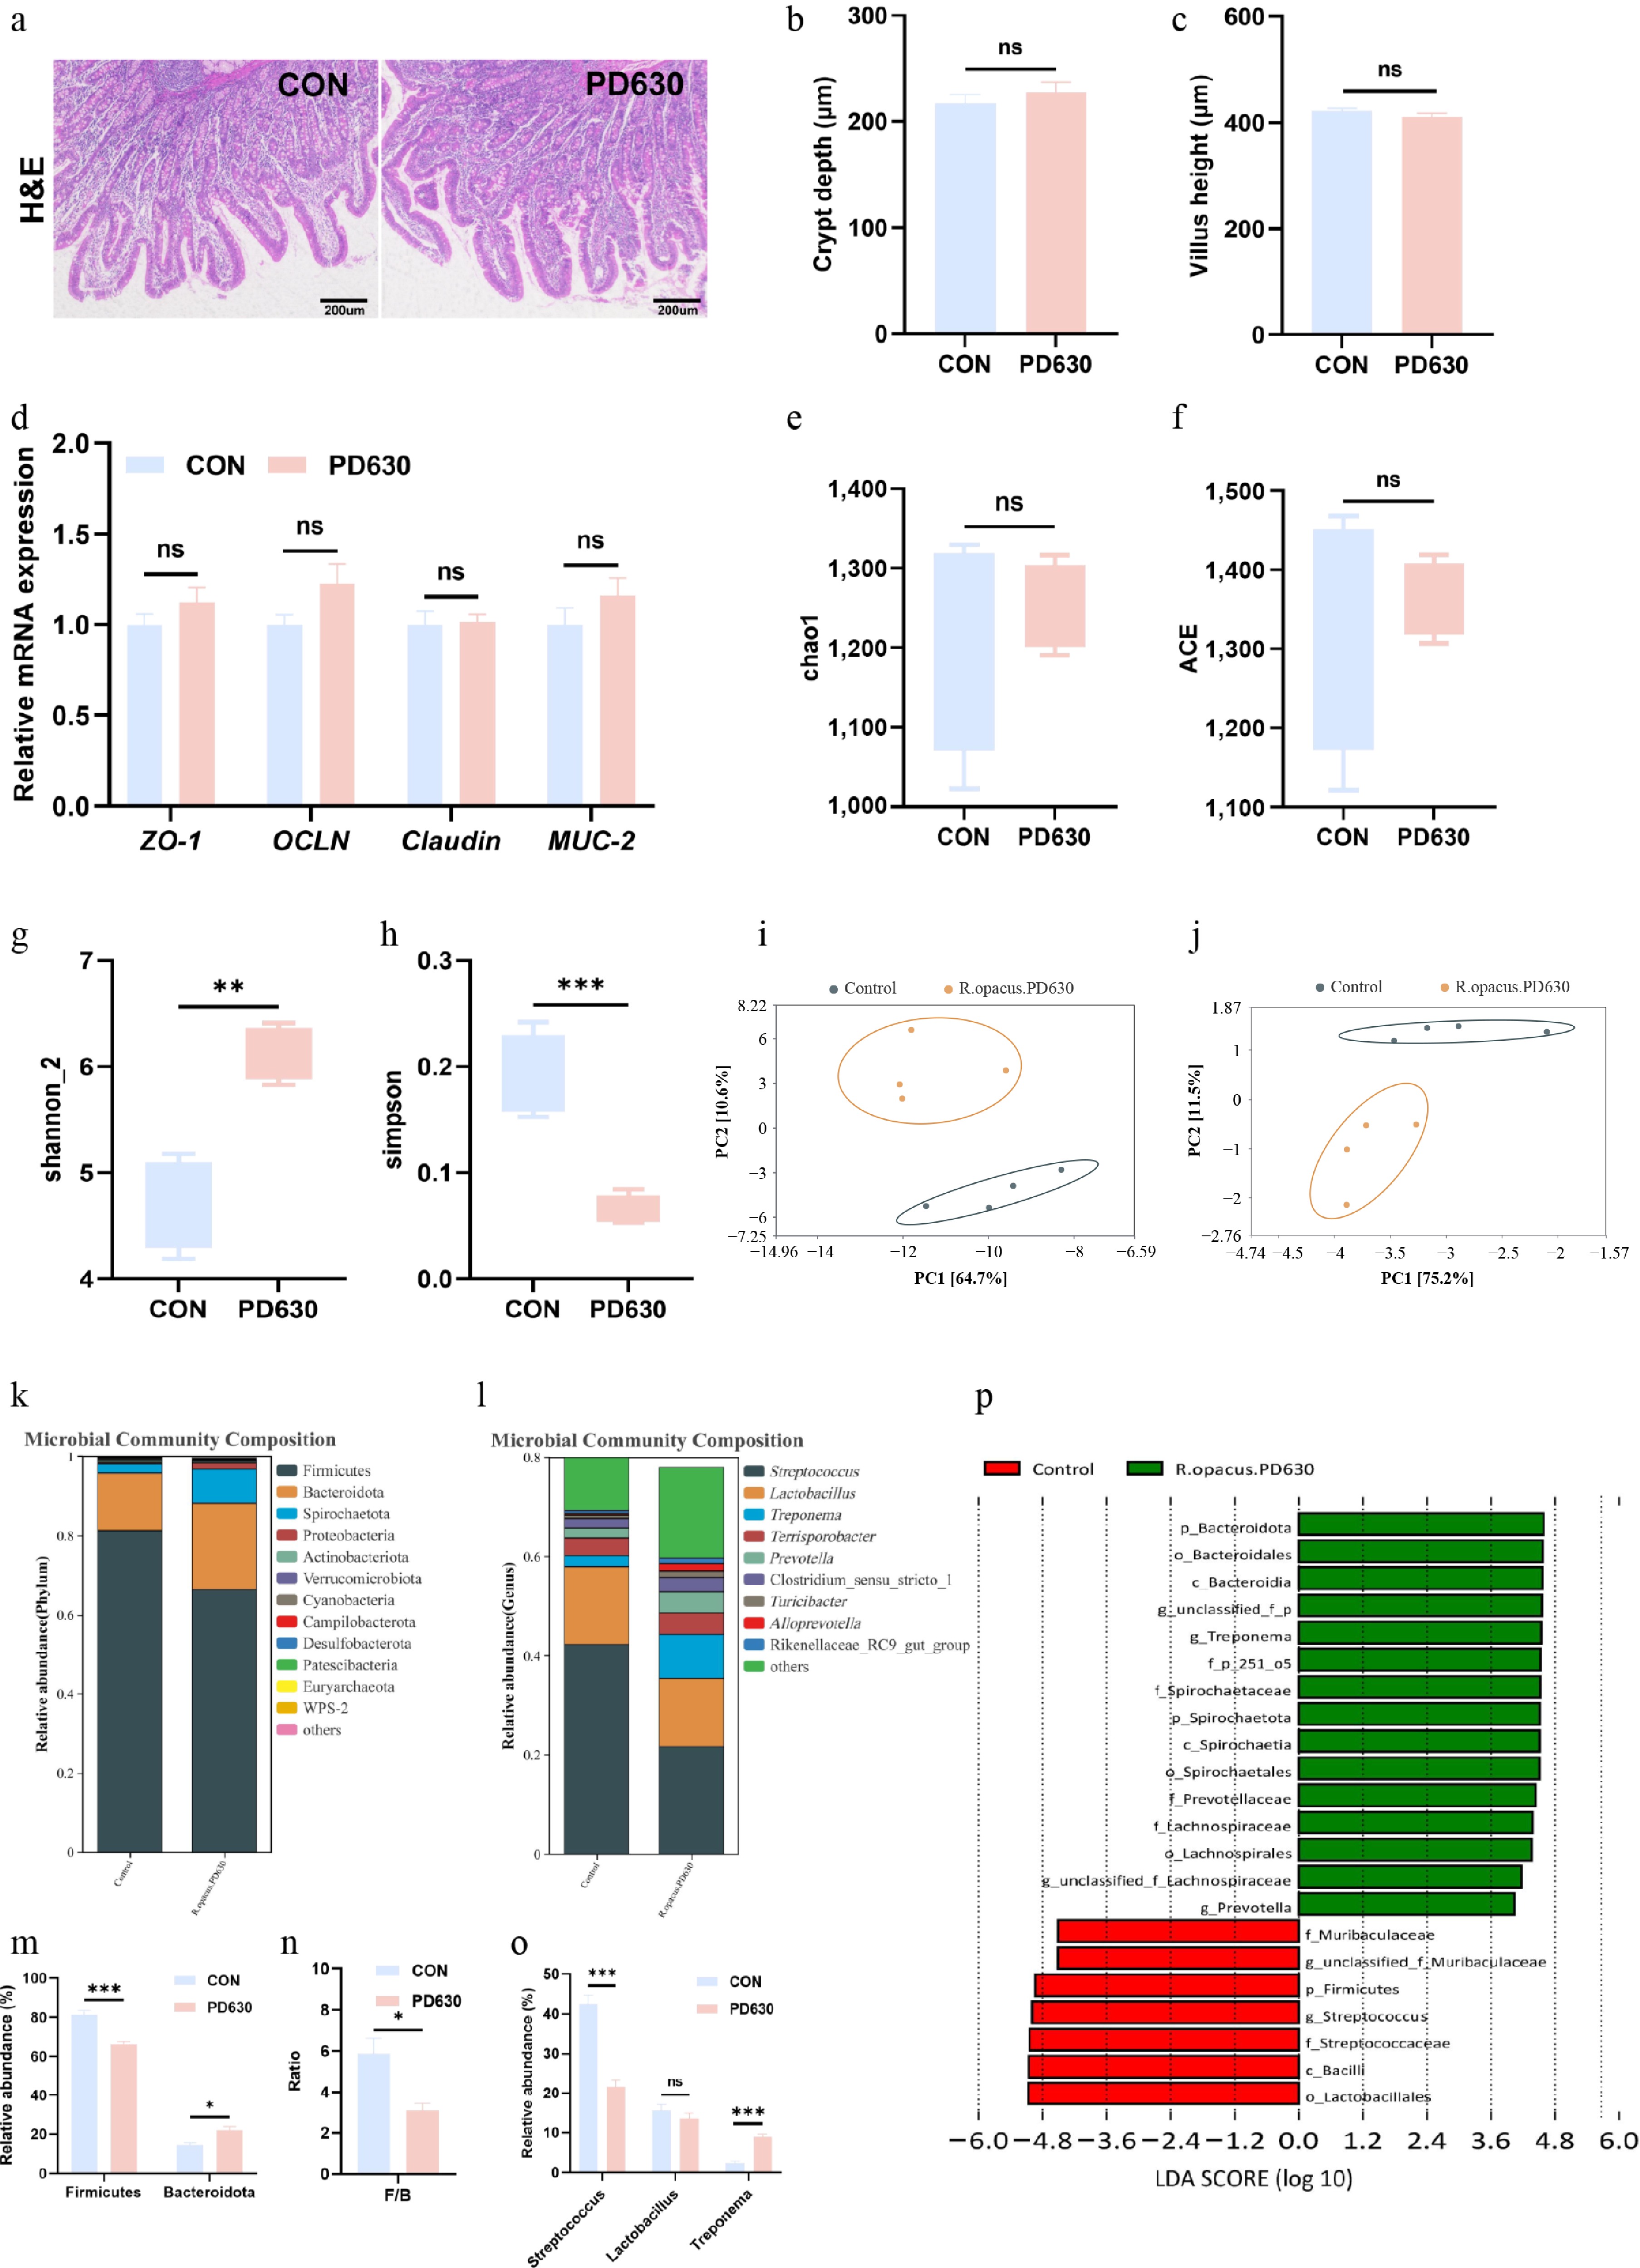
Figure 4.
Effects of lipids from engineered PD630 on intestinal morphology in finishing pigs. (a) Duodenal intestine H&E staining; scale bars, 200 μm. (b) Crypt depth (μm) (n = 3). (c) Villus height (μm) (n = 3). (d) Relative mRNA expression of intestinal barrier-related genes in the duodenum (n = 3). (e) Alpha diversity index: Chao1 (n = 4). (f) Alpha diversity index: ACE (n = 4). (g) Alpha diversity index: Shannon (n = 4). (h) Alpha diversity index: Simpson (n = 4). (i) Beta diversity analysis at the phylum level (n = 4). (j) Beta diversity analysis at the genus level (n = 4). (k) Relative abundances of dominant bacterial phyla (n = 4). (l) Relative abundances of dominant bacterial genera. (m) Relative abundances of Firmicutes and Bacteroidota at the phylum level (n = 4). (n) Firmicutes/Bacteroidota (F/B) ratio (n = 4). (o) Relative abundances of representative bacterial genera (Streptococcus, Lactobacillus, and Treponema) (n = 4). (p) LEfSe analysis of differentially enriched taxa. Data were presented as the mean ± sem. Three or four samples were randomly selected from the six slaughtered pigs in each group for subsequent molecular analysis.
-
Items Con PD630 p-Value ADG, kg/d 0.56 ± 0.04 0.6 ± 0.07 0.397 ADFI, kg/d 3.19 ± 0.07 3.22 ± 0.05 0.892 FCR 5.70 ± 0.14 5.37 ± 0.09 0.992 ADG = average daily gain; ADFI = average daily feed intake; FCR = feed conversion rate. Data are presented as the mean ± sem (n = 6 pigs per group, randomly selected for slaughter). Table 1.
Effects of lipids from engineered PD630 (as a substitute for dietary lipids) on the growth performance of finishing pigs.
-
Items Con PD630 p-Value Carcass weight, kg 82.67 ± 6.47 86.45 ± 2.10 0.299 Backfat thickness, cm 1.93 ± 0.22 2.70 ± 0.27 0.001 Dressing percentage, % 68.00 ± 1.26 72.00 ± 0.41 0.037 Data are presented as the mean ± sem (n = 6 pigs per group, randomly selected for slaughter). Table 2.
Effects of lipids from engineered PD630 (as a substitute for dietary lipids) on the carcass characteristics of finishing pigs.
-
Item Con PD630 p-Value C6:0 0.01 ± 0.00 0.02 ± 0.01 0.589 C8:0 0.02 ± 0.00 0.02 ± 0.01 0.792 C10:0 0.15 ± 0.01 0.16 ± 0.0 0.789 C12:0 0.13 ± 0.01 0.13 ± 0.01 0.984 C13:0 0.03 ± 0.002 0.02 ± 0.001 0.578 C14:0 1.50 ± 0.09 1.50 ± 0.21 0.886 C14:1 1.25 ± 0.07 1.22 ± 0.14 0.866 C15:0 1.26 ± 0.35 1.27 ± 0.6 0.975 C16:0 13.10 ± 0.55 12.80 ± 1.37 0.751 C16:1 3.04 ± 0.20 2.74 ± 0.54 0.276 C17:0 0.72 ± 0.12 0.82 ± 0.23 0.433 C18:0 12.59 ± 1.45 13.88 ± 2.84 0.385 C18:1n-9 41.47 ± 1.64 43.10 ± 7.20 0.844 C18:2n-6 19.72 ± 1.72 17.50 ± 1.02 0.610 C18:3n-3 0.46 ± 0.03 0.47 ± 0.02 0.877 C18:3n-6 0.13 ± 0.01 0.17 ± 0.01 0.544 C20:0 0.65 ± 0.07 0.76 ± 0.20 0.260 C20:3n-3 1.78 ± 0.62 1.76 ± 0.21 0.876 C20:3n-6 0.67 ± 0.08 0.67 ± 0.03 0.976 C20:5n-3 (EPA) 0.31 ± 0.05 0.39 ± 0.03 0.387 C22:0 1.07 ± 0.04 1.09 ± 0.21 0.958 C22:1n-9 3.26 ± 0.30 2.57 ± 0.30 0.245 Data are presented as the mean ± sem (n = 3). Three samples were randomly selected from the six slaughtered pigs in each group for subsequent molecular analysis. Table 3.
Effects of lipids from engineered PD630 (as a substitute for dietary fat) on the fatty acid composition in the muscle of finishing pigs (% of total fatty acids).
-
Item Con PD630 p-Value Aspartic 2.00 ± 0.03 2.15 ± 0.02 0.032 Threonine 1.01 ± 0.02 1.18 ± 0.01 0.017 Serine 0.82 ± 0.01 0.88 ± 0.01 0.026 Glutamine 3.06 ± 0.06 2.94 ± 0.04 0.128 Proline 1.67 ± 0.03 2.25 ± 0.02 0.001 Glycine 0.87 ± 0.02 0.93 ± 0.01 0.038 Alanine 1.15 ± 0.02 1.14 ± 0.01 0.666 Cysteine 0.11 ± 0.01 0.12 ± 0.00 0.045 Valine 1.05 ± 0.02 1.01 ± 0.01 0.065 Methionine 0.58 ± 0.00 0.62 ± 0.01 0.008 Isoleucine 0.99 ± 0.01 0.98 ± 0.01 0.570 Leucine 1.76 ± 0.03 1.89 ± 0.01 0.009 Tyrosine 0.77 ± 0.01 0.75 ± 0.01 0.082 Phenylalanine 1.06 ± 0.02 1.14 ± 0.01 0.011 Lysine 1.88 ± 0.0 2.01 ± 0.02 0.007 Histidine 0.98 ± 0.02 0.95 ± 0.00 0.327 Arginine 1.34 ± 0.01 1.30 ± 0.03 0.102 TAA 21.21 ± 0.35 22.83 ± 0.18 0.008 EAA 10.6 ± 0.14 11.17 ± 0.04 0.030 EAA = essential amino acids; TAA = total amino acids. Data are presented as the mean ± sem (n = 3). Three samples were randomly selected from the six slaughtered pigs in each group for subsequent molecular analysis. Table 4.
Effects of lipids from engineered PD630 (as a substitute for dietary fat) on the amino acid composition in the muscle of finishing pigs (% of meat weight).
Figures
(4)
Tables
(4)