-
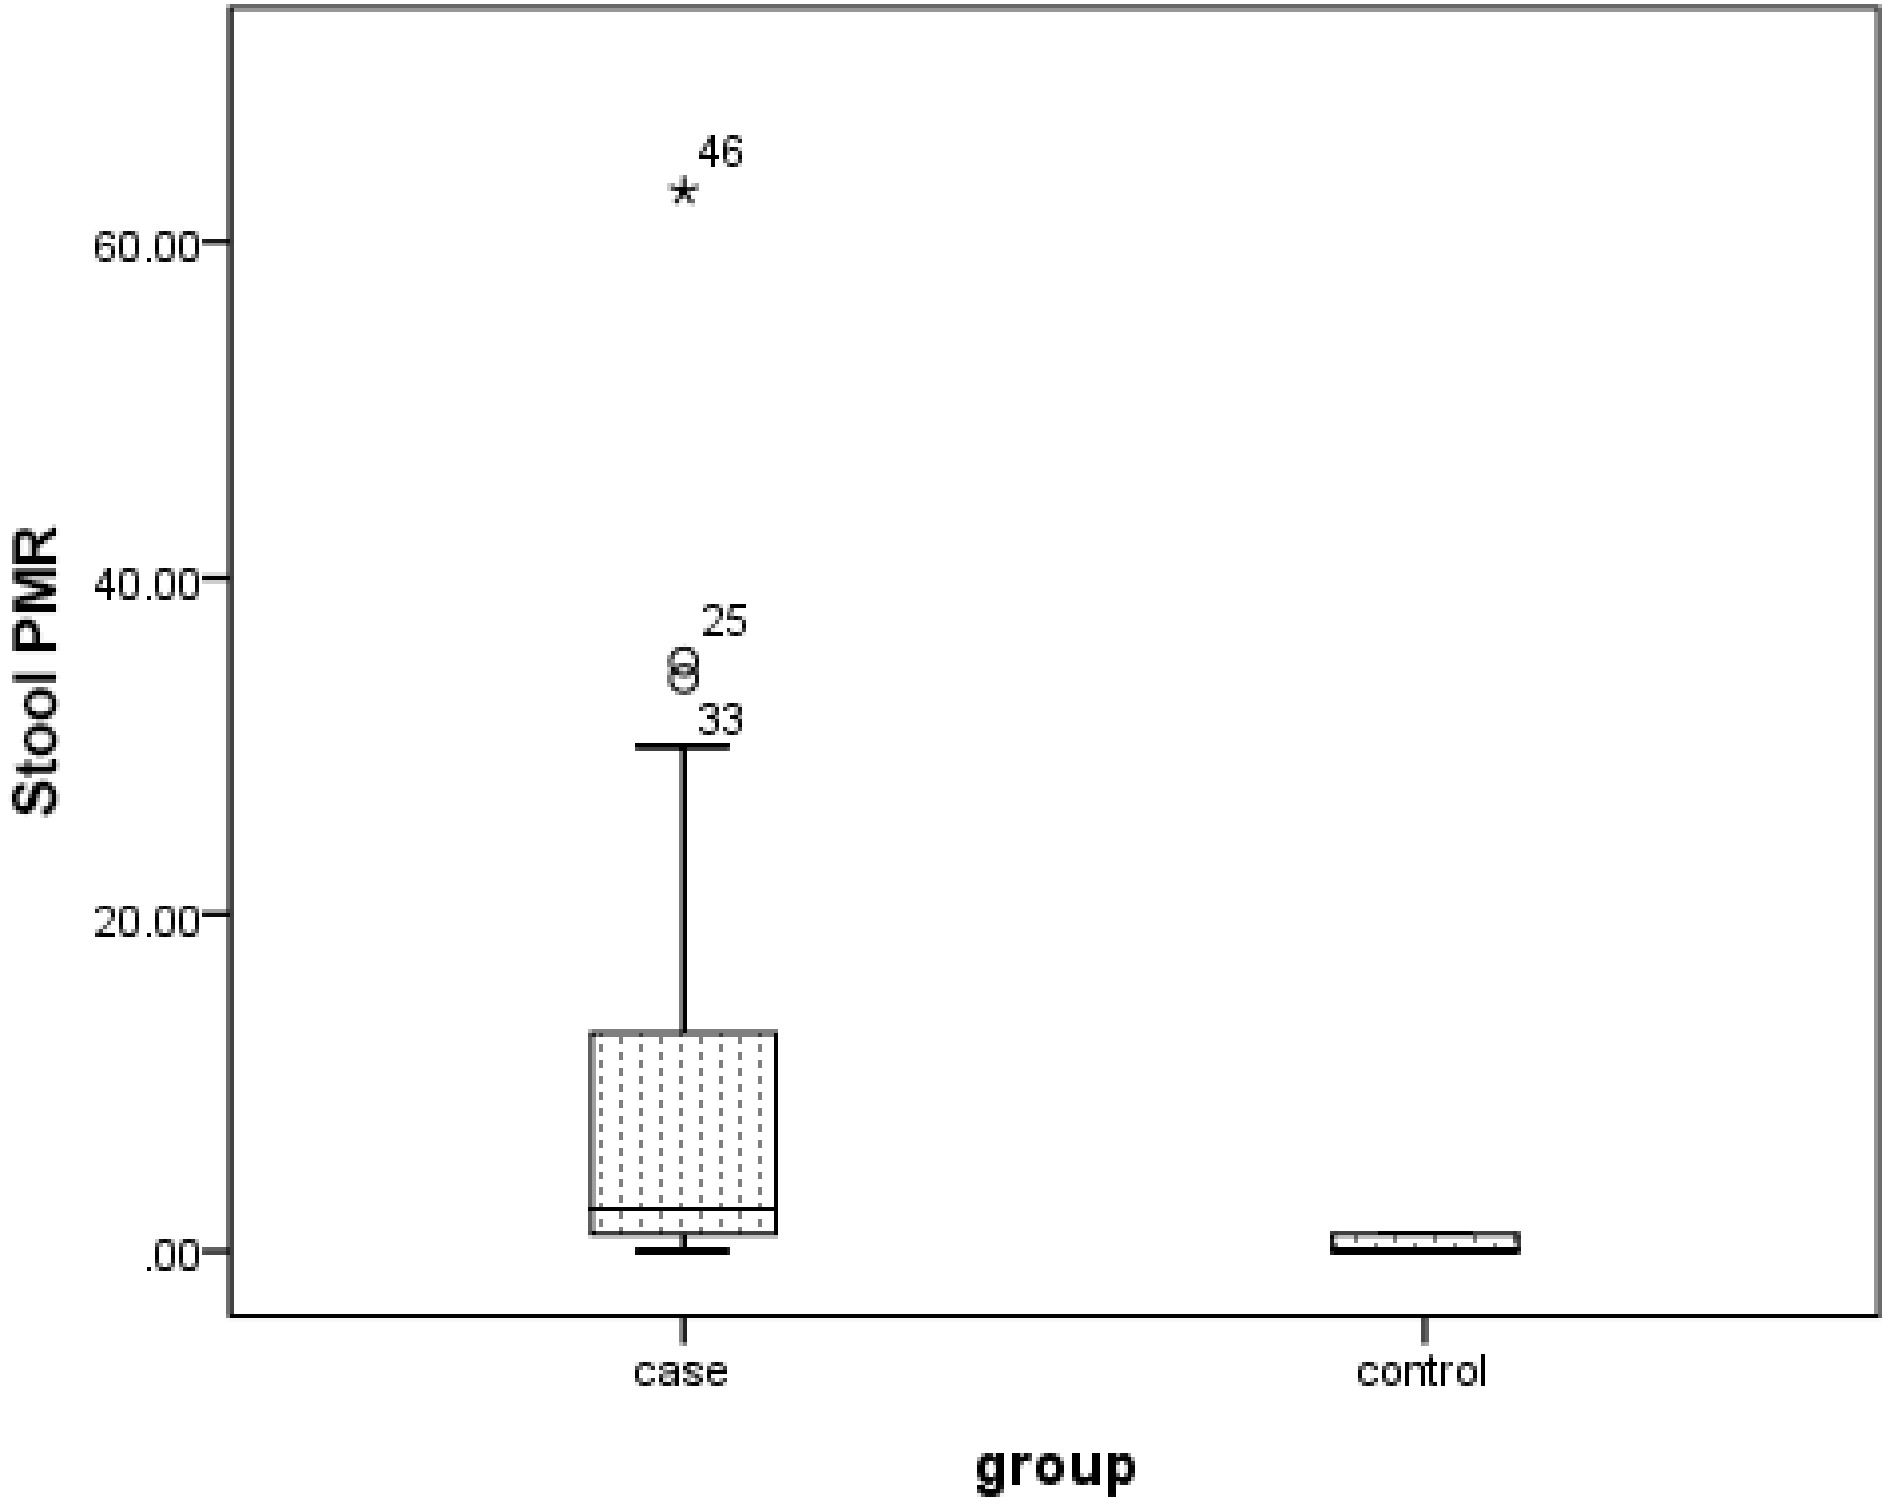
Figure 1.
Box plot for the FOXF1 gene PMR value of stool samples in case and control groups. The boxes show the interquartile range (the interval between the 25th and 75th percentiles). The lines within the boxes indicate the median values.
-
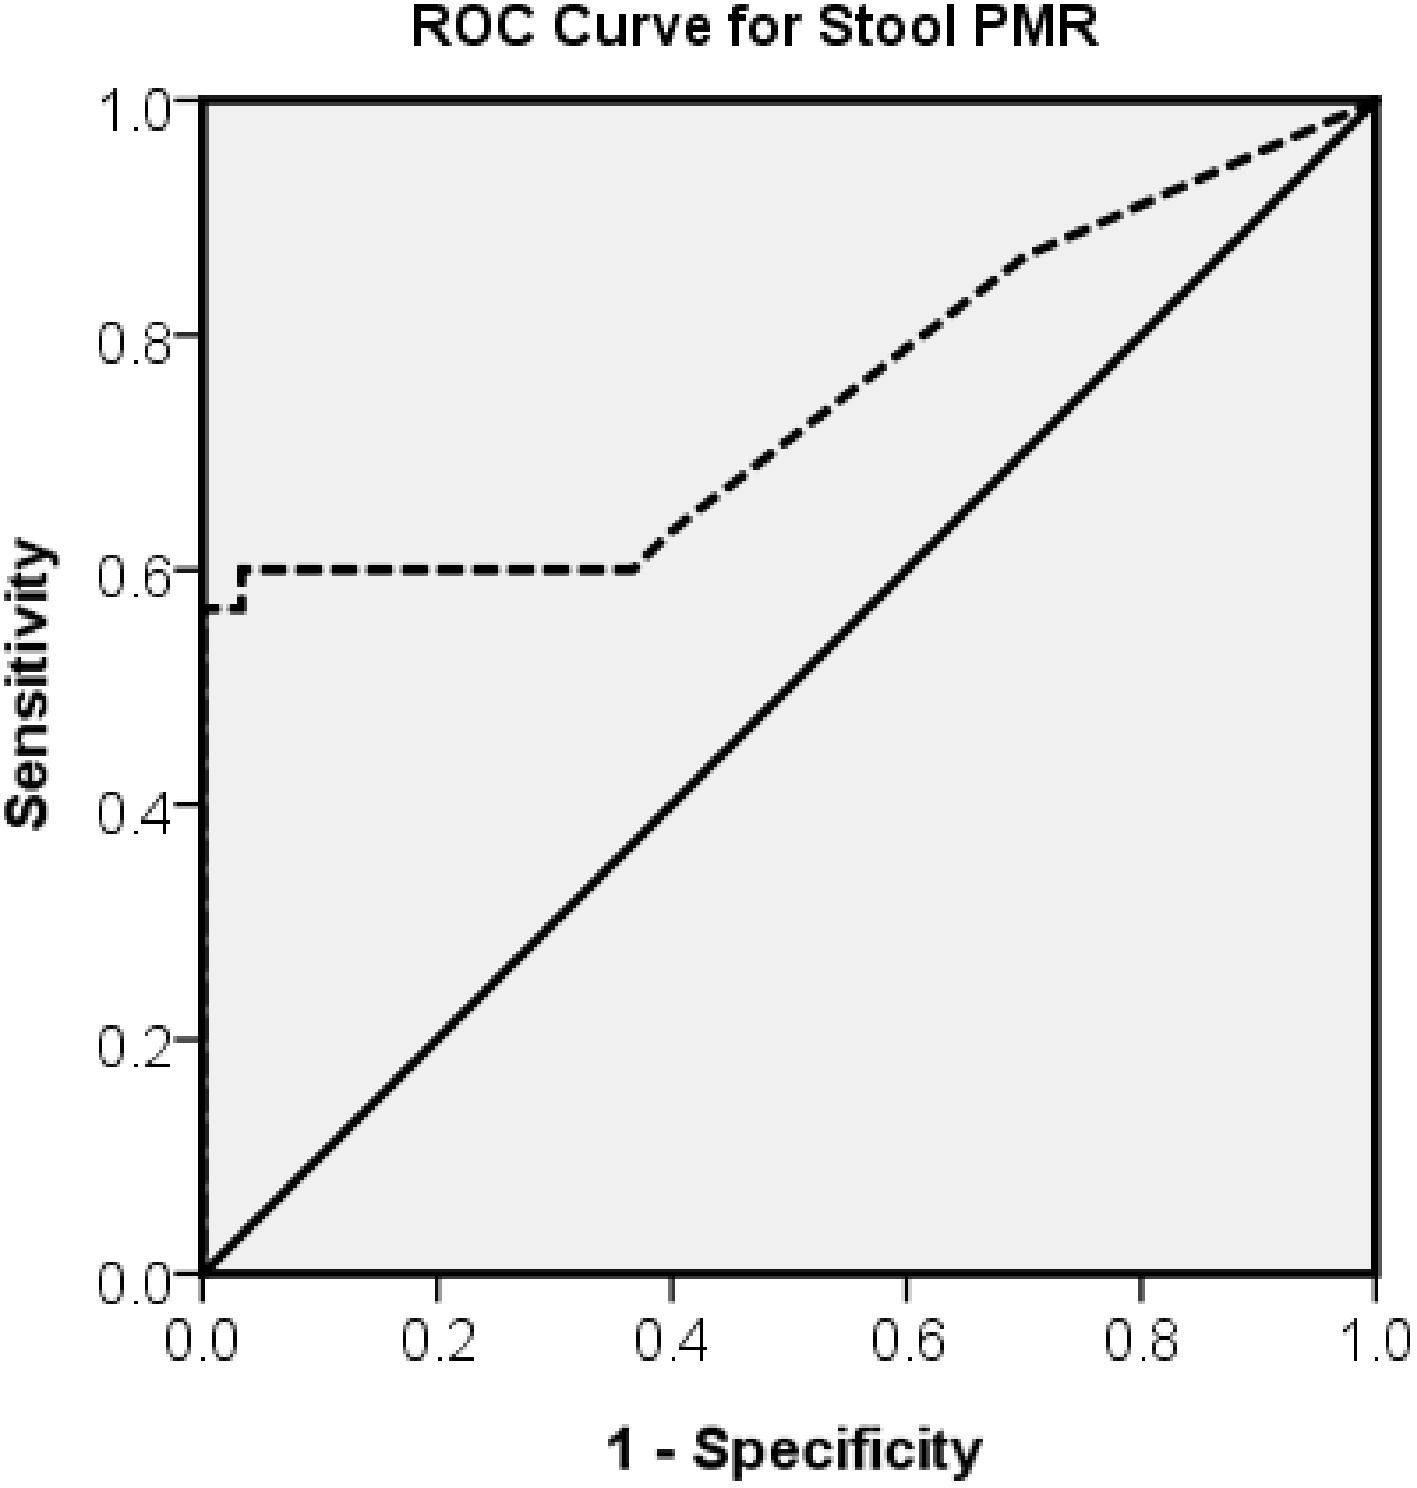
Figure 2.
ROC curve for FOXF1 gene promoter methylation in stool samples.
-
Primers and probes Sequence (5'–3') FOXF1 Forward primer 5'-GTTAATCGTCGGCGGATTTAGTAG-3' Reverse primer 5'-AACTAACTACACCTCTACCGTCAT-3' Probe 5'-6-FAM-ACCACTTCTCCCGAAC
GAACCGC-TAMRA-3'ALU-C4 Forward primer 5'-GGTTAGGTATAGTGGTTTATATT
TGTAATTTTAGTA-3'Reverse primer 5'-ATTAACTAAACTAATCTTAAACT
CCTAACCTCA-3'Probe 5'-6-FAM-CCTACCTTAACCTCCC-TAMRA-3' Table 1.
Primer and probe sequences applied for MethyLight PCR.
-
Demographic features Patient group
(n = 50)Control group
(n = 50)p value* Age (years) 56 ± 12.9 54 ± 12 0.166 Gender
(female:male)3:2 9:7 0.686 * Mann–Whitney U test. Table 2.
The demographic characteristics of the patient group with CRC and the healthy control.
-
No. of patients Minimum Maximum Percentiles** p-value* 25th 50th 75th Stool PMR Patient
group50 0.0 73 0.01 0.06 13.1 < 0.001 Normal group 50 0.0 0.03 0.0 0.01 0.02 * Mann–Whitney U test. ** Explore. Table 3.
Median PMR value results for FOXF1 gene promoter methylation in the stool samples of patients with CRC and healthy controls.
-
Characteristics No. of
patientsStool PMR (percentiles)** p value* 25th 50th 75th Age ≤ 50 years 16 0.99 2.64 13.37 0.5 > 50 years 34 2.05 3.48 13.6 Gender Female 30 2.07 3.9 10.87 0.41 Male 20 1.1 2.55 14.95 Grade Poorly and moderate 10 1.91 3.1 9.15 0.97 Well 40 1.98 2.85 14.5 Location Distal 21 1.34 2.5 5.62 0.06 Proximal 29 2.04 4.6 20.25 Size ≤ 10 mm 25 1.91 2.65 9.02 0.31 > 10 mm 25 1.74 4.7 17.25 Stage Stage I and II 28 2.2 3.65 10.1 0.13 Stage III and IV 22 2.71 4.1 15.6 * Mann–Whitney U test. ** Explore. Table 4.
Association of stool PMR values (percentiles) for the FOXF1 gene with demographic and pathological characteristics of the patient group.
-
Characteristics No. of patients Hypermethylation status** p value* Positive
(%)Negative (%) Age ≤ 50 years 16 12 (75%) 4 (25%) 0.61 > 50 years 34 25 (73.5%) 9 (26.5%) Gender Female 30 24 (80%) 6 (20%) 0.14 Male 20 13 (65%) 7 (35%) Histological grade Poor and
moderate10 8 (80%) 2 (20%) 0.53 Well 40 29 (72.5%) 11 (27.5%) Tumor
locationDistal 21 15 (71.4%) 6 (28.6%) 0.74 Proximal 29 22 (75.9%) 7 (24.1%) Tumor size ≤ 10 mm 25 17 (68%) 8 (32%) 0.34 > 10 mm 25 20 (80%) 5 (20%) Tumor stage Stage I and II 28 23 (82.1%) 5 (17.9%) 0.15 Stage III and IV 22 19 (83.3%) 3 (16.7%) Methylation levels (PMR values) Median PMR
(CRC patients)0.06
(95% CI; 0.01–13.1)− < 0.001 Median PMR (healthy controls) 0.01
(95% CI; 0.0–0.02)− * Fisher's exact test. ** Crosstabs. Table 5.
Association between FOXF1 gene promoter hypermethylation and clinicopathological characteristics.
Figures
(2)
Tables
(5)