-
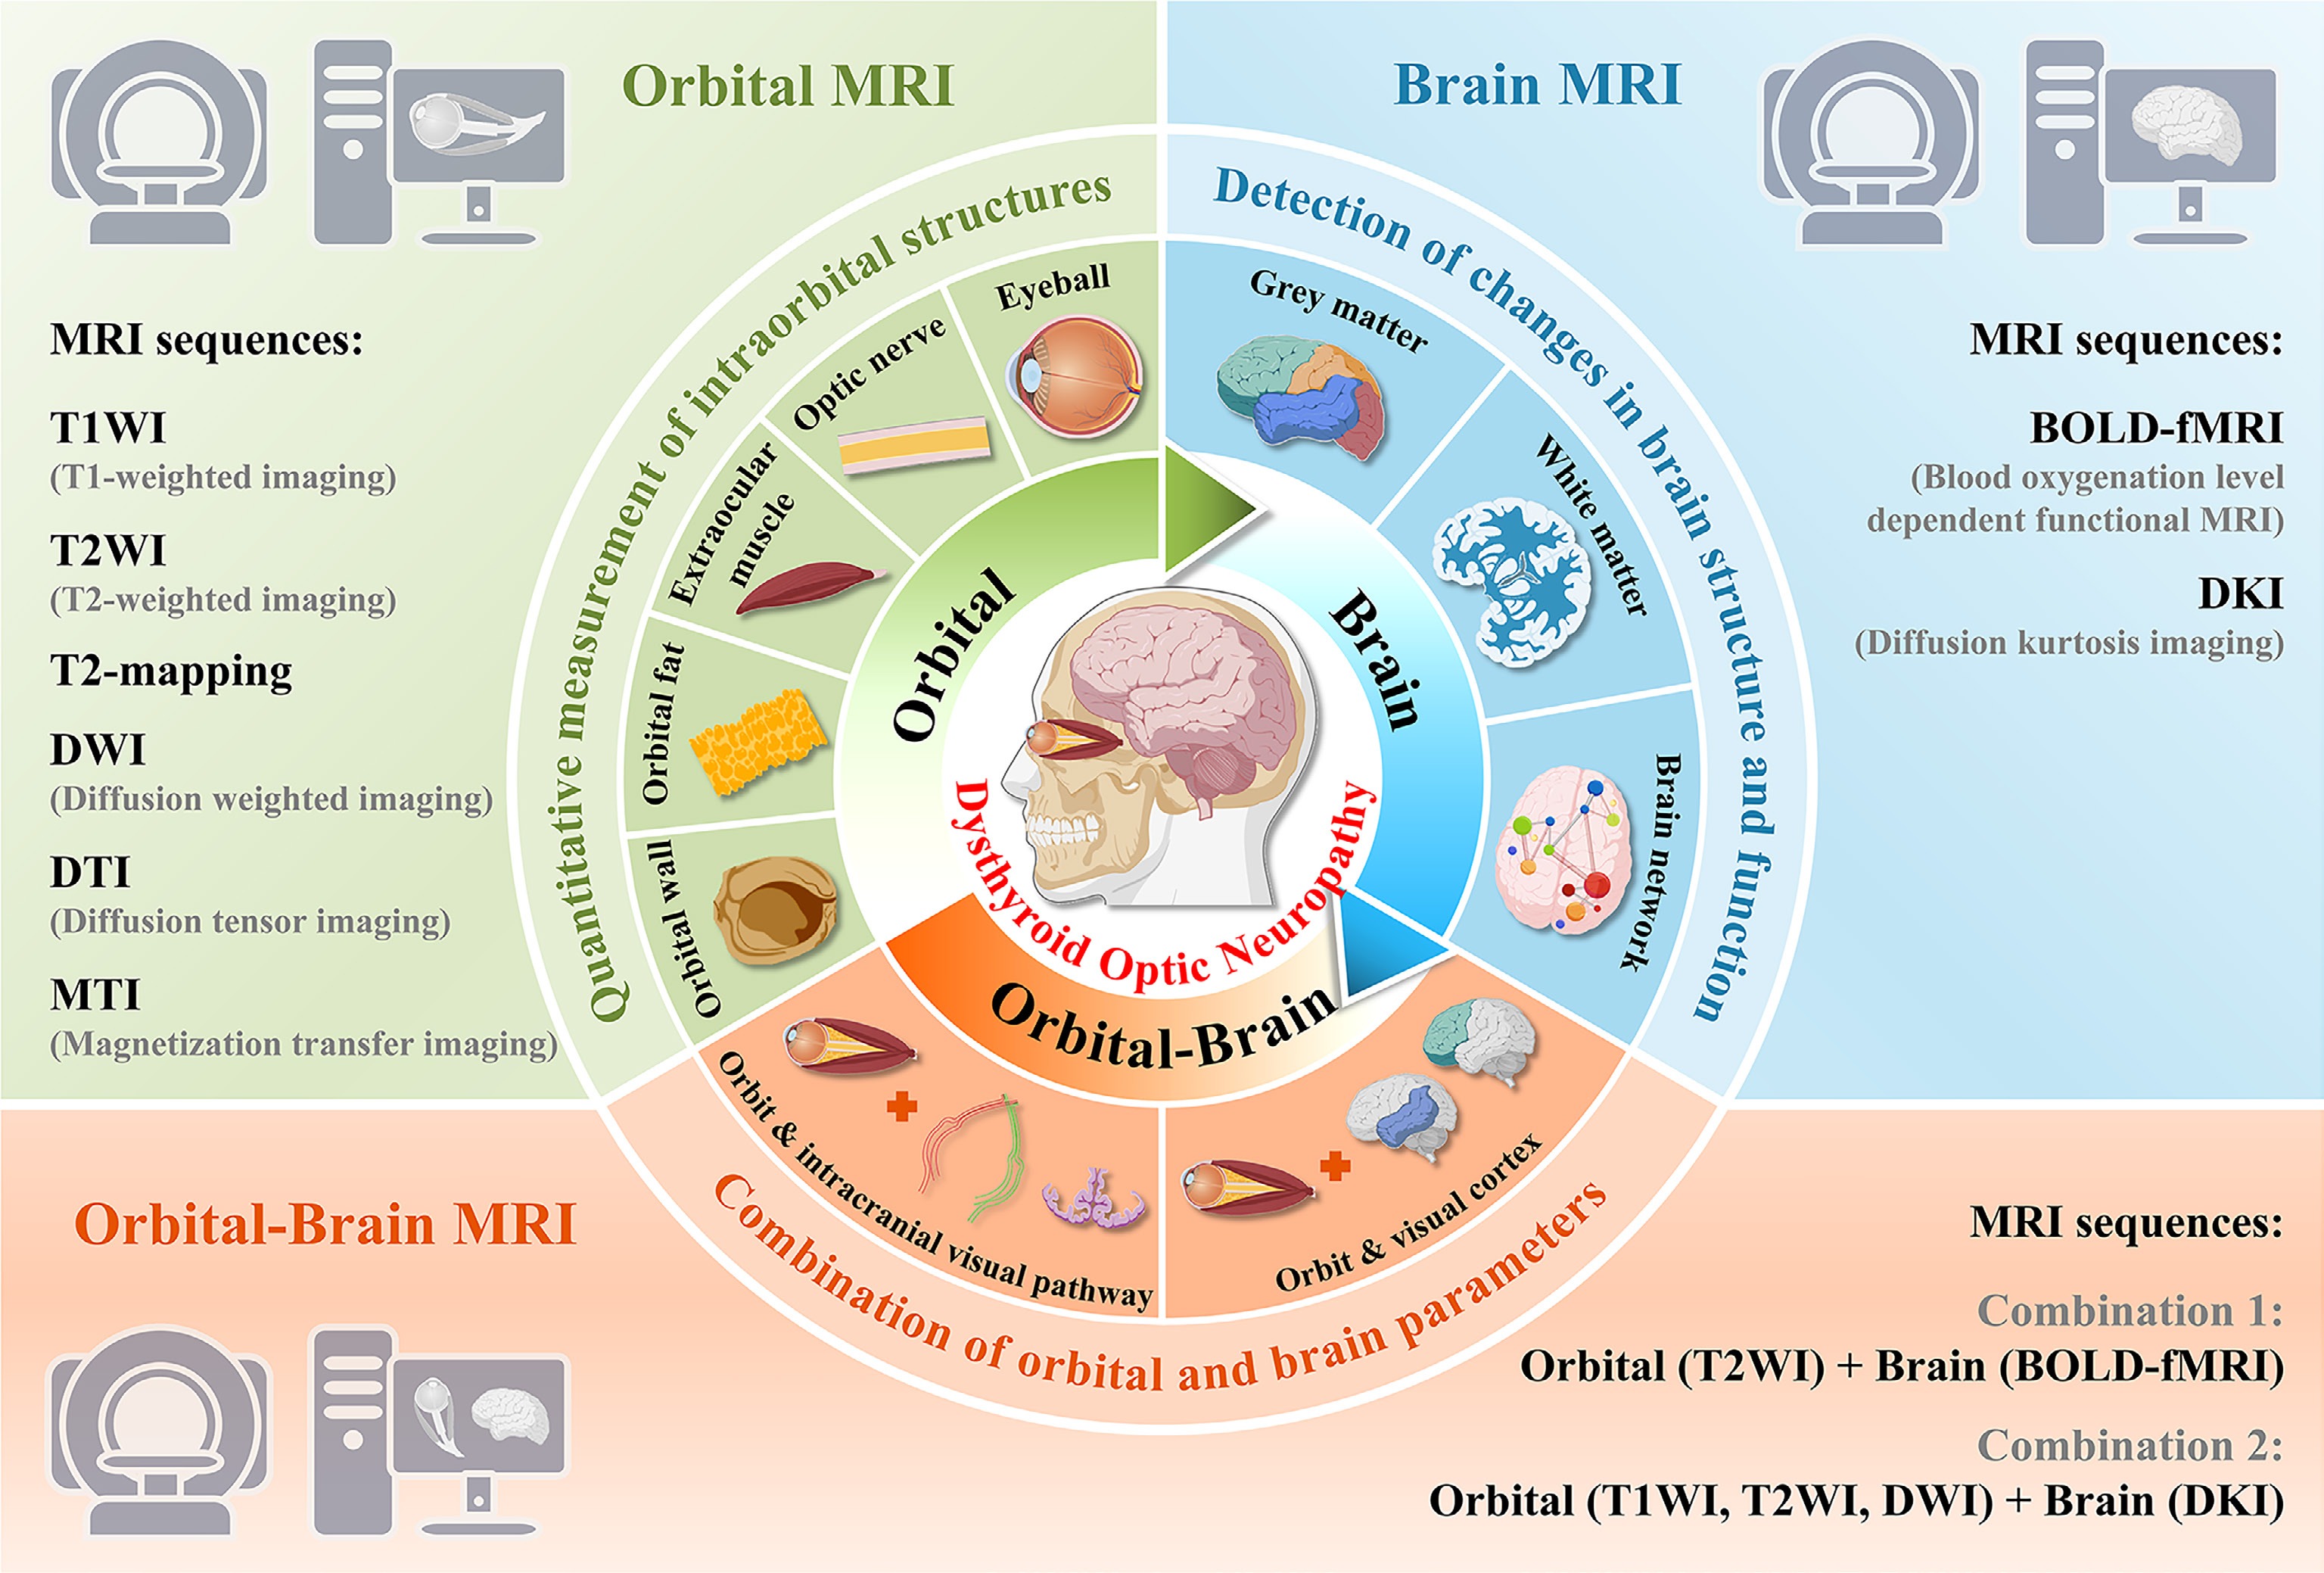
Figure 1.
Schematic overview of current MRI modalities and their applications in the identification of dysthyroid optic neuropathy. This figure was created with
BioGDP.com [41]. -
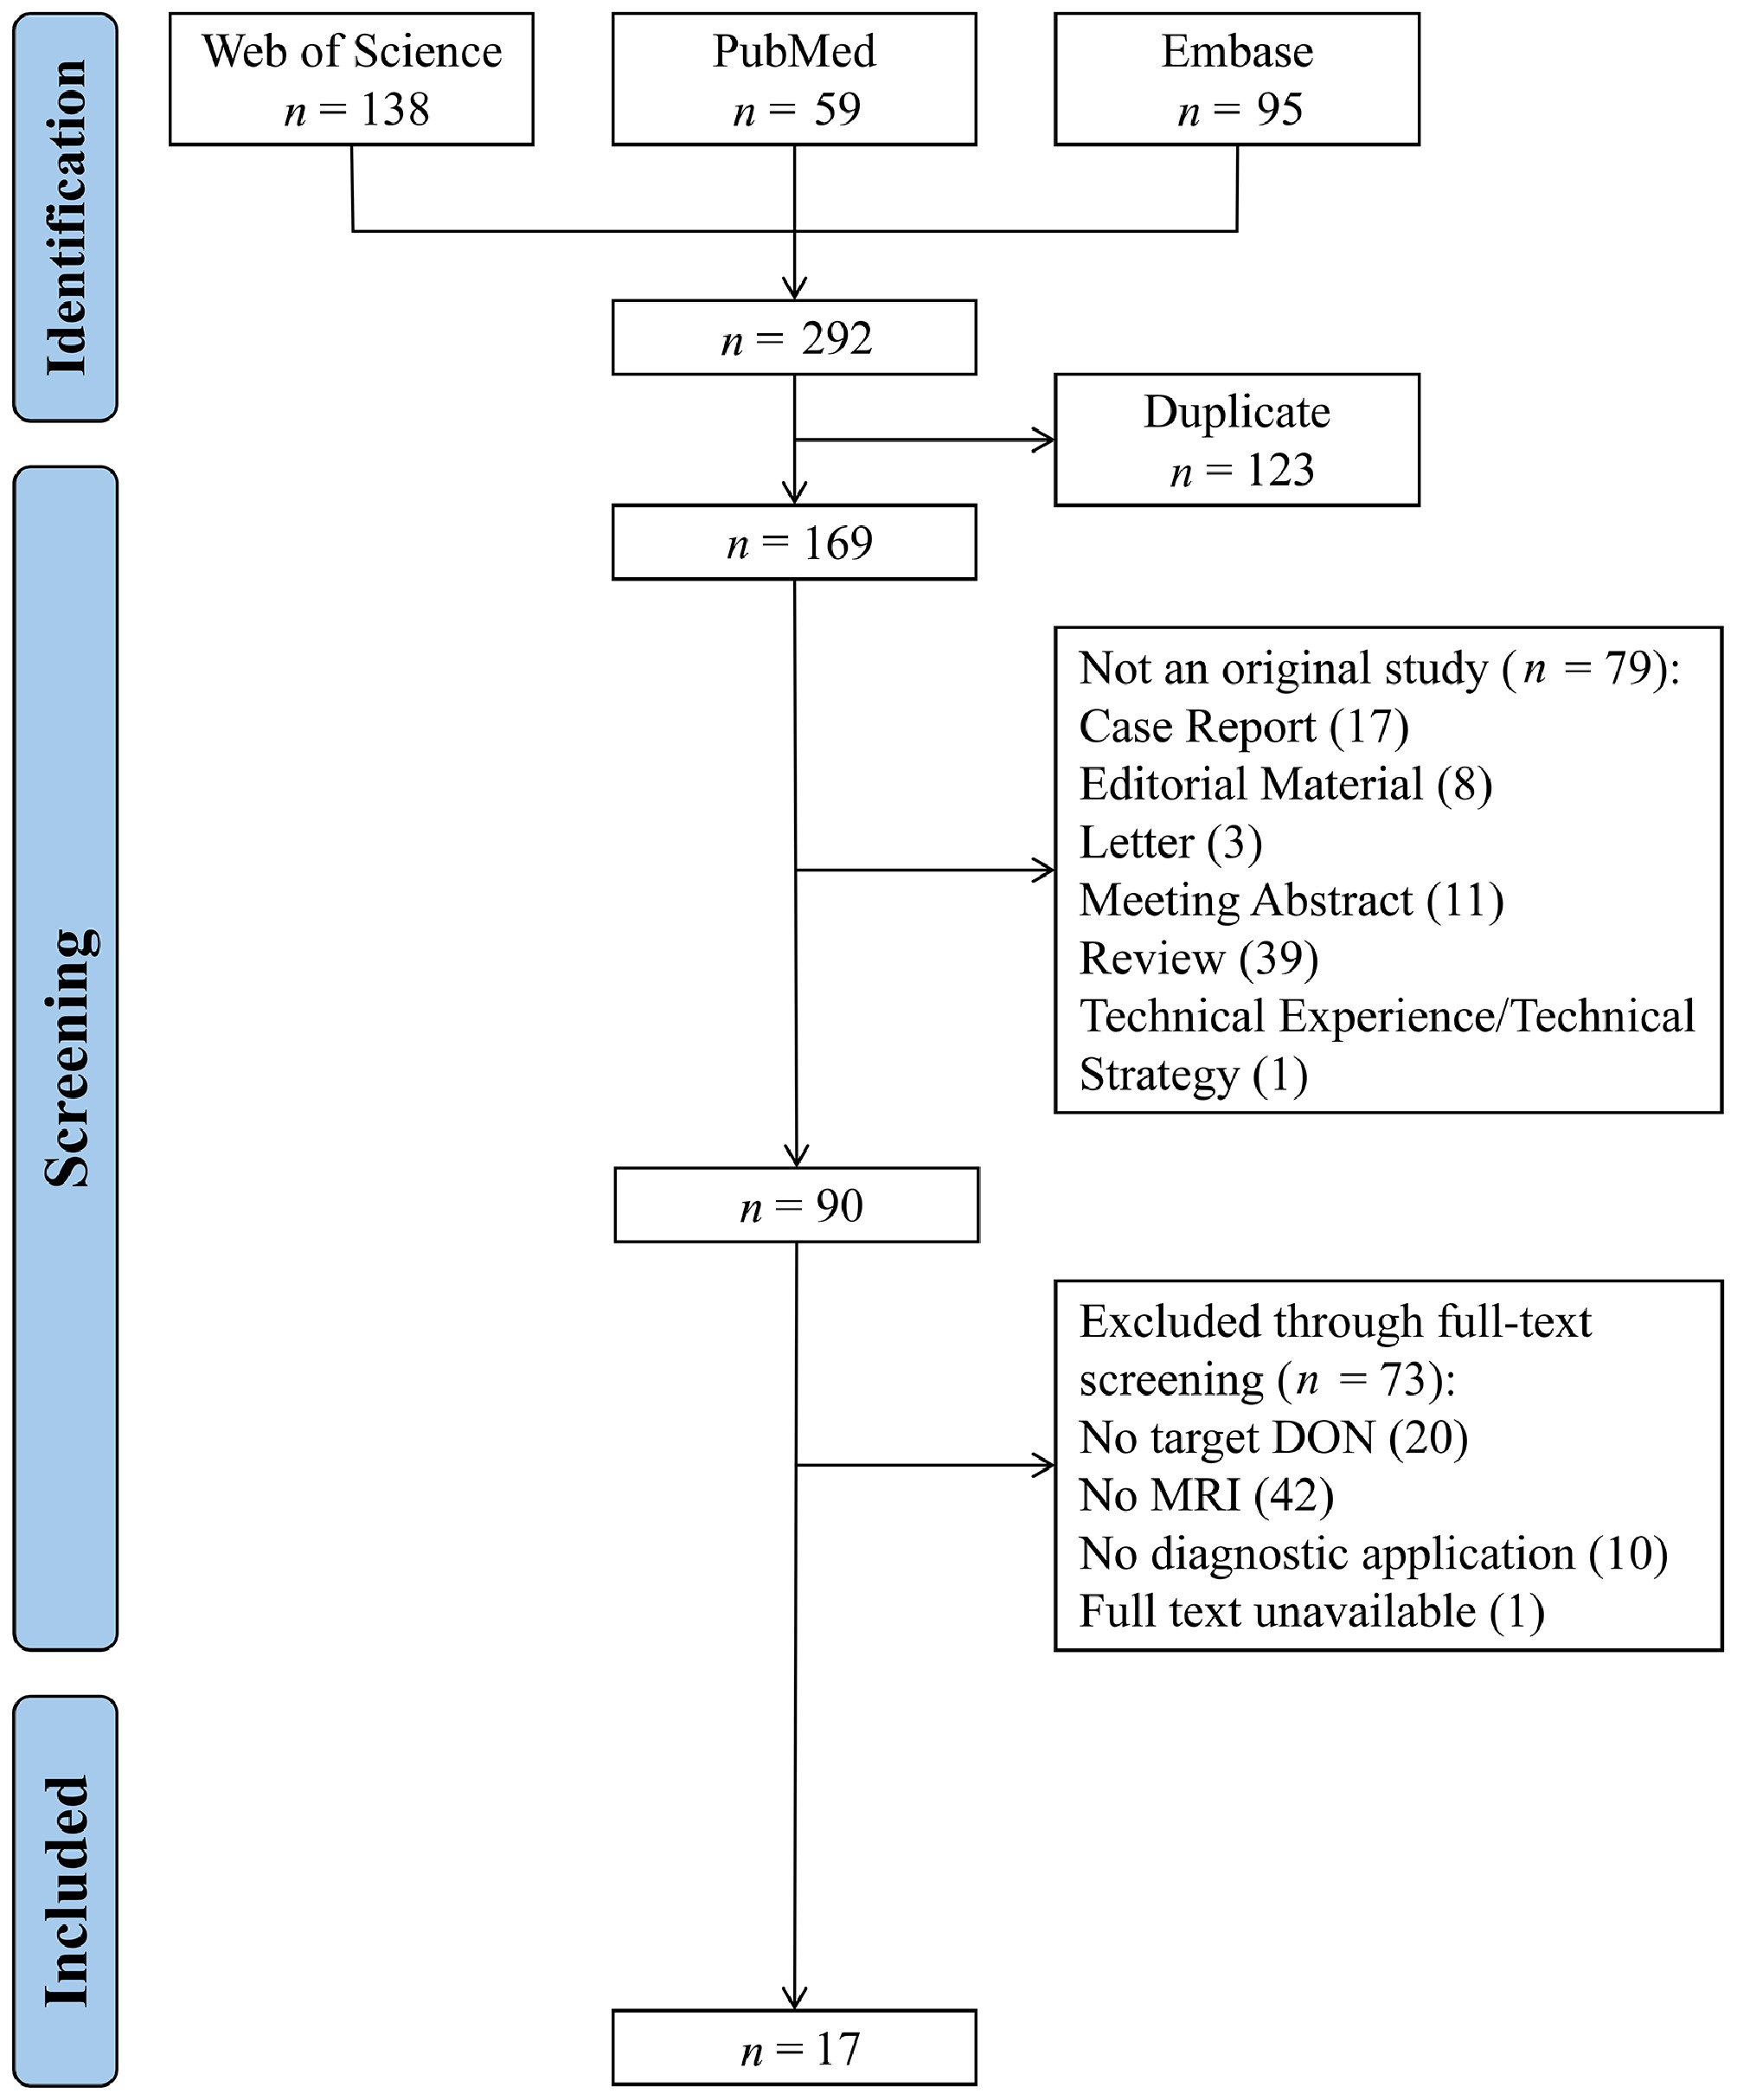
Figure 2.
PRISMA flow diagram.
-
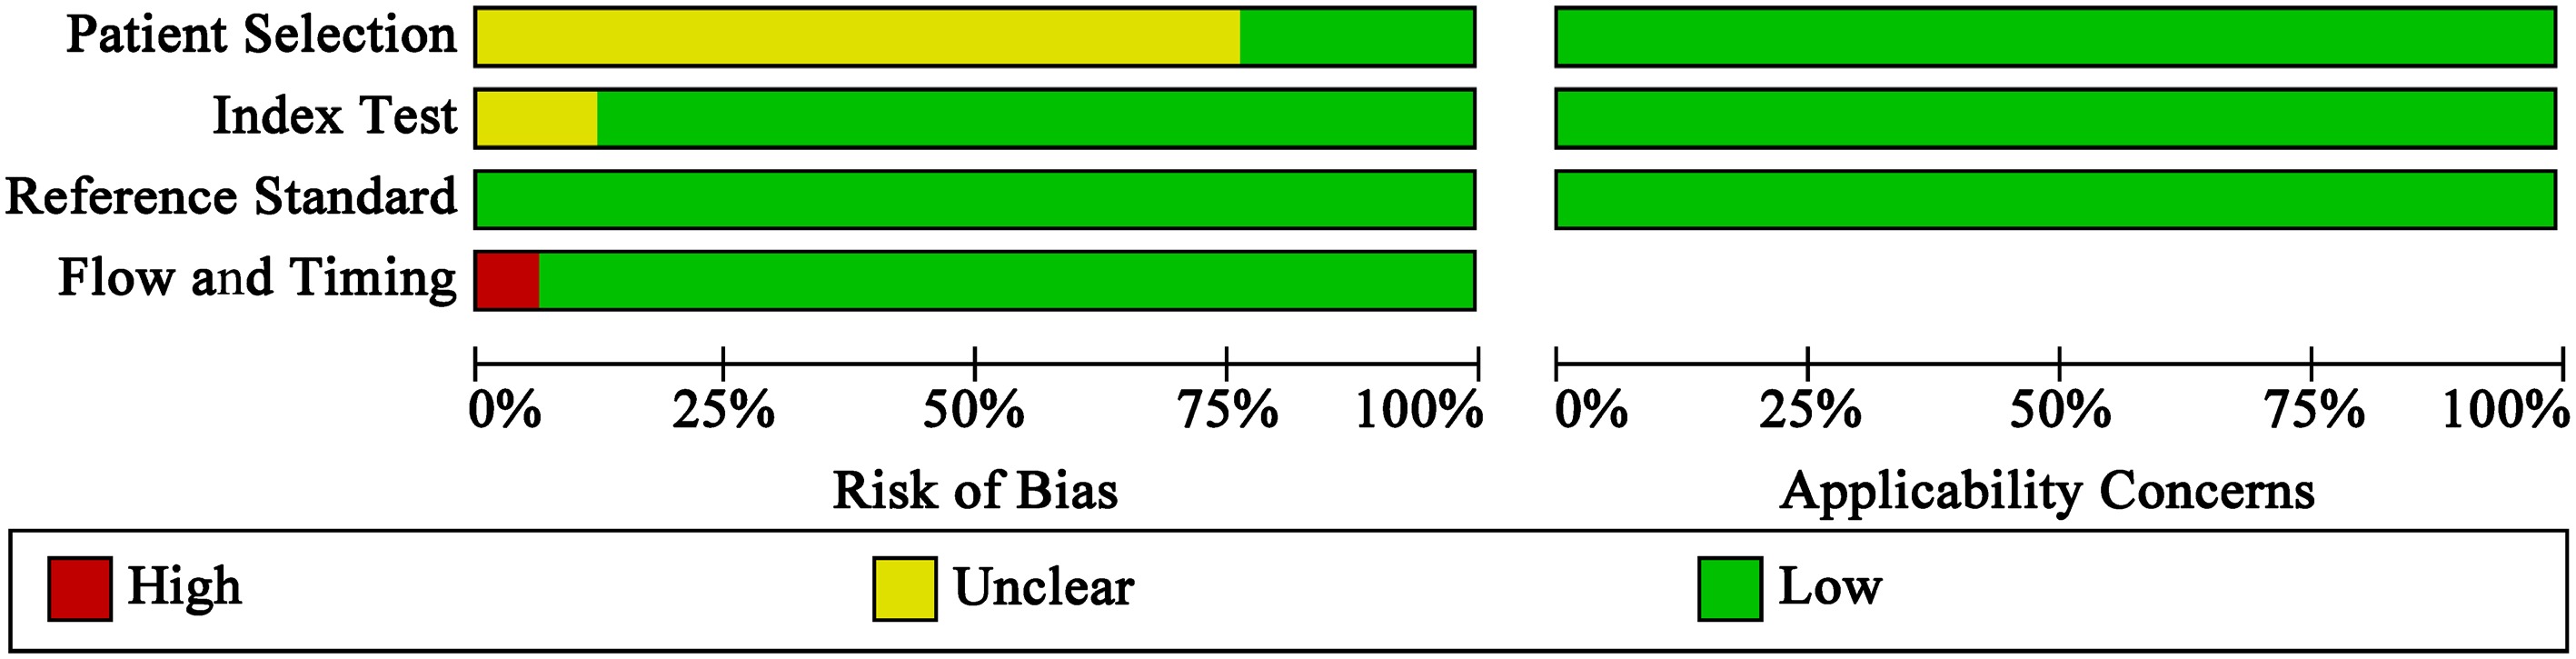
Figure 3.
Summary of QUADAS-2 quality assessment findings regarding the risk of bias and applicability concerns across all included studies.
-
Study/MRI sequences Participant Sample size (patients/
eyes)Age (year) Sex (male/
female)TED duration (months) CAS Smoking history (yes/no) 131I therapy (yes/no) TRAb
(IU/L)BCVA VFI MD (dB) PSD (dB) IOP (mmHg) Proptosis (mm) Wu et al.[31] (2021)
IDEAL-T2WIDON 30/54 50.5 ± 9.99 18/12 6 (4, 12) 4 (2, 5)a 11/19 / / 0.55 ± 0.3a / −4.50 (−10.07, −2.68)a 3.79 (2.02, 6.57)a 20.96 ± 4.60a 19.87 ± 2.59a nDON 30/60 47.63 ± 8.77 13/17 5 (2, 6) 2 (1, 3)a 11/19 / / 0.82 ± 0.27a / −2.05 (−2.85, −0.86)a 1.68 (1.43, 2.13)a 20.08 ± 6.07a 19.15 ± 2.86a HC 19/38 46.53 ± 11.97 7/12 / / 8/11 / / 0.88 ± 0.32a / / / / / Liu et al.[30] (2022)
DTIDON 23/46 55.35 ± 8.89 13/10 6 (2, 10) 2 (1, 4)a 10/13 3/20 16.86 ± 11.16 0.8 (0.5, 1.0)a / −5.64 ± 7.3a 5.44 ± 3.88a 18 (17, 20)a 19 (16, 21)a nDON 36/72 52.14 ± 7.93 18/18 6 (3, 12) 2 (1, 3)a 14/22 8/28 10.56 ± 11.81 1 (0.8, 1)a / −4.69 ± 1.9a 4.59 ± 1.69a 19 (17, 21)a 18 (16.225, 20)a Wu et al.[29] (2022)
IDEAL-T2WITraining cohort DON 46/83 50.93 ± 8.39 25/21 5.59 ± 3.77 4 (2, 5)a 18/28 / / 0.6 (0.5, 1.0)a / / / / 19 (18, 21)a nDON 42/80 45.90 ± 8.64 19/23 8.93 ± 10.90 2 (1, 2.75)a 15/27 / / 0.85 (0.8, 1.0)a / / / / 19 (17.25, 20)a Validation cohort DON 13/21 52.57 ± 12.17 7/6 6.29 ± 4.33 3 (2, 3)a 5/8 / / 0.5 (0.25, 0.8)a / / / / 19 (18, 20)a nDON 27/51 47.1 ± 9.0 18/9 6.97 ± 4.9 2 (1.5, 2)a 9/18 / / 0.8 (0.8, 1.0)a / / / / 19 (18, 20)a Zou et al.[28] (2022)
T1WI, FS-T2WI, Dixon-T2WI, T2-mapping, 3DT1DON 26/43 49.9 ± 12.3 3/23 8 (3, 16) / 20/6 3/23 19.295 (5.097, 41.315) / / / / / / nDON 33/66 45.1 ± 13.1 16/17 6 (3, 12) / 14/19 3/30 10.755 (3.620, 20.125) / / / / / / Zhang et al.[27] (2022)
T1WI, T2WIDON 16/23 45.04 ± 7.85 9/7 / / / / / 0.66 ± 0.38a, * / −16.51 ± 5.81a 5.38 ± 3.49a 21.56 ± 5.01a 18.39 ± 3.14a nDON 23/37 46.05 ± 5.39 12/11 / / / / / 0.10 ± 0.16a, * / −1.96 ± 1.70a 2.13 ± 0.98a 15.68 ± 2.83a 17.56 ± 3.26a HC 11/21 43.09 ± 9.09 6/5 / / / / / −0.01 ± 0.05a, * / / / 14.86 ± 2.43a / Song et al.[26] (2023)
T1WI, Dixon-T2WI, 3DT1DON 24/48 51.00 ± 12.91 13/11 6.00 (3, 12) 4 (4, 5)a 6/18 / 6.240 (3.060, 25.430) / / / / 20 (17, 23)a 18 (14, 22)a nDON 39/78 39.97 ± 10.96 21/18 5.00 (3, 12) 3 (1, 4)a 12/27 / 7.850 (2.470, 24.880) / / / / 17 (16, 19)a 17 (16, 19)a Wu et al.[25] (2024)
IDEAL-T2WITraining cohort DON 30/54 50.5±9.99 18/12 6 (4, 12) 4 (2, 5)a 11/19 4/26 / 0.55 ± 0.3a / / / 20.96 ± 4.60a 19.87 ± 2.59a nDON 30/60 47.63±8.77 13/17 5 (2, 6) 2 (1, 3)a 11/19 5/25 / 0.82 ± 0.27a / / / 20.08 ± 6.07a 19.15 ± 2.86a Validation cohort DON 14/26 55.2 ± 8.07 9/5 6 (2, 8) 4 (2, 5)a 4/10 2/12 / 0.61 ± 0.25a / / / 19.8 ± 3.29a 19.57 ± 2.03a nDON 15/30 45.29 ± 5.68 9/6 6 (4, 10) 3 (1, 3)a 3/12 2/13 / 0.87 ± 0.26a / / / 19.39 ± 2.79a 18.92 ± 3.08a Moledina et al.[24] (2025)
T1WI, STIR-T2WI, DWIDON 26/NA / 5/21 / 3.52 ± 1.72a 7/19 4/15# / / / / / / / nDON 516/NA / 105/369# / 0.54 ± 0.80a 115/332# 66/374# / / / / / / / Li et al.[23] (2025)
T1WI, FS-T2WIDON NA/16 53.43 ± 12.55 / / / / / / 0.22 ± 0.14a, * / / / 20.75 ± 5.97a / Moderate to severe TED NA/48 43.22 ± 11.87 / / / / / / 0.07 ± 0.09a, * / / / 20.48 ± 6.14a / Mild TED NA/45 42.94 ± 9.94 / / / / / / 0.01 ± 0.02a, * / / / 18.73 ± 3.17a / Zhou et al.[22] (2025)
MTI, FS-T2WI, DWITraining cohort DON 30/46 57.93 ± 10.97 13/17 8 (5, 13) 4 (3, 5)a 12/18 / 8.06 (2.96, 26.35) 0.6 (0.2, 0.7)a 0.86 (0.42, 0.96)a −6.21 (−19.01, −3.09)a 3.98 (2.12, 8.21)a / 21.37 ± 3.25a nDON 74/148 42.85 ± 13.14 24/50 7 (4, 18) 2 (1, 3)a 28/46 / 2.17 (0.81, 6.76) 1.0 (1.0, 1.0)a 0.99 (0.97, 0.99)a −1.18 (−2.31, −0.38)a 1.53 (1.30, 2.08)a / 19.57 ± 3.21a Validation cohort DON 13/20 54.46 ± 14.09 5/8 7 (4, 14) 4 (3, 5)a 7:6 / 5.93 (1.69, 16.42) 0.6 (0.4, 0.7)a 0.83 (0.50, 0.97)a −6.70 (−16.50, −2.88)a 4.71 ± 2.97a / 20.78 ± 3.40a nDON 32/64 44.50 ± 11.48 5/27 10 (3, 24) 2 (1, 3)a 12:20 / 2.39 (0.88, 12.97) 1.0 (1.0, 1.0)a 0.99 (0.98, 1.00)a −0.85 (−1.79, 0.06)a 1.69 ± 0.73a / 18.68 ± 3.20a Jiang et al.[38] (2021)
Bold-fMRIDON 16/NA 54.85 ± 5.02 6/10 / / / / / 0.55 ± 0.25/
0.35 ± 0.20b/ / / / / nDON 16/NA 53.09 ± 5.16 6/10 / / / / / 1.05 ± 0.10/
1.05 ± 0.10b/ / / / / Liu et al.[37] (2023)
Bold-fMRIDON 20/NA 54.65 ± 7.82 10/10 6 (2, 36) 4 (1~7)/
4 (1~7)b9/11 7/13 17.39 ± 11.69 0.36 ± 0.22/
0.38 ± 0.17b/ / / 18.92 ± 4.39/
18.52 ± 3.84b19.30 ± 1.90/
18.85 ± 2.72bnDON 27/NA 52.00 ± 6.63 13/14 8 (3, 33) 1 (0~6)/
1 (0~6)b14/13 9/18 12.53 ± 11.08 0.98 ± 0.14/
0.91 ± 0.17b/ / / 18.98 ± 6.01/
20.01 ± 7.27b16.80 ± 3.62/
18.98 ± 6.01bHC 33/NA 54.03 ± 6.72 17/16 / / 13/20 / / / / / / / / Zhou et al.[36] (2024)
Bold-fMRIDON 28/NA 54.00 ± 11.44 13/15 12.36 ± 8.99 4.14 ± 1.33/
4.07 ± 1.33b12/16 / / 0.66 ± 0.24/
0.60 ± 0.27b0.83 ± 0.22/
0.87 ± 0.22b−7.32 ± 6.91/
−5.69 ± 6.74b3.81 ± 2.75/
3.39 ± 2.43b/ 20.14 ± 3.18/
21.02 ± 3.40bnDON 38/NA 49.18 ± 8.41 15/23 12.61 ± 14.31 2.92 ± 1.22/
2.94 ± 1.21b18/20 / / 0.97 ± 0.12/
0.94 ± 0.13b/ / / / 18.91 ± 3.00/
19.62 ± 2.92bHC 30/NA 50.30 ± 11.97 11/19 / / 12/18 / / 0.98 ± 0.13/
0.97 ± 0.11b/ / / / / Zhou et al.[35] (2025)
DKIDON 21/NA 53.7 ± 13.9 9/12 10.0 (6.5, 13.5) 5.0 (3.5, 5.0)/
5.0 (3.0, 5.0)b10/11 / / 0.80 (0.50, 1.00)/
0.70 (0.55, 0.80)b0.94 (0.80, 0.98)/
0.93 (0.76, 0.97)b/ / / 19.7 ± 3.4/
21.2 ± 3.8bnDON 32/NA 45.6 ± 12.7 12/20 8.0 (4.3, 17.3) 2.0 (2.0, 3.0)/
2.0 (2.0, 3.0)b10/22 / / 1.00 (1.00, 1.00)/
1.00 (0.80, 1.00)b0.99 (0.98, 1.00)/
0.99 (0.96, 1.00)b/ / / 18.3 ± 2.5/
18.8 ± 2.5bHC 30/NA 45.4 ± 15.5 10/20 / / 11/19 / / 1.00 (1.00, 1.00)/
1.00 (1.00, 1.00)b/ / / / / Lu et al.[34] (2025)
Bold-fMRIDON 23/NA 56.04 ± 11.46 11/12 12.04 ± 9.59 4.48 ± 1.27/
4.39 ± 1.31b9/14 / / 0.60 ± 0.28/
0.60 ± 0.27b0.73 ± 0.31/
0.82 ± 0.30b/ / / 20.67 ± 3.22/
21.35 ± 3.53bnDON 34/NA 51.35 ± 7.07 10/24 14.56 ± 14.49 2.21 ± 1.23/
2.24 ± 1.23b11/23 / / 0.99 ± 0.13/
0.97 ± 0.14b/ / / / 17.35 ± 2.79/
17.62 ± 3.03bHC 27/NA 52.44 ± 7.93 10/17 / / 13/14 / / 1.00 ± 0.12/
1.00 ± 0.11b/ / / / / Zhang et al.[39] (2024)
Dixon-T2WI, Bold-fMRIDON 47/NA 50.36 ± 12.26 18/29 14.33 (6.00, 20.00) 3.23 ± 1.88a 12/35 / 11.70 (2.68, 16.60) 0.34 ± 0.23a / / / 20.00 (17.10, 21.00)a 19.55 ± 2.88a nDON 56/NA 50.48 ± 9.095 22/34 17.46 (6.00, 15.00) 2.34 ± 1.56a 13/43 / 4.67 (1.10, 15.58) 0.95 ± 0.08a / / / 18.50 (17.00, 20.50)a 19.33 ± 2.58a HC 36/NA 45.64 ± 14.43 16/20 / / / / / 0.96 ± 0.07a / / / / / Hu et al.[40] (2024)
T1WI, FS-T2WI, DWI, DKIDON 25/40 56.6 ± 11.4 11/14 8 (5, 12) 5 (3, 5)a 10/15 1/24 5.00 (2.30, 11.48) 0.6 (0.4, 0.7)a 0.88 (0.43, 0.95) −6.04 (−19.89, −3.40)a 3.13 (1.98, 5.15)a 17.7 (14.9, 20.9)a 20.3 (18.1, 23.8)a nDON 36/72 45.6 ± 10.7 16/20 7 (3, 18) 2 (1, 3)a 17/19 3/33 2.14 (1.27, 8.48) 1.0 (1.0, 1.0)a 0.99 (0.98, 1.00) −0.92 (−2.19, 0.31)a 1.50 (1.24, 1.90)a 15.9 (13.7, 18.8)a 19.0 (17.0, 22.0)a a Data are presented as the average. b Data are presented as right eye (OD)/left eye (OS). *BCVA according to a logMAR visual chart. # Existence of missing data. Values in parentheses separated by a comma represent the 25th and 75th percentiles, whereas those separated by a tilde represent the range. MRI, magnetic resonance imaging; TED, thyroid eye disease; DON, dysthyroid optic neuropathy; HC, healthy control; CAS, clinical activity score; TRAb, thyrotropin receptor antibody; BCVA, best-corrected visual acuity; VFI, visual field index; MD, mean deviation; PSD, pattern standard deviation; IOP, intraocular pressure; T1WI, T1-weighted imaging; T2WI, T2-weighted imaging; DWI, diffusion-weighted imaging; DTI, diffusion tensor imaging; DKI, diffusion kurtosis imaging; MTI, magnetization transfer imaging; Bold-fMRI, blood oxygenation level-dependent functional MRI. Table 1.
Demographic and clinical characteristics of participants in the included studies.
-
Study Parameters or models Condition
(DON vs. nDON)AUC Cut-off value Sensitivity Specificity p-value Wu et al.[31] (2021) Optic nerve signal intensity ratio 3 mm behind the eyeball DON > nDON 0.66 1.71 0.55 0.71 / 6 mm behind the eyeball DON > nDON 0.69 1.55 0.57 0.71 / Optic nerve water fraction (%) 3 mm behind the eyeball DON > nDON 0.78 91.55 0.51 0.96 / 6 mm behind the eyeball DON > nDON 0.76 88.48 0.70 0.70 / Optic nerve subarachnoid space (mm) 3 mm behind the eyeball DON > nDON 0.95 2.35 0.91 0.90 / 6 mm behind the eyeball DON > nDON 0.93 2.00 0.91 0.86 / Optic nerve sheath diameter (mm) 3 mm behind the eyeball DON > nDON 0.93 5.45 0.83 0.95 / 6 mm behind the eyeball DON > nDON 0.91 4.55 0.78 0.87 / Optic nerve diameter (mm) 3 mm behind the eyeball DON > nDON 0.73 2.95 0.72 0.68 / 6 mm behind the eyeball DON > nDON 0.76 2.35 0.78 0.67 / Optic nerve sheath area (mm2) 3 mm behind the eyeball DON > nDON 0.90 21.5 0.82 0.89 / 6 mm behind the eyeball DON > nDON 0.89 15.5 0.82 0.82 / Optic nerve area (6 mm behind the eyeball) (mm2) DON > nDON 0.73 6.5 0.78 0.62 / Optic nerve area/optic nerve sheath area (%) 3 mm behind the eyeball DON < nDON 0.89 44.09 0.89 0.85 / 6 mm behind the eyeball DON < nDON 0.85 45.23 0.89 0.73 / Fluid volume in the optic nerve sheath (mm3) DON > nDON 0.93 0.166 0.85 0.93 / Liu et al.[30] (2022) Optic nerve axial diffusivity (ONAD) (×10–3 mm2/s) DON > nDON 0.644 1.927 0.7174 0.6071 / Optic nerve radial diffusivity (ONRD) (×10–3 mm2/s) DON > nDON 0.640 0.791 0.8696 0.4554 / Optic nerve mean diffusivity (ONMD) (×10–3 mm2/s) DON > nDON 0.727 1.164 0.9565 0.4732 / Optic nerve fractional anisotropy (ONFA) DON < nDON 0.709 0.574 0.9565 0.3571 / ONAD + ONRD / 0.666 0.711 0.7609 0.5714 / ONAD + ONMD / 0.720 0.719 0.8261 0.5804 / ONAD + ONFA / 0.748 0.728 0.7609 0.6161 / ONRD + ONMD / 0.746 0.716 0.8043 0.6071 / ONRD + ONFA / 0.717 0.713 0.7174 0.6250 / ONMD + ONFA / 0.768 0.738 0.8478 0.6429 / ONAD + ONRD + ONMD / 0.744 0.721 0.8261 0.6071 / ONAD + ONRD + ONFA / 0.748 0.736 0.8043 0.5893 / ONAD + ONMD + ONFA / 0.765 0.709 0.8043 0.6786 / ONRD + ONMD + ONFA / 0.784 0.727 0.7826 0.6786 / ONAD + ONRD + ONMD + ONFA / 0.801 0.729 0.8043 0.6696 / Wu et al.[29] (2022) Training cohort Convention MRI evaluation (apical crowding sign + optic nerve stretching sign) / 0.801 / 0.867 0.638 / Radiomics signature* / 0.889 / 0.687 0.950 / Radiomics nomogram (conventional MRI evaluation + radiomics signature*) / 0.921 / 0.867 0.825 / Validation cohort Convention MRI evaluation (apical crowding sign + optic nerve stretching sign) / 0.745 / 0.762 0.608 0.04 (vs. Radiomics nomogram) Radiomics signature* / 0.848 / 0.667 0.843 / Radiomics nomogram (conventional MRI evaluation + radiomics signature*) / 0.876 / 0.905 0.706 / Zou et al.[28] (2022) Modified muscle index at the posterior globe of 21 mm (mMI at 21 mm) (%) DON > nDON 0.848 55.1 0.651 0.907 / Optic nerve T2 value (ms) DON > nDON 0.805 119.2 0.884 0.653 / mMI at 21 mm + optic nerve T2 value / 0.918 0.2 0.953 0.760 / Zhang et al.[27] (2022) Extraocular muscle volume (mL) DON > nDON 0.850 4.035 1.000 0.703 / Fat volume (mL) DON > nDON 0.674 / / / / Whole volume (mL) DON > nDON 0.726 / / / / Extraocular muscle volume/fat volume DON > nDON 0.712 / / / / Song et al.[26] (2023) Optic nerve signal intensity ratio 3 mm behind the eyeball (ONSIR3) DON > nDON 0.834 1.639 0.829 0.714 / 6 mm behind the eyeball DON > nDON 0.732 / / / < 0.001 (vs. ONSIR3) 9 mm behind the eyeball DON > nDON 0.641 / / / < 0.001 (vs. ONSIR3) Extraocular muscle volume index at the orbital apex (AMI) (%) DON > nDON 0.898 41.781 0.886 0.890 / Extraocular muscle volume at the orbital apex (cm3) DON > nDON 0.836 / / / 0.016 (vs. AMI) Extraocular muscle volume (cm3) DON > nDON 0.802 / / / 0.007 (vs. AMI) Medial rectus muscle volume (cm3) DON > nDON 0.806 / / / 0.009 (vs. AMI) Extraocular muscle volume index (%) DON > nDON 0.795 / / / 0.002 (vs. AMI) Barrett index (%) DON > nDON 0.846 / / / 0.048 (vs. AMI) Effective orbital volume (cm3) DON > nDON 0.621 / / / / Axial length of the eyeball (mm) DON < nDON 0.629 / / / / ONSIR3 + AMI / 0.943 / / / 0.003 (vs. ONSIR3)
0.013 (vs. AMI)Wu et al.[25] (2024) Training cohort Cerebrospinal fluid volume in the optic nerve sheath + optic
nerve subarachnoid space (3 mm behind the eyeball)/ 0.994 / 0.944 0.967 / Validation cohort Cerebrospinal fluid volume in the optic nerve sheath + optic
nerve subarachnoid space (3 mm behind the eyeball)/ 0.960 / 0.889 0.893 / Moledina et al.[24] (2025) Apparent diffusion coefficient value of the most involved muscle (×10–6 mm2/s) DON > nDON 0.844 1115 0.789 0.782 / 796.5 1.000 0.248 / 1498 0.316 0.977 / Li et al.[23] (2025) Volume of the medial orbital wall (cm3) DON < nDON 0.808 –0.065 0.813 0.753 / Zhou et al.[22] (2025) Training cohort Mean magnetization transfer ratio of optic nerve (MTRmean) (%) DON < nDON 0.831 40.0 0.739 0.791 < 0.001 (vs. MTRmean + ADCmean + mMI) Mean apparent diffusion coefficient of optic nerve (ADCmean) (×10-6 mm2/s) DON < nDON 0.738 1050.0 0.565 0.818 < 0.001 (vs. MTRmean + ADCmean + mMI) mMI (%) DON > nDON 0.862 54.1 0.870 0.750 < 0.001 (vs. MTRmean + ADCmean + mMI) MTRmean + ADCmean + mMI / 0.946 0.154 0.935 0.824 / Validation cohort MTRmean (%) DON < nDON 0.833 40.0 0.650 0.813 0.028 (vs. MTRmean + ADCmean + mMI) ADCmean (×10-6 mm2/s) DON < nDON 0.768 1050.0 0.550 0.813 0.005 (vs. MTRmean + ADCmean + mMI) mMI (%) DON > nDON 0.852 54.1 0.750 0.797 0.058 (vs. MTRmean + ADCmean + mMI) MTRmean + ADCmean + mMI / 0.926 0.154 0.750 0.844 / Jiang et al.[38] (2021) Regional homogeneity (ReHo) value of corpus callosum/cingulate gyrus DON < nDON 0.933 / / / / ReHo value of parietal lobe/middle frontal gyrus DON < nDON 0.938 / / / / Liu et al.[37] (2023) ReHo value of left insula DON < nDON 0.757 / / / / ReHo value of left posterior cingulate cortex DON > nDON 0.843 / / / / ReHo value of right superior temporal lobe DON < nDON 0.646 / / / / ReHo value of left insula + ReHo value of left posterior cingulate cortex / 0.915 / / / / ReHo value of left insula + ReHo value of right superior temporal lobe / 0.763 / / / / ReHo value of left posterior cingulate cortex + ReHo value of right superior temporal lobe / 0.852 / / / / ReHo value of left insula + ReHo value of left posterior cingulate cortex + ReHo value of right superior temporal lobe / 0.915 / / / / Zhou et al.[36] (2024) Model of static functional network (σ + degree centrality in left medial orbital part of superior frontal gyrus + degree centrality in left middle occipital gyrus + degree centrality in right inferior occipital gyrus + nodal efficiency in left medial orbital part of superior frontal gyrus + nodal efficiency in right medial orbital part of superior frontal gyrus + nodal efficiency in left gyrus rectus + nodal efficiency in right inferior occipital gyrus) / 0.793 / / / / Model of dynamic functional network (variance of global efficiency + variance of characteristic path length) / 0.766 / / / / Model of static functional network + model of dynamic functional network / 0.836 / / / / Zhou et al.[35] (2025) Radial kurtosis value of right posterior thalamic radiation (include optic radiation) DON < nDON 0.838 / / / / Radial kurtosis value of left posterior thalamic radiation (include optic radiation) DON < nDON 0.802 / / / / Mean kurtosis value of right posterior thalamic radiation (include optic radiation) DON < nDON 0.795 / / / / Radial kurtosis value of left sagittal stratum DON < nDON 0.786 / / / / Radial kurtosis value of right sagittal stratum DON < nDON 0.753 / / / / Axial kurtosis value of right posterior corona radiata DON < nDON 0.751 / / / / Radial kurtosis value of left retrolenticular part of internal capsule DON < nDON 0.723 / / / / Lu et al.[34] (2025) Static amplitude of low-frequency fluctuation (ALFF) model (static ALFF value of the left lingual gyrus + static ALFF value of the right lingual gyrus + static ALFF value of the right cuneus + static ALFF value of the left medial part of the superior frontal gyrus + static ALFF value of the right medial part of the superior frontal gyrus + static ALFF value of the right dorsolateral part of the superior frontal gyrus + static ALFF value of the right precentral gyrus) / 0.8440 / 0.7826 0.9118 0.0155 (vs. Dynamic ALFF model) Dynamic ALFF model (dynamic ALFF value of the left lingual gyrus + dynamic ALFF value of the right cuneus + dynamic ALFF value of the right orbital part of the middle frontal gyrus + dynamic ALFF value of the right dorsolateral part of the superior frontal gyrus) / 0.9987 / 1.0000 0.9706 / Static ReHo model (static value of the right lingual gyrus + static value of the right supramarginal gyrus) / 0.7762 / 0.7391 0.8235 0.0007 (vs. Dynamic ALFF model) Dynamic ReHo model (dynamic value of the right supramarginal gyrus) / 0.7609 / 0.6957 0.7647 0.0004 (vs. Dynamic ALFF model) Zhang et al.[39] (2024) ALFF value of the right superior frontal gyrus, orbital part DON > nDON 0.64 / / / / ALFF value of right hippocampus DON > nDON 0.66 / / / / ALFF value of right superior temporal gyrus DON > nDON 0.66 / / / / Posterior mMI DON > nDON 0.76 / / / 0.1456 (vs. Combined model) Combined model (ALFF value of the right hippocampus + ALFF value of the right superior temporal gyrus + posterior mMI) / 0.80 / / / / Hu et al.[40] (2024) Apical muscle index (MI) DON > nDON 0.822 0.548 0.750 0.806 / Optic nerve apical area index (ONAI) DON > nDON 0.791 0.518 0.700 0.819 0.588 (vs. MI) Optic nerve apparent diffusion coefficient (ONADC) (×10–3 mm2/s) DON < nDON 0.719 1.123 0.725 0.653 0.098 (vs. MI) Optic nerve signal intensity ratio DON > nDON 0.619 1.090 0.400 0.847 0.003 (vs. MI) Kurtosis fractional anisotropy value of optic tract (OTKFA) DON < nDON 0.745 0.412 0.400 0.972 0.080 (vs. ORKFA) Kurtosis fractional anisotropy value of optic radiation (ORKFA) DON < nDON 0.827 0.421 0.600 1.000 / Kurtosis fractional anisotropy value of Brodmann Area 17 (BA17KFA) DON < nDON 0.789 0.283 0.725 0.833 0.261 (vs. ORKFA) Kurtosis fractional anisotropy value of Brodmann Area 18 DON < nDON 0.698 0.286 0.575 0.833 0.007 (vs. ORKFA) Kurtosis fractional anisotropy value of Brodmann Area 19 DON < nDON 0.718 0.315 0.475 0.972 0.011 (vs. ORKFA) Mean kurtosis of optic tract DON < nDON 0.625 0.900 0.450 0.917 0.002 (vs. ORKFA) Mean kurtosis of optic radiation DON < nDON 0.597 0.852 0.425 0.944 < 0.001 (vs. ORKFA) Orbital MRI model (MI + ONAI + ONADC) / 0.890 / 0.775 0.903 0.257 (vs. visual pathway DKI model)) Visual pathway DKI model (OTKFA + ORKFA + BA17KFA) / 0.832 / 0.700 0.917 0.005 (vs. combined model) Combined model (orbital MRI model + visual pathway DKI model) / 0.926 / 0.800 0.944 0.177 (vs. orbital MRI model) * Radiomics signature: Rad-score = 0.046222 + (original_shape_LeastAxisLength × 0.295835) – (wavelet.HHH_glrlm_LowGrayLevelRunEmphasis × 0.168698) + (wavelet.HHH_glszm_SizeZoneNonUniformityNormalized × 0.078249) – (original_glcm_InverseVariance × 0.215994) + (wavelet.HLH_glszm_LargeAreaHighGrayLevelEmphasis × 0.256508) – (wavelet.HHH_glcm_ClusterShade × 0.061405) – (original_glrlm_ShortRunLowGrayLevel
Emphasis × 0.238402) + (original_gldm_LargeDependenceHighGrayLevelEmphasis × 0.006713). DON, dysthyroid optic neuropathy; AUC, area under the receiver operating characteristic (ROC) curve; ONAD, optic nerve axial diffusivity; ONRD, optic nerve radial diffusivity; ONMD, optic nerve mean diffusivity; ONFA, optic nerve fractional anisotropy; MRI, magnetic resonance imaging; mMI, modified muscle index; ONSIR3, optic nerve signal intensity ratio at 3 mm behind the eyeball; AMI, extraocular muscle volume index at the orbital apex; MTRmean, mean magnetization transfer ratio; ADCmean, mean apparent diffusion coefficient; ReHo, regional homogeneity; ALFF, amplitude of low-frequency fluctuation; MI, apical muscle index; ONAI, optic nerve apical area index; ONADC, optic nerve apparent diffusion coefficient; OTKFA, kurtosis fractional anisotropy value of optic tract; ORKFA, kurtosis fractional anisotropy value of optic radiation; BA17KFA, kurtosis fractional anisotropy value of Brodmann Area 17; DKI, diffusion kurtosis imaging.Table 2.
The main findings of MRI studies on the diagnosis of DON.
Figures
(3)
Tables
(2)