-
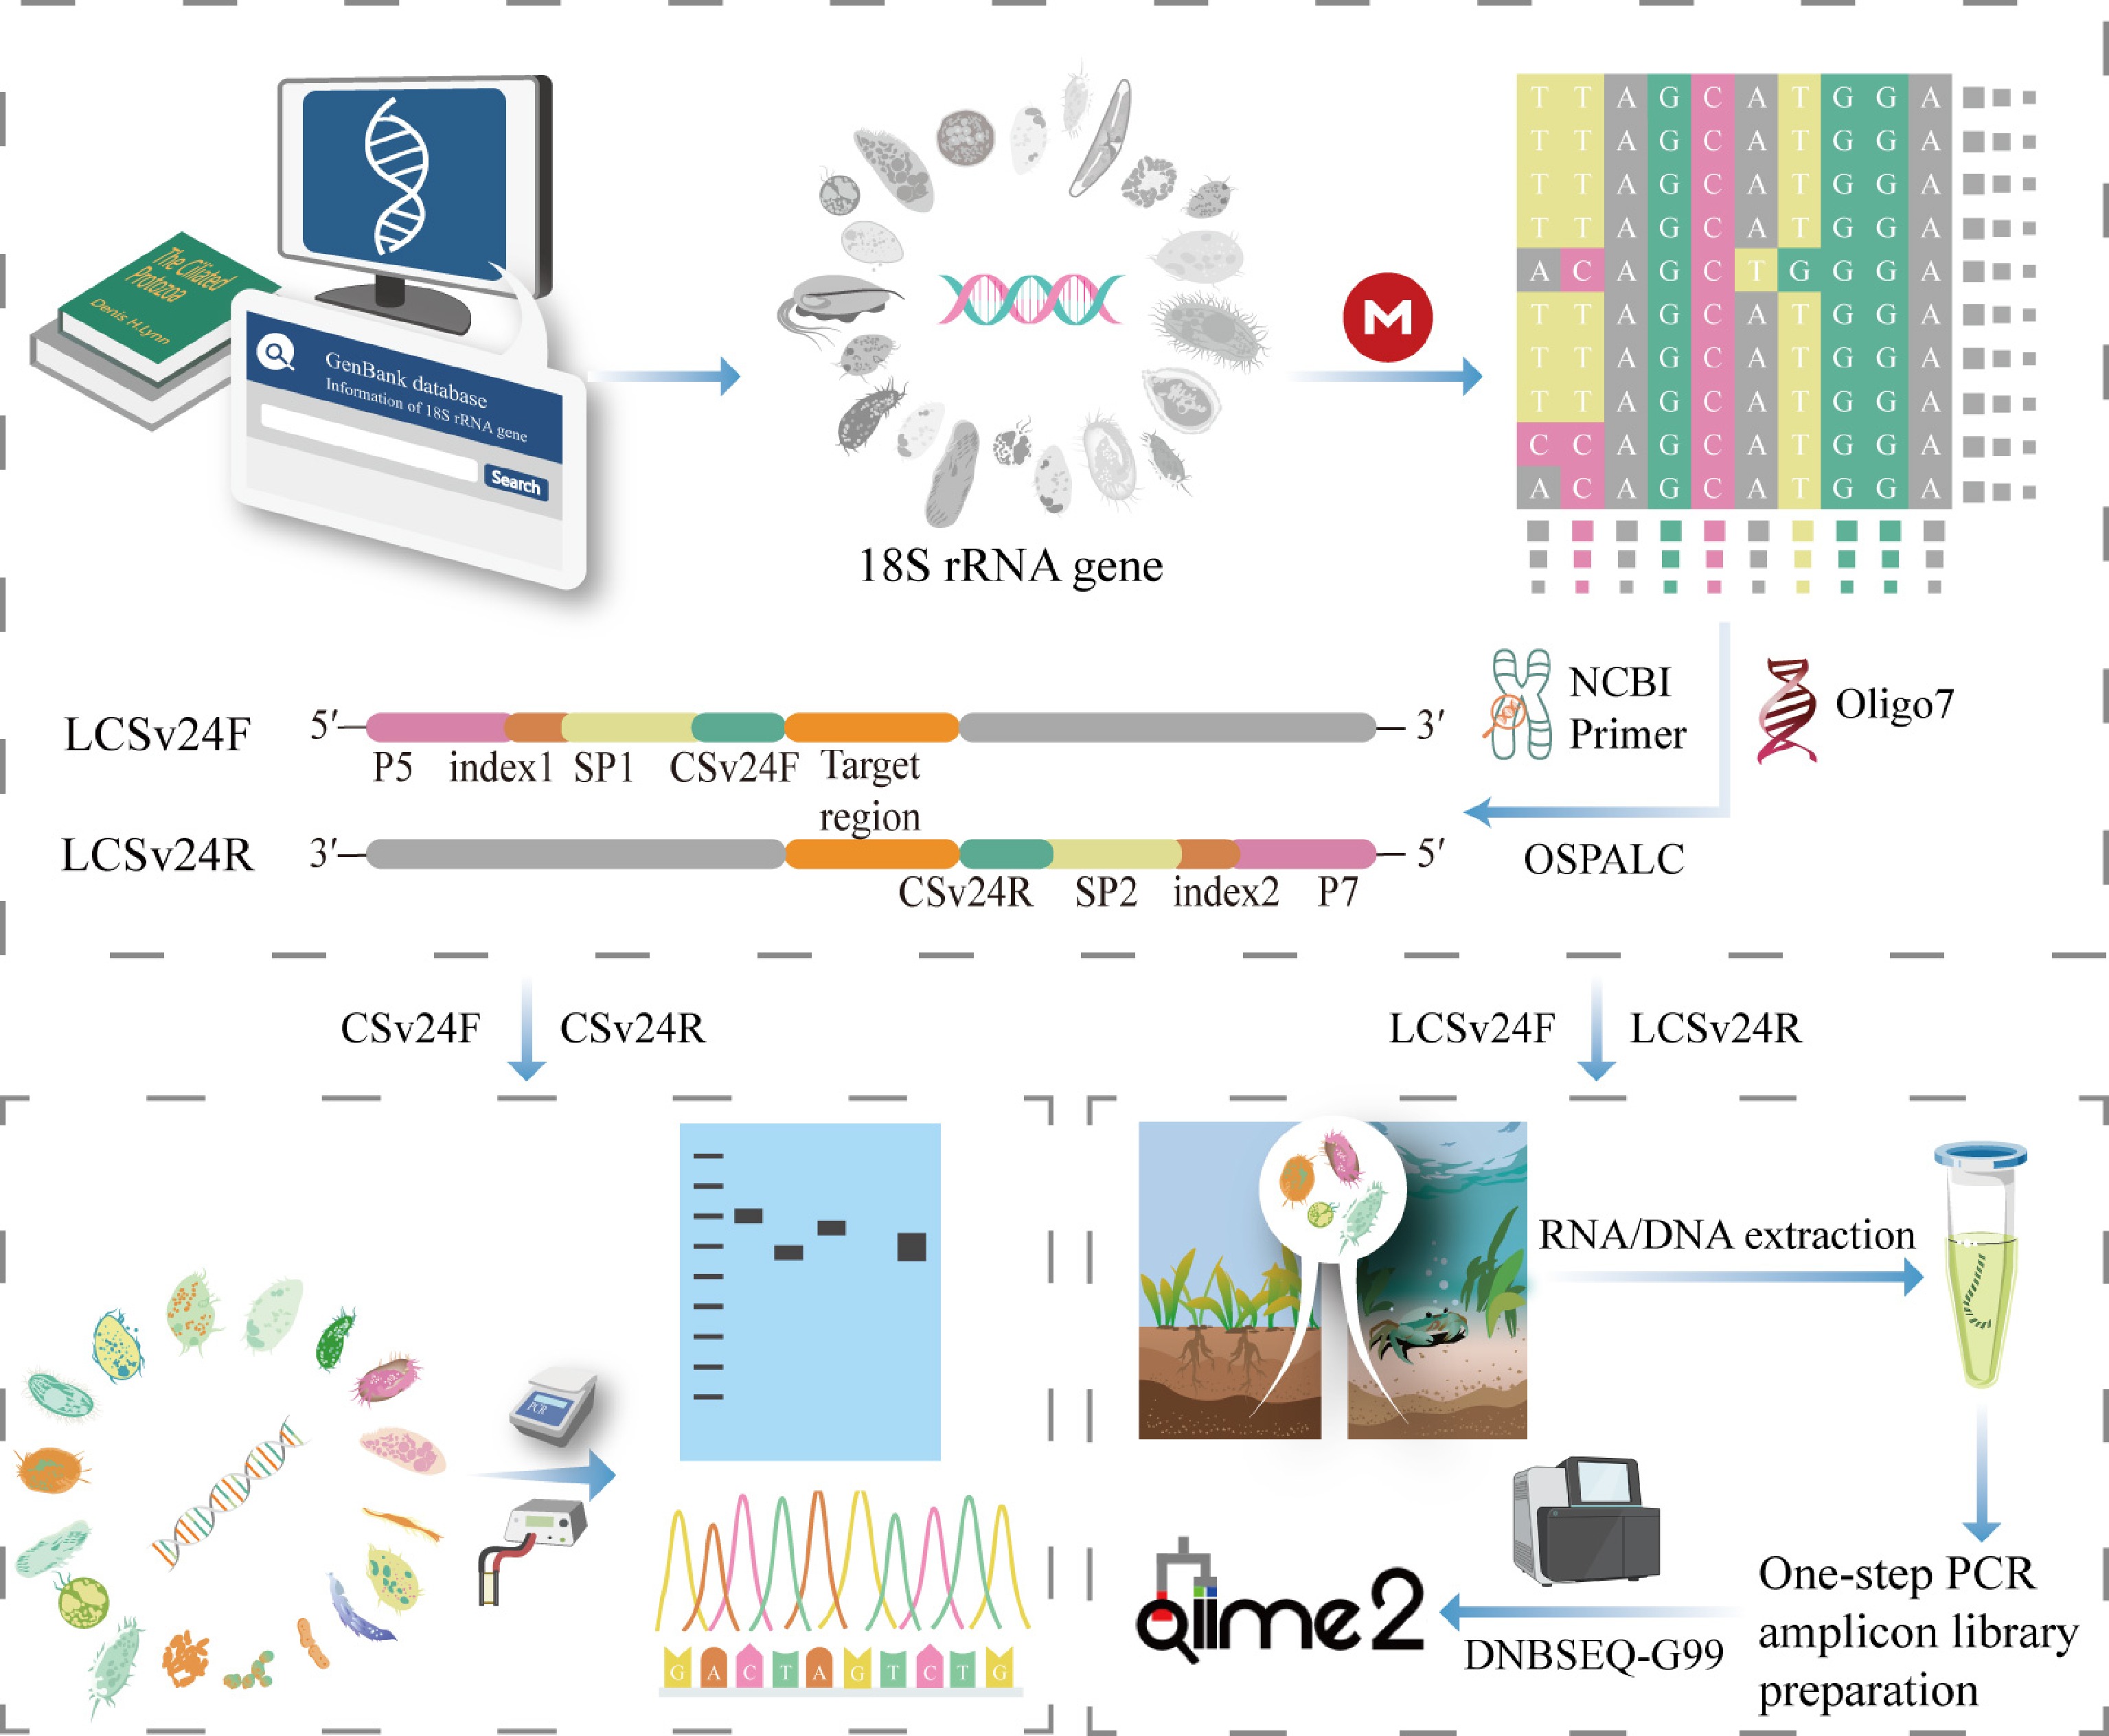
Figure 1.
Schematic workflow for designing and testing the ciliate-specific approach.
-
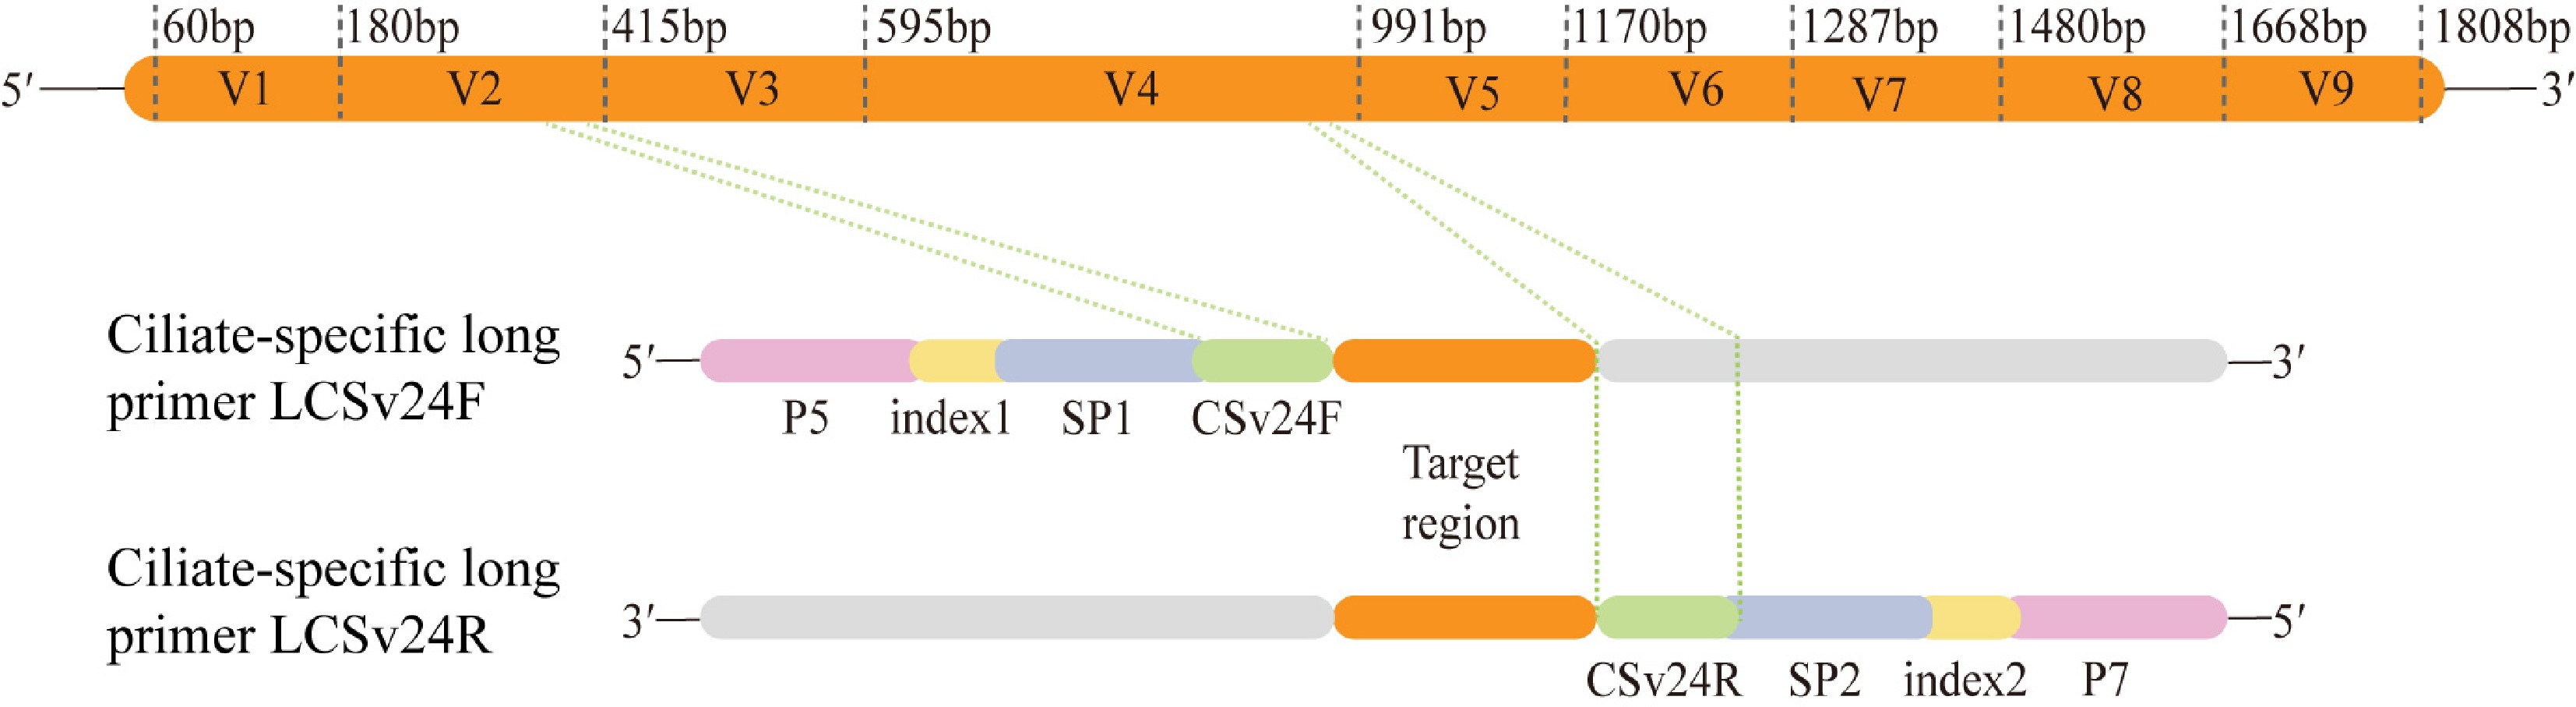
Figure 2.
Illustrations of the long primer design. The top orange panel depicts the canonical nine variable regions of the 18S rRNA gene (V1–V9), with those of Saccharomyces cerevisiae as a reference. Bottom panels show the structure of the newly designed ciliate-specific long primers LCSv24F/LCSv24R.
-
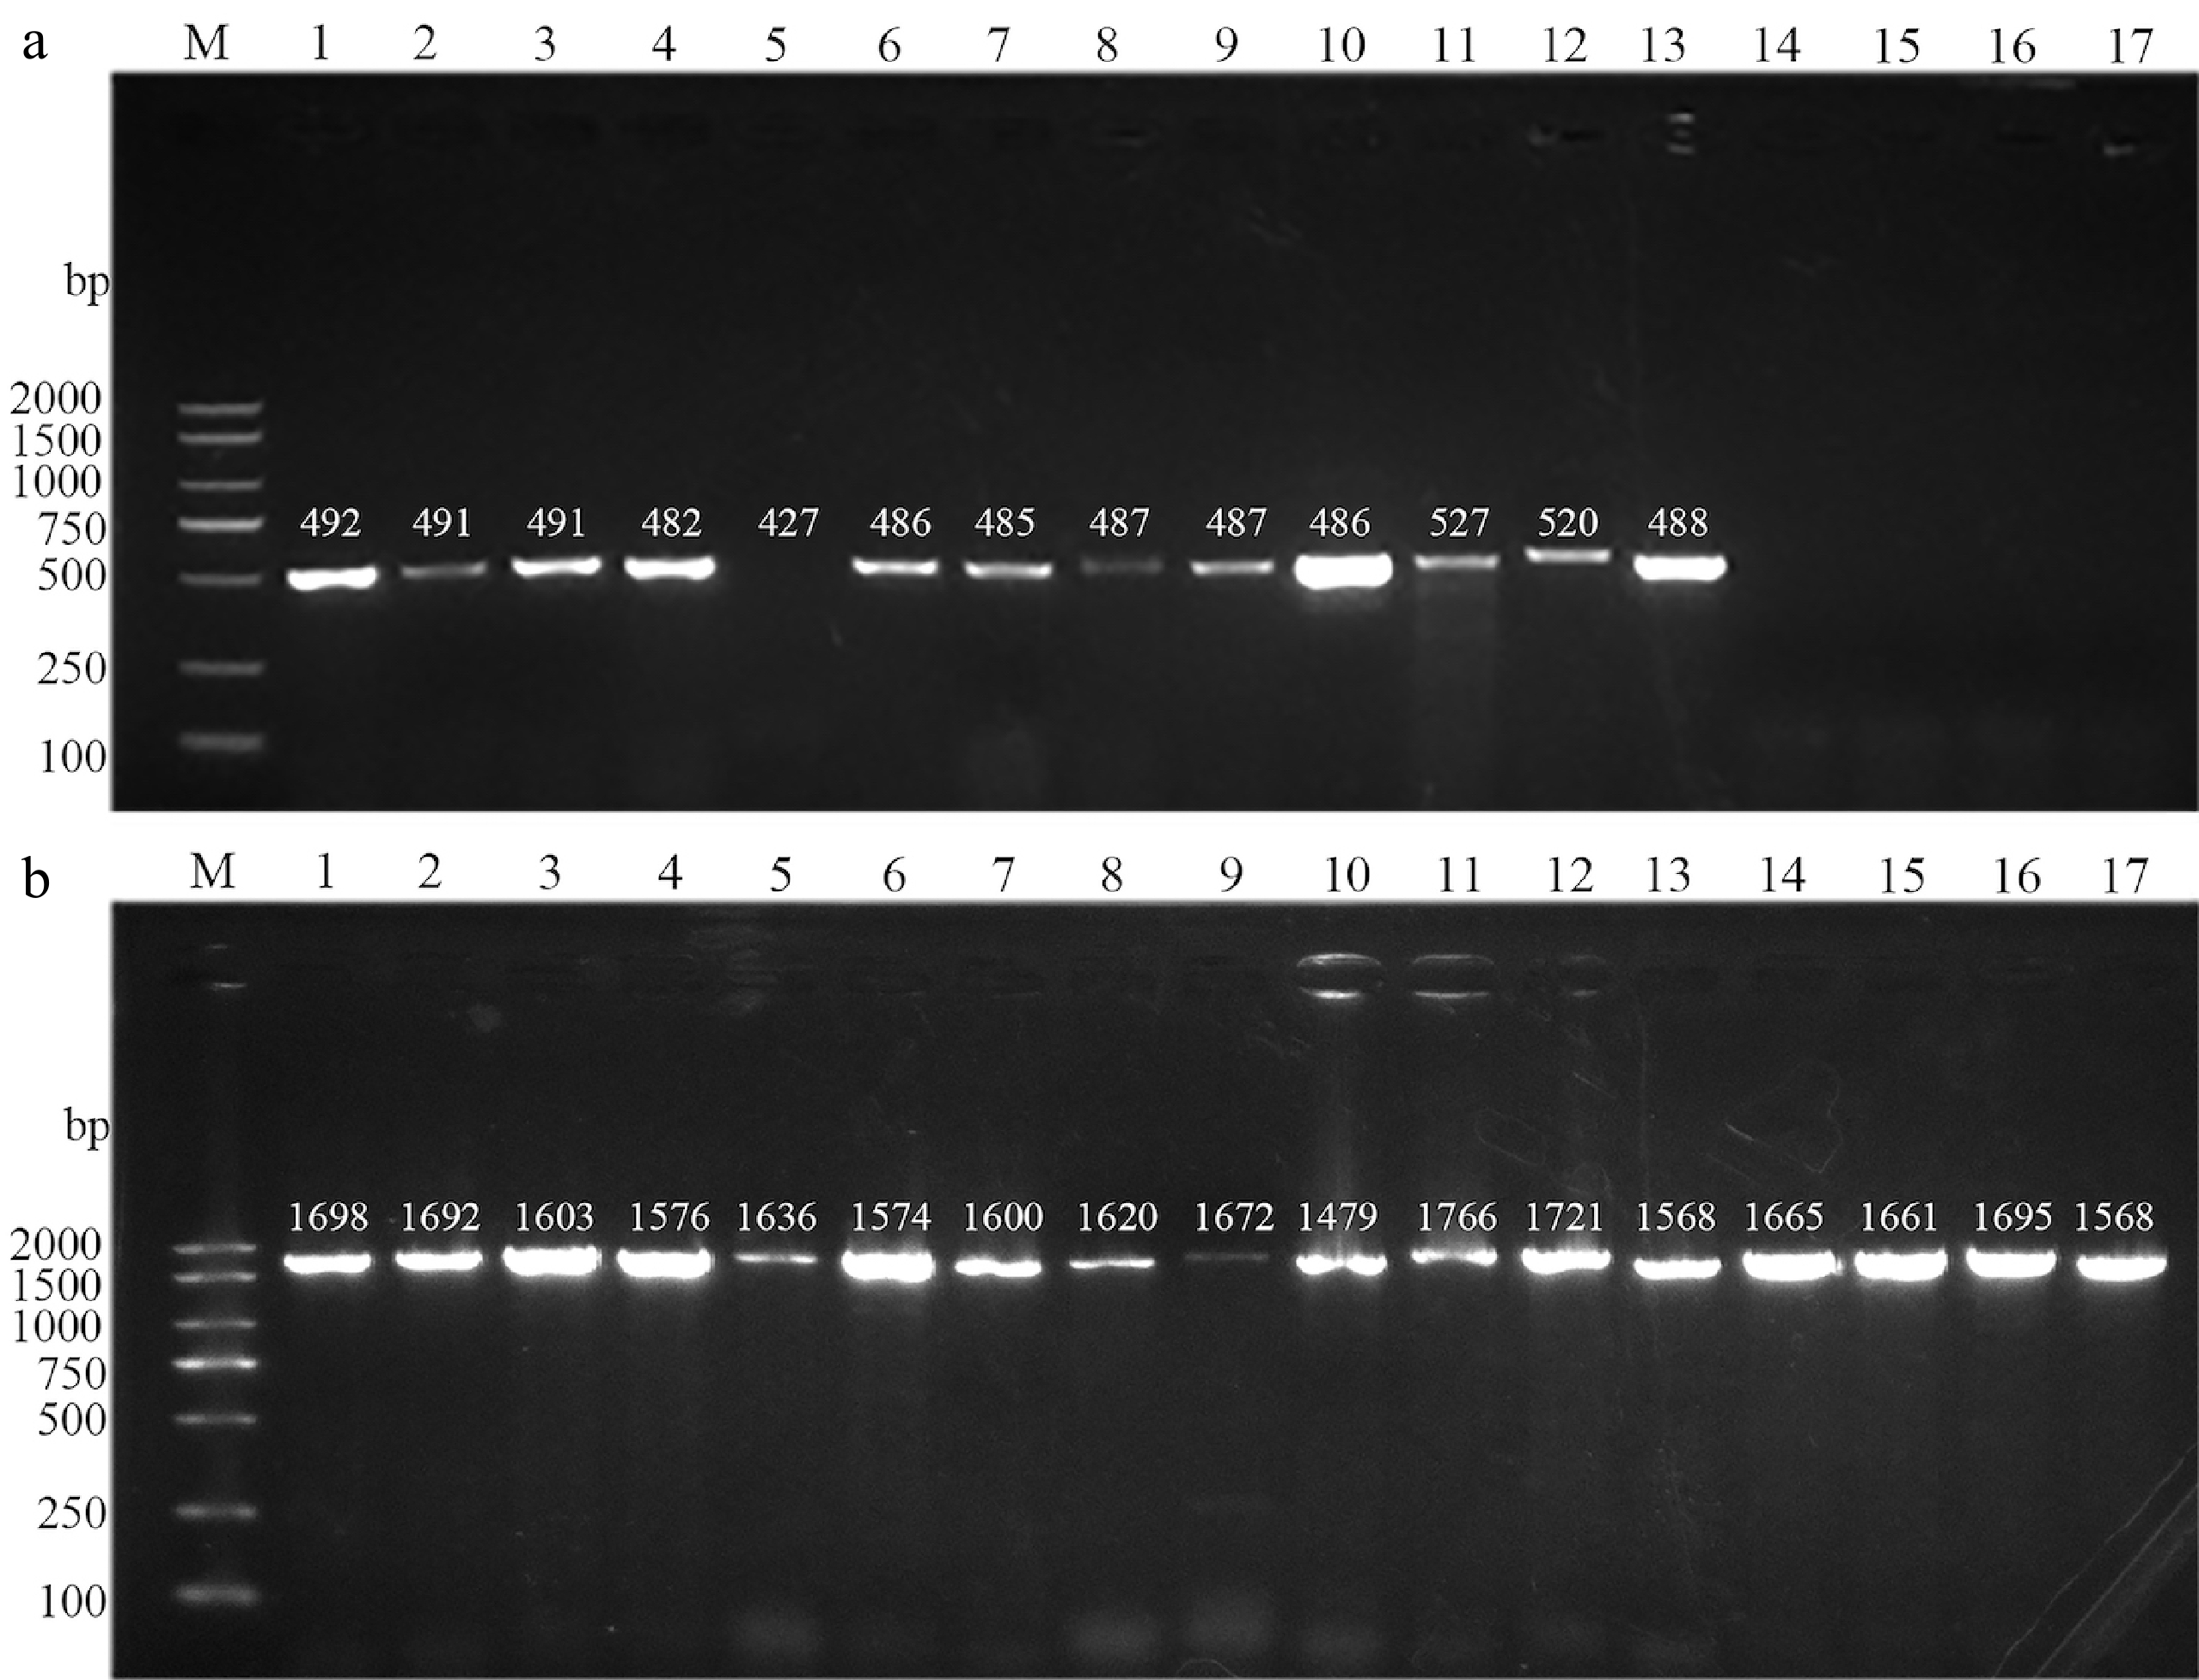
Figure 3.
Gel electrophoresis of PCR products of species in the mock community. (a) PCR products of short ciliate-specific primers CSv24F/CSv24R across 17 species. (b) Amplification of 18S rRNA genes of all 17 species with universal eukaryotic primers (82F/EUKB). Lane M: DNA marker; Lanes 1–13: Ciliate species (1: Colpoda steinii RZ4A; 2: Colpoda elliotti YX31C03; 3: Colpoda aspera QS14C26; 4: Blepharisma sinuosum WS; 5: Chaenea vorax C13; 6: Paramecium biaurelia 3D49; 7: Tetrahymena pyriformis ZSX20180820; 8: Uronema apomarinum PJ12H01; 9: Glauconema trihymene LCC01; 10: Metanophrys cf. sinensis W7; 11: Euplotes rariseta YHW001; 12: Euplotes vannus YHW14D25; 13: Apourosomoida sp. LHA081A01); Lanes 14–17: Non-ciliate eukaryotes (14: Rhodotorula mucilaginosa WK19D12; 15: Saccharomyces cerevisiae S288C; 16: Schizosaccharomyces pombe 972h-; 17: Poterioochromonas sp. DZG4B). Details of all strains are in Supplementary Tables S1, and the expected amplicon sizes are marked above the corresponding gel lanes.
-
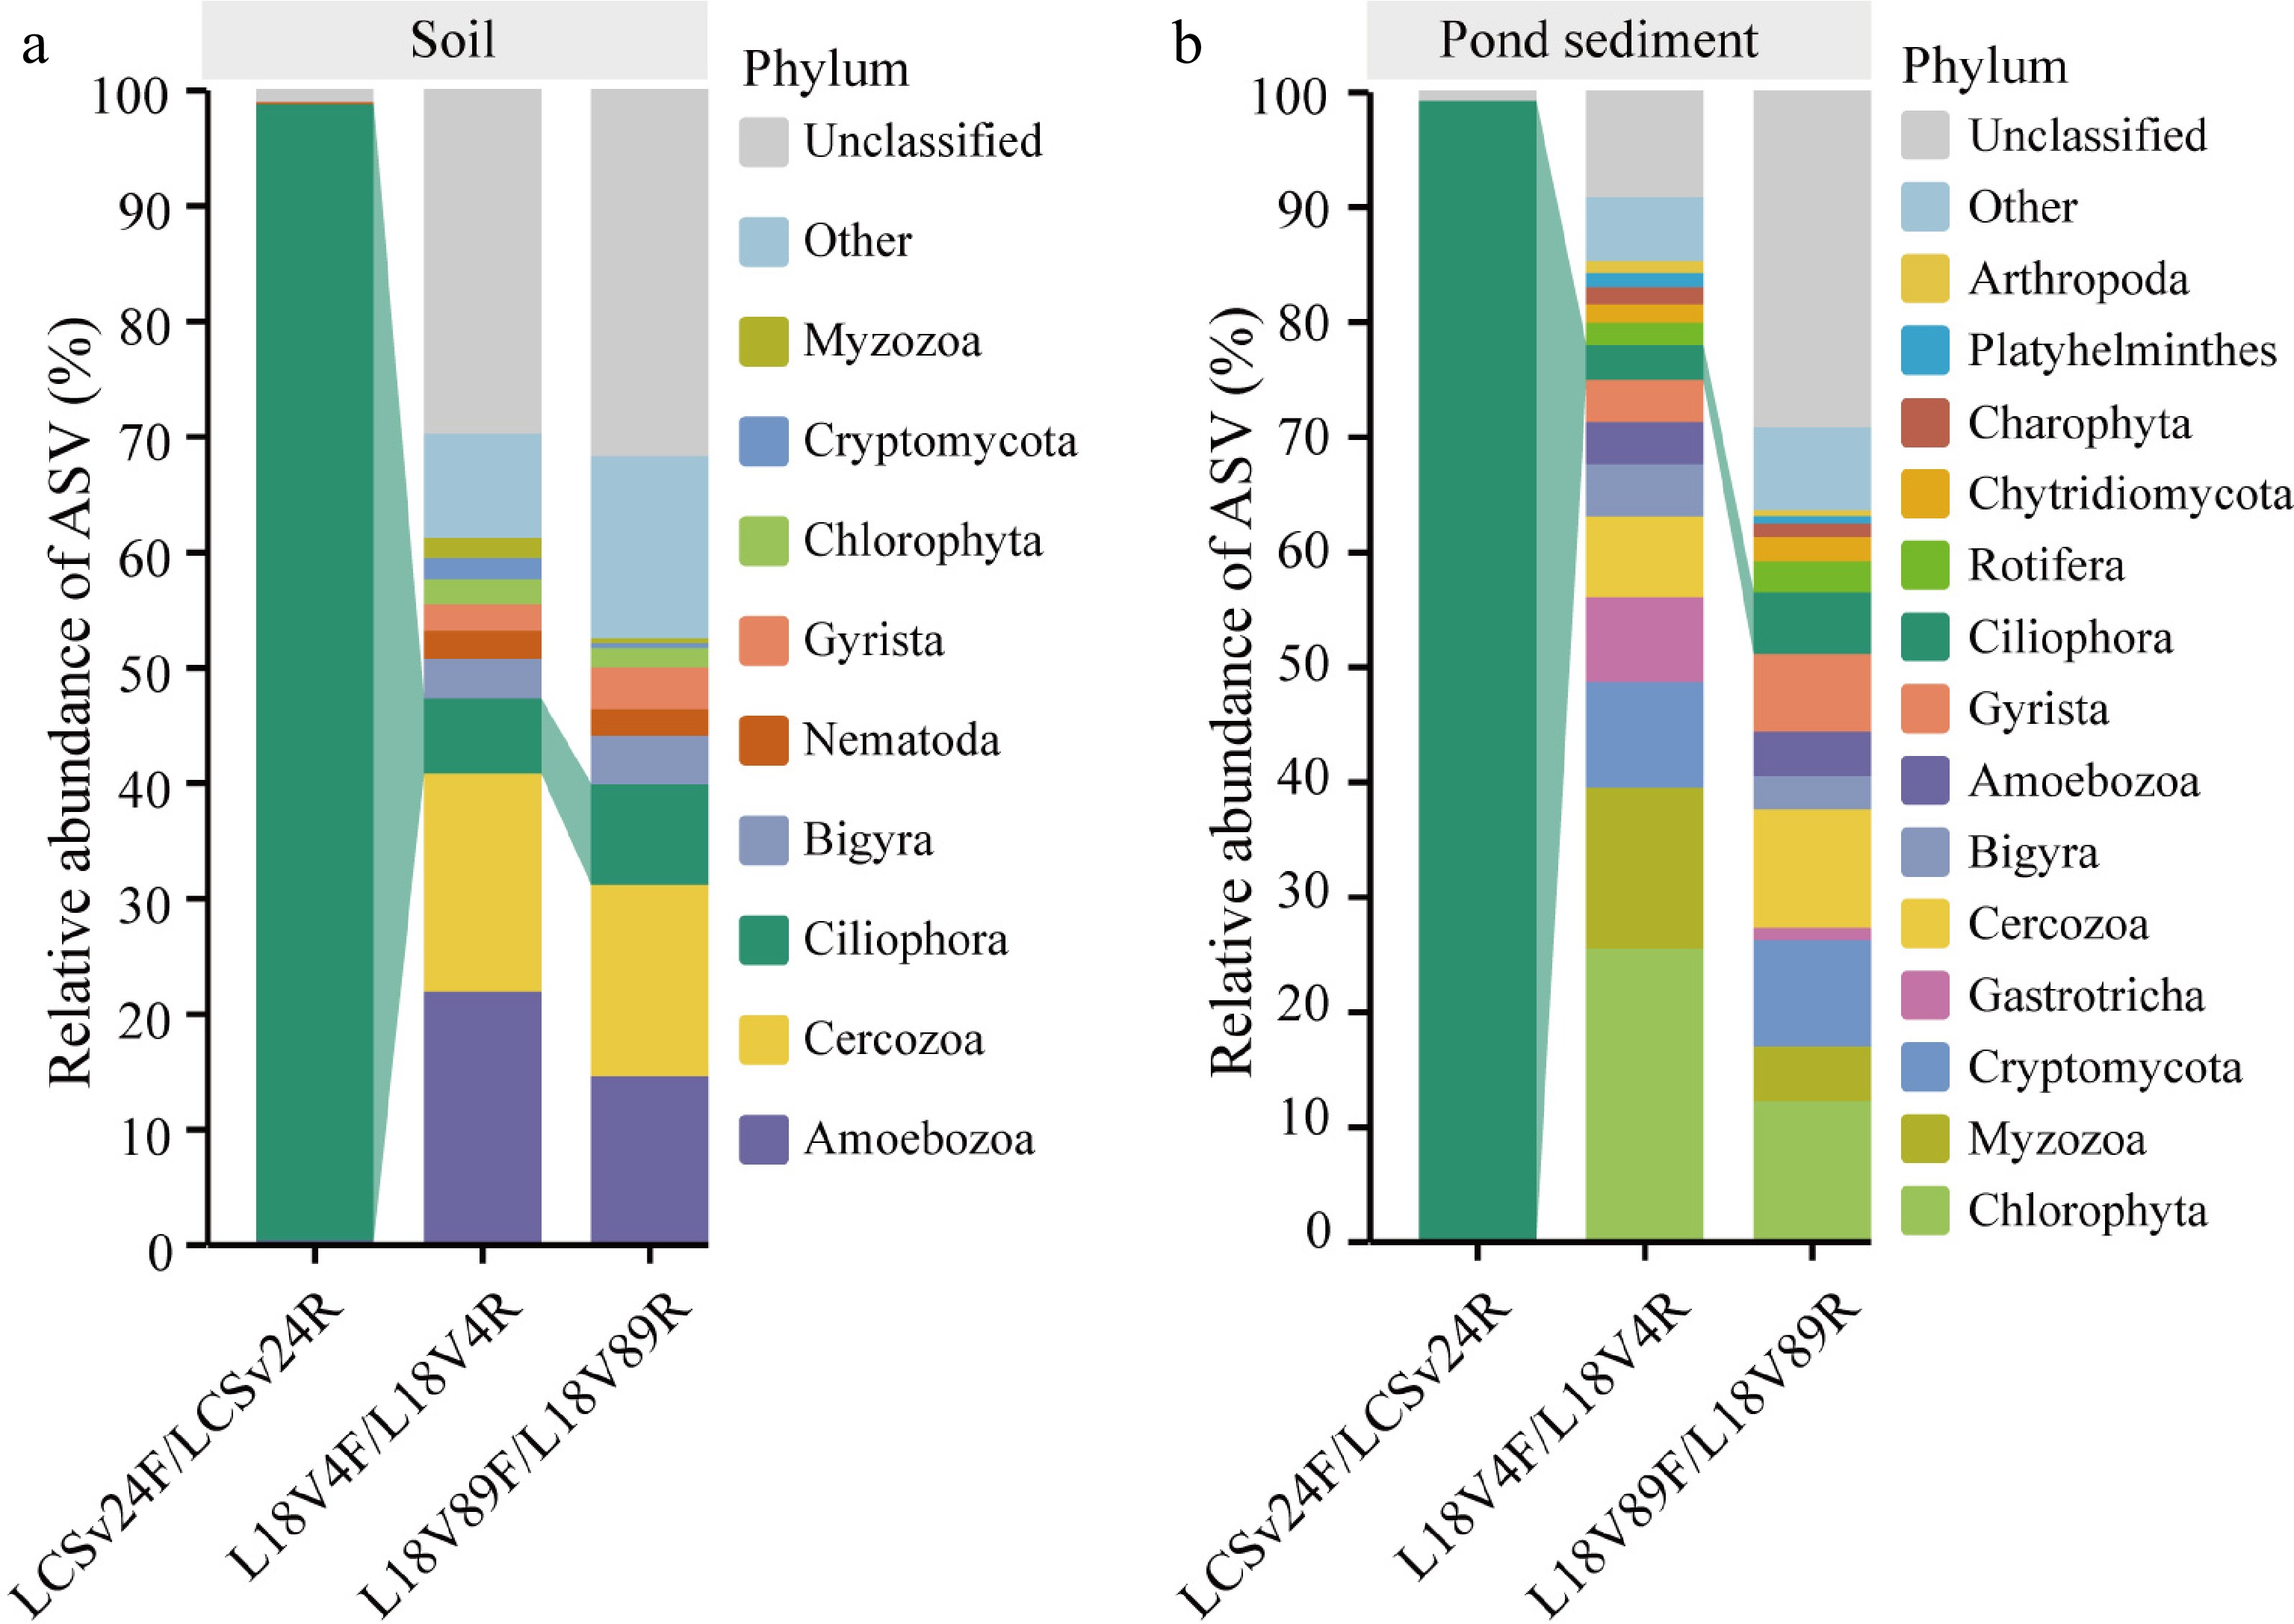
Figure 4.
Phylum-level community compositions of soil and pond sediment samples. Relative abundances of ASVs across phyla are shown for (a) soil and (b) pond sediment samples. The most abundant phyla are shown in each panel; “Other” represents the combined abundance of phyla not individually shown, whereas “Unclassified” represents ASVs for which no phylum-level annotation was obtained. Information of ciliate-specific long primers (LCSv24F/LCSv24R, targeting V2–V4 regions of the 18S rRNA gene) and long eukaryotic universal primers (L18V4F/L18V4R—targeting V4 regions, and L18V89F/L18V89R—targeting V8–V9 regions) is in Table 1.
-
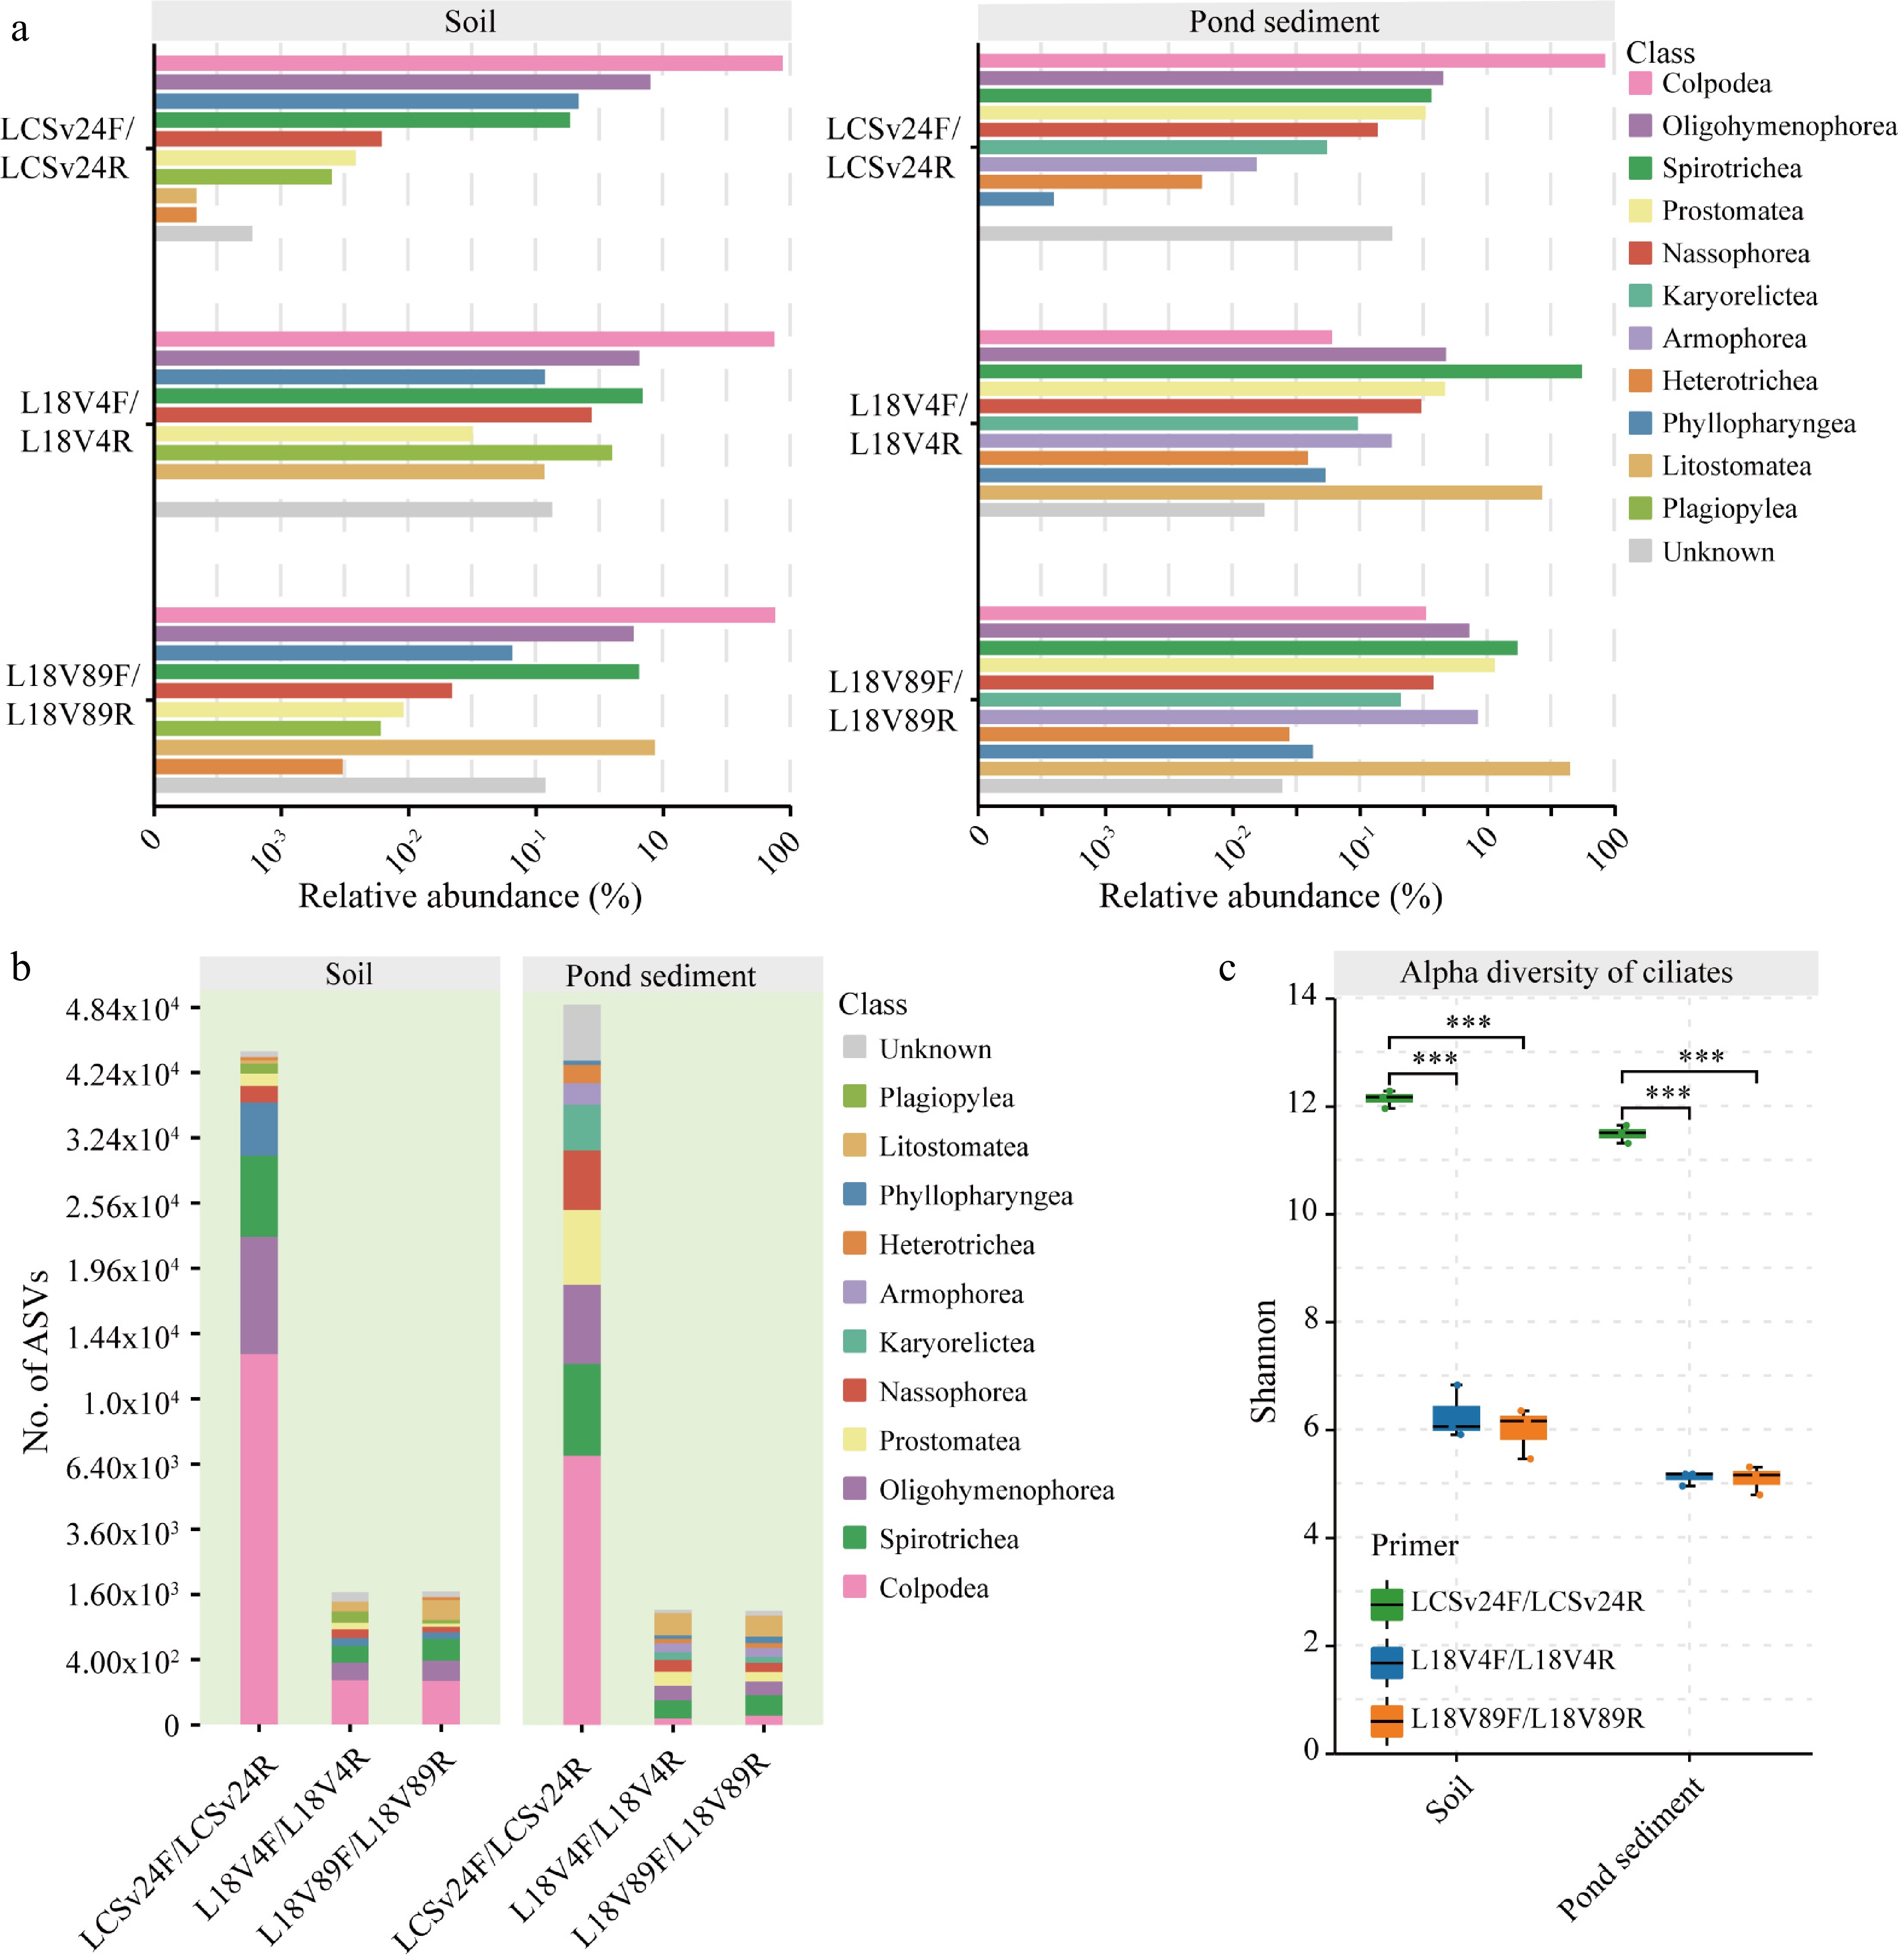
Figure 5.
Ciliate-diversity assessment for soil and pond sediment samples after rarefaction of sequences. (a) Relative abundances of feature sequences across ciliate classes in the environmental samples; gray bars represent unknown ciliate classes. To prevent low-abundance classes from becoming invisible and high-abundance classes from dominating the visual scale, the x-axis presents log10(relative abundance × 105). (b) Number of ASVs in environmental samples using ciliate-specific long primers and two universal eukaryotic long primer pairs, colored by class, with a square root-transformed y-axis. (c) Comparison of alpha diversity (Shannon index) in environmental samples using different primers. Statistical significance was determined using a Student's t-test (*** p < 0.0001).
-
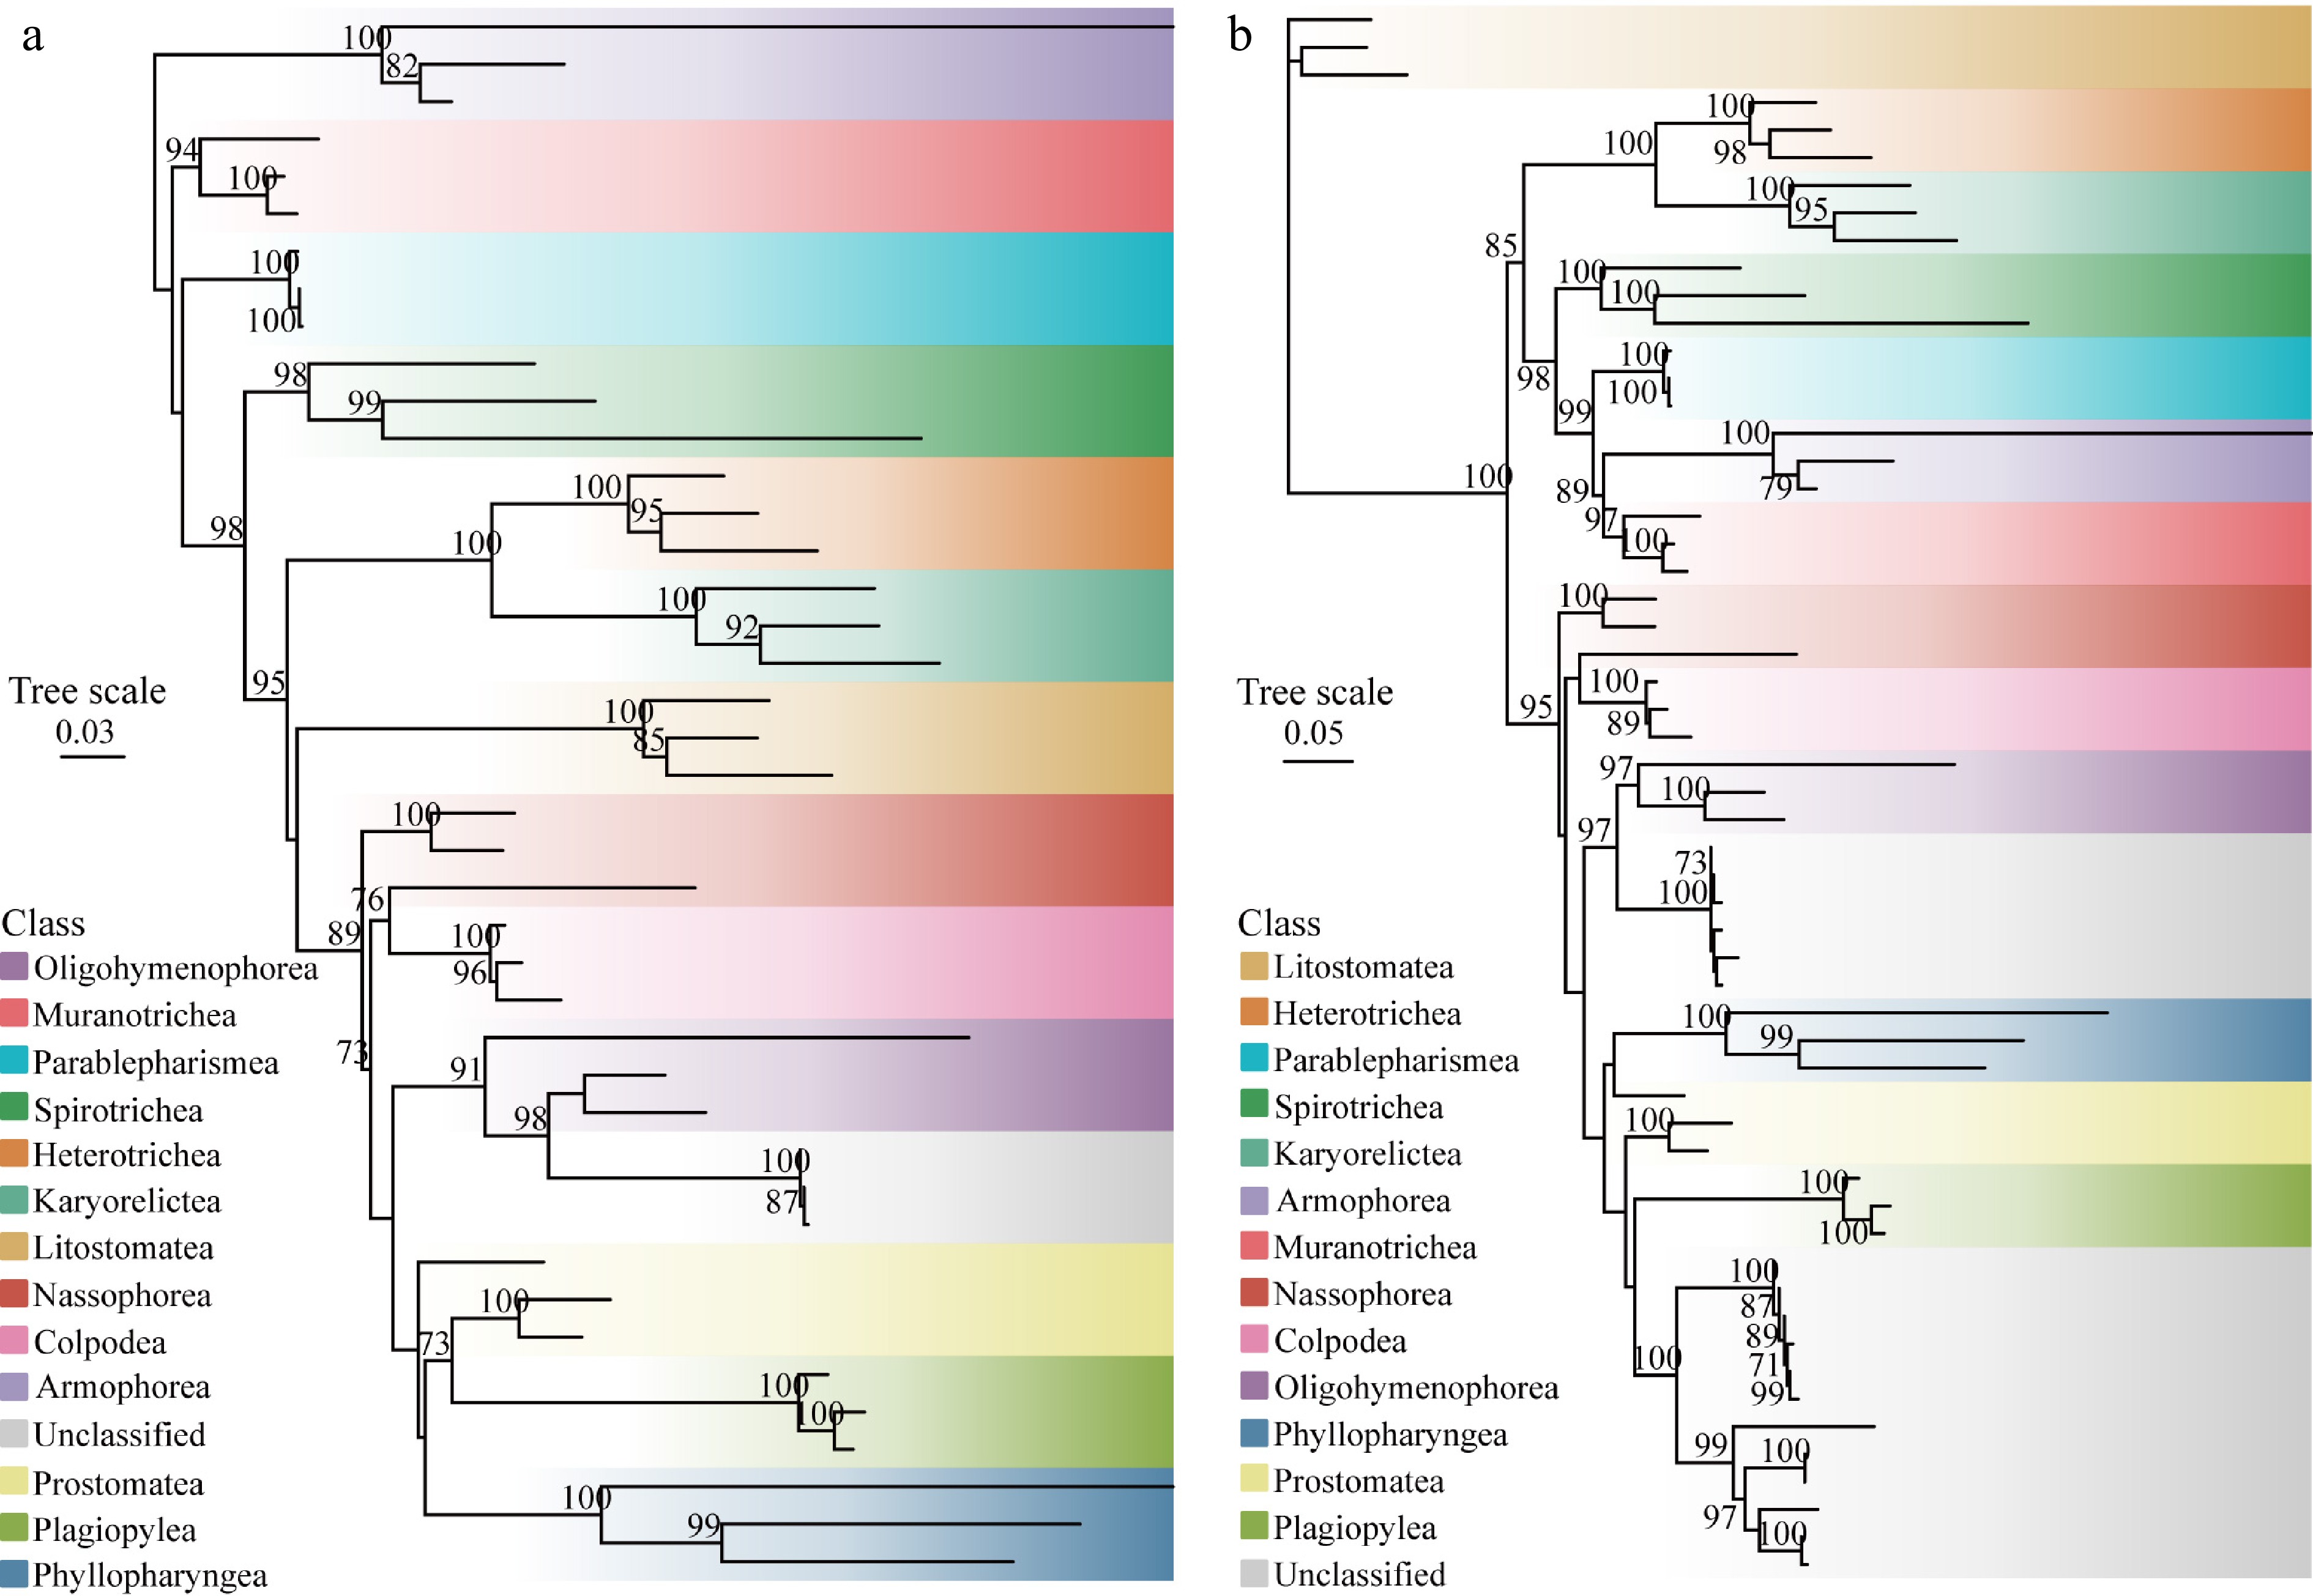
Figure 6.
Maximum likelihood trees constructed based on the sequences for known species in NCBI and unknown species from environmental samples. (a) Phylogenetic tree based on ASVs from soil samples, incorporating 14 known classes from Supplementary Table S2 and all three class-level unknown ASVs. (b) Phylogenetic tree based on ASVs from pond sediment samples, incorporating the same 14 known classes and 18 class-level unknown ASVs (randomly selected from 291 ASVs). The scale bar represents nucleotide substitutions per site. Nodes with bootstrap values > 70 are shown. The color blocks represent different species at the class level, with gray corresponding to taxa unclassified at this level.
-
Primer name Sequences (5′–3′) CSv24F GWTGGTAGTGTATYKGAC CSv24R CTATTBYATTATTCCMWGCT 82F GAAACTGCGAATGGCTC EUKB TGATCCTTCTGCAGGTTCACCTAC LCSv24F AATGATACGGCGACCACCGAGATCTACACNNNNNNNNTCGTCGGCAGCGTCAGATGTGTATAAGAGACAGGWTGGTAGTGTATYKGAC LCSv24R CAAGCAGAAGACGGCATACGAGATNNNNNNNNGTCTCGTGGGCTCGGAGATGTGTATAAGAGACAGCTATTBYATTATTCCMWGCT L18V4F AATGATACGGCGACCACCGAGATCTACACNNNNNNNNTCGTCGGCAGCGTCAGATGTGTATAAGAGACAGCCAGCASCYGCGGTAATTCC L18V4R CAAGCAGAAGACGGCATACGAGATNNNNNNNNGTCTCGTGGGCTCGGAGATGTGTATAAGAGACAGACTTTCGTTCTTGATYRA L18V89F AATGATACGGCGACCACCGAGATCTACACNNNNNNNNTCGTCGGCAGCGTCAGATGTGTATAAGAGACAGATAACAGGTCTGTGATGCCCT L18V89R CAAGCAGAAGACGGCATACGAGATNNNNNNNNGTCTCGTGGGCTCGGAGATGTGTATAAGAGACAGCCTTCYGCAGGTTCACCTAC For long primer pairs, bold text denotes P5/P7 adapters, 'NNNNNNNN' denotes indices, italics denote sequencing-primer binding sites, and regular text denotes 18S rRNA target-binding sequences. Table 1.
Primer sequences used in this study.
Figures
(6)
Tables
(1)