-
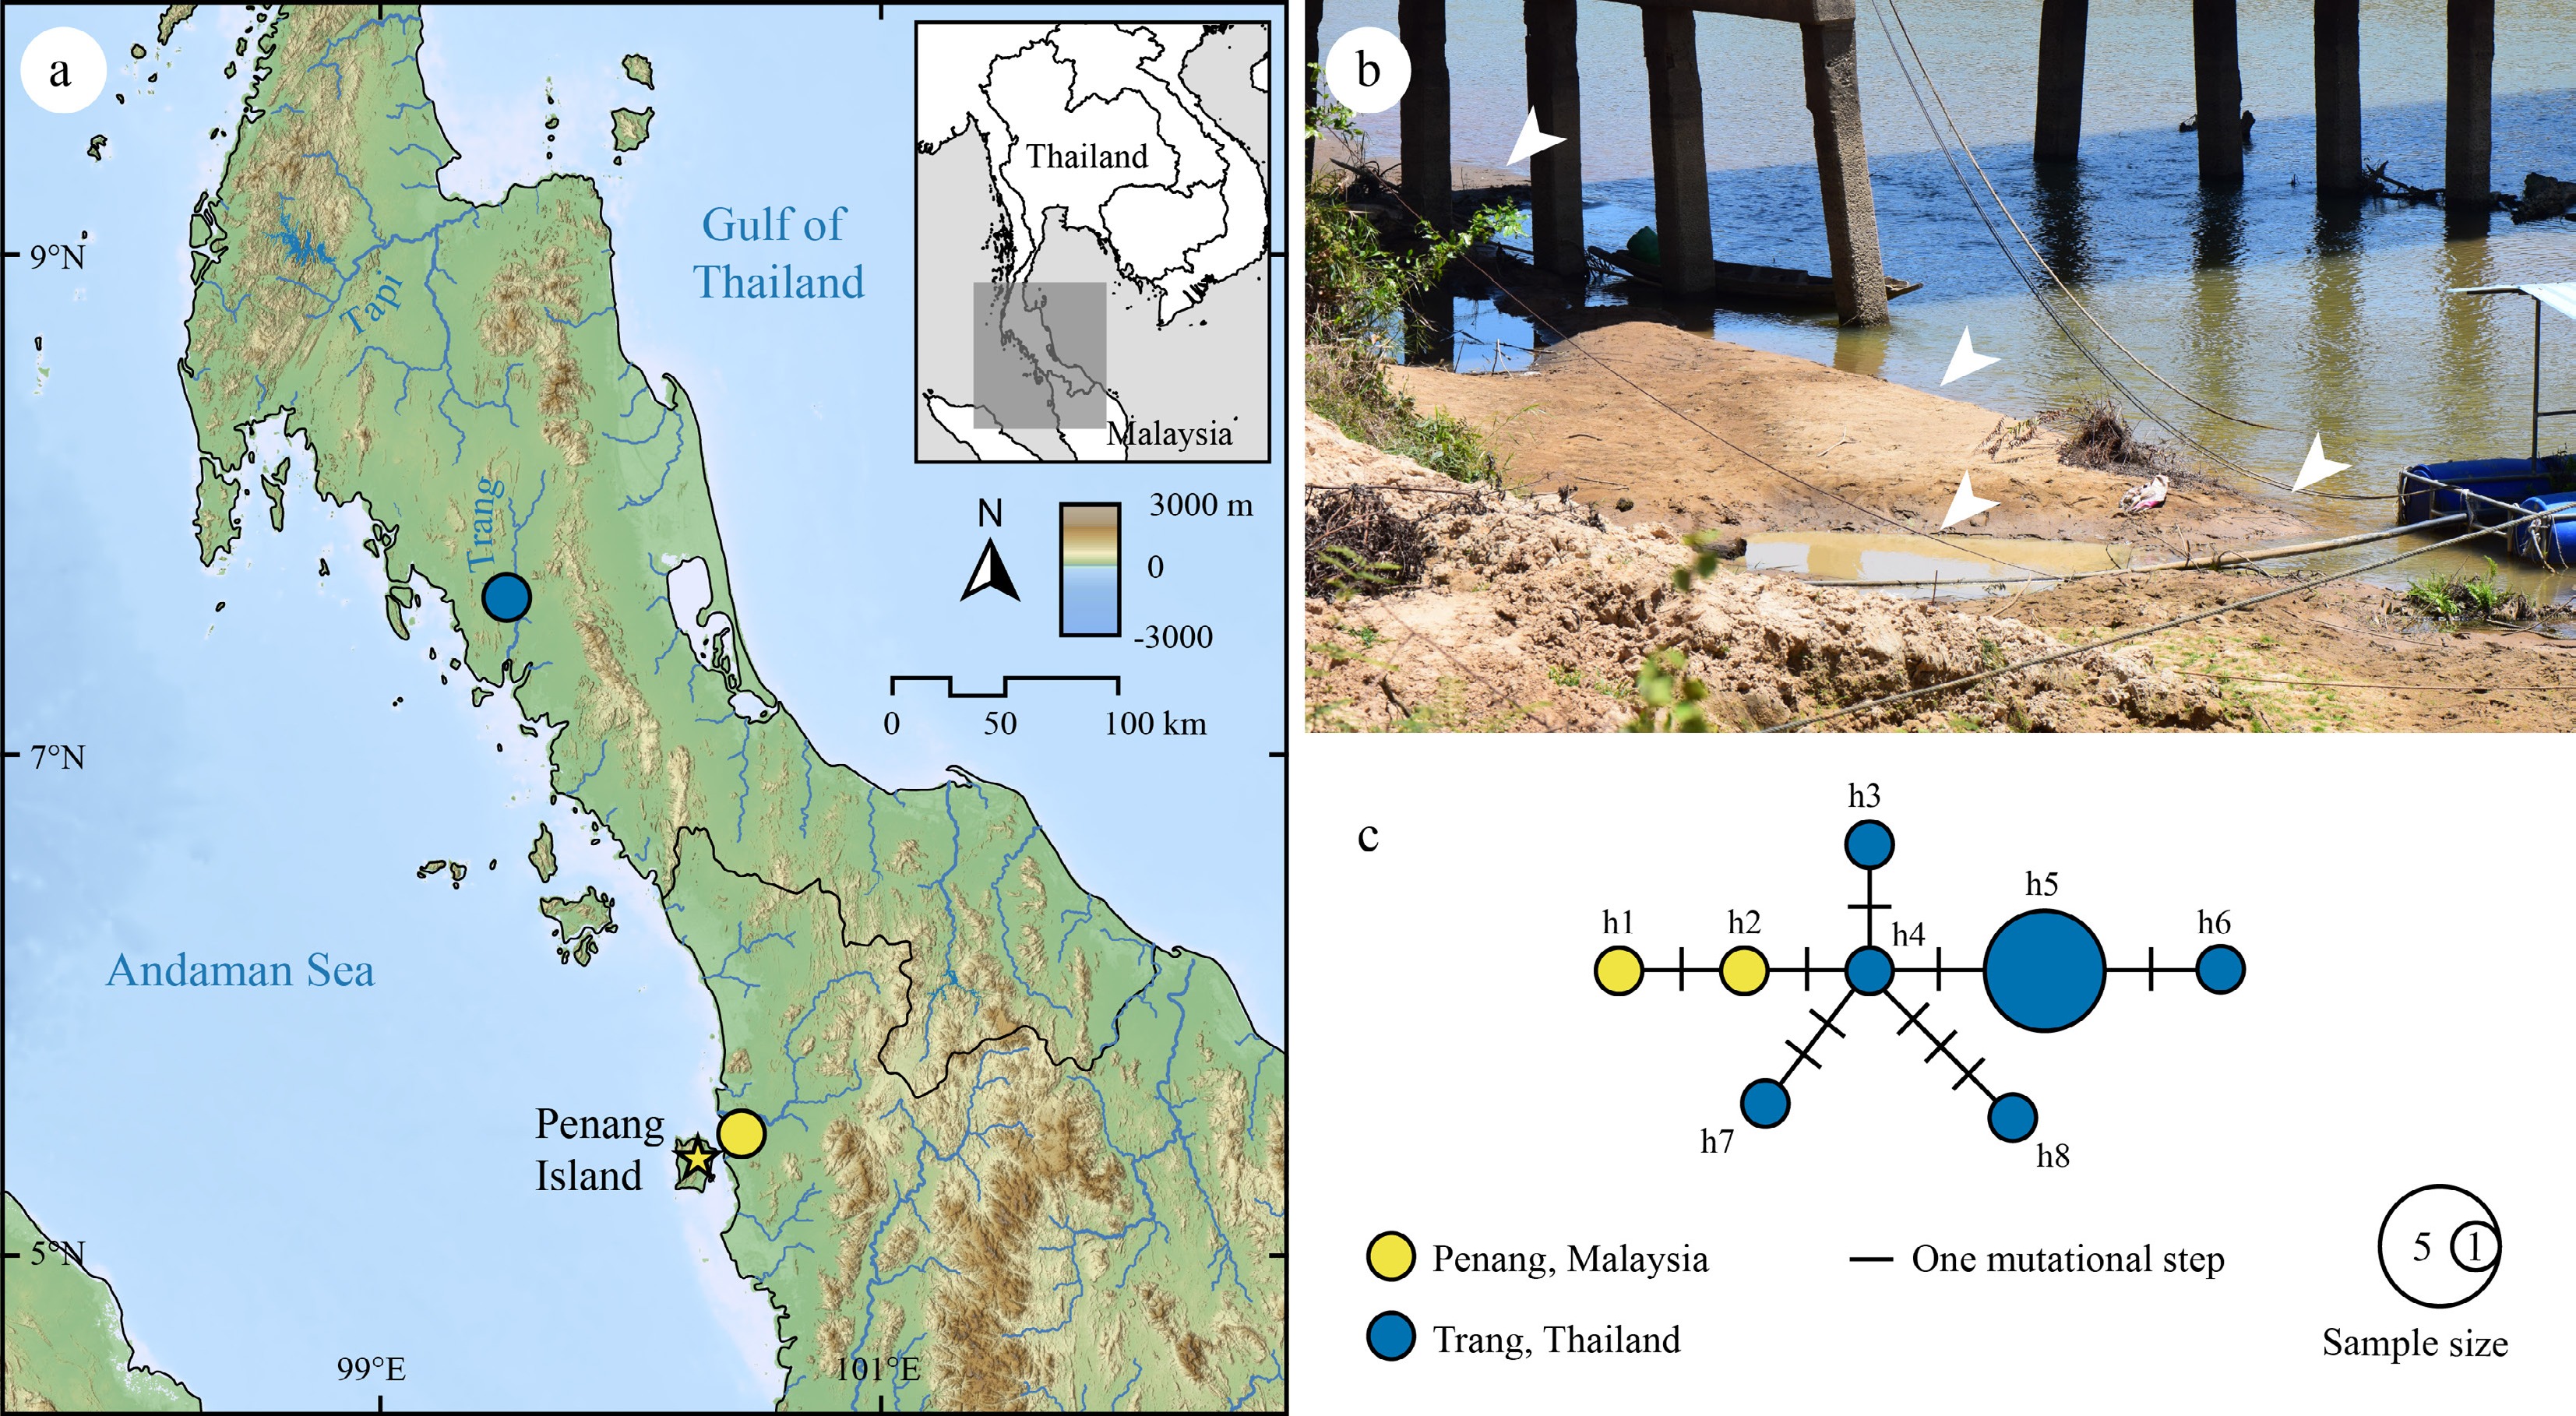
Figure 1.
(a) Map showing sampling sites (circles) and the type locality (yellow star) of Fasciocorbicula regia. The map was created in QGIS v3.36 using river layers derived from the HydroSHEDS dataset (
www.hydrosheds.org ), land topography raster imagery from NASA EARTHDATA (www.earthdata.nasa.gov ), and sea bathymetry data from GEBCO's global gridded bathymetric data (https://download.gebco.net ). (b) Habitat at Trang River, Thailand (7°36'42.2" N 99°31'05.5" E); white arrowheads indicate areas where F. regia individuals were observed or collected. (c) Median-joining network generated from a 663-bp sequence of the COI gene. Each circle represents a unique haplotype, with the size proportional to the number of individuals sharing that haplotype. Colors indicate the sampling sites (Penang, Malaysia in yellow and Trang, Thailand in blue). Lines connecting the haplotypes represent mutational steps, with each hash mark signifying a single mutation. -
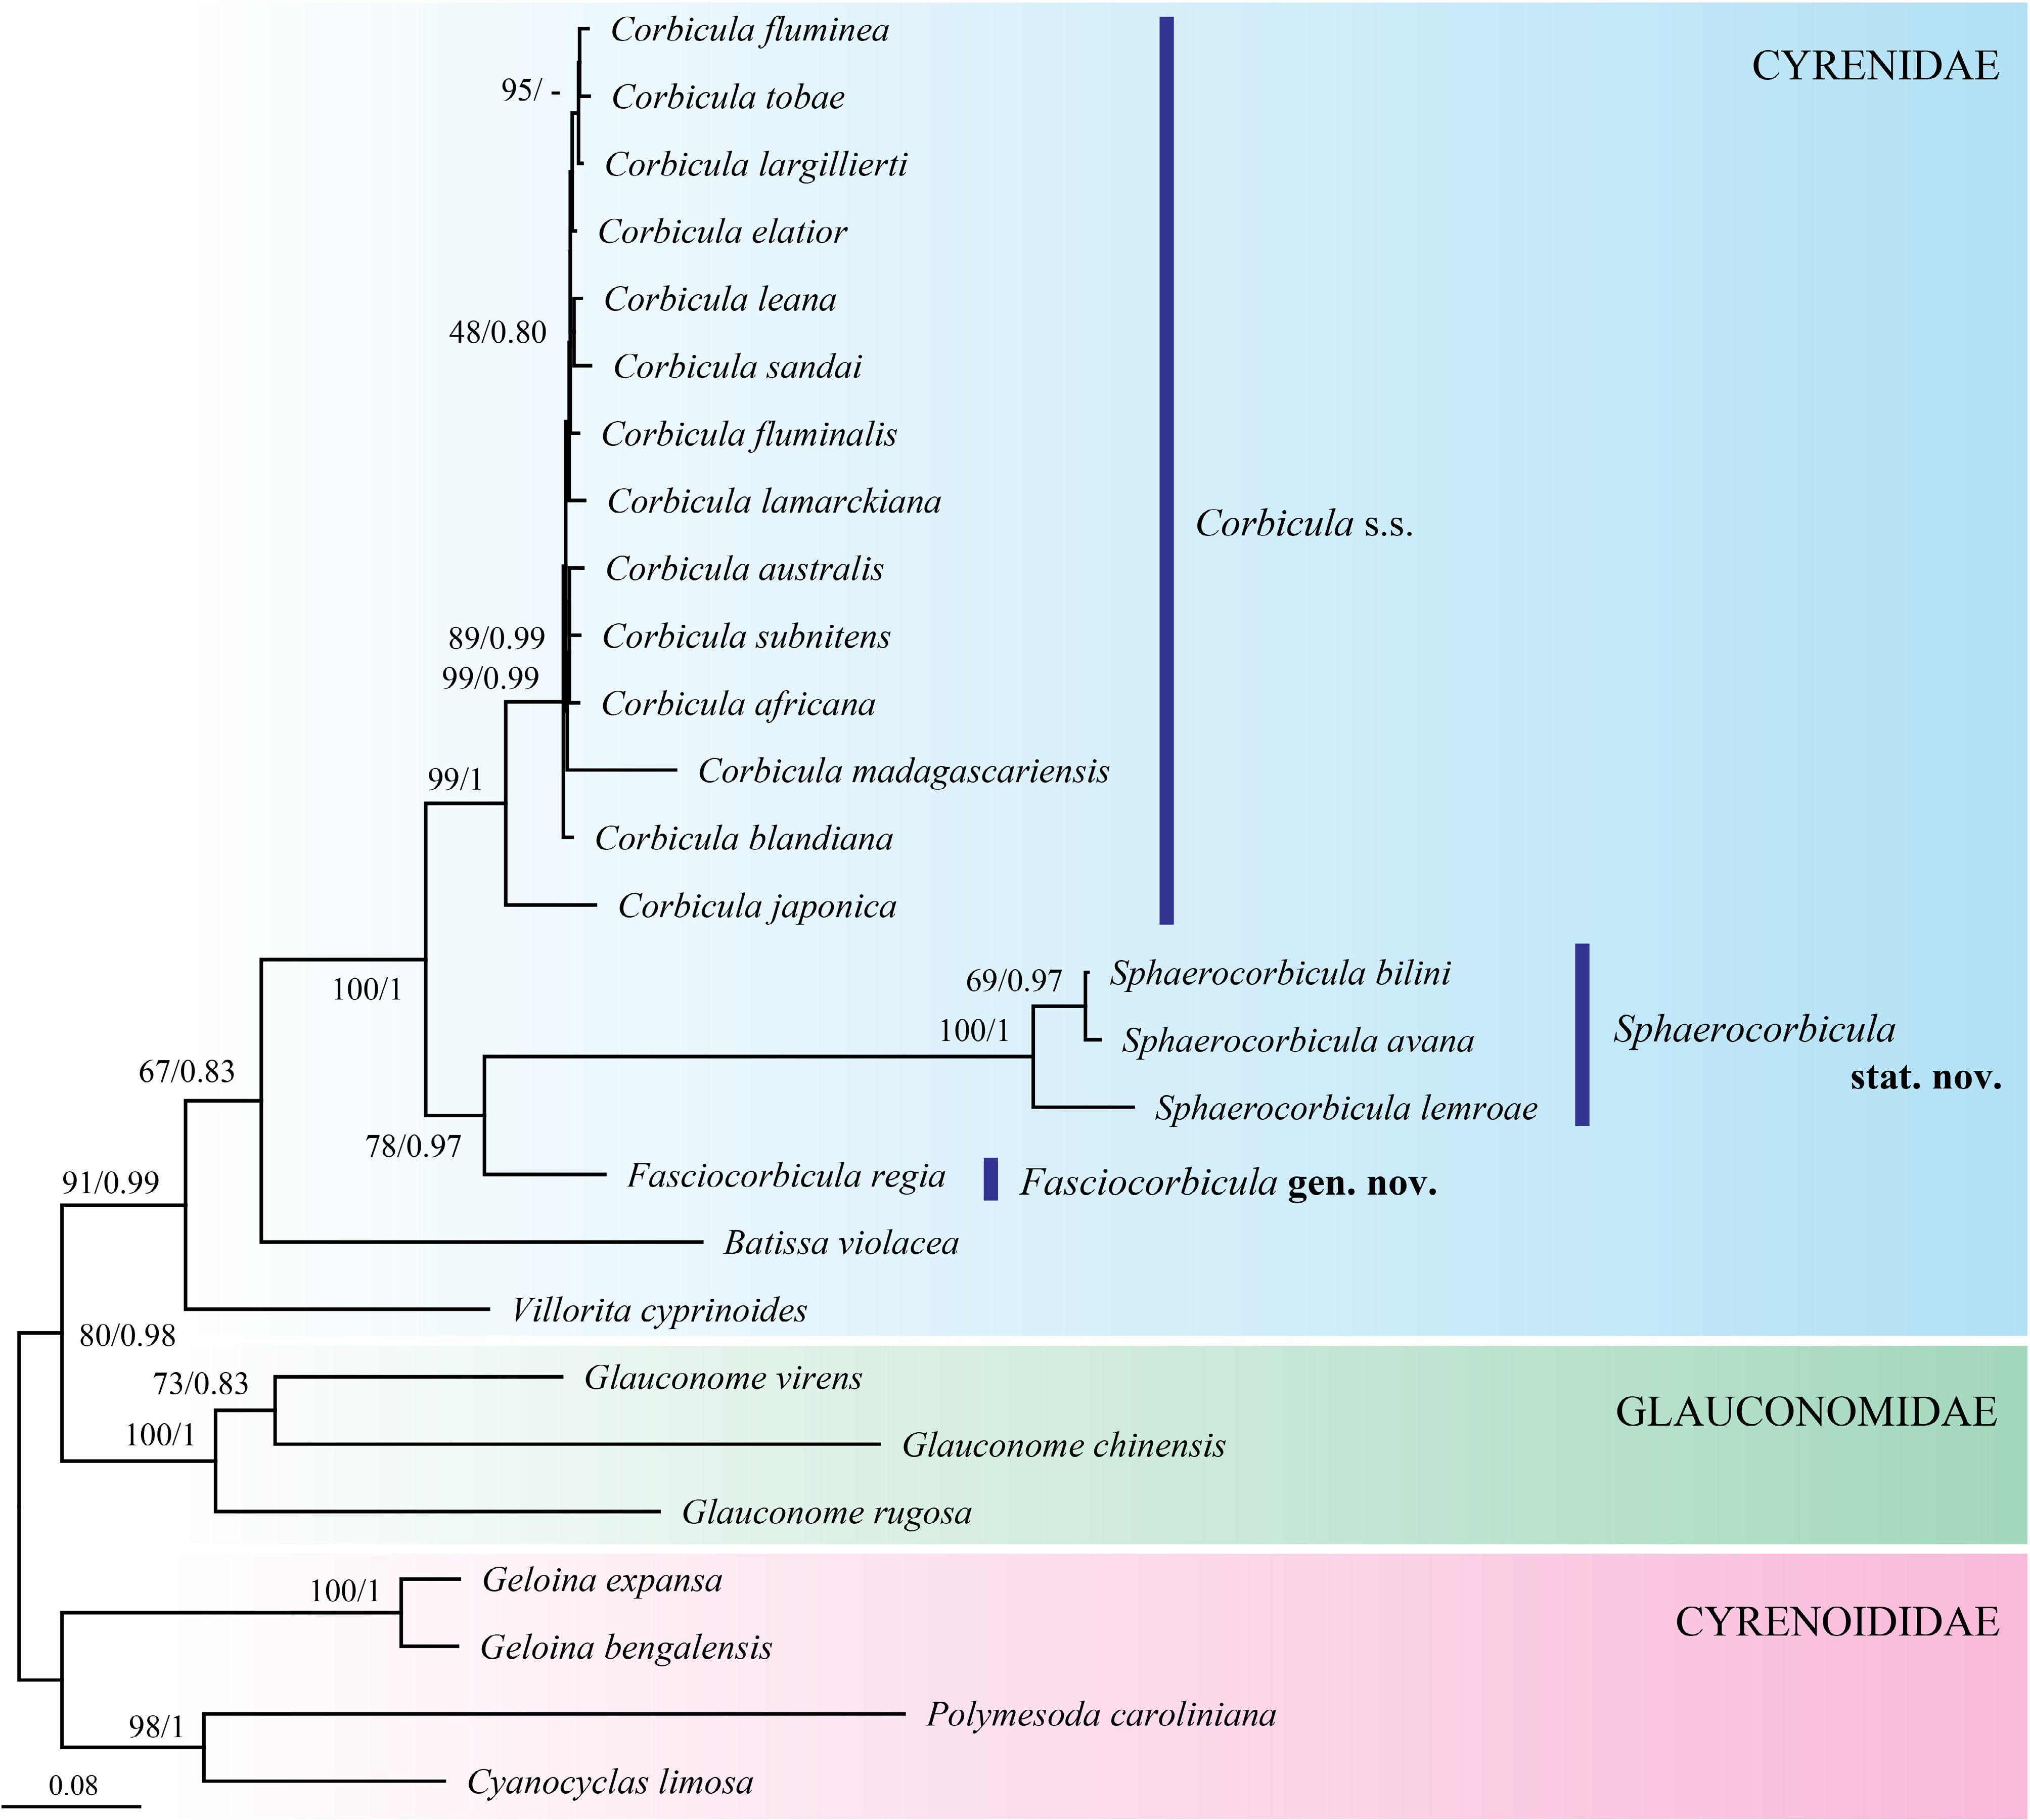
Figure 2.
Maximum likelihood (ML) phylogenetic tree constructed using a 1,980-bp multi-locus alignment of mitochondrial (COI and 16S rRNA) and nuclear (28S rRNA) sequences. Node support is indicated by ML bootstrap values (BS) and Bayesian posterior probabilities (BPP), formatted as ML/BI. Branch lengths are proportional to the scale bar provided.
-
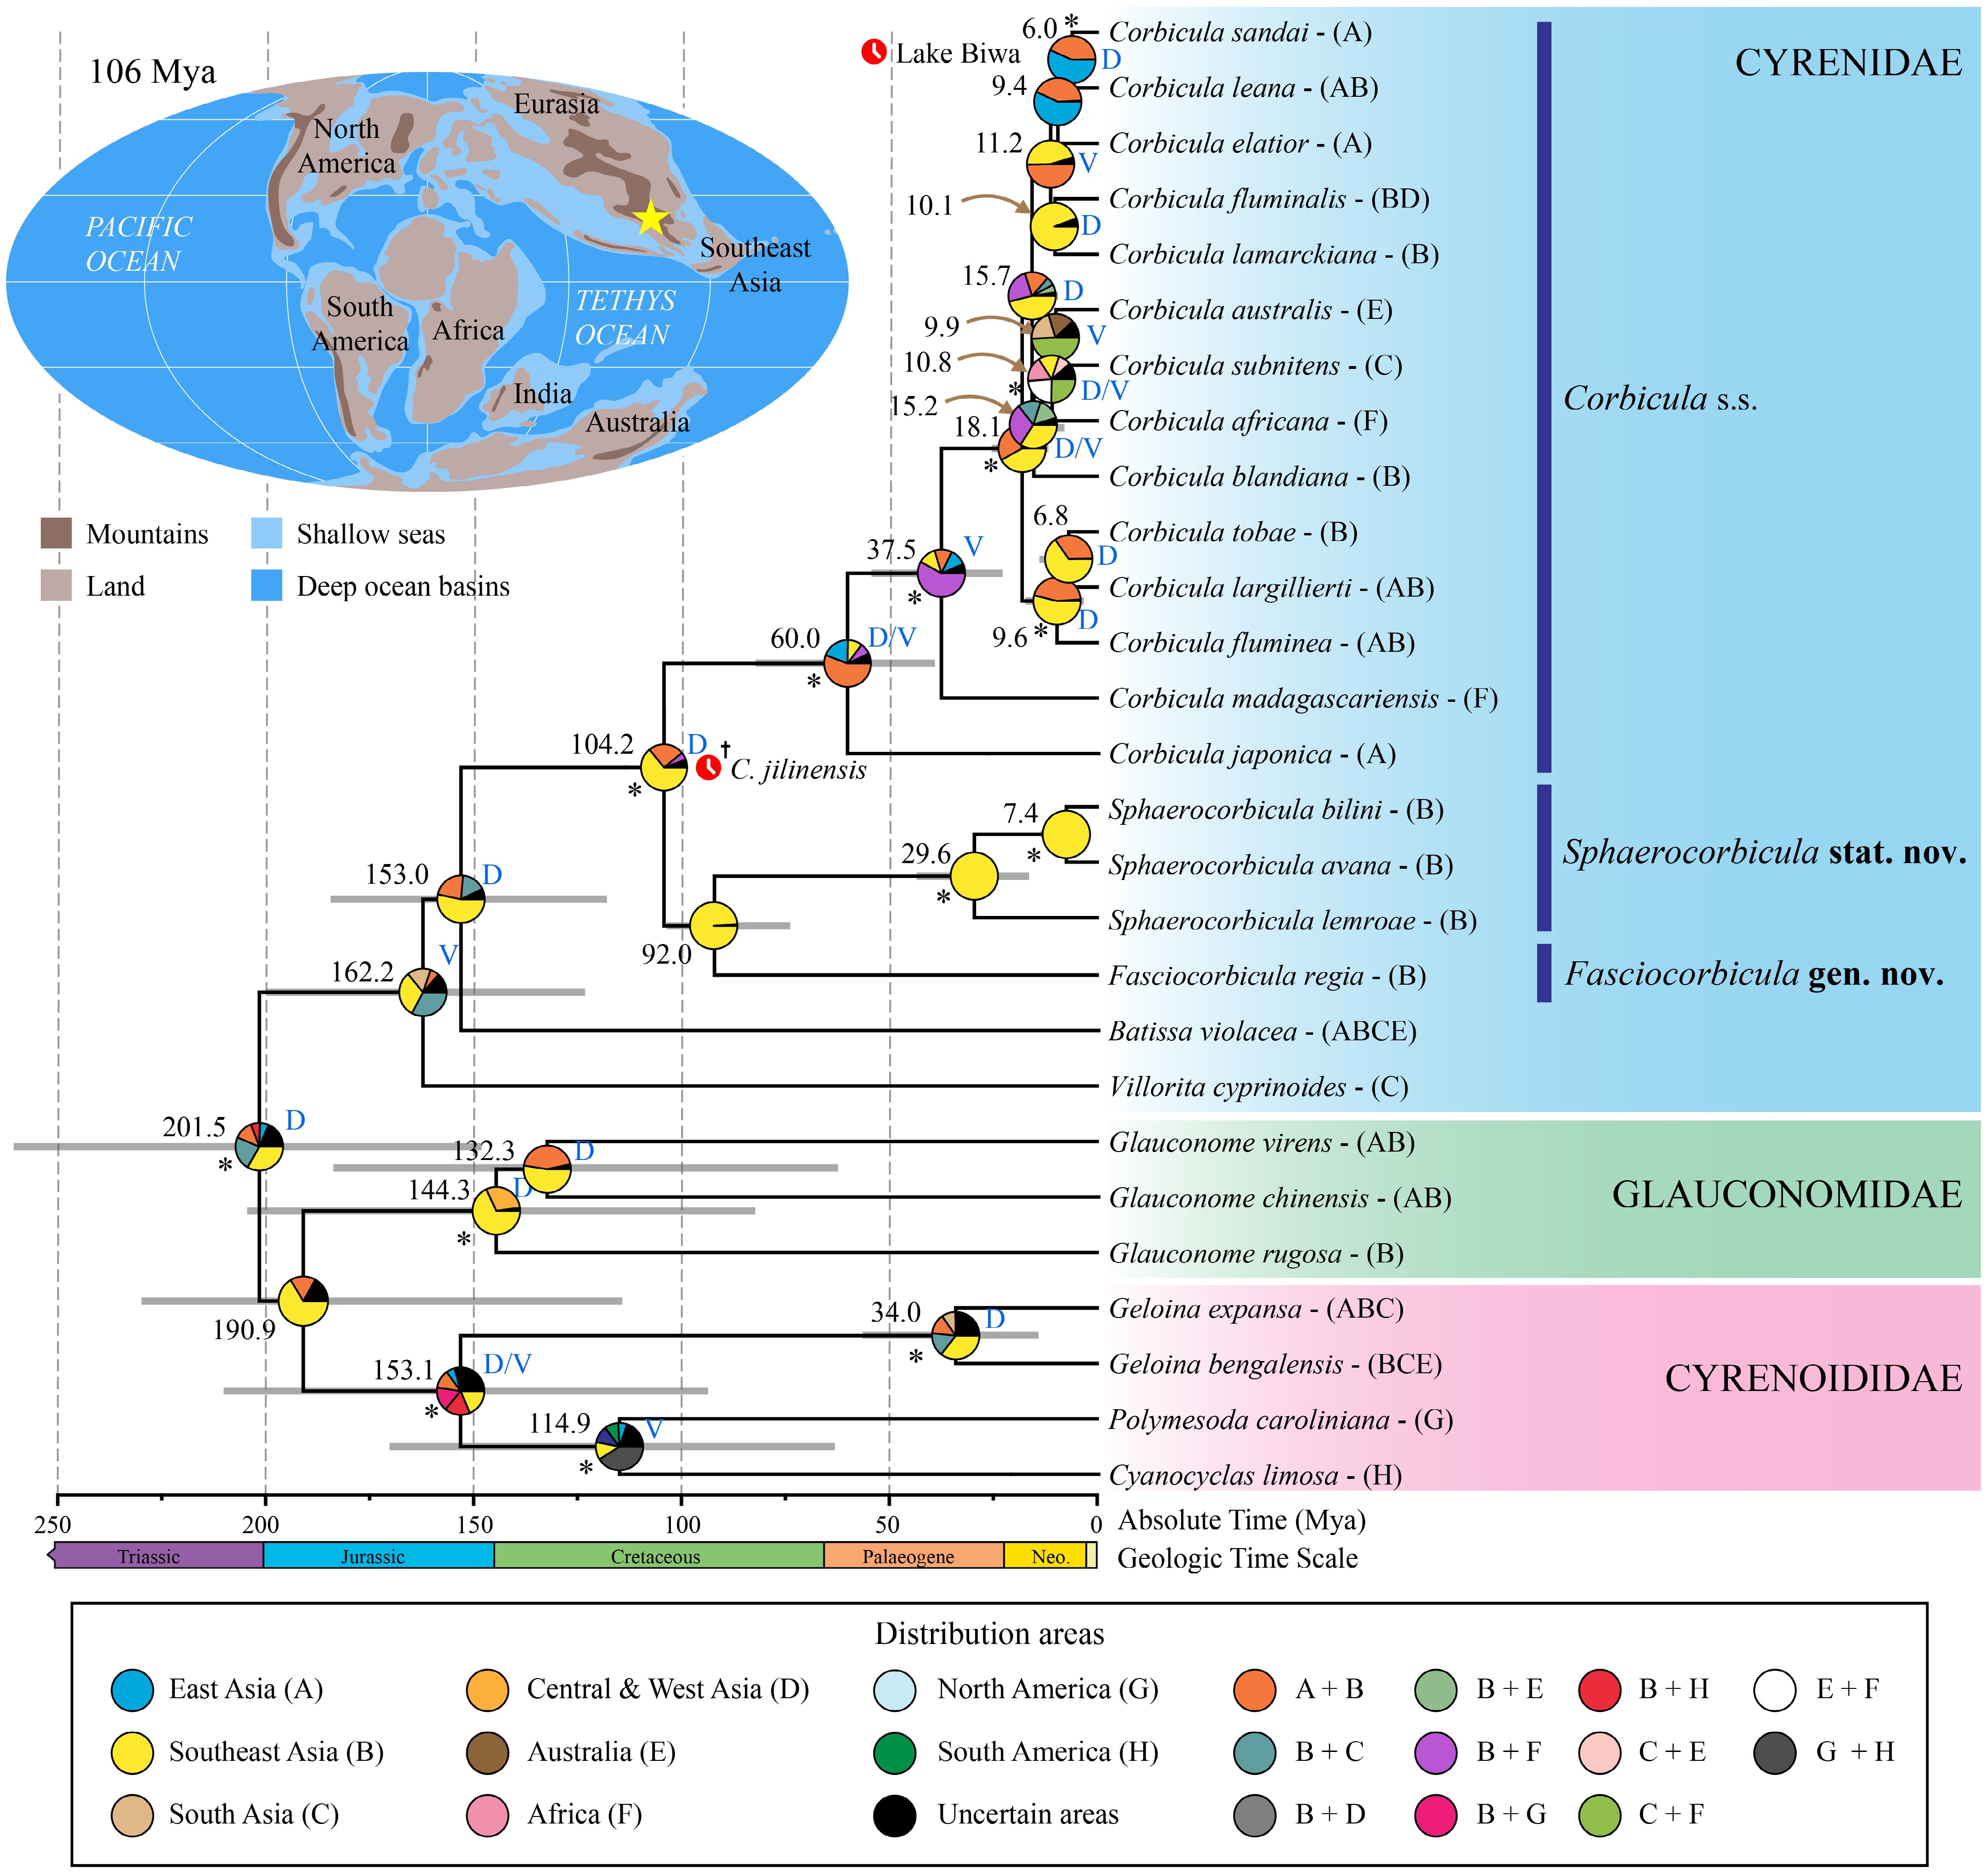
Figure 3.
Estimated divergence time and ancestral area reconstruction results. The phylogeny was generated in BEAST v2.7.8 using a concatenated dataset of mitochondrial (COI and 16S rRNA) and nuclear (28S rRNA) sequences. Significantly supported nodes (BPP ≥ 0.95) are indicated by asterisks*. Values above branches represent the estimated time since the most recent common ancestor (tMRCA) in Mya. Grey bars at nodes indicate the 95% highest posterior density (HPD) intervals for node ages. Pie charts at the internal nodes represent the marginal probabilities of ancestral area reconstructions. Blue letters adjacent to nodes indicate inferred biogeographic events: dispersal (D) and vicariance (V). Calibration points are indicated with red clock symbols. Native distributions of the examined taxa are shown in parentheses following the taxon names. The paleogeographic map (upper left) illustrates the hypothetical landmass during the Early Cretaceous (~106 Ma), with a yellow star indicating the hypothesized center of origin of the common ancestor of Corbicula s.s. + Sphaerocorbicula + Fasciocorbicula. The map was redrawn from Scotese[50].
-
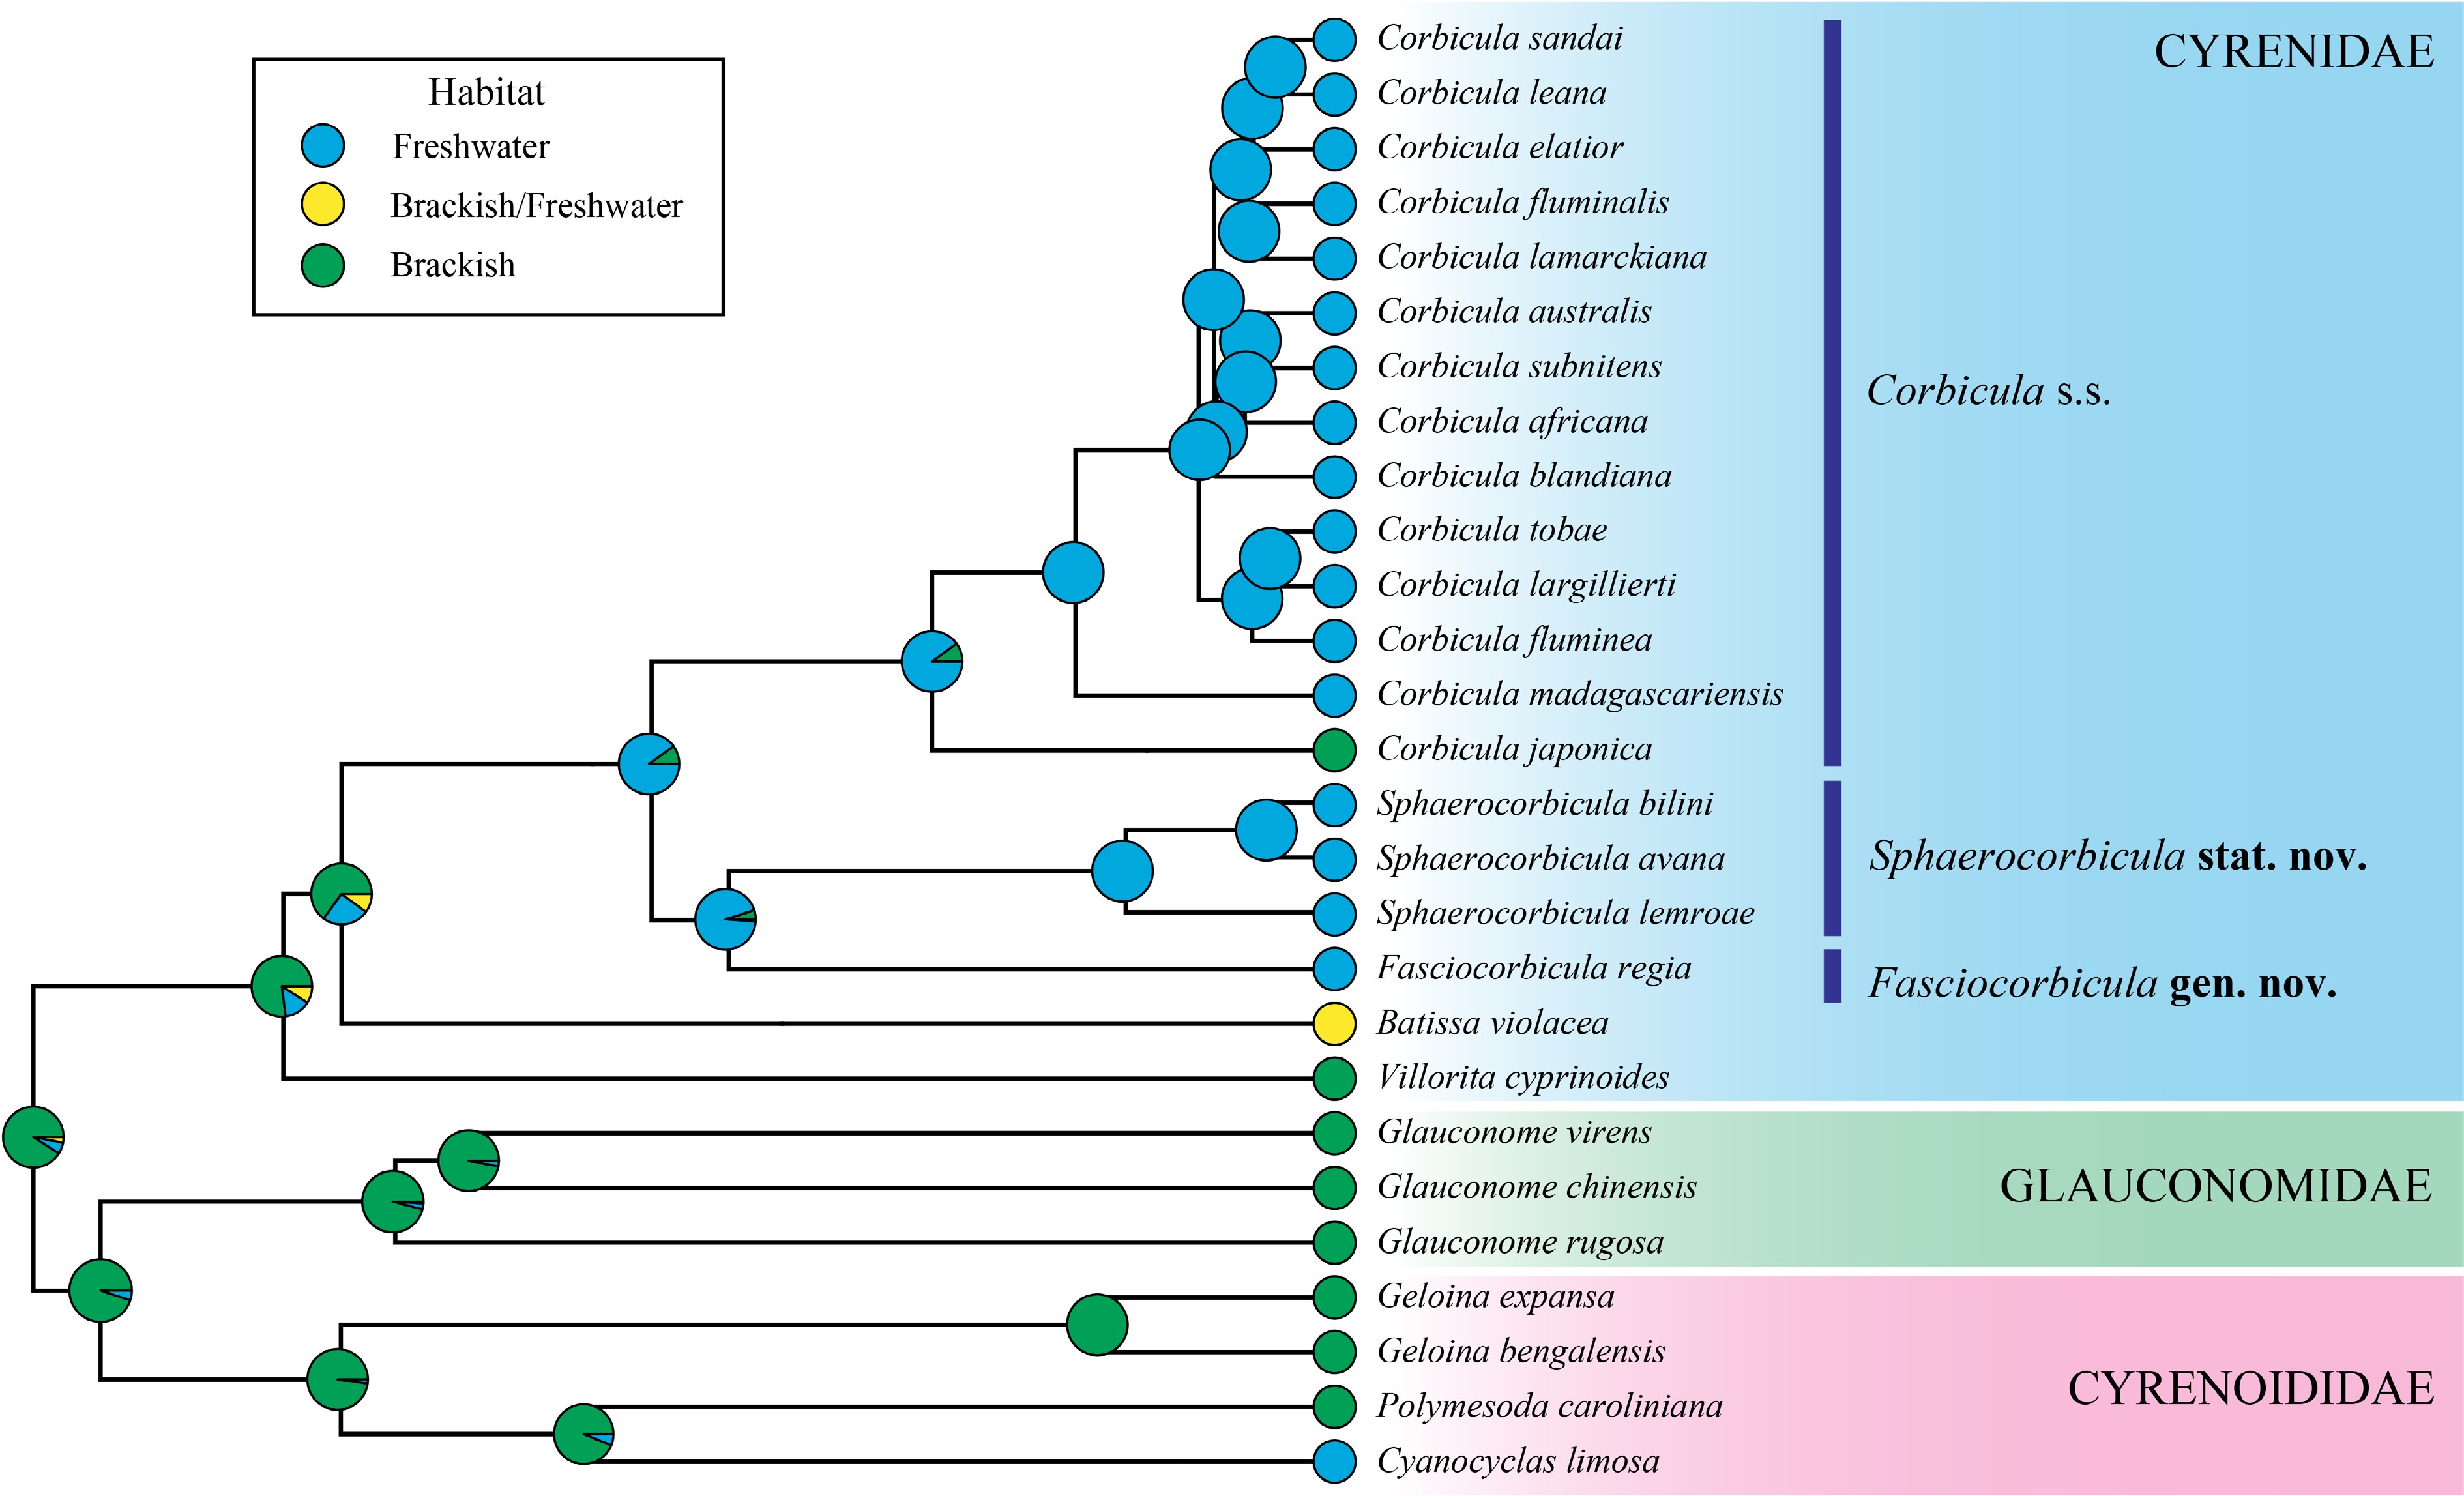
Figure 4.
Ancestral state reconstruction of habitat types mapped onto the Maximum Clade Credibility (MCC) tree derived from BEAST analysis. Pie charts at internal nodes indicate the marginal posterior probabilities for each ancestral state (blue for freshwater, green for brackish, and yellow for a wide distribution range covering both freshwater and brackish water). Observed states for extant taxa are shown at the tips.
-
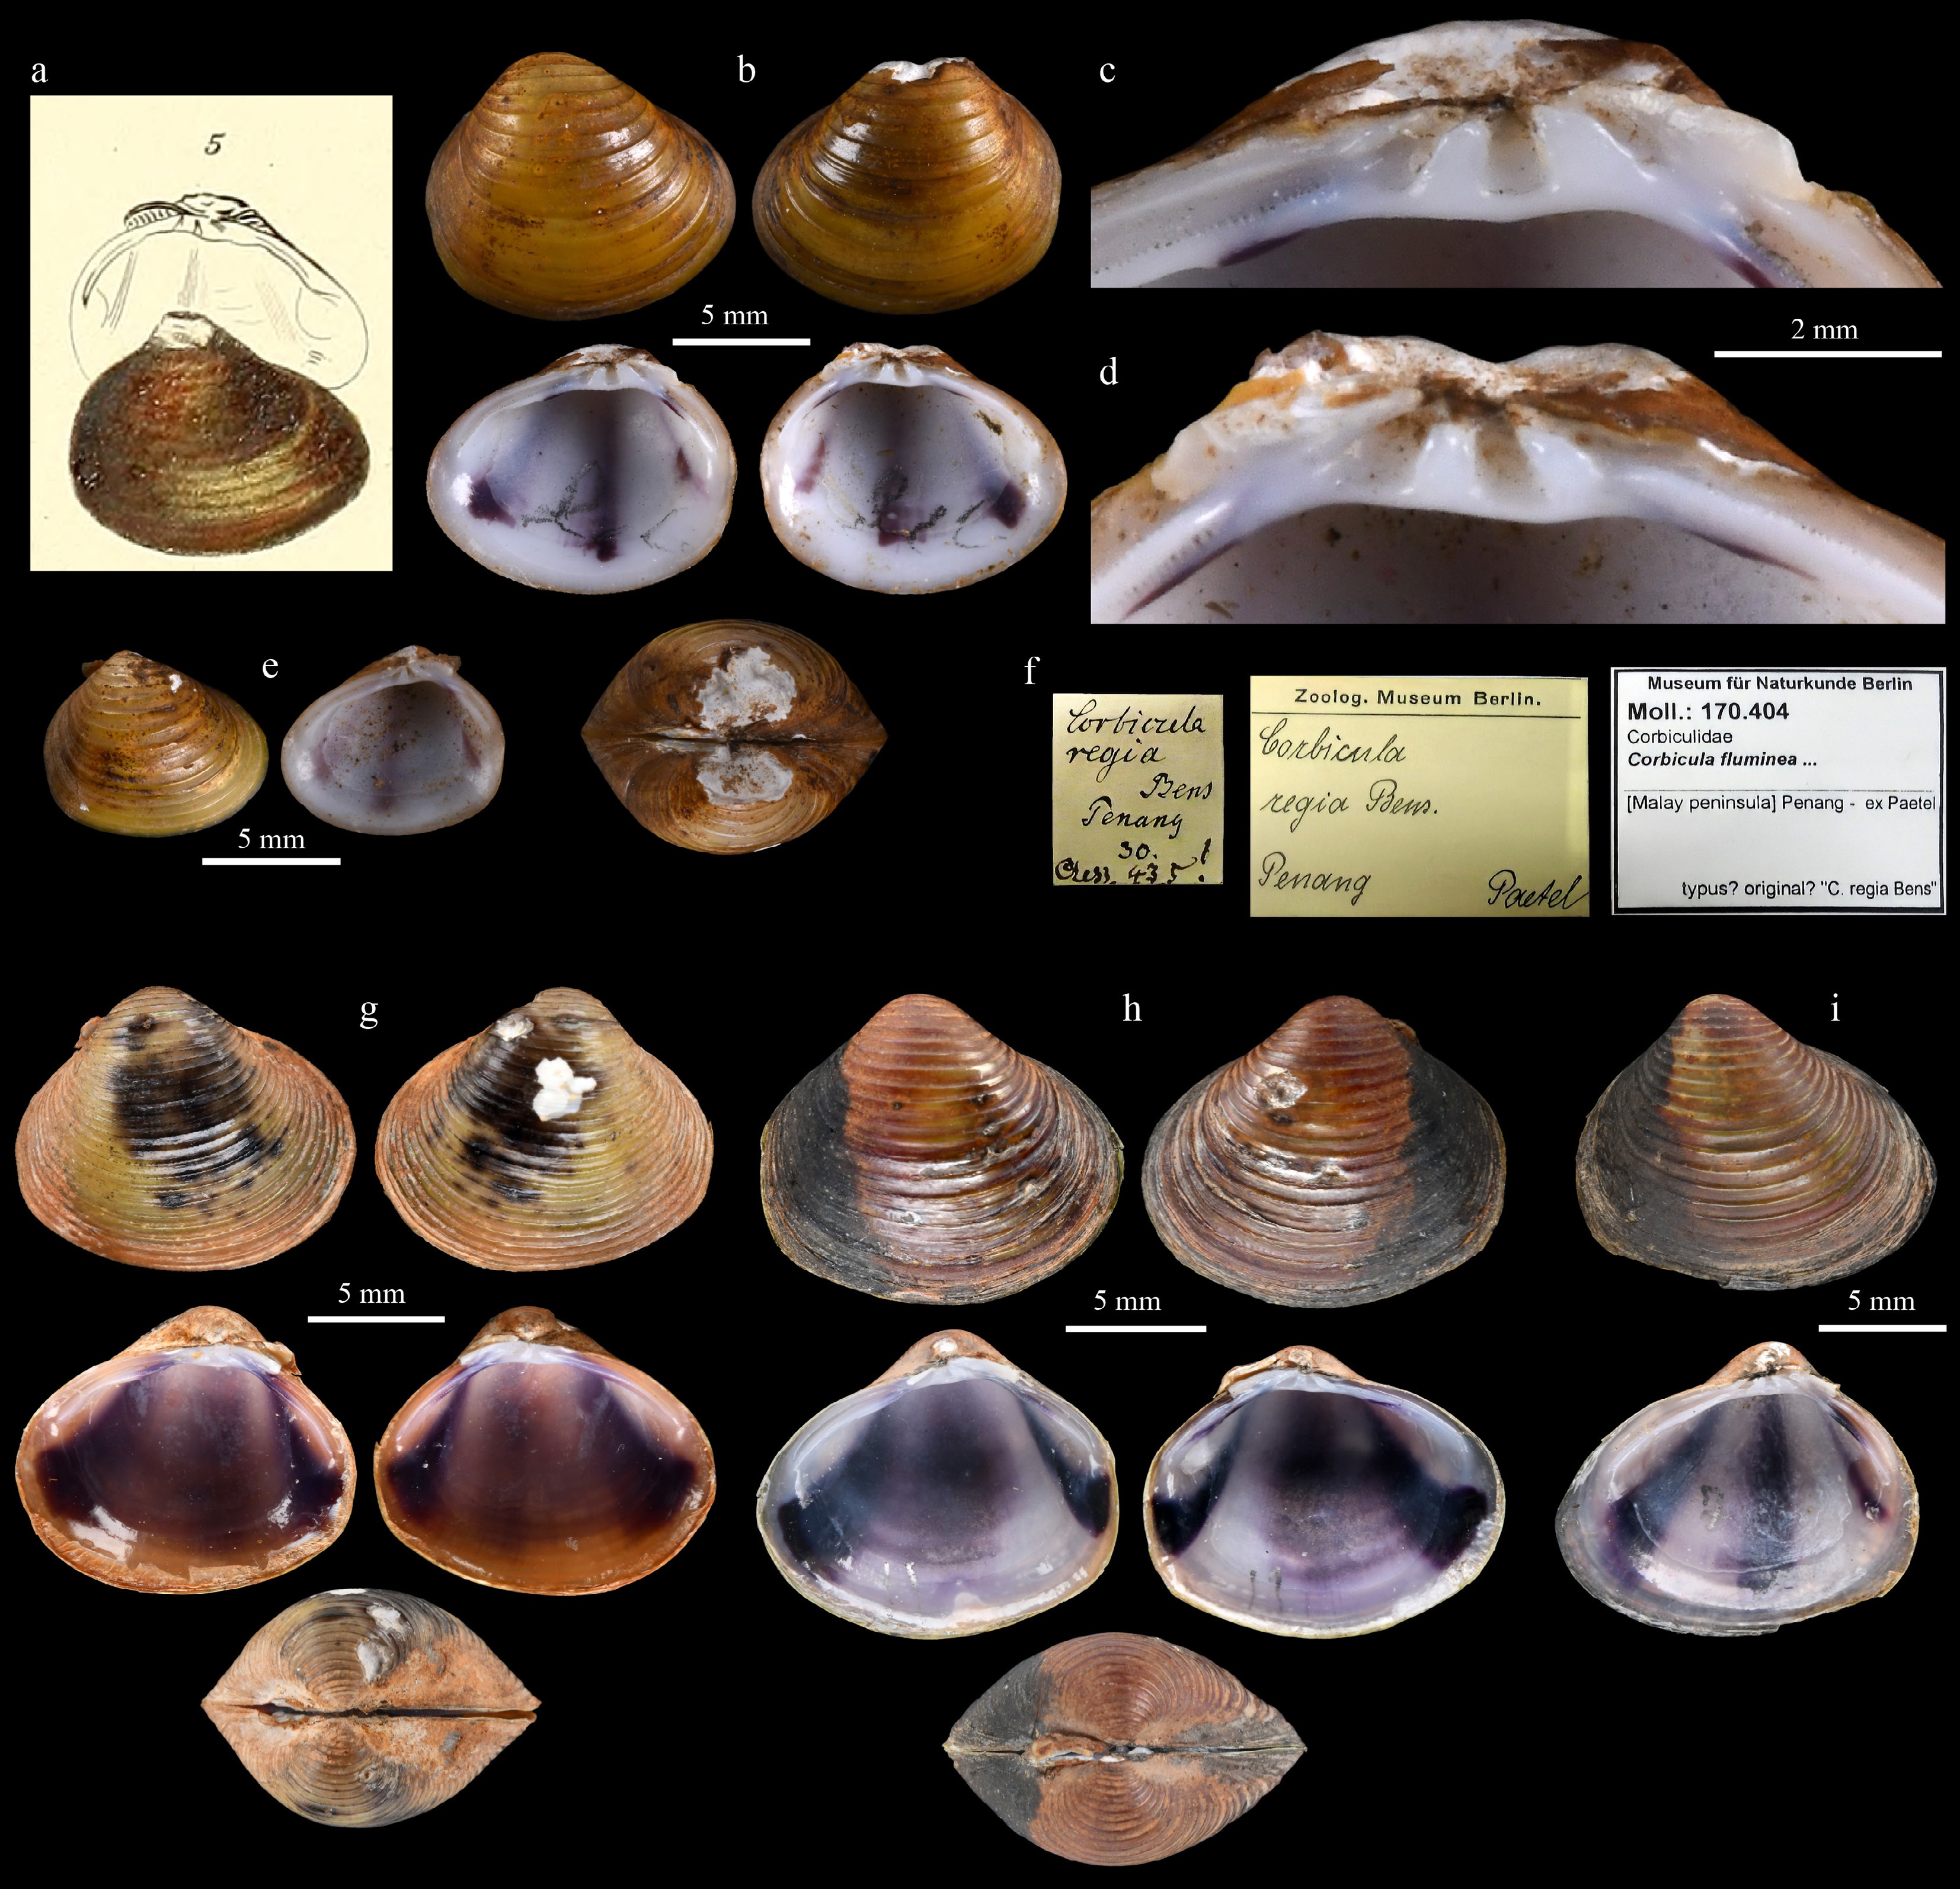
Figure 5.
Fasciocorbicula regia. (a) Original figure by Clessin (1879: pl. 43, fig 5[22]); (b) lectotype ZMB 170.404a from Penang, Malaysia; (c) hinge dentition of the right valve, and (d) left valve of the lectotype; (e) paralectotype ZMB 170.404b, right valve; (f) label of the type material; (g) topotype specimen MUMNH-COR0274-2 from Penang, Malaysia; (h) specimen MUMNH-COR0275-11 from Trang River, Thailand; (i) specimen MUMNH-COR0275-7, right valve, from Trang River, Thailand. Photo Credit: (a) Image digitized by the Biodiversity Heritage Library (Public domain;
www.biodiversitylibrary.org/page/34337663 ), (b)–(i) C. Sutcharit. -
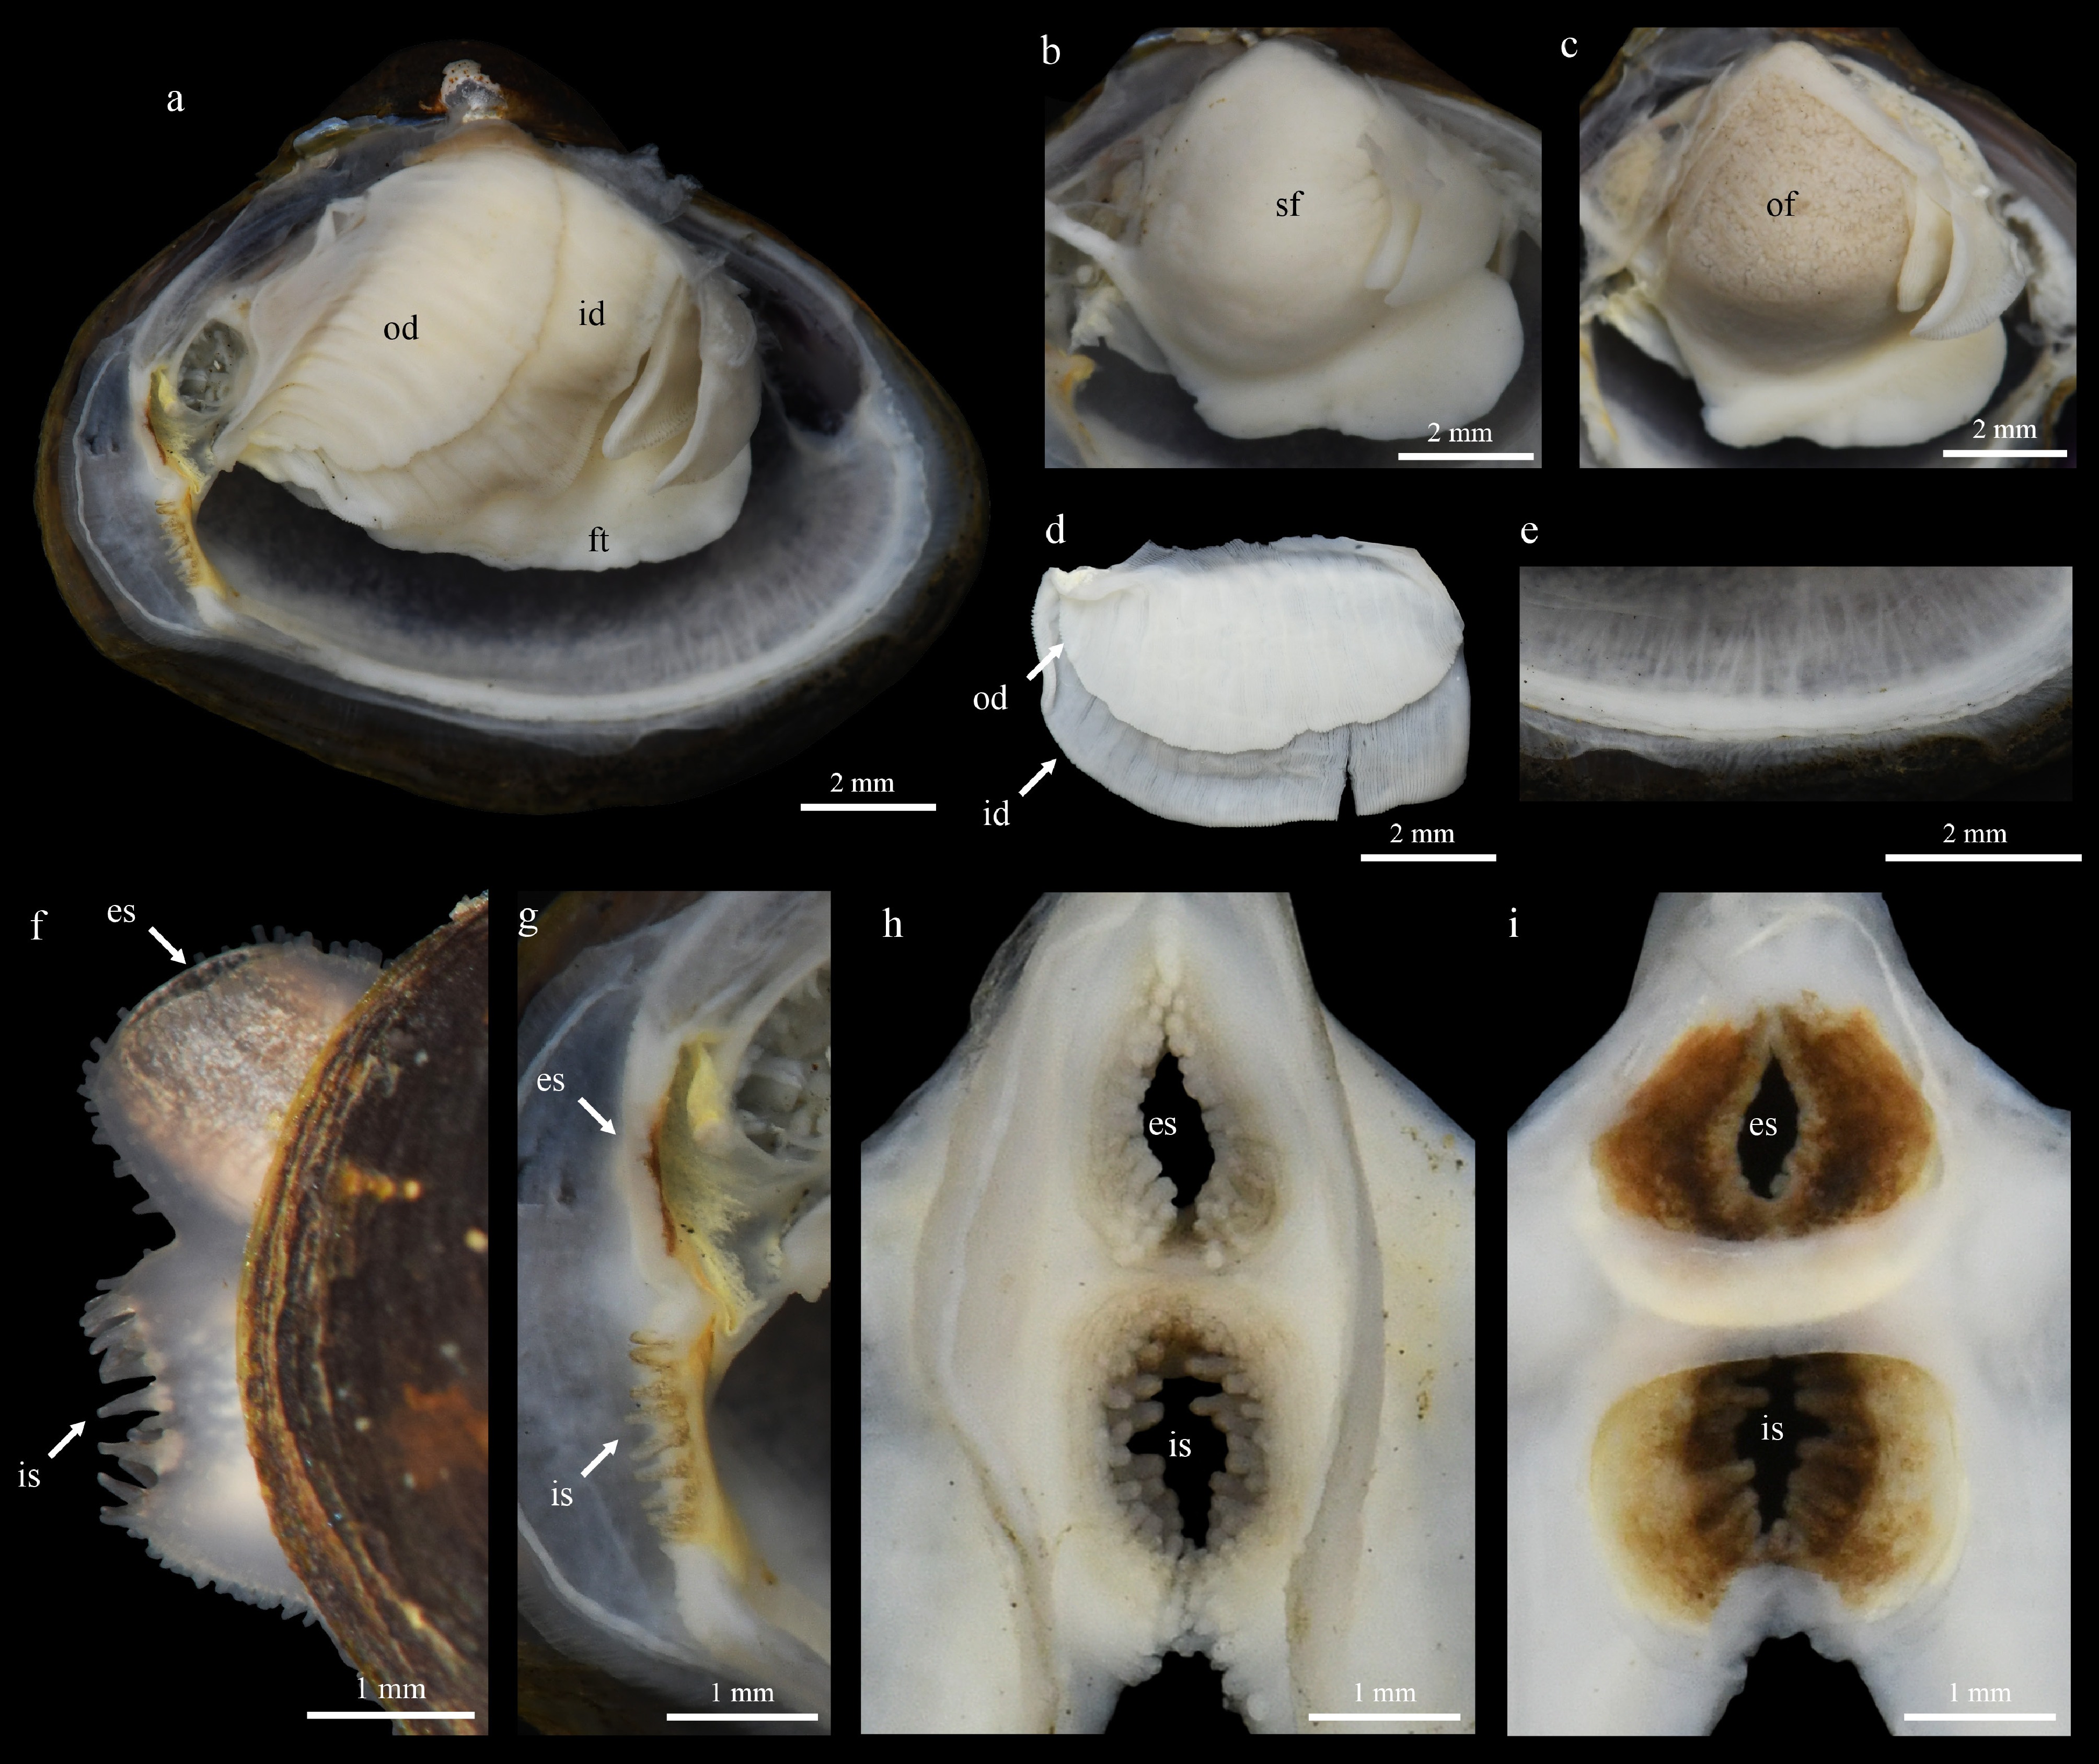
Figure 6.
Anatomy of Fasciocorbicula regia from Trang River, Thailand. (a) Anatomy of the soft body, with right mantle lobe removed; anatomy of (b) male and (c) female showing fully developed gonadal follicles, right mantle lobe and right gills removed; (d) right gills; (e) outgrowths on the mantle edge; (f) lateral view of extruded siphons in living specimen; (g) anatomy of siphons in preserved specimens, with the right part of the siphons removed; (h) outer and (i) inner views of the siphons. Photographs by A. Pholyotha. Abbreviations: es, exhalant siphon; ft, foot; id, inner demibranch; is, inhalant siphon; od, outer demibranch; of, oogenic follicles; sf, spermatogenic follicles.
-
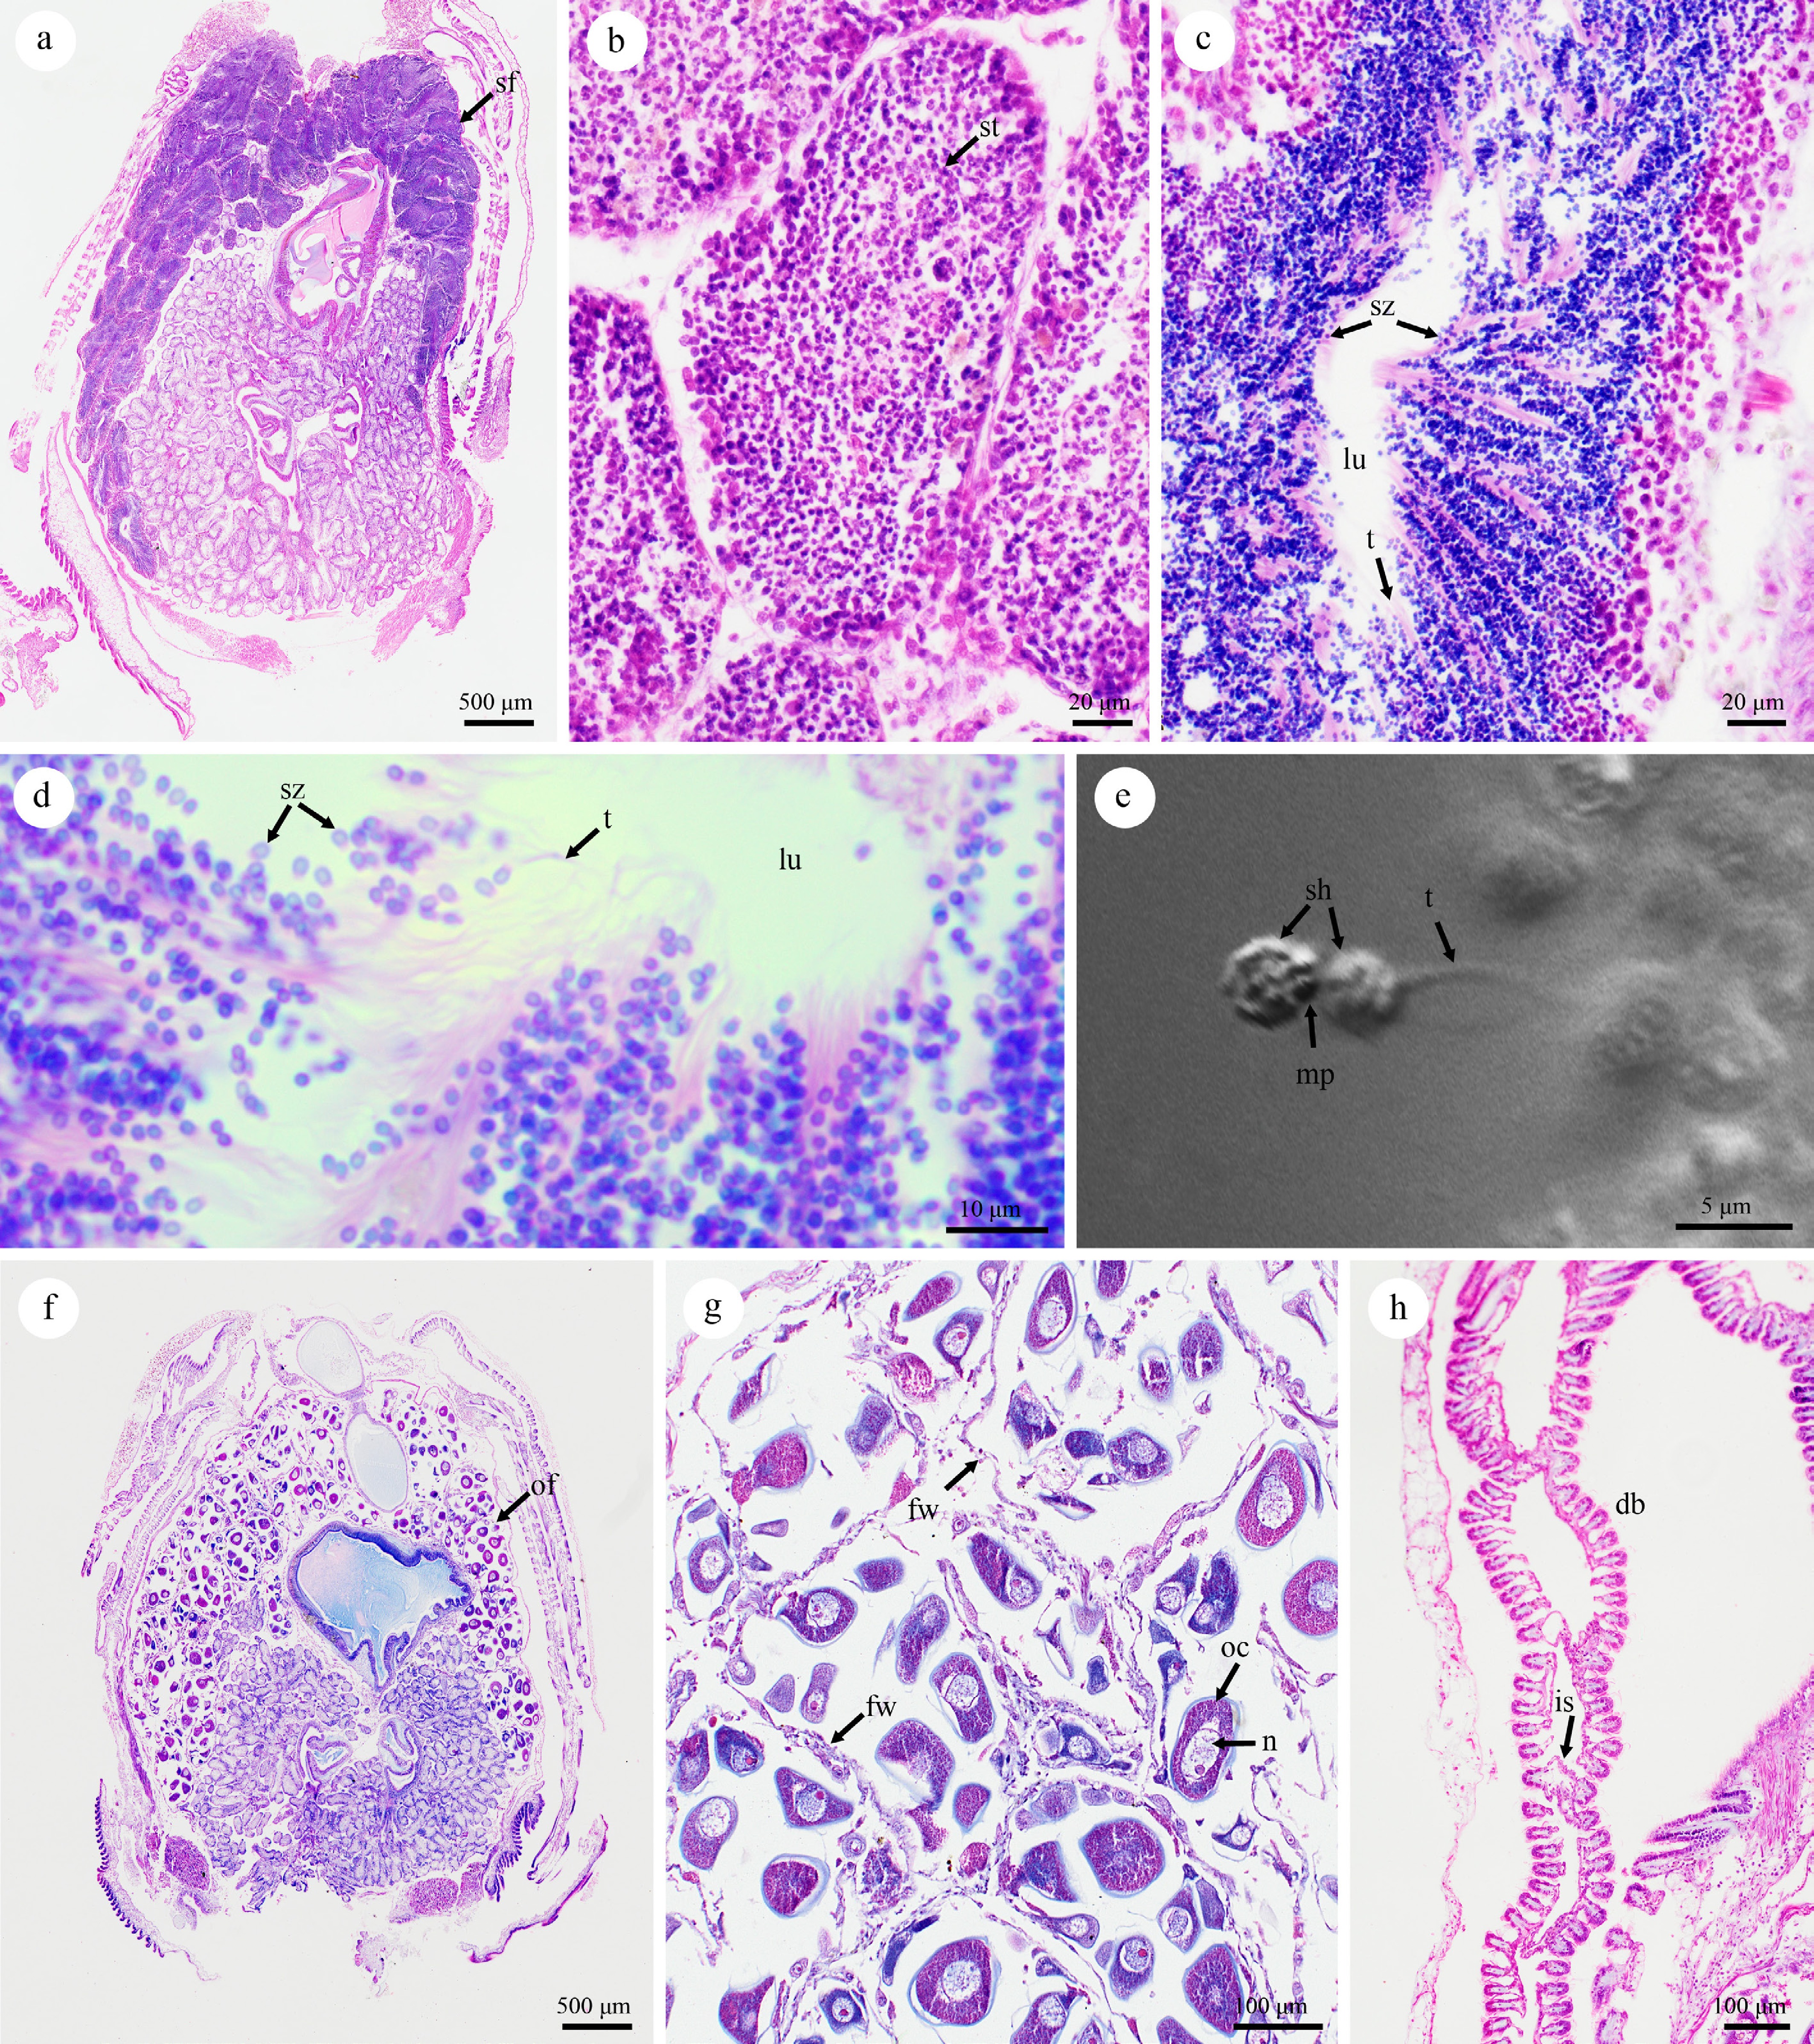
Figure 7.
Histological thin sections of Fasciocorbicula regia stained with Hematoxylin–Eosin showing gonadal developmental stages and related organs in (a)–(d) males, (f)–(h) females, and (e) sperm morphology examined by inverted confocal laser scanning microscopy; (a) general aspect of the male visceral mass showing spermatogenic follicles in various stages; (b) spermatogenic follicles in the early growing stage; (c) maturing stage showing fully developed spermatozoa; (d) aggregations of spermatozoa in the center of the follicle lumen; (e) detail of sperm morphology showing the head and monoflagellated tail; (f) general aspect of the female visceral mass showing a mature gonad containing mature oogenic follicles in a late developmental stage; (g) mature oogenic follicles, partially spawned; (h) section of the inner demibranch. Abbreviations: db, demibranch; fw, follicle wall; is, interlamellar septa; lu, lumen; mp, midpiece; n, nucleus; oc, oocytes; of, oogenic follicle; sf, spermatogenic follicle; sz, spermatozoa; sh, spermatozoa head; t, spermatozoa tail.
-
Genera 1 2 3 4 5 1. Corbicula s.s. 4.13 2. Sphaerocorbicula stat. nov. 11.87 7.48 3. Fasciocorbicula gen. nov. 11.85 11.44 n/a 4. Batissa 17.12 15.77 16.33 n/a 5. Villorita 16.71 16.08 15.58 16.88 n/a Table 1.
Average genetic divergence (%) based on uncorrected p-distances of a 539-bp COI gene fragment among genera within the family Cyrenidae, and average interspecific divergence among species within each genus (in bold).
-
Genera Fixed nucleotide differences* Corbicula s.s. 2G, 8T, 15A, 24A, 86A Sphaerocorbicula stat. nov. 164T Fasciocorbicula gen. nov. 77G, 122G, 128G, 134A, 185G, 293A, 404A, 503A, 551A Batissa 36C, 38T, 49G, 59T, 68T, 81G, 92G, 134G, 215G, 216T, 217C, 218T, 201A, 273G, 274C, 275T, 276T, 368G, 383T, 392A, 461G, 474A, 530T, 531C Villorita 47A, 68G, 81C, 93G, 95T, 98C, 128A, 131A, 252A, 256A, 278G, 371A, 404G, 459C, 470A, 507G, 520C, 524G, 543G *Nucleotide position based on the sequence alignment in this study. Table 2.
Fixed nucleotide differences of COI sequences for genus-level diagnosis.
Figures
(7)
Tables
(2)